Embed Size (px)
Citation preview

IU QuakeSim Annual Report Slides

IU People• Geoffrey Fox and Marlon Pierce are Co-PIs at IU.• Xiaoming Gao: graduate student, developer of the RDAHMM-related
Web interfaces and services.• Jun Ji: hourly staff, developer of deformation analysis (Disloc, Simplex,
Geofest) Web interfaces and support.– Ji completed his M.S. in May 2010 and worked on the project through OPT
until December 1, 2010 • Jun Wang: full time staff, working on visualization services, GIS, and E-
DECIDER related deliverables. • Yu Ma: full time staff, developing deformation and time-series user
interfaces and providing infrastructure support• Josh Rosen: full time staff, developed the RDAHMM GPS flash viewer.
– Josh worked part time to upgrade the viewer.

Publications and Presentations• Publications
– Marlon E. Pierce, Xiaoming Gao, Sangmi Lee Pallickara, Zhenhua Guo, Geoffrey Fox: The Quakesim portal and services: new approaches to science gateway development techniques. Concurrency and Computation: Practice and Experience 22(12): 1732-1749 (2010)
– Xiaoming Gao, Yu Ma, Marlon Pierce, Mike Lowe, Geoffrey Fox, “Building a Distributed Block Storage System for Cloud Infrastructure” Proceedings of CloudCom 2010 Conference IUPUI Conference Center Indianapolis November 30-December 3 2010.
– Marlon E. Pierce, Geoffrey C. Fox, Yu Ma, Jun Wang, “Cloud Computing and Spatial Cyberinfrastructure” Technical Report submitted to PNAS special issue on spatial cyberinfrastructure.
– Andrea Donnellan, Marlon Pierce, Dennis McLeod, Jay Parker, John Rundle, Lisa Grant, Rami Al-Ghanmi, Gepffrey Fox, Robert Granat, “Integrating GPS, InSAR, and UAVSAR data into the QuakeSim Computational Environment” 2011 IEEE Aerospace Conference March 5-12, 2011, Big Sky, Montana
• Presentations– Geoffrey Fox, “Cloud Architecture for Earthquake Science” Abstract for 7th ACES International Workshop OTARU, October
3-8, 2010– Donnellan, A., Parker, J., Granat, R., Lyzenga, G., Glasscoe, M., Rundle, J., McLeod, D., Al-Ghanmi, R., Pierce, M., Fox, G. and
Ludwig, L. G., “QuakeSim Earthquake Modeling, Forecasting, and Data Access Tools” Abstract for 7th ACES International Workshop OTARU, October 3-8, 2010
– Gao, X., Granat, R., Pierce, M. and Wang, J., “Building Services and Web Portal for GPS Time Series Data Analysis” Abstract for 7th ACES International Workshop OTARU, October 3-8, 2010
– Pierce, M, Fox, G, Gao, X, Ji, J, Ma, Y, Wang, J, Donnellan, A, Parker, J, Glasscoe, M, Granat, R, Al-Ghanmi, R and McLeod, D, “QuakeSim Science Gateway Updates” Abstract for 7th ACES International Workshop OTARU, October 3-8, 2010
• [Does not include AGU abstracts. Others should have these]
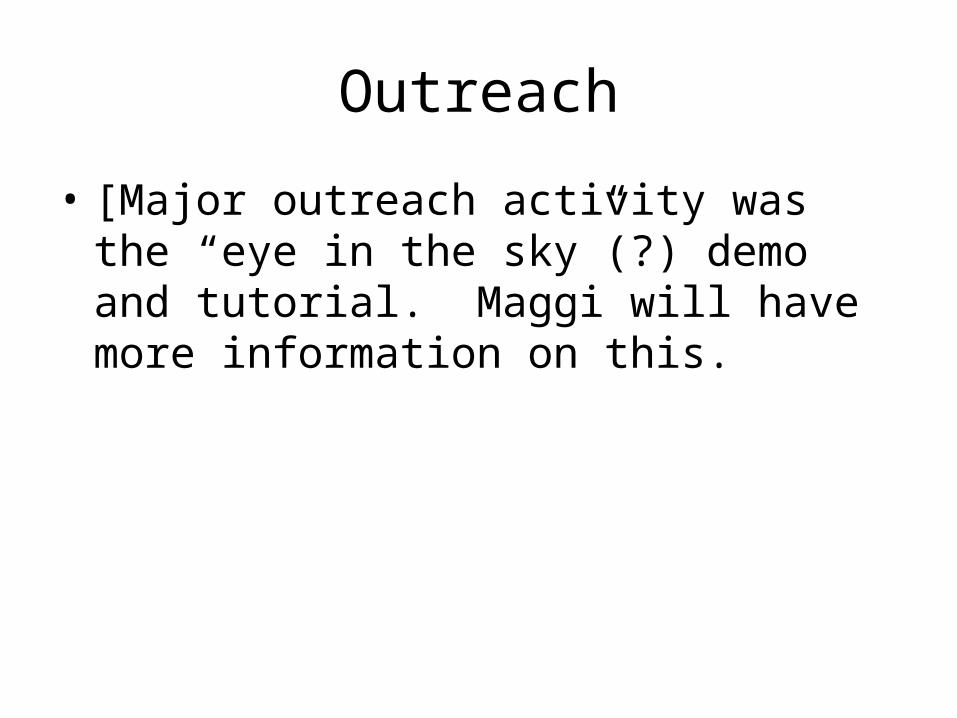
Outreach
• [Major outreach activity was the “eye in the sky”(?) demo and tutorial. Maggi will have more information on this.
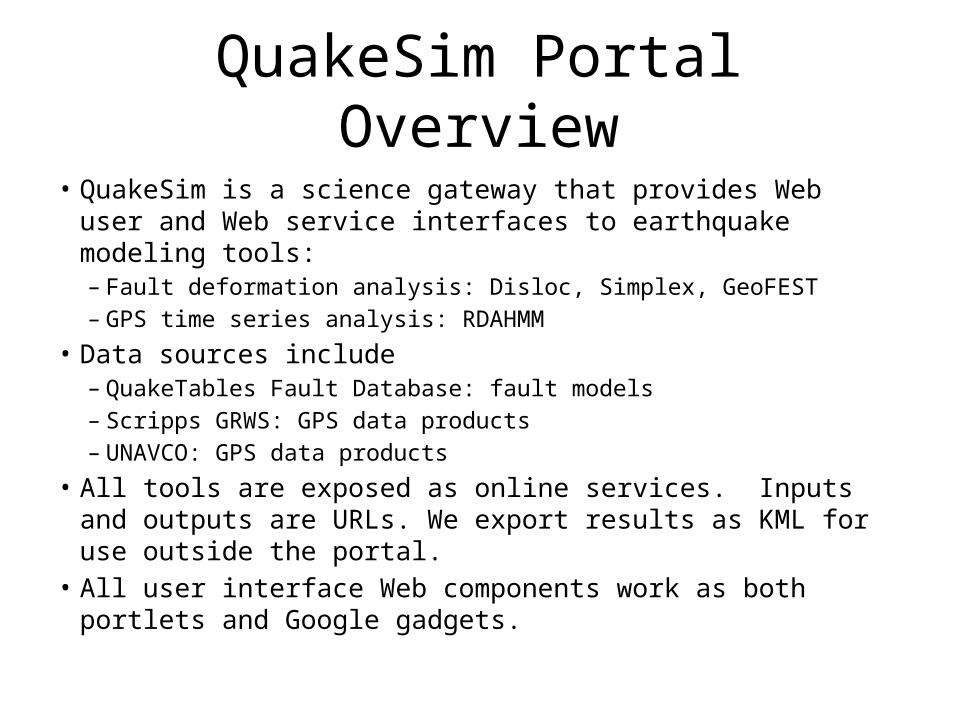
QuakeSim Portal Overview
• QuakeSim is a science gateway that provides Web user and Web service interfaces to earthquake modeling tools:– Fault deformation analysis: Disloc, Simplex, GeoFEST– GPS time series analysis: RDAHMM
• Data sources include– QuakeTables Fault Database: fault models– Scripps GRWS: GPS data products– UNAVCO: GPS data products
• All tools are exposed as online services. Inputs and outputs are URLs. We export results as KML for use outside the portal.
• All user interface Web components work as both portlets and Google gadgets.
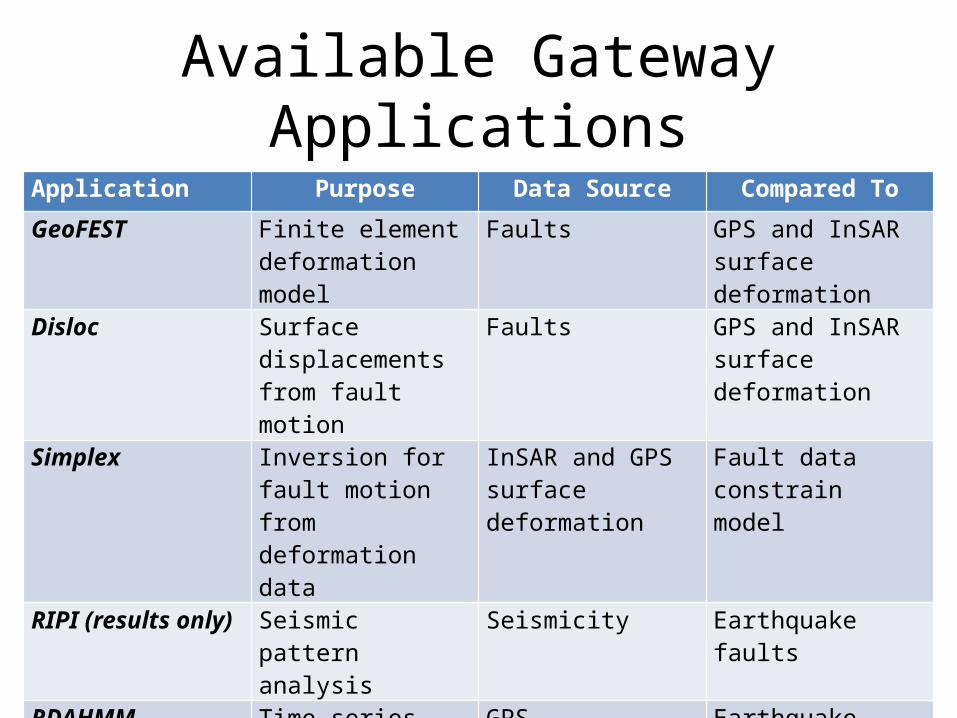
Application Purpose Data Source Compared To
GeoFEST Finite element deformation model
Faults GPS and InSAR surface deformation
Disloc Surface displacements from fault motion
Faults GPS and InSAR surface deformation
Simplex Inversion for fault motion from deformation data
InSAR and GPS surface deformation
Fault data constrain model
RIPI (results only) Seismic pattern analysis
Seismicity Earthquake faults
RDAHMM Time series analysis GPS Earthquake, aquifer sources
Available Gateway Applications

GPS Data Analysis with RDAHMM
Xiaoming Gao, Josh Rosen, and Yu Ma
Accomplishments
• Now providing RDAHMM analysis and classification for both JPL and SOPAC solutions.– Will be adding UNAVCO
• Redesigned processing pipeline as independent services.– Pipeline now composible, executable as a workflow.– Will give power users more control over the processing
pipeline (can add, replace components)• Several user interface improvements resulting from IU
visit by Robert Granat.– Improved GPS viewer, bug fixes, etc

Daily RDAHMM – user configurable workflow
• Prototype Web services – RDAHMM processing:Web service name FunctionalityModelBuilder Build RDAHMM modelEvaluator Complete RDAHMM evaluation
MissingDataNaNFiller Fill missing data in GPS time series raw file with “NaN”InputExtracter Extract input data columns from GPS time series raw fileFilteredRawComposer Compose GPS time series raw file with filtered input dataMissingDataDupFiller Fill missing data in GPS time series raw file with duplicatesFileConcatenater Concatenate the modeling input and evaluation input files
DetrendFilter De-trend the input dataDenoiseFilter De-noise the input dataDenoiseOutputPatcher Patch the de-noised data with duplicated data
• User-defined filter Web services:
• General auxiliary filter Web services:

Daily RDAHMM – user configurable workflow
User/Researcher
Workflow composer
such as XBaya
Workflow configuration file
Daily RDAHMM workflow runner
GPS time series dataresults
Daily RDAHMM portal
• Ideal working mode:

Daily RDAHMM – user configurable workflow
• Prototype RDAHMM modeling workflow in XBaya:
Pre-defined filtering component template
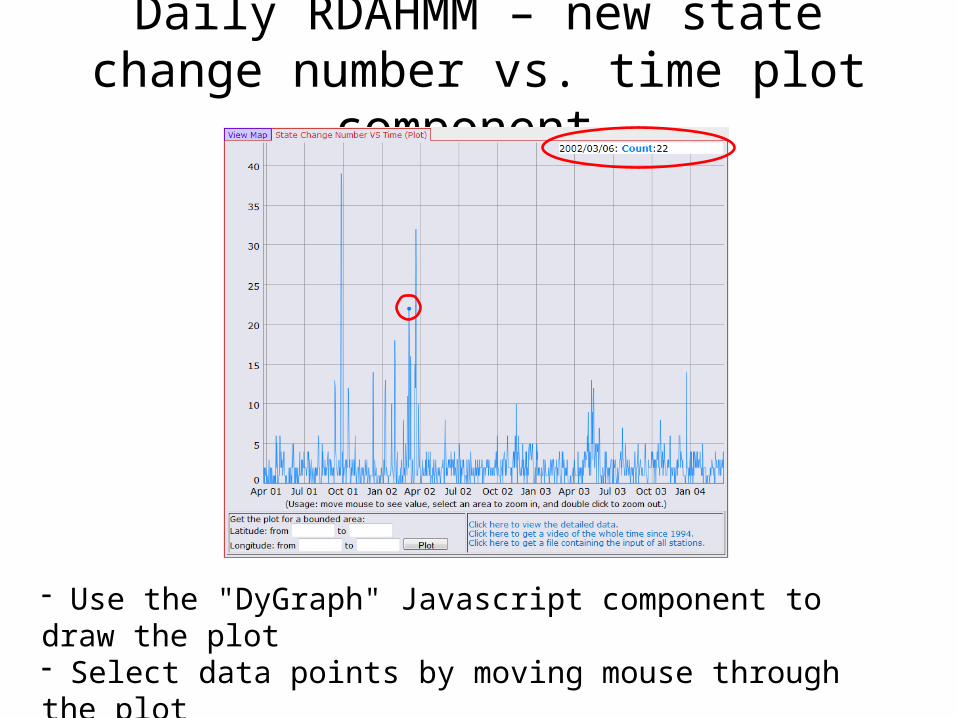
Daily RDAHMM – new state change number vs. time plot component
- Use the "DyGraph" Javascript component to draw the plot- Select data points by moving mouse through the plot- Zoom in to a specific time section by selecting an area in the plot
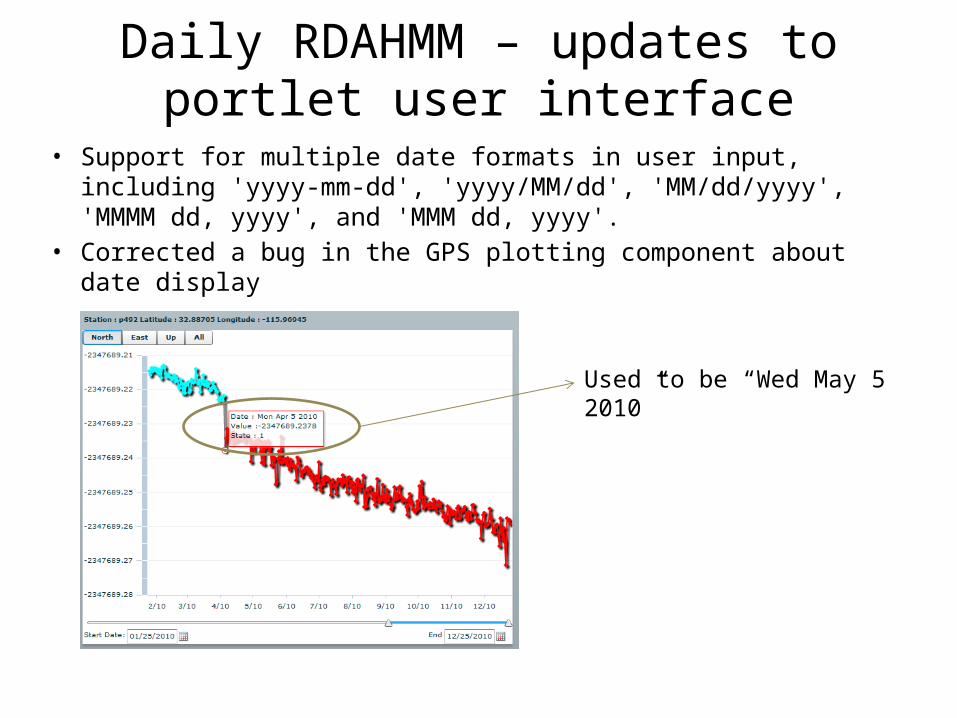
• Support for multiple date formats in user input, including 'yyyy-mm-dd', 'yyyy/MM/dd', 'MM/dd/yyyy', 'MMMM dd, yyyy', and 'MMM dd, yyyy'.
• Corrected a bug in the GPS plotting component about date display
Daily RDAHMM – updates to portlet user interface
Used to be “Wed May 5 2010”

RDAHMM GPS Viewer Updates• RDAHMM and GPS
user interfaces are described in more detail in a companion talk.
• We highlight here some improvements to the GPS results viewer.
• This is an Adobe Flash application embedded into Google maps in the “Daily RDAHMM” gadget.

New Interactive Plotting Component (More Later)
•- better point and line connections•- zoom-in and zoom-out in time scale•- slide-though along time axis

We made several updates to our interactive GPS viewer.

Specific Date Chooser
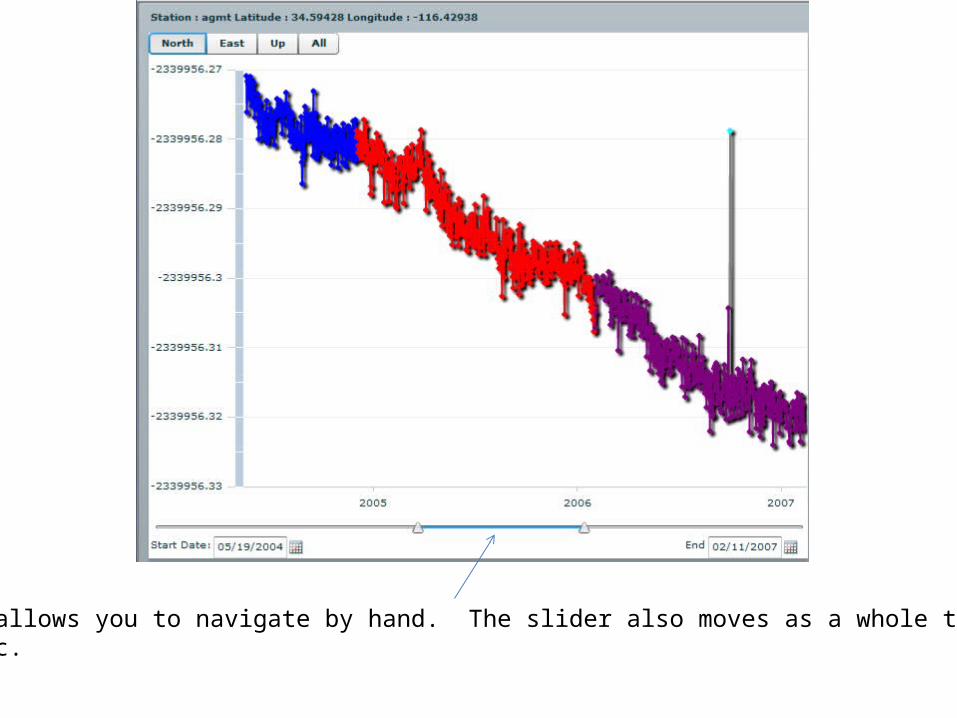
A dual slider allows you to navigate by hand. The slider also moves as a whole to keep the Interval static.
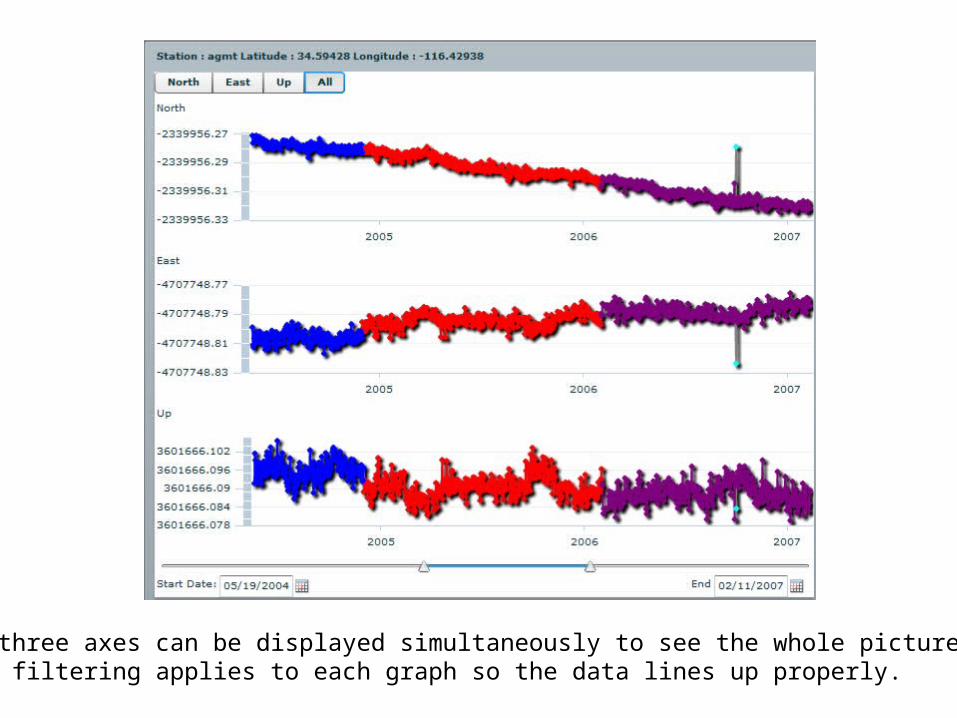
All three axes can be displayed simultaneously to see the whole picture. The date filtering applies to each graph so the data lines up properly.

Pop-ups with detailed. point specific data can be found by moving themouse over the graphs.
Data Cloud Updates
Xiaoming Gao, Yu Ma

Accomplishments
• Redesigned Virtual Block Store (VBS) research system to build on top of Lustre file system.– Substantial benchmarking and comparison with
previous design• Paper presented at CloudCom2010.• Example applications support workflows
tested, documented for submission to PNAS

VBS – extended architecture based on Lustre
• Better scalability and reliability• Public key user authentication and access control• Read-only volume sharing
Publication: “Building a Distributed Block Storage System for Cloud Infrastructure”, CloudCom 2010, Indianapolis, November 30-December 3, 2010.

VBS – application in FloodGrid
Model files, programs
Simulation service
Simulation service
Simulation service
results results results
Simulation service
results
private volume private volume private volume private volumeshared volume
VM 1 VM 2 VM 3 VM 4
• Simulation for 10 flood scenarios takes 205 minutes on 4 VMs.• In comparison, it takes 739 minutes if only 1 VM is used.

Deformation Tools Updates
Jun Wang, Jun Ji, Yu Ma
Accomplishments
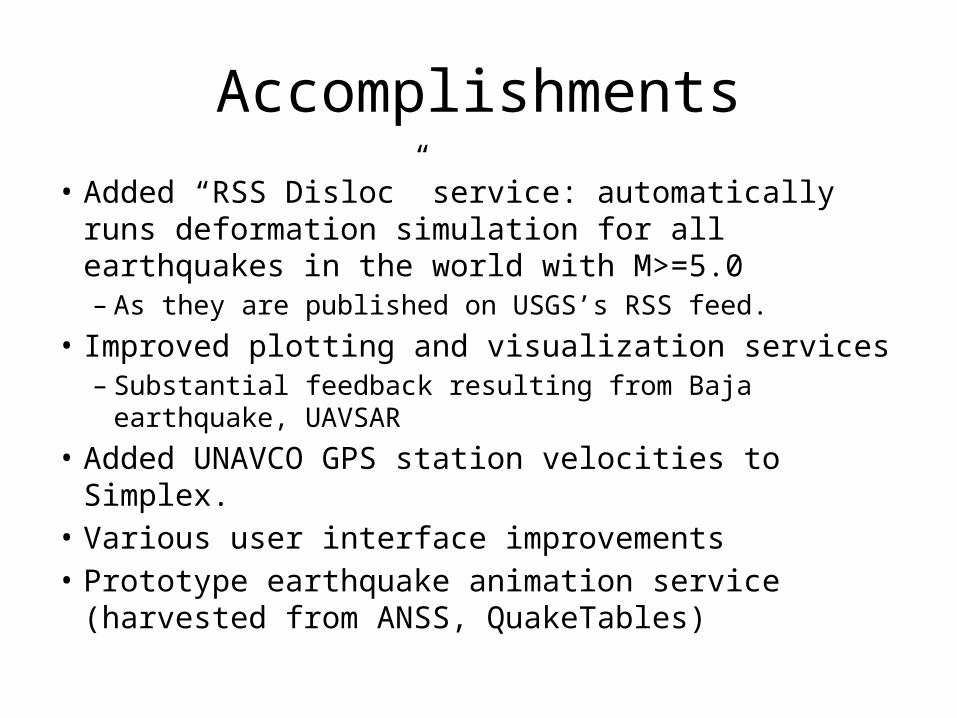
• Added “RSS Disloc” service: automatically runs deformation simulation for all earthquakes in the world with M>=5.0 – As they are published on USGS’s RSS feed.
• Improved plotting and visualization services– Substantial feedback resulting from Baja earthquake, UAVSAR
• Added UNAVCO GPS station velocities to Simplex.• Various user interface improvements• Prototype earthquake animation service (harvested
from ANSS, QuakeTables)

Deformation Tool Enhancements• Deformation tools updated to to interact with the upgraded Fault Database. • Faults now organized into appropriate CGS catalogs and accessible by KML-
emitting REST services for each catalog. • Upgraded map interfaces to display the new KML and integrate its data into
the Disloc, Simplex, and GeoFEST application submission tools.
Disloc portlet showing upgraded map interface. Faults in the map come from the revised QuakeTables fault database’s KML service. Parameter values for the fault model in the dialog box are extracted and used to set up deformation jobs.
RSS-Driven Disloc and InSAR Plotting Service
• We developed a version of the Disloc tool that is driven by the USGS M>5.0 Earthquake RSS feed.
• You can view results anonymously. • You also can log in with Google ID and copy
results to your personal workspace.– Can edit parameters submission parameters.
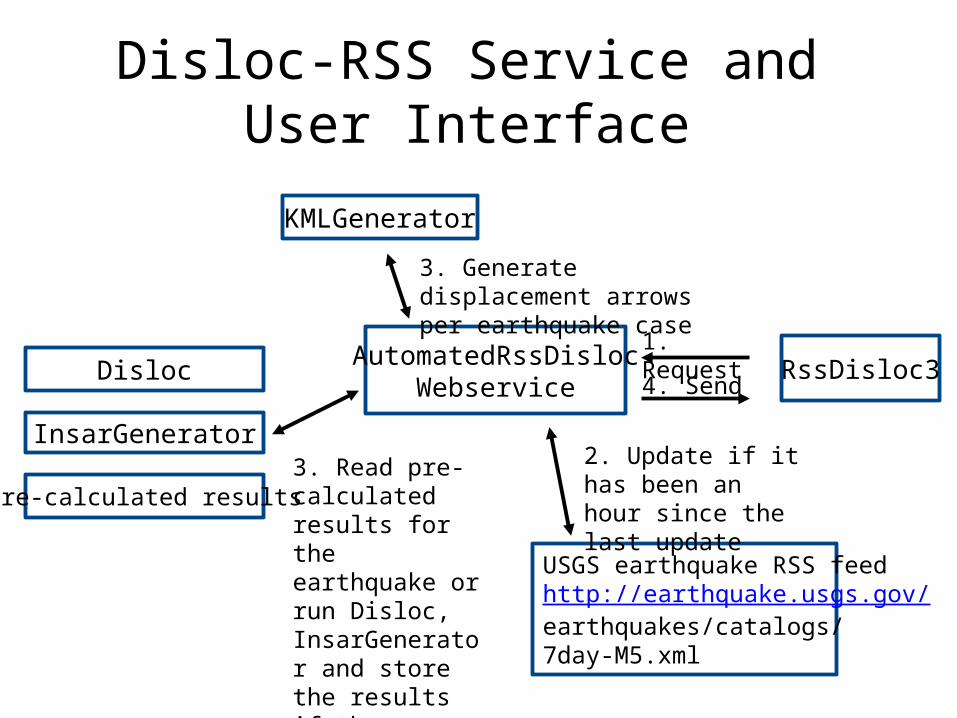
Disloc-RSS Service and User Interface
AutomatedRssDislocWebservice
USGS earthquake RSS feedhttp://earthquake.usgs.gov/earthquakes/catalogs/7day-M5.xml
RssDisloc31. Request
2. Update if it has been an hour since the last update
4. Send
KMLGenerator
Pre-calculated results
Disloc
InsarGenerator
3. Generate displacement arrows per earthquake case
3. Read pre-calculated results for the earthquake or run Disloc, InsarGenerator and store the results if the earthquake case isn’t pre-calculated.
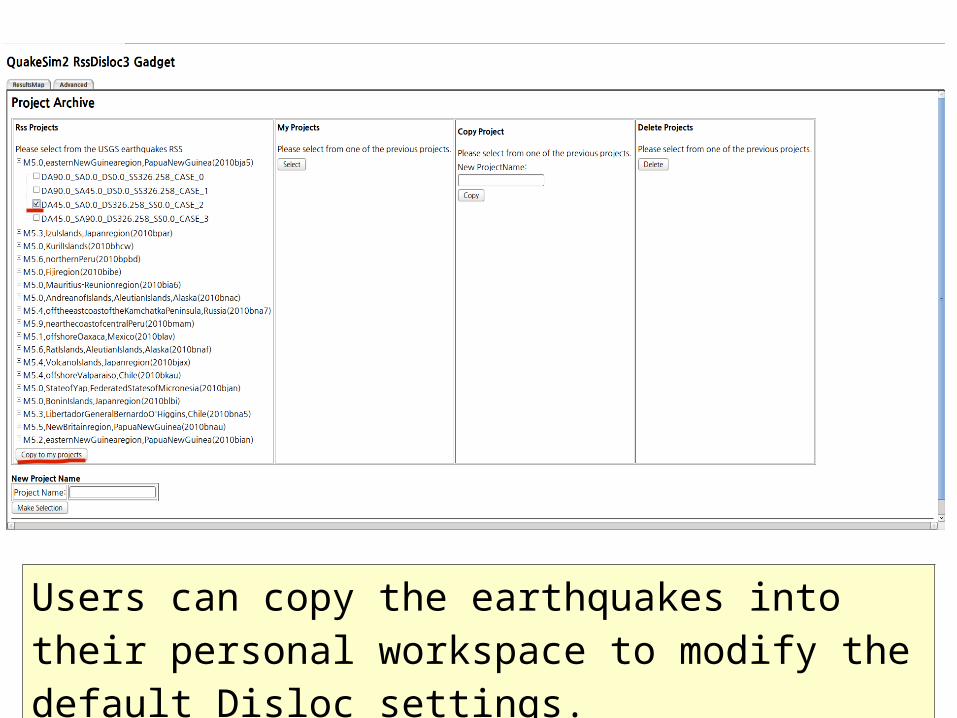
Users can copy the earthquakes into their personal workspace to modify the default Disloc settings.
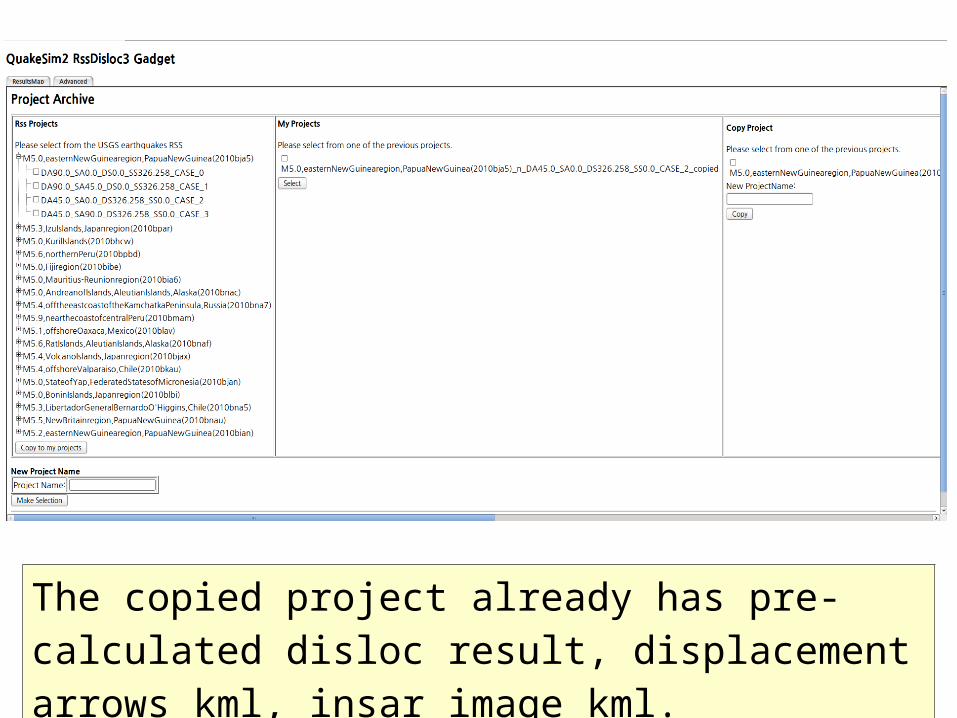
The copied project already has pre-calculated disloc result, displacement arrows kml, insar image kml.
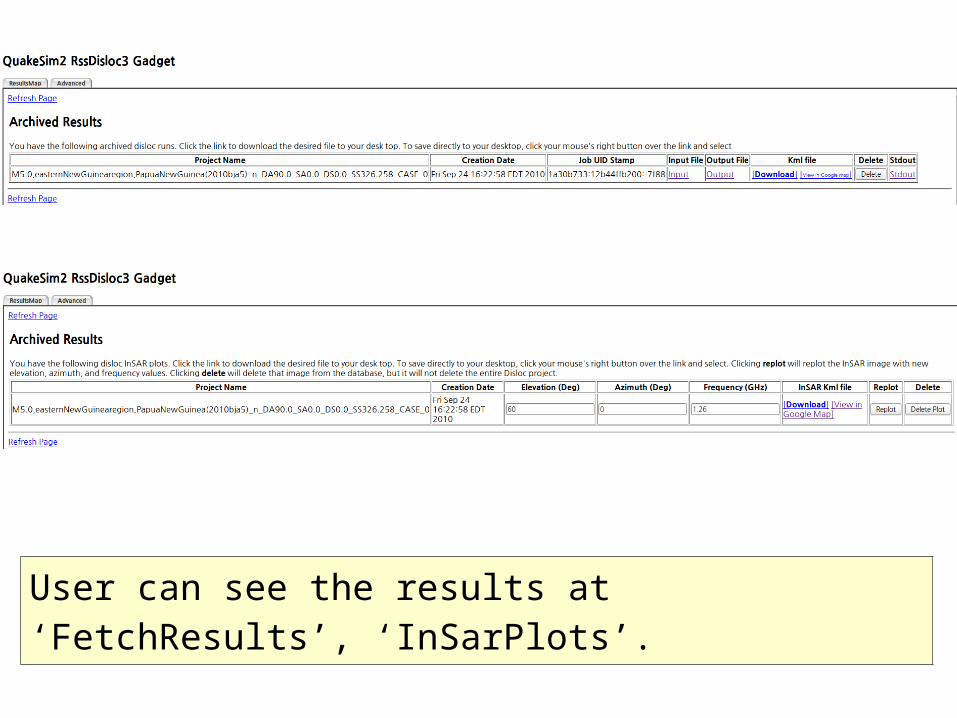
User can see the results at ‘FetchResults’, ‘InSarPlots’.

Subscribes to USGS earthquake RSS feed, calculates Disloc deformations and InSAR interferograms for every earthquake in the world with M>5.
Uses previously developed Disloc services and since the same case number makes same results, it reuses the pre-calculated data from the second run.
Plot is M 5.5 earthquake in southern Iran. Arrows are displacements. Detailed information in clickable popup.
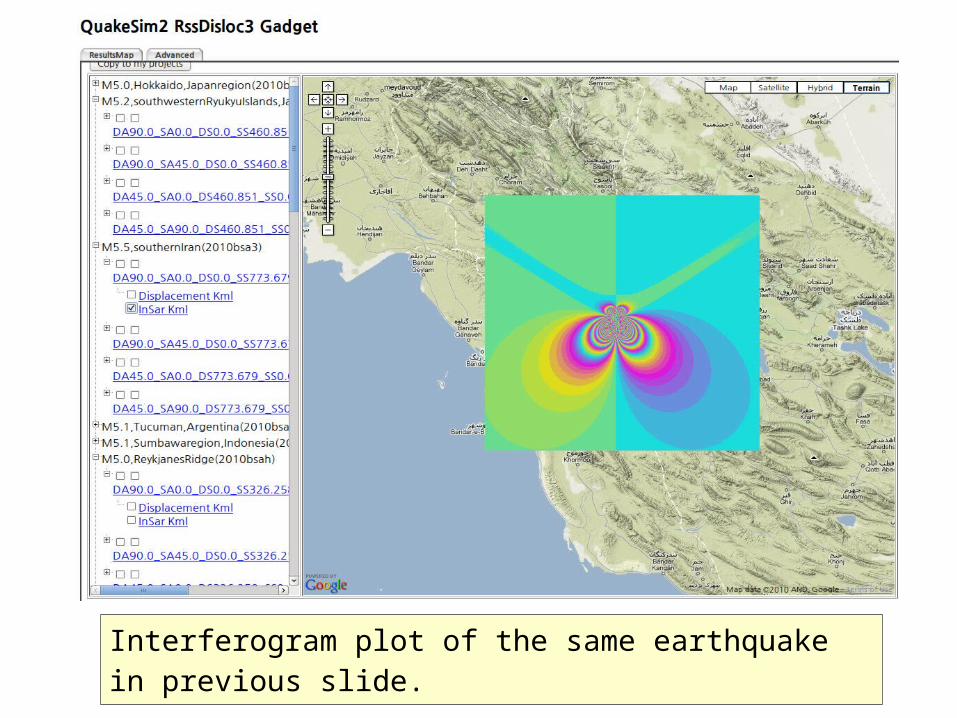
Interferogram plot of the same earthquake in previous slide.

Simplex Updates
• Simplex is an inversion code that determines best-fit fault models for a particular set of observed displacements or velocities.
• We have added UNAVCO GPS station velocities to Simplex’s user interface.– Using a Web service provided by UNAVCO.– Supplements JPL GIPSY and Scripps GLOBK values from
Yehuda Bock’s team’s GRWS service.• This is introduces a problem, since the services give
different values. – Need an easy interface for selecting the ones you want.

Select GPS stations with map interface. This may have multiple values.
View multiple values, select the data source that you want.
Optionally, select multiple GPS stations with draggable box.

Plotting Service Update
• Color matching between UAVSAR and Disloc interferogram
• Publication-ready plotting products for daily RDAHMM GPS data analysis
• 3D earthquake visualization
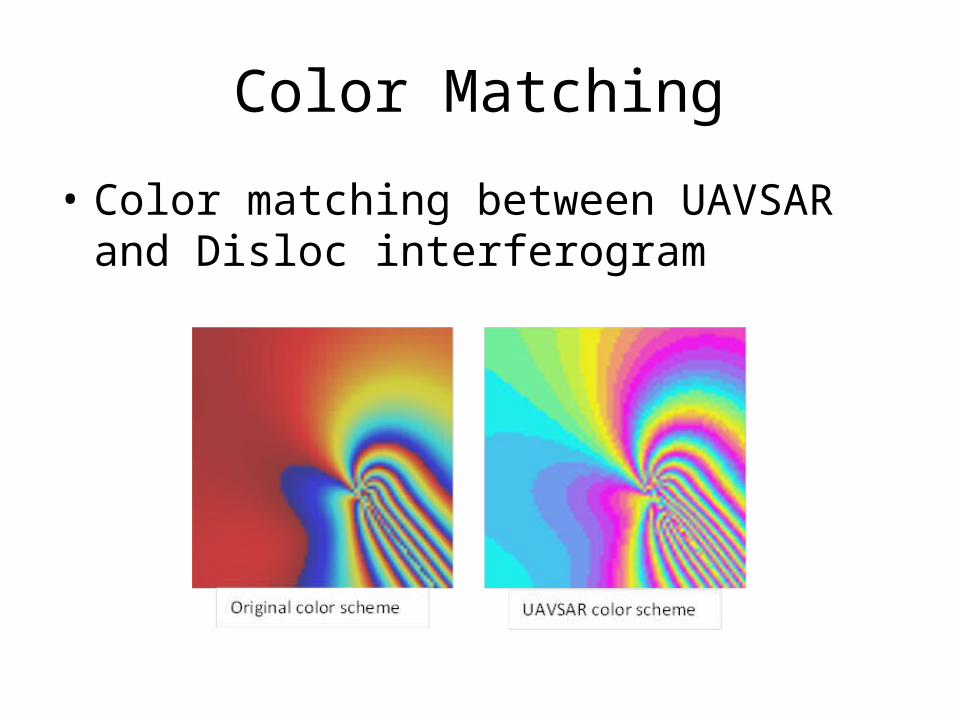
Color Matching
• Color matching between UAVSAR and Disloc interferogram

Color Matching
• The example of displaying disloc interferogram and UAVSAR interferogram on Google Earth.
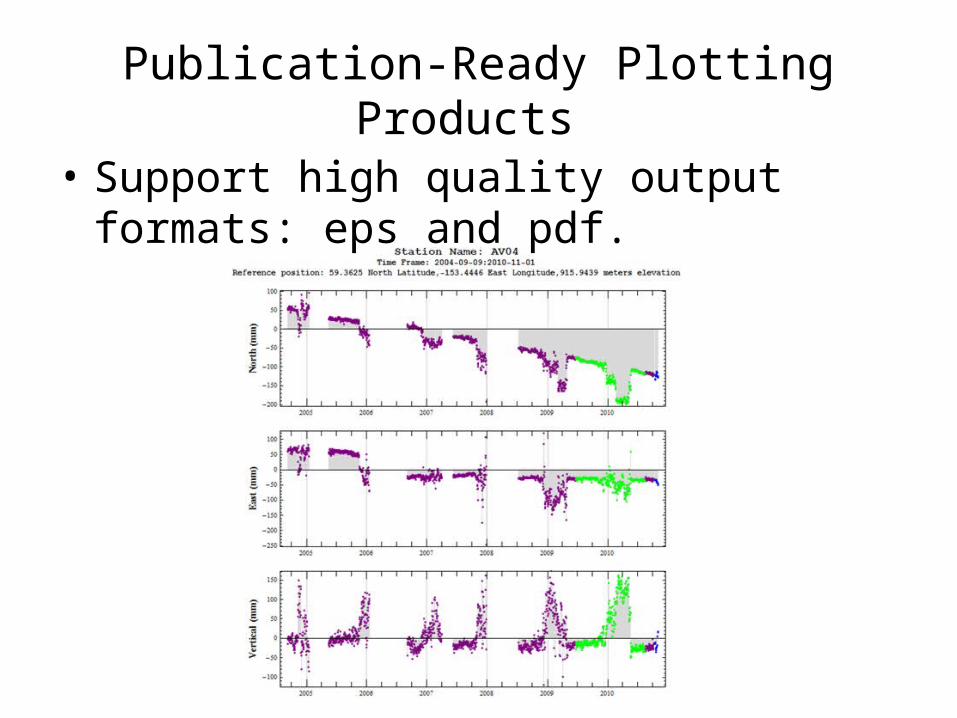
Publication-Ready Plotting Products
• Support high quality output formats: eps and pdf.
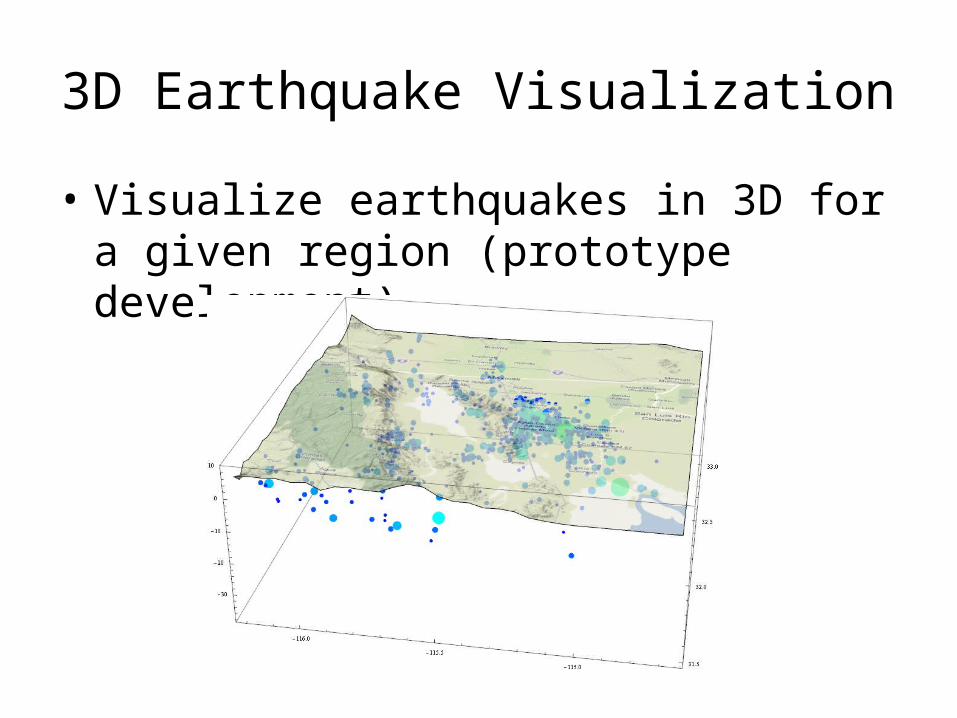
3D Earthquake Visualization
• Visualize earthquakes in 3D for a given region (prototype development)

3D Visualization: Spatial Distribution
• Visualize 2D earthquake spatial distribution in 3D with Google Map overlay
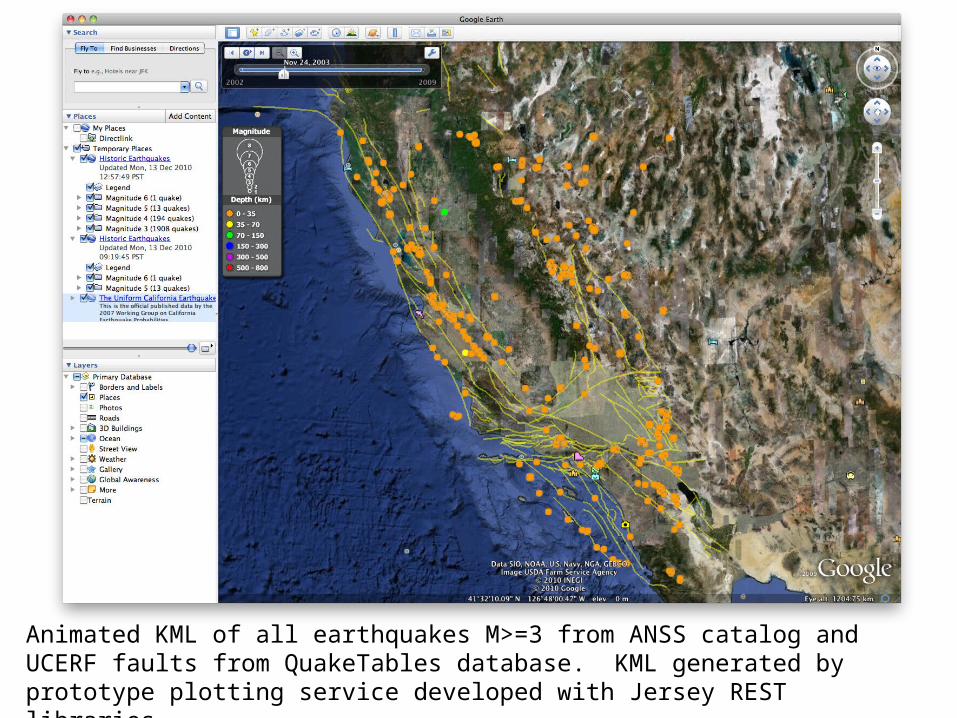
Animated KML of all earthquakes M>=3 from ANSS catalog and UCERF faults from QuakeTables database. KML generated by prototype plotting service developed with Jersey REST libraries.