Embed Size (px)
Citation preview
Pure Appl. Chem., Vol. 73, No. 11, pp. 1795–1818, 2001.© 2001 IUPAC
1795
INTERNATIONAL UNION OF PURE AND APPLIED CHEMISTRY
PHYSICAL CHEMISTRY DIVISIONCOMMISSION ON MOLECULAR STRUCTURE AND SPECTROSCOPY*
NMR NOMENCLATURE. NUCLEAR SPIN PROPERTIES AND CONVENTIONS FOR CHEMICAL SHIFTS
(IUPAC Recommendations 2001)
Prepared for publication byROBIN K. HARRIS1,‡, EDWIN D. BECKER2, SONIA M. CABRAL DE MENEZES3,
ROBIN GOODFELLOW4, AND PIERRE GRANGER5
1Department of Chemistry, University of Durham, South Road, Durham, DH1 3LE, UK; 2NationalInstitutes of Health, Bethesda, Maryland 20892-0520, USA; 3PETROBRAS/CENPES/QUÍMICA, Ilha
do Fundão, Quadra 7, Cidade Universitária, 21949-900, Rio de Janeiro, R.J., Brazil; 4School ofChemistry, University of Bristol, Cantock’s Close, Bristol, BS8 1TS, UK; 5Institut de Chimie,
Université Louis Pasteur de Strasbourg, 1 rue Blaise Pascal, 67008 Strasbourg, CEDEX, France
*Membership of the Commission during the preparation of this report (1994–2001) was as follows:Chairman: J. E. Bertie (Canada, 1994–2001); Secretary: J. F. Sullivan (USA, 1994–1995); P. Klaeboe (Norway,1996–2001); Titular Members: J. E. Boggs (USA, 1998–2001); S. M. Cabral de Menezes (Brazil, 2000–2001);A. M. Heyns (RSA, 1994–2001); N. Hirota (Japan, 1998–2001); R. Janoschek (Austria, 1994–1997, 2000–2001);R. S. McDowell (USA, 1998–2001); P. Klaeboe (Norway, 1994–1995); S. Tsuchiya (Japan, 1994–1997); B. P. Winnewisser (Germany, 1994–1997); Associate Members: A. M. Bradshaw (FRG, 1994–1995); S. M. Cabral de Menezes (Brazil, 1994–1999); B. G. Derendjaev (Russia, 1994–1995); E. Hirota (Japan,1994–1997); J. Kowalewski (Sweden, 1996–2001); A. Oskam (Netherlands, 1994–2001); P. v. R. Schleyer(Germany, 1998–2001); S. Tsuchiya (Japan, 1998–1999); B. J. Van Der Veken (Belgium, 2000–2001); C. Zhang(China, 1994–1997); Q.-S. Zhu (China, 1998–2001); National Representatives: B. H. Boo (Korea, 2000–2001);J. E. Collin (Belgium, 1994–1997); M. Chowdhury (India, 1994–1995); S. Califano (Italy, 1994–1997); D. Escolar(Spain, 1996–1997); T. A. Ford (RSA, 2000–2001); R. K. Harris (UK, 1994–2001); J. P. Hawranek (Poland,1998–2001); R. Janoschek (Austria, 1998–1999); Y. S. Lee (Republic of Korea, 1994–1999); D. Escolar (Spain,1991–1997); J. Kowalewski (Sweden, 1994–1995); P. T. Manoharan (India, 1998–2001); S. Suzer (Turkey,1996–1997); S. Içli (Turkey, 1994–1995); S. L. Spassov (Bulgaria, 2000–2001); J. J. C. Teixeira-Dias (Portugal,1994–2001); B. J. Van Der Veken (Belgium, 1998–1999).
‡Corresponding author
Republication or reproduction of this report or its storage and/or dissemination by electronic means is permitted without theneed for formal IUPAC permission on condition that an acknowledgment, with full reference to the source, along with use of thecopyright symbol ©, the name IUPAC, and the year of publication, are prominently visible. Publication of a translation intoanother language is subject to the additional condition of prior approval from the relevant IUPAC National AdheringOrganization.
NMR nomenclature. Nuclear spinproperties and conventions for chemicalshifts
(IUPAC Recommendations 2001)
Abstract: A unified scale is recommended for reporting the NMR chemical shiftsof all nuclei relative to the 1H resonance of tetramethylsilane (TMS). The unifiedscale is designed to provide a precise ratio, Ξ, of the resonance frequency of agiven nuclide to that of the primary reference, the 1H resonance of TMS in dilutesolution (volume fraction, ϕ < 1%) in chloroform. Referencing procedures are dis-cussed, including matters of practical application of the unified scale. Specialattention is paid to recommended reference samples, and values of Ξ for second-ary references on the unified scale are listed, many of which are the results of newmeasurements.
Some earlier recommendations relating to the reporting of chemical shiftsare endorsed. The chemical shift, δ, is redefined to avoid previous ambiguities butto leave practical usage unchanged. Relations between the unified scale andrecently published recommendations for referencing in aqueous solutions (for spe-cific use in biochemical work) are discussed, as well as the special effects of work-ing in the solid state with magic-angle spinning. In all, nine new recommendationsrelating to chemical shifts are made.
Standardized nuclear spin data are also presented in tabular form for the sta-ble (and some unstable) isotopes of all elements with nonzero quantum numbers.The information given includes quantum numbers, isotopic abundances, magneticmoments, magnetogyric ratios and receptivities, together with quadrupolemoments and line-width factors where appropriate.
1. INTRODUCTION
A distinguishing feature of nuclear magnetic resonance (NMR) is that signals are isotope-specific. Inother words, each signal can be firmly linked to a particular element and nuclide. Two features follow:Firstly, there is a close connection with chemistry and, in particular, with the periodic table, since almostall elements can be studied; secondly, the spin properties of each isotope need to be clearly tabulatedand firmly understood. It is a principal purpose of this document to provide such information.
Any scientific discipline relies for its effectiveness upon communication of ideas and results,which can only occur if there is an agreed basis for the meaning of the terminology used. The processof communication is greatly eased if there are universally recognized conventions for measurement andreporting of quantities with their units and symbols. The aim of this document is to set down such a setof meanings and conventions in relation to chemical shifts (and shielding) and to list resonance fre-quencies for reference signals for each magnetically active nucleus.
Within IUPAC, Commission I.5 has been responsible for molecular structure and spectroscopy.Until now, this Commission has produced only three reports [1–3] specifically relating to NMR. Thetwo earlier reports refer to chemical shifts. The more recent of these two publications is 25 years old,and the NMR world has changed beyond recognition since then. Recently, however, conventions forchemical shifts of five nuclei of wide biochemical interest have been included in “Recommendationsfor the presentation of NMR structures of proteins and nuclei acids” [4] by Commission I.7,Biophysical Chemistry. The current document addresses the same issue for general chemical usage and
R. K. HARRIS et al.
© 2001 IUPAC, Pure and Applied Chemistry 73, 1795–1818
1796
extends the conventions to the entire range of active nuclei, providing a more comprehensive guide tothe factors important in chemical shift referencing. A unified list of properties of NMR-observablenuclei is also included herein.
2. NUCLEAR SPIN PROPERTIES
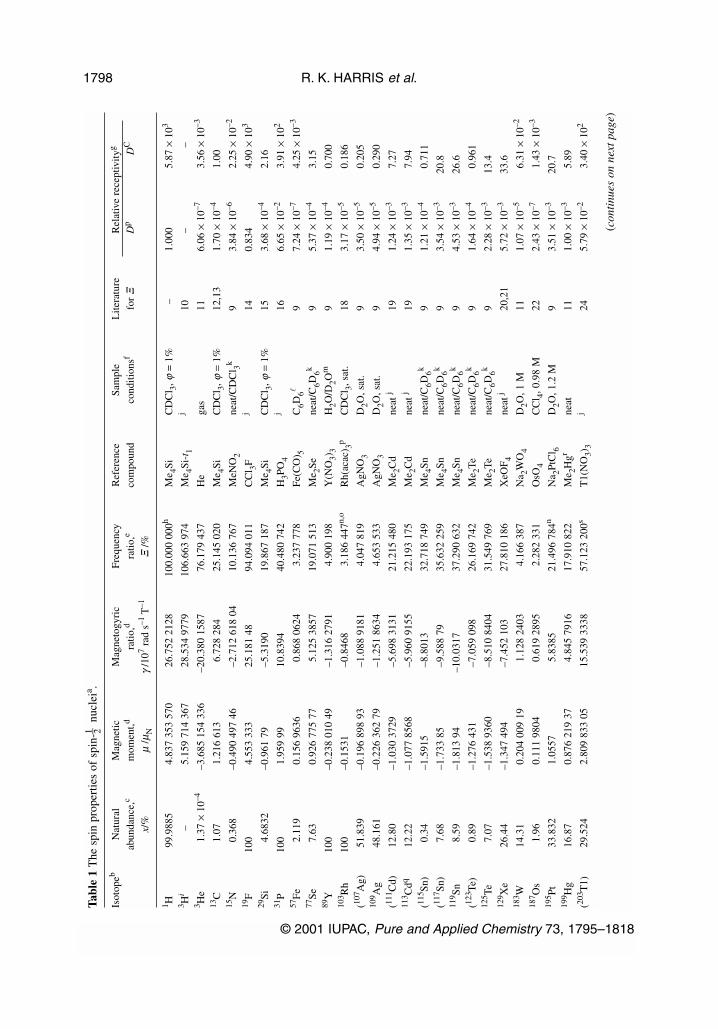
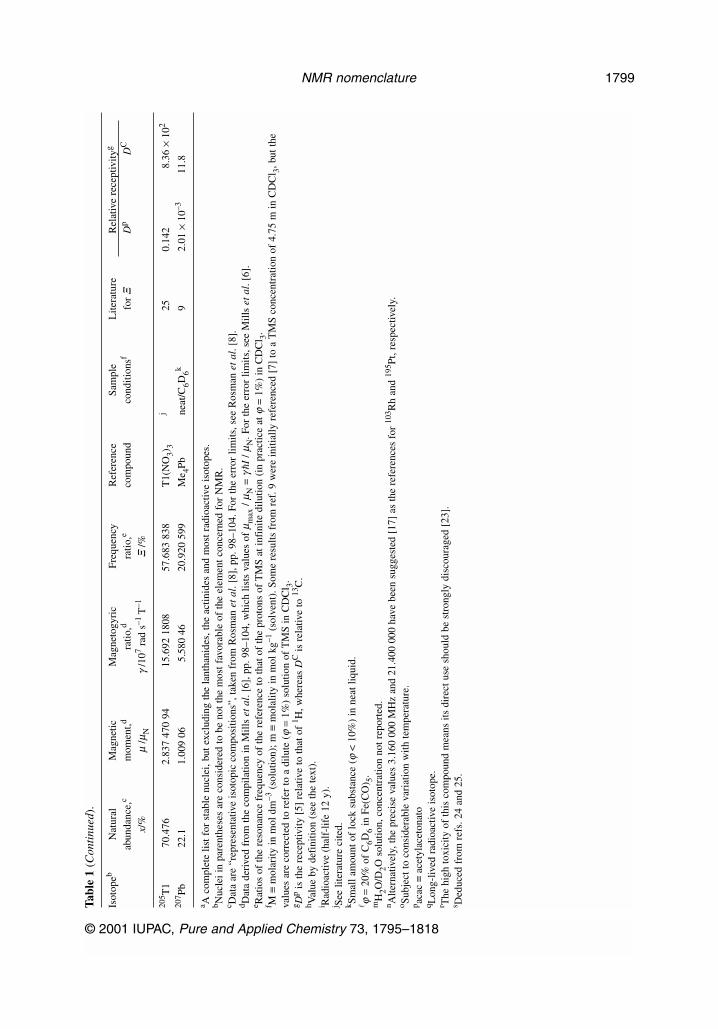
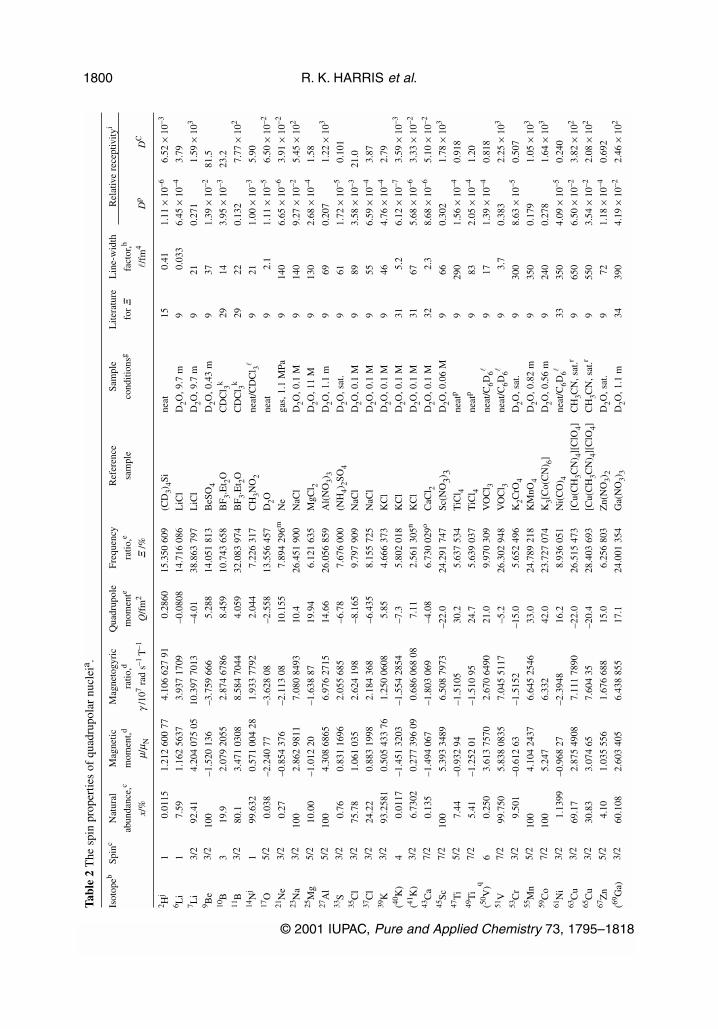
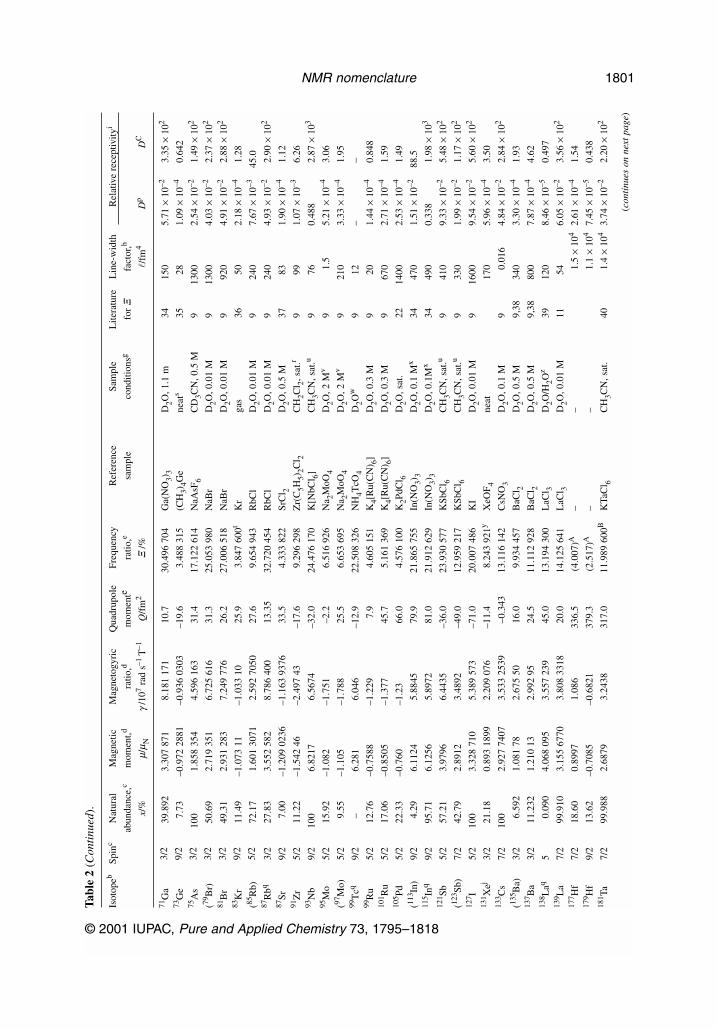
The phenomenon of NMR is based upon the magnetic properties of various isotopes of elements in theperiodic table. It is, therefore, important to have an accessible unified list of these properties. These arecontained in Tables 1–3 of this article, which include the following for each stable isotope and eachlong-lived radioactive isotope with nonzero spin:
(i) The nuclear spin quantum number, I, of the ground state of the nucleus.* This defines the magni-tude of the spin angular momentum vector (and hence magnetic dipole moment—see below). Thez-component quantum number is then denoted by mI.
(ii) The standard isotopic natural abundance, x, expressed as a mole fraction in %.(iii) The magnetic dipole moment, µ, of the nuclide, in terms of the nuclear magneton, µN. It should
be noted that we have chosen to use the full vector magnitude of µ, given by:
|µ| / µN = |γ | h[I(I + 1)]1/2 / µN (1)
where γ is the magnetogyric ratio and h is the Planck constant divided by 2π. Many lists prefer togive only the maximum value of the z-component of µ, namely, µz = γ h I, frequently withoutexplicitly stating this fact. The sign of µ given in Tables 1–3 refers to its direction compared tothe related spin angular momentum vector.
(iv) The magnetogyric ratio, γ (sometimes called the gyromagnetic ratio). The SI base units of thisquantity are (angular frequency) / (magnetic induction) normally given as rad s–1 T–1.
(v) The receptivity, of a nucleus in natural abundance, which influences the NMR signal strength. Acommon definition [5] involves the proportionality of receptivity to γ 3xI (I + 1). In practice, it isuseful to list such receptivities relative to those of the commonly used nuclei 1H (proton) and 13C,giving receptivity ratios Dp and DC, respectively. Both these quantities are given in Tables 1 and 2.
(vi) The quadrupole moment, Q, for nuclei with spin quantum number I > 1–2 (Tables 2 and 3 only).These data fall naturally in the region of 10–30 m2, i.e., fm2. However, quadrupole moments areoften expressed in units of 10–28 m2, called a barn, where 1 barn = 100 fm2.
(vii) The line-width factor, l, for quadrupolar nuclei. This is defined [5] by:
l = Q2(2I + 3)/[I2(2I – 1)] (2)
When taken in conjunction with the relative receptivity (e.g., as DC/l), this quantity gives a guideto the ease with which spectra can be obtained for different quadrupolar nuclei in solution for sim-ilar site symmetries and molecular mobilities. However, in practice, both symmetry and mobilitymay vary widely, thus introducing variations that may amount to several powers of ten.
Table 1 gives the data for the spin-1–2 nuclei in the periodic table, whereas Table 2 refers toquadrupolar nuclei. These two tables omit the lanthanide and actinide nuclei, which are separately list-ed in Table 3. Many of the data in Tables 1–3 have been taken from the IUPAC “Green Book” [6], butadditional information is included (particularly on resonance frequencies and quadrupole moments). Aversion of Tables 1–3 has been published [7]. However, the tables given here contain revised resonancefrequencies for consistency with the recommended primary reference, as described in Section 3.5. In
© 2001 IUPAC, Pure and Applied Chemistry 73, 1795–1818
NMR nomenclature 1797
*NMR is entirely concerned with the nuclear spin in the lowest-energy nuclear state, though Mössbauer spectroscopy involvesvalues of I in higher-energy nuclear states.
(Text continues on p. 1804.)
R. K. HARRIS et al.
© 2001 IUPAC, Pure and Applied Chemistry 73, 1795–1818
1798Ta
ble
1T
he s
pin
prop
ertie
s of
spi
n-1 – 2
nucl
eia .
Isot
opeb
Nat
ural
Mag
netic
Mag
neto
gyri
c Fr
eque
ncy
Ref
eren
ceSa
mpl
eL
itera
ture
Rel
ativ
e re
cept
ivity
g
abun
danc
e,c
mom
ent,d
ratio
,dra
tio,e
com
poun
dco
nditi
onsf
for
ΞD
pD
C
x/%
µ/µ
Nγ
/107
rad
s–1 T
–1Ξ
/%
1 H99
.988
54.
837
353
570
26.7
52 2
128
100.
000
000h
Me 4S
iC
DC
l 3, ϕ
= 1
%–
1.00
05.
87 ×
103
3 Hi
–5.
159
714
367
28.5
34 9
779
106.
663
974
Me 4S
i-t 1
j10
––
3 He
1.37
×10
–4–3
.685
154
336
–20.
380
1587
76.1
79 4
37H
ega
s11
6.06
×10
–73.
56 ×
10–3
13C
1.07
1.21
6 61
36.
728
284
25.1
45 0
20M
e 4Si
CD
Cl 3,
ϕ=
1%12
,13
1.70
×10
–41.
0015
N0.
368
–0.4
90 4
97 4
6–2
.712
618
04
10.1
36 7
67M
eNO
2ne
at/C
DC
l 3k9
3.84
×10
–62.
25 ×
10–2
19F
100
4.55
3 33
325
.181
48
94.0
94 0
11C
Cl 3F
j14
0.83
44.
90 ×
103
29Si
4.68
32–0
.961
79
–5.3
190
19.8
67 1
87M
e 4Si
CD
Cl 3,
ϕ=
1%15
3.68
×10
–42.
1631
P10
01.
959
9910
.839
440
.480
742
H3P
O4
j16
6.65
×10
–23.
91 ×
102
57Fe
2.11
90.
156
9636
0.86
8 06
243.
237
778
Fe(C
O) 5
C6D
6l9
7.24
×10
–74.
25 ×
10–3
77Se
7.63
0.92
6 77
5 77
5.12
5 38
5719
.071
513
Me 2S
ene
at/C
6D6k
95.
37 ×
10–4
3.15
89Y
100
–0.2
38 0
10 4
9–1
.316
279
14.
900
198
Y(N
O3)
3H
2O/D
2Om
91.
19 ×
10–4
0.70
010
3 Rh
100
–0.1
531
–0.8
468
3.18
6 44
7n,o
Rh(
acac
) 3pC
DC
l 3, s
at.
183.
17 ×
10–5
0.18
6
(107 A
g)51
.839
–0.1
96 8
98 9
3–1
.088
918
14.
047
819
AgN
O3
D2O
, sat
.9
3.50
×10
–50.
205
109 A
g48
.161
–0.2
26 3
62 7
9–1
.251
863
44.
653
533
AgN
O3
D2O
, sat
.9
4.94
×10
–50.
290
(111 C
d)12
.80
–1.0
30 3
729
–5.6
98 3
131
21.2
15 4
80M
e 2Cd
neat
j19
1.24
×10
–37.
2711
3 Cdq
12.2
2–1
.077
856
8–5
.960
915
522
.193
175
Me 2C
dne
at j
191.
35 ×
10–3
7.94
(115 Sn
)0.
34–1
.591
5–8
.801
332
.718
749
Me 4S
nne
at/C
6D6k
91.
21 ×
10–4
0.71
1
(117 Sn
)7.
68–1
.733
85
–9.5
88 7
935
.632
259
Me 4S
nne
at/C
6D6k
93.
54 ×
10–3
20.8
119 Sn
8.59
–1.8
13 9
4–1
0.03
1737
.290
632
Me 4S
nne
at/C
6D6k
94.
53 ×
10–3
26.6
(123 Te
)0.
89–1
.276
431
–7.0
59 0
9826
.169
742
Me 2T
ene
at/C
6D6k
91.
64 ×
10–4
0.96
112
5 Te7.
07–1
.538
936
0–8
.510
840
431
.549
769
Me 2T
ene
at/C
6D6k
92.
28 ×
10–3
13.4
129 X
e26
.44
–1.3
47 4
94–7
.452
103
27.8
10 1
86X
eOF 4
neat
j20
,21
5.72
×10
–333
.618
3 W14
.31
0.20
4 00
9 19
1.12
8 24
034.
166
387
Na 2W
O4
D2O
, 1 M
111.
07 ×
10–5
6.31
×10
–2
187 O
s1.
960.
111
9804
0.61
9 28
952.
282
331
OsO
4C
Cl 4,
0.9
8 M
222.
43 ×
10–7
1.43
×10
–3
195 Pt
33.8
321.
0557
5.83
8521
.496
784
nN
a 2PtC
l 6D
2O, 1
.2 M
93.
51 ×
10–3
20.7
199 H
g16
.87
0.87
6 21
9 37
4.84
5 79
1617
.910
822
Me 2H
grne
at11
1.00
×10
–35.
89
(203 T
1)29
.524
2.80
9 83
3 05
15.5
39 3
338
57.1
23 2
00s
T1(
NO
3)3
j24
5.79
×10
–23.
40 ×
102
(con
tinu
es o
n ne
xt p
age)
© 2001 IUPAC, Pure and Applied Chemistry 73, 1795–1818
NMR nomenclature 1799Ta
ble
1(C
onti
nued
).
Isot
opeb
Nat
ural
Mag
netic
Mag
neto
gyri
c Fr
eque
ncy
Ref
eren
ceSa
mpl
eL
itera
ture
Rel
ativ
e re
cept
ivity
g
abun
danc
e,c
mom
ent,d
ratio
,dra
tio,e
com
poun
dco
nditi
onsf
for
ΞD
pD
C
x/%
µ/µ
Nγ
/107
rad
s–1 T
–1Ξ
/%
205 T
170
.476
2.83
7 47
0 94
15.6
92 1
808
57.6
83 8
38T
1(N
O3)
3j
250.
142
8.36
×10
2
207 Pb
22.1
1.00
9 06
5.58
0 46
20.9
20 5
99M
e 4Pb
neat
/C6D
6k9
2.01
×10
–311
.8
a A c
ompl
ete
list f
or s
tabl
e nu
clei
, but
exc
ludi
ng th
e la
ntha
nide
s, th
e ac
tinid
es a
nd m
ost r
adio
activ
e is
otop
es.
b Nuc
lei i
n pa
rent
hese
s ar
e co
nsid
ered
to b
e no
t the
mos
t fav
orab
le o
f th
e el
emen
t con
cern
ed f
or N
MR
.c D
ata
are
“rep
rese
ntat
ive
isot
opic
com
posi
tions
”, ta
ken
from
Ros
man
et
al. [
8],p
p. 9
8–10
4. F
or th
e er
ror
limits
, see
Ros
man
et
al. [
8].
d Dat
a de
rive
d fr
om th
e co
mpi
latio
n in
Mill
s et
al.
[6],
pp.
98–
104,
whi
ch li
sts
valu
es o
f µ m
ax/ µ
N=
γhI
/ µN
. For
the
erro
r lim
its, s
ee M
ills
et a
l. [6
].e R
atio
s of
the
reso
nanc
e fr
eque
ncy
of th
e re
fere
nce
to th
at o
f th
e pr
oton
s of
TM
S at
infi
nite
dilu
tion
(in
prac
tice
at ϕ
= 1
%)
in C
DC
l 3.f M
≡m
olar
ity in
mol
dm
–3(s
olut
ion)
; m ≡
mol
ality
in m
ol k
g–1(s
olve
nt).
Som
e re
sults
fro
m r
ef. 9
wer
e in
itial
ly r
efer
ence
d [7
] to
a T
MS
conc
entr
atio
n of
4.7
5 m
in C
DC
l 3, b
ut th
eva
lues
are
cor
rect
ed to
ref
er to
a d
ilute
(ϕ
= 1%
) so
lutio
n of
TM
S in
CD
Cl 3.
g Dp
is th
e re
cept
ivity
[5]
rel
ativ
e to
that
of
1 H, w
here
as D
Cis
rel
ativ
e to
13C
.h V
alue
by
defi
nitio
n (s
ee th
e te
xt).
i Rad
ioac
tive
(hal
f-lif
e 12
y).
j See
liter
atur
e ci
ted.
k Smal
l am
ount
of
lock
sub
stan
ce (
ϕ <
10%
) in
nea
t liq
uid.
l ϕ=
20%
of
C6D
6in
Fe(
CO
) 5.m
H2O
/D2O
sol
utio
n, c
once
ntra
tion
not r
epor
ted.
n Alte
rnat
ivel
y, th
e pr
ecis
e va
lues
3.1
60 0
00 M
Hz
and
21.4
00 0
00 h
ave
been
sug
gest
ed [
17]
as th
e re
fere
nces
for
103 R
h an
d 19
5 Pt, r
espe
ctiv
ely.
o Subj
ect t
o co
nsid
erab
le v
aria
tion
with
tem
pera
ture
.p ac
ac ≡
acet
ylac
eton
ato
q Lon
g-liv
ed r
adio
activ
e is
otop
e.r T
he h
igh
toxi
city
of
this
com
poun
d m
eans
its
dire
ct u
se s
houl
d be
str
ongl
y di
scou
rage
d [2
3].
s Ded
uced
fro
m r
efs.
24
and
25.
R. K. HARRIS et al.
© 2001 IUPAC, Pure and Applied Chemistry 73, 1795–1818
1800Ta
ble
2 T
he s
pin
prop
ertie
s of
qua
drup
olar
nuc
leia
.
Isot
opeb
Spin
cN
atur
alM
agne
ticM
agne
togy
ric
Qua
drup
ole
Freq
uenc
yR
efer
ence
Sam
ple
Lite
ratu
reL
ine-
wid
thR
elat
ive
rece
ptiv
ityi
abun
danc
e,c
mom
ent,d
ratio
,dm
omen
tera
tio,e
sam
ple
cond
ition
sgfo
r Ξ
fact
or,h
x/%
µ/µ N
γ/1
07ra
d s–1
T–1
Q/f
m2
Ξ/%
l/fm
4D
pD
C
2 Hj
10.
0115
1.21
2 60
0 77
4.10
6 62
7 91
0.28
6015
.350
609
(CD
3)4S
ine
at15
0.41
1.11
×10
–66.
52 ×
10–3
6 Li
17.
591.
162
5637
3.93
7 17
09–0
.080
814
.716
086
LiC
lD
2O, 9
.7 m
90.
033
6.45
×10
–43.
797 L
i3/
292
.41
4.20
4 07
5 05
10.3
97 7
013
–4.0
138
.863
797
LiC
lD
2O, 9
.7 m
921
0.27
11.
59 ×
103
9 Be
3/2
100
–1.5
20 1
36–3
.759
666
5.28
814
.051
813
BeS
O4
D2O
, 0.4
3 m
937
1.39
×10
–281
.510
B3
19.9
2.07
9 20
552.
874
6786
8.45
910
.743
658
BF 3.
Et 2O
CD
Cl 3k
2914
3.95
×10
–323
.211
B3/
280
.13.
471
0308
8.58
4 70
444.
059
32.0
83 9
74B
F 3.E
t 2OC
DC
l 3k29
220.
132
7.77
×10
2
14N
j1
99.6
320.
571
004
281.
933
7792
2.04
47.
226
317
CH
3NO
2ne
at/C
DC
l 3l9
211.
00 ×
10–3
5.90
17O
5/2
0.03
8–2
.240
77
–3.6
28 0
8–2
.558
13.5
56 4
57D
2One
at9
2.1
1.11
×10
–56.
50 ×
10–2
21N
e3/
20.
27–0
.854
376
–2.1
13 0
810
.155
7.89
4 29
6mN
ega
s, 1
.1 M
Pa9
140
6.65
×10
–63.
91 ×
10–2
23N
a3/
210
02.
862
9811
7.08
0 84
9310
.426
.451
900
NaC
lD
2O, 0
.1 M
914
09.
27 ×
10–2
5.45
×10
2
25M
g5/
210
.00
–1.0
12 2
0–1
.638
87
19.9
46.
121
635
MgC
l 2D
2O, 1
1 M
913
02.
68 ×
10–4
1.58
27A
l5/
210
04.
308
6865
6.97
6 27
1514
.66
26.0
56 8
59A
l(N
O3)
3D
2O, 1
.1 m
969
0.20
71.
22 ×
103
33S
3/2
0.76
0.83
1 16
962.
055
685
–6.7
87.
676
000
(NH
4)2S
O4
D2O
, sat
.9
611.
72 ×
10–5
0.10
135
Cl
3/2
75.7
81.
061
035
2.62
4 19
8–8
.165
9.79
7 90
9N
aCl
D2O
, 0.1
M9
893.
58 ×
10–3
21.0
37C
l3/
224
.22
0.88
3 19
982.
184
368
–6.4
358.
155
725
NaC
lD
2O, 0
.1 M
955
6.59
×10
–43.
8739
K3/
293
.258
10.
505
433
761.
250
0608
5.85
4.66
6 37
3K
Cl
D2O
, 0.1
M9
464.
76 ×
10–4
2.79
(40K
)4
0.01
17–1
.451
320
3–1
.554
285
4–7
.35.
802
018
KC
lD
2O, 0
.1 M
315.
26.
12 ×
10–7
3.59
×10
–3
(41K
)3/
26.
7302
0.27
7 39
6 09
0.68
6 06
8 08
7.11
2.56
1 30
5nK
Cl
D2O
, 0.1
M31
675.
68 ×
10–6
3.33
×10
–2
43C
a7/
20.
135
–1.4
94 0
67–1
.803
069
–4.0
86.
730
029o
CaC
l 2D
2O, 0
.1 M
322.
38.
68 ×
10–6
5.10
×10
–2
45Sc
7/2
100
5.39
3 34
896.
508
7973
–22.
024
.291
747
Sc(N
O3) 3
D2O
, 0.0
6 M
966
0.30
21.
78 ×
103
47T
i5/
27.
44–0
.932
94
–1.5
105
30.2
5.63
7 53
4T
iCl 4
neat
p9
290
1.56
×10
–40.
918
49T
i7/
25.
41–1
.252
01
–1.5
10 9
524
.75.
639
037
TiC
l 4ne
atp
9 83
2.05
×10
–41.
20
(50V
)q6
0.25
03.
613
7570
2.67
0 64
9021
.09.
970
309
VO
Cl 3
neat
/C6D
6l9
171.
39 ×
10–4
0.81
851
V7/
299
.750
5.83
8 08
357.
045
5117
–5.2
26.3
02 9
48V
OC
l 3ne
at/C
6D6l
93.
70.
383
2.25
×10
3
53C
r3/
29.
501
–0.6
12 6
3–1
.515
2–1
5.0
5.65
2 49
6K
2CrO
4D
2O, s
at.
930
08.
63 ×
10–5
0.50
755
Mn
5/2
100
4.10
4 24
376.
645
2546
33.0
24.7
89 2
18K
MnO
4D
2O, 0
.82
m9
350
0.17
91.
05 ×
103
59C
o7/
210
05.
247
6.33
242
.023
.727
074
K3[
Co(
CN
) 6]D
2O, 0
.56
m9
240
0.27
81.
64 ×
103
61N
i3/
21.
1399
–0.9
68 2
7–2
.394
816
.28.
936
051
Ni(
CO
) 4ne
at/C
6D6l
3335
04.
09 ×
10–5
0.24
063
Cu
3/2
69.1
72.
875
4908
7.11
1 78
90–2
2.0
26.5
15 4
73[C
u(C
H3C
N) 4]
[ClO
4]C
H3C
N, s
at.r
965
06.
50 ×
10–2
3.82
×10
2
65C
u3/
230
.83
3.07
4 65
7.60
4 35
–20.
428
.403
693
[Cu(
CH
3CN
) 4][C
lO4]
CH
3CN
, sat
.r9
550
3.54
×10
–22.
08 ×
102
67Z
n5/
24.
101.
035
556
1.67
6 68
815
.06.
256
803
Zn(
NO
3)2
D2O
, sat
.9
721.
18 ×
10–4
0.69
2
(69G
a)3/
260
.108
2.60
3 40
56.
438
855
17.1
24.0
01 3
54G
a(N
O3)
3D
2O, 1
.1 m
3439
04.
19 ×
10–2
2.46
×10
2
© 2001 IUPAC, Pure and Applied Chemistry 73, 1795–1818
NMR nomenclature 1801
71G
a3/
239
.892
3.30
7 87
18.
181
171
10.7
30.4
96 7
04G
a(N
O3)
3D
2O, 1
.1 m
3415
05.
71 ×
10–2
3.35
×10
2
73G
e9/
27.
73–0
.972
288
1–0
.936
030
3–1
9.6
3.48
8 31
5(C
H3)
4Ge
neat
s35
281.
09 ×
10–4
0.64
275
As
3/2
100
1.85
8 35
44.
596
163
31.4
17.1
22 6
14N
aAsF
6C
D3C
N, 0
.5 M
913
002.
54 ×
10–2
1.49
×10
2
(79B
r)3/
250
.69
2.71
9 35
16.
725
616
31.3
25.0
53 9
80N
aBr
D2O
, 0.0
1 M
913
004.
03 ×
10–2
2.37
×10
2
81B
r3/
249
.31
2.93
1 28
37.
249
776
26.2
27.0
06 5
18N
aBr
D2O
, 0.0
1 M
992
04.
91 ×
10–2
2.88
×10
2
83K
r9/
211
.49
–1.0
73 1
1–1
.033
10
25.9
3.84
7 60
0tK
rga
s36
502.
18 ×
10–4
1.28
(85R
b)5/
272
.17
1.60
1 30
712.
592
7050
27.6
9.65
4 94
3R
bCl
D2O
, 0.0
1 M
924
07.
67 ×
10–3
45.0
87R
bq3/
227
.83
3.55
2 58
28.
786
400
13.3
532
.720
454
RbC
lD
2O, 0
.01
M9
240
4.93
×10
–22.
90 ×
102
87Sr
9/2
7.00
–1.2
09 0
236
–1.1
63 9
376
33.5
4.33
3 82
2Sr
Cl 2
D2O
, 0.5
M37
831.
90 ×
10–4
1.12
91Z
r5/
211
.22
–1.5
42 4
6–2
.497
43
–17.
69.
296
298
Zr(
C5H
5)2C
l 2C
H2C
l 2, s
at.r
999
1.07
×10
–36.
2693
Nb
9/2
100
6.82
176.
5674
–32.
024
.476
170
K[N
bCl 6]
CH
3CN
, sat
.u9
760.
488
2.87
×10
3
95M
o5/
215
.92
–1.0
82–1
.751
–2.2
6.51
6 92
6N
a 2MoO
4D
2O, 2
Mv
91.
55.
21 ×
10–4
3.06
(97M
o)5/
29.
55–1
.105
–1.7
8825
.56.
653
695
Na 2M
oO4
D2O
, 2 M
v9
210
3.33
×10
–41.
9599
Tcq
9/2
–6.
281
6.04
6–1
2.9
22.5
08 3
26N
H4T
cO4
D2O
w9
12–
–99
Ru
5/2
12.7
6–0
.758
8–1
.229
7.9
4.60
5 15
1K
4[R
u(C
N) 6]
D2O
, 0.3
M9
201.
44 ×
10–4
0.84
810
1 Ru
5/2
17.0
6–0
.850
5–1
.377
45.7
5.16
1 36
9K
4[R
u(C
N) 6]
D2O
, 0.3
M9
670
2.71
×10
–41.
5910
5 Pd5/
222
.33
–0.7
60–1
.23
66.0
4.57
6 10
0K
2PdC
l 6D
2O, s
at.
2214
002.
53 ×
10–4
1.49
(113 In
)9/
24.
296.
1124
5.88
45
79.9
21.8
65 7
55In
(NO
3)3
D2O
, 0.1
Mx
3447
01.
51 ×
10–2
88.5
115 In
q9/
295
.71
6.12
565.
8972
81.0
21.9
12 6
29In
(NO
3)3
D2O
, 0.1
Mx
3449
00.
338
1.98
×10
3
121 Sb
5/2
57.2
13.
9796
6.44
35–3
6.0
23.9
30 5
77K
SbC
l 6C
H3C
N, s
at.u
941
09.
33 ×
10–2
5.48
×10
2
(123 Sb
)7/
242
.79
2.89
123.
4892
–49.
012
.959
217
KSb
Cl 6
CH
3CN
, sat
.u9
330
1.99
×10
–21.
17 ×
102
127 I
5/2
100
3.32
8 71
05.
389
573
–71.
020
.007
486
KI
D2O
, 0.0
1 M
916
009.
54 ×
10–2
5.60
×10
2
131 X
ej3/
221
.18
0.89
3 18
992.
209
076
–11.
48.
243
921y
XeO
F 4ne
at17
05.
96 ×
10–4
3.50
133 C
s7/
210
02.
927
7407
3.53
3 25
39–0
.343
13.1
16 1
42C
sNO
3D
2O, 0
.1 M
90.
016
4.84
×10
–22.
84 ×
102
(135 B
a)3/
26.
592
1.08
1 78
2.67
5 50
16.0
9.93
4 45
7B
aCl 2
D2O
, 0.5
M9,
3834
03.
30 ×
10–4
1.93
137 B
a3/
211
.232
1.21
0 13
2.99
2 95
24.5
11.1
12 9
28B
aCl 2
D2O
, 0.5
M9,
3880
07.
87 ×
10–4
4.62
138 L
aq5
0.09
04.
068
095
3.55
7 23
945
.013
.194
300
LaC
l 3D
2O/H
2Oz
3912
08.
46 ×
10–5
0.49
713
9 La
7/2
99.9
103.
155
6770
3.80
8 33
1820
.014
.125
641
LaC
l 3D
2O, 0
.01
M11
546.
05 ×
10–2
3.56
×10
2
177 H
f7/
218
.60
0.89
971.
086
336.
5(4
.007
)A–
– 1.
5 ×
104
2.61
×10
–41.
5417
9 Hf
9/2
13.6
2–0
.708
5–0
.682
137
9.3
(2.5
17)A
––
1.1
×10
47.
45 ×
10–5
0.43
818
1 Ta7/
299
.988
2.68
793.
2438
317.
011
.989
600
BK
TaC
l 6C
H3C
N, s
at.
401.
4 ×
104
3.74
×10
–22.
20 ×
102
Tabl
e 2
(Con
tinu
ed).
Isot
opeb
Spin
cN
atur
alM
agne
ticM
agne
togy
ric
Qua
drup
ole
Freq
uenc
yR
efer
ence
Sam
ple
Lite
ratu
reL
ine-
wid
thR
elat
ive
rece
ptiv
ityi
abun
danc
e,c
mom
ent,d
ratio
,dm
omen
tera
tio,e
sam
ple
cond
ition
sgfo
r Ξ
fact
or,h
x/%
µ/µ N
γ/1
07ra
d s–1
T–1
Q/f
m2
Ξ/%
l/fm
4D
pD
C
(con
tinu
es o
n ne
xt p
age)

R. K. HARRIS et al.
© 2001 IUPAC, Pure and Applied Chemistry 73, 1795–1818
1802
(185 R
e)5/
237
.40
3.77
106.
1057
218.
022
.524
600
BK
ReO
4D
2O, 0
.1 M
401.
5 ×
104
5.19
×10
–23.
05 ×
102
187 R
eq5/
262
.60
3.80
966.
1682
207.
022
.751
600
BK
ReO
4D
2O, 0
.1 M
401.
4 ×
104
8.95
×10
–25.
26 ×
102
189 O
sj3/
216
.15
0.85
1 97
02.
107
1385
.67.
765
400B
OsO
4C
Cl 4,
0.9
8 M
2298
003.
95 ×
10–4
2.32
(191 Ir
)3/
237
.30.
1946
0.48
1281
.6(1
.718
)A–
–89
001.
09 ×
10–5
6.38
×10
–2
193 Ir
3/2
62.7
0.21
130.
5227
75.1
(1.8
71)A
––
7500
2.34
×10
–50.
137
197 A
u3/
210
00.
191
271
0.47
3 06
054
.7(1
.729
)A–
–40
002.
77 ×
10–5
0.16
220
1 Hgj
3/2
13.1
8–0
.723
248
3–1
.788
769
38.6
6.61
1 58
3C(C
H3)
2HgD
neat
4120
001.
97 ×
10–4
1.16
209 B
i9/
210
04.
5444
4.37
50–5
1.6
16.0
69 2
88B
i(N
O3)
2H
NO
3/D
2O/H
2OE
920
00.
144
8.48
×10
2
a Exc
ludi
ng th
e la
ntha
nide
s, a
ctin
ides
, and
mos
t rad
ioac
tive
isot
opes
.b N
ucle
i in
pare
nthe
ses
are
cons
ider
ed to
be
not t
he m
ost f
avor
able
of
the
elem
ent c
once
rned
for
NM
R.
c Dat
a ar
e “r
epre
sent
ativ
e is
otop
ic c
ompo
sitio
ns”,
take
n fr
om R
osm
an e
t al
.[8]
, pp.
98–
104.
For
the
erro
r lim
its o
n th
e na
tura
l abu
ndan
ces,
see
Ros
man
et
al.[
8].
d Dat
a de
rive
d fr
om th
e co
mpi
latio
n in
Mill
s et
al.[
6] p
p. 9
8–10
4, w
hich
list
s va
lues
of
µ max
/ µN
= γ
hI /
µ N. F
or th
e er
ror
limits
, see
Mill
s et
al.
[6].
e Dat
a fr
om M
ills
et a
l.[6
], p
p. 9
8–10
4 (t
aken
mos
tly f
rom
Pyy
kko
[26]
and
Rag
hava
n [2
7])
and
upda
ted
from
Pyy
kko
[28]
. It s
houl
d be
not
ed th
at r
epor
ted
valu
es o
f Q
may
be
in e
rror
by
as m
uch
as20
–30%
. For
the
erro
r lim
its, s
ee P
yykk
o [2
8].
f Rat
io o
f th
e re
sona
nce
freq
uenc
y of
the
refe
renc
e to
that
of
the
prot
ons
of T
MS
at in
fini
te d
ilutio
n (i
n pr
actic
e at
ϕ=
1%
) in
CD
Cl 3.
g M ≡
mol
arity
in
mol
dm
–3(s
olut
ion)
; m
≡m
olal
ity i
n m
ol k
g–1(s
olve
nt).
Som
e re
sults
fro
m r
ef. 9
wer
e in
itial
ly r
efer
ence
d [7
] to
a T
MS
conc
entr
atio
n of
4.7
5 m
in
CD
Cl 3,
but
the
val
ues
are
cor-
rect
ed to
ref
er to
a d
ilute
(ϕ
= 1
%)
solu
tion
of T
MS
in C
DC
l 3.h l
= (
2I+
3)Q
2 /I2 (2
I–
1) [
5]. T
he v
alue
s ar
e qu
oted
, arb
itrar
ily, t
o 2
sign
ific
ant f
igur
es.
i Dp
is th
e re
cept
ivity
[5]
rel
ativ
e to
that
of
1 H w
here
as D
Cis
rel
ativ
e to
13C
. The
val
ues
are
give
n to
thre
e si
gnif
ican
t fig
ures
onl
y.j A
use
ful i
soto
pe o
f I
=1 – 2
exis
ts.
k 15%
by
volu
me
of B
F 3.E
t 2O in
CD
Cl 3.
l Smal
l am
ount
of
lock
sub
stan
ce (
ϕ≤
10%
) in
nea
t liq
uid,
exc
ept f
or 61
Ni (
whe
re ϕ
= c
a. 2
0% o
f C
6D6
is in
volv
ed).
mΞ
In r
easo
nabl
e ag
reem
ent w
ith a
val
ue d
educ
ed f
rom
a r
atio
giv
en in
ref
. 30.
n Ξde
duce
d fr
om d
ata
in r
ef. 3
1.o Ξ
dedu
ced
from
a r
atio
giv
en in
ref
. 32.
p Plus
C6D
12(ϕ
= 1
0%)
for
fiel
d/fr
eque
ncy
lock
pur
pose
s.q R
adio
activ
e, w
ith a
long
hal
f-lif
e.r C
onta
inin
g a
little
C6D
6(ϕ
≤10
%).
s With
con
vers
ion
fact
ors
appl
ied
by G
rang
er.
t The
dat
a in
ref
. 36
are
only
acc
urat
e to
4 d
ecim
al p
lace
s. T
he p
ropo
sal h
erei
n is
that
Ξ(83
Kr)
is d
efin
ed to
the
6 de
cim
al p
lace
s gi
ven.
u In C
H3C
N/C
D3C
N f
or 93
Nb,
121 Sb
, and
123 Sb
.v Pl
us a
sm
all q
uant
ity o
f N
aOH
.w
Sem
isat
urat
ed in
H2O
/D2O
.x Pl
us 0
.5 M
DN
O3.
Tabl
e 2
(Con
tinu
ed).
Isot
opeb
Spin
cN
atur
alM
agne
ticM
agne
togy
ric
Qua
drup
ole
Freq
uenc
yR
efer
ence
Sam
ple
Lite
ratu
reL
ine-
wid
thR
elat
ive
rece
ptiv
ityi
abun
danc
e,c
mom
ent,d
ratio
,dm
omen
tera
tio,e
sam
ple
cond
ition
sgfo
r Ξ
fact
or,h
x/%
µ/µ N
γ/1
07ra
d s–1
T–1
Q/f
m2
Ξ/%
l/fm
4D
pD
C
y Cal
cula
ted
from
the
valu
e fo
r 12
9 Xe
via
the
129 X
e:13
1 Xe
freq
uenc
y ra
tio.
z For
the
solu
tion
cond
ition
s, s
ee th
e re
fere
nce.
AV
alue
cal
cula
ted
from
lite
ratu
re d
ata
on n
ucle
ar m
agne
tic m
omen
ts.
BT
he p
ropo
sal h
erei
n is
to d
efin
e to
6 d
ecim
al p
lace
s, b
ut li
ne-w
idth
s ar
e ge
nera
lly s
uch
that
this
is u
nnec
essa
rily
acc
urat
e.C
Ded
uced
fro
m th
e 20
1 Hg:
199 H
g ra
tio g
iven
in r
ef. 4
1.D
The
hig
h to
xici
ty o
f th
is c
ompo
und
mea
ns it
s di
rect
use
sho
uld
be s
tron
gly
disc
oura
ged
[23]
.ESa
tura
ted
in c
onc.
HN
O3,
then
dilu
ted
with
an
equa
l vol
ume
of D
2O.
© 2001 IUPAC, Pure and Applied Chemistry 73, 1795–1818
NMR nomenclature 1803
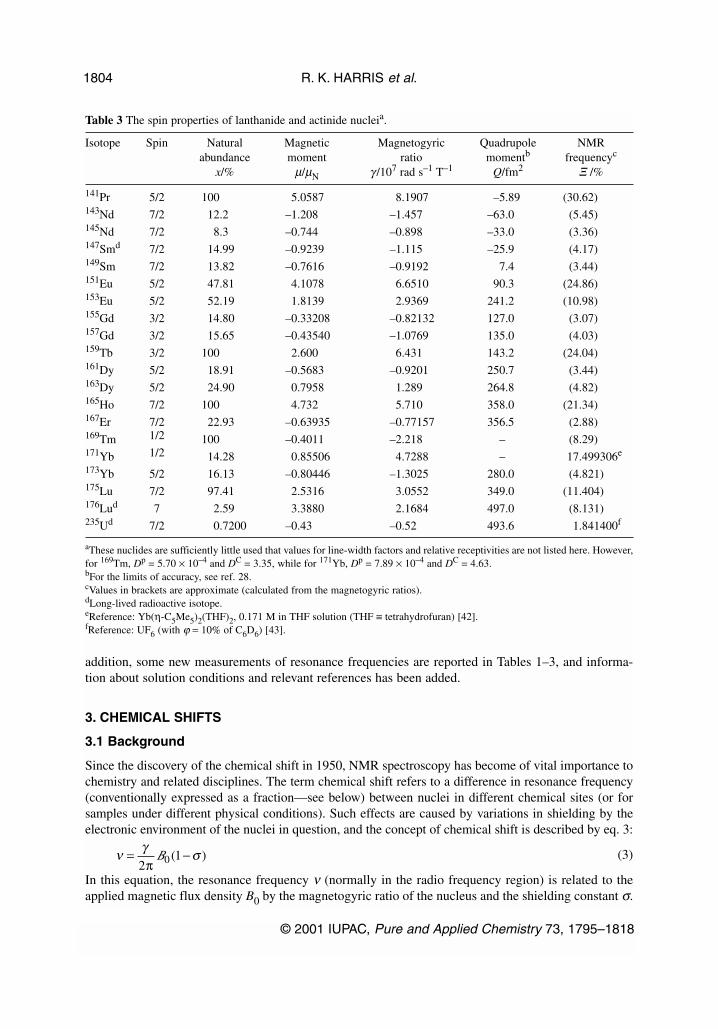
addition, some new measurements of resonance frequencies are reported in Tables 1–3, and informa-tion about solution conditions and relevant references has been added.
3. CHEMICAL SHIFTS
3.1 Background
Since the discovery of the chemical shift in 1950, NMR spectroscopy has become of vital importance tochemistry and related disciplines. The term chemical shift refers to a difference in resonance frequency(conventionally expressed as a fraction—see below) between nuclei in different chemical sites (or forsamples under different physical conditions). Such effects are caused by variations in shielding by theelectronic environment of the nuclei in question, and the concept of chemical shift is described by eq. 3:
(3)
In this equation, the resonance frequency ν (normally in the radio frequency region) is related to theapplied magnetic flux density B0 by the magnetogyric ratio of the nucleus and the shielding constant σ.
R. K. HARRIS et al.
© 2001 IUPAC, Pure and Applied Chemistry 73, 1795–1818
1804
Table 3 The spin properties of lanthanide and actinide nucleia.
Isotope Spin Natural Magnetic Magnetogyric Quadrupole NMRabundance moment ratio momentb frequencyc
x/% µ/µN γ /107 rad s–1 T–1 Q/fm2 Ξ /%
141Pr 5/2 100 5.0587 8.1907 –5.89 (30.62)143Nd 7/2 12.2 –1.208 –1.457 –63.0 (5.45)145Nd 7/2 8.3 –0.744 –0.898 –33.0 (3.36)147Smd 7/2 14.99 –0.9239 –1.115 –25.9 (4.17)149Sm 7/2 13.82 –0.7616 –0.9192 7.4 (3.44)151Eu 5/2 47.81 4.1078 6.6510 90.3 (24.86)153Eu 5/2 52.19 1.8139 2.9369 241.2 (10.98)155Gd 3/2 14.80 –0.33208 –0.82132 127.0 (3.07)157Gd 3/2 15.65 –0.43540 –1.0769 135.0 (4.03)159Tb 3/2 100 2.600 6.431 143.2 (24.04)161Dy 5/2 18.91 –0.5683 –0.9201 250.7 (3.44)163Dy 5/2 24.90 0.7958 1.289 264.8 (4.82)165Ho 7/2 100 4.732 5.710 358.0 (21.34)167Er 7/2 22.93 –0.63935 –0.77157 356.5 (2.88)169Tm 1/2 100 –0.4011 –2.218 – (8.29)171Yb 1/2 14.28 0.85506 4.7288 – 17.499306e
173Yb 5/2 16.13 –0.80446 –1.3025 280.0 (4.821)175Lu 7/2 97.41 2.5316 3.0552 349.0 (11.404)176Lud 7 2.59 3.3880 2.1684 497.0 (8.131)235Ud 7/2 0.7200 –0.43 –0.52 493.6 1.841400f
aThese nuclides are sufficiently little used that values for line-width factors and relative receptivities are not listed here. However,for 169Tm, Dp = 5.70 × 10⁻⁴ and DC = 3.35, while for 171Yb, Dp = 7.89 × 10⁻⁴ and DC = 4.63.bFor the limits of accuracy, see ref. 28.cValues in brackets are approximate (calculated from the magnetogyric ratios). dLong-lived radioactive isotope.eReference: Yb(η-C5Me5)2(THF)2, 0.171 M in THF solution (THF ≡ tetrahydrofuran) [42].fReference: UF6 (with ϕ = 10% of C6D6) [43].
ν γ σ= −2
1π
B0( )
In the International System of Units (SI), ν is expressed in hertz, Hz, (and is normally in the range oftens or hundreds of MHz), B0 is in tesla, T, and σ is a dimensionless fraction (generally reported in partsper million, ppm). Equation 3 is usually applied to the situation in isotropic media (liquids, solutions,and gases), for which σ can be represented as a scalar quantity. However, the value of σ depends onmolecular orientation in the applied magnetic field and can be represented by a scalar quantity onlybecause of the averaging caused by rapid isotropic molecular tumbling. Therefore, σ is a second-ranktensor and must be used in that form for many situations in the solid state and in liquid crystals (andtheir solutions).
Whereas frequencies can be measured very precisely, the same cannot be said of B0. Thus,although in principle chemists would like to know the absolute value of σ, it has long been recognizedthat only relative values can normally be obtained with precision. Therefore, from the early days ofNMR the concept of a standard reference signal has been developed. This requires a number of choic-es, among which are:
(i) whether to base chemical shifts on resonance frequencies or on shielding,(ii) which compound to use as a reference,(iii) what further conditions to specify for the reference situation, and(iv) whether to use separate references for different nuclei or to attempt to link them.
These matters will be dealt with in detail below.In the early days of NMR, resonance was normally achieved by varying the applied field B0. It
therefore seemed natural for positive chemical shifts to refer to situations where the sample resonatedat a higher field than that of the reference. Equation 3 shows that this corresponds to greater shieldingfor the sample than for the reference—a convention that was popular with theoreticians, who are prin-cipally concerned with σ. The first clear consensus on an experimental reference compound for protonNMR (by far the most popular nucleus at the time owing to its high sensitivity) was tetramethylsilane(TMS), introduced in 1958 by Tiers [44]. However, both for proton NMR and for other nuclei, variouschemical shift scales were used, with some increasing in the direction of increasing magnetic field andothers increasing in the direction of decreasing field (which corresponds to increasing frequency).
The convention recommended by IUPAC in the 1972 document [1], which mostly concerned pro-ton NMR, was that given in eq. 4:
(4)
in which the chemical shift of a resonance for nucleus X is defined. For protons referenced to TMS thisconvention gives positive values with increasing frequency, and most proton chemical shifts then turnout to be positive. A second IUPAC report [2] in 1976 extended the recommendations to include nucleiother than protons, always with a high-frequency-positive convention.
Of course, since σ is, in principle, a tensor quantity, so is δ. However, the present document dealsonly with the isotropic average value of δ, which is the usual value of relevance for solution-state NMR.The tensor properties of σ and δ may be the subject of a later document.
3.2 Recommendations endorsed
At this point, it is appropriate to list those recommendations of the previous two IUPAC reports onNMR which relate to chemical shifts [1,2] (including presentation of spectra) and which we endorse,with one exception noted under item 6. These relate to notational matters and are particularly directedat publications in chemical journals. In several places, we use different wording from the originalreports and in some cases extended meanings:
© 2001 IUPAC, Pure and Applied Chemistry 73, 1795–1818
NMR nomenclature 1805
δν ν
νX,sampleX,sample X,reference
X,reference=
−
×106
1. The nucleus giving rise to the spectrum concerned should always be explicitly stated in full or inabbreviation (e.g., 10B NMR or boron-10 NMR). The isotopic mass number should be givenexcept in cases without ambiguity. In the case of hydrogen NMR, the de facto usage is protonNMR, deuterium NMR, or tritium NMR, in spite of the inconsistency of the wording.Abbreviations such as PMR for proton NMR are strongly discouraged. The term “multinuclearNMR” is clumsy (a repeated word “nuclear”) and so is also to be discouraged. Where referenceto a variety of nuclei is required, multinuclear magnetic resonance should be written in full.
2. The graphical presentation of spectra should show frequency increasing to the left and positiveintensity increasing upwards.
3. The dimensionless scale for chemical shifts should be tied to a reference, which should be clear-ly stated. The procedures used must be carefully defined.
4. The dimensionless scale factor for chemical shifts should generally be expressed in parts per mil-lion, for which ppm is the appropriate abbreviation. The radio frequency of the reference, appro-priate to the nucleus in question and to the spectrometer in use, should always be quoted, withsufficient accuracy in relation to the numerical values of shifts listed. Unfortunately, older soft-ware supplied by manufacturers to convert from frequency units to ppm in FT NMR sometimesuses the carrier frequency in the denominator instead of the true frequency of the reference, whichcan lead to significant errors.
5. The chemical shift scale should be defined with respect to resonance frequencies, with the appro-priate sign convention (i.e., a positive sign should imply the sample resonates to high frequencyfrom that of the reference). In order to avoid ambiguities of sign, the term “chemical shift” shouldnot be used to describe variations in shielding.
6. The symbol δ (lower case Greek delta) should be used for chemical shift scales with the sign con-vention given above. Such a symbol should never be used to refer to shielding. These recom-mendations cohere with the definition of the δ-scale adopted in refs. 1 and 2. The definition of δin eq. 4 leads to a value with no units, and the 1972 document recommended that “ppm” be notstated explicitly (e.g., δ = 5.00, not δ = 5.00 ppm). However, this convention is widely ignored.Therefore, we do not endorse the omission of “ppm” in reporting values of δ (see Section 3.3).
7. The nucleus in question should be indicated as a subscript or in brackets, e.g., δC or δ(13C), unlessthere is no ambiguity.
8. As far as possible, full information should be given in publications regarding any factor that mightinfluence chemical shifts, such as:
(i) The physical state of the sample (solid, liquid, solution, or gas), with additional relevantfacts where necessary.
(ii) For solutions, the name of the solvent and the concentration of solute.(iii) The nature of the reference procedure, e.g., internal, external (coaxial tubes or substitution),
absolute frequency. (This aspect is discussed in detail in later sections of this article.)(iv) The name of the secondary referencing compound local to the nucleus in question and its
concentration. Note, however, that no reference compound needs to be added to the sampleif the unified scale described in Section 3.5 is used, although a chemical shift value withrespect to a recommended secondary reference compound, obtained via the unified scale,may still be quoted. In exceptional cases, where an isotope-specific secondary referencecompound must be used in the experimental measurement, a clear description of the refer-encing procedure should be given.
(v) The temperature and (if different from ambient) the pressure of the sample.(vi) Whether oxygen and other gases have been removed from the sample.(vii) Any chemicals present in the sample, in addition to the solvent and the compound under
investigation, and details of their concentrations.
R. K. HARRIS et al.
© 2001 IUPAC, Pure and Applied Chemistry 73, 1795–1818
1806
3.3 Definition and reporting of d scales
As mentioned above, the IUPAC Recommendation [1] dating from 1972 defined the proton chemicalshift scale in such a way that δ has no quoted units but is presumed to be in ppm. However, this rec-ommendation not to use “ppm” has not received acceptance in practice. It is a simple matter to rewriteeq. 4 in a general way that can lead validly to the units of ppm. We now define the chemical shift (forany nucleus X, using its local reference substance) by eq. 5:
(5)
that is, without the factor of 106. This leads, in general, to a very small number, M × 10–n. Normal prac-tice has been and will doubtless continue to be to use n = 6 and thus to express δ in ppm. With eq. 5 asthe definition of δ, eq. 6 provides a simple procedure for calculating the value of δ in ppm from meas-ured frequencies:
(6)
where the factor of 106 difference in the units of numerator and denominator is appropriately repre-sented by the units ppm.
This redefinition allows values to be quoted also in parts per billion, ppb = 10–9, (as is appropri-ate for some isotope effects) by expressing the numerator in eq. 6 in millihertz (mHz). Alternatively, theunits of eq. 6 could be altered to give % (relevant for some heavy-metal chemical shifts), but ppm willundoubtedly remain as the most common usage. IUPAC therefore recommends that the chemical shiftδ be defined by eq. 5 and that δ normally be expressed in ppm.
3.4 Referencing procedures
Accurate and consistent referencing is easy to visualize but hard to implement. For mobile isotropicmedia (liquids, solutions, and gases) there are several possible methods:
(a) Internal referencing, where the reference compound is added directly to the system under study.This method is used almost universally for 1H and 13C NMR. However, it is clearly limited by thesolubility, miscibility, or mutual reactions of the sample components and may be difficult toimplement for many samples in which a variety of nuclei are studied.
(b) External referencing, involving sample and reference contained separately in coaxial cylindricaltubes. A single spectrum is recorded, which includes signals from both the sample and the refer-ence compound.
(c) Substitution method: The use of separate cylindrical tubes for the sample and reference com-pound, with (in principle) spectra recorded individually for each. It is similar to external refer-encing in that sample and reference materials are not mixed, but there are significant differencesin the two procedures, as described later, which arise because of the common use of precisefield/frequency locking (usually via the 2H signal of a deuterated solvent). If locking is not used,the magnet should not be reshimmed between running the sample and reference solutions, sincethis changes the applied magnetic field.
(d) Referencing via direct measurement of the absolute frequency of the field/frequency lock signal,usually provided by the 2H resonance of an internally contained deuterated compound (frequent-ly the solvent). This method is discussed more fully in Section 3.6.
(e) Application of magic-angle spinning, usually with the substitution method, but also conceivablywith coaxial tubessee Section 3.8.
These methods all have various advantages and disadvantages. For (a) the shielding of the referencenucleus depends, to a greater or lesser extent, on the solvent, on the solute under study, and on the con-
© 2001 IUPAC, Pure and Applied Chemistry 73, 1795–1818
NMR nomenclature 1807
δ ν ν νX,sample X,sample X,reference X,reference( )= − /
δν ν
νX,sampleX,sample X,reference
X,reference/ ppm
( ) / Hz
/ MHz=
−
centration of both solute and reference owing to the effects of intermolecular interactions. These effectsmay be minimized by a judicious choice of solvent and reference compound, but they cannot be elim-inated. External reference procedures (b) generally require corrections arising from differences in bulkmagnetic susceptibility between sample and reference. These corrections depend on the geometryemployed for the sample containers. For the usual coaxial cylindrical arrangement, the correction is [45]
(7)
where k refers to the relevant volume magnetic susceptibility (in rationalized units) and ideally k = +1/6for a tube perpendicular to B0, k = –1/3 for a tube parallel to B0 (as is usual for a superconducting mag-net), and k = 0 for a tube inclined at the magic angle. These theoretical factors are calculated for infi-nite cylinders. In practice, they depend on the length of the liquid column and other geometrical factorsthat are not always under control. No correction is needed for spherical samples, but the production ofa truly spherical sample cell is generally not feasible. [Equation 7 is consistent with SI notation. A cor-responding expression in cgs form would substitute kcgs = 4πkSI along with a ∆χV term numericallyequal to ∆κ/4π. Many lists of magnetic susceptibility data give χV rather than κ.]
The substitution method uses the fact that, with the advent of stable, internally solvent-lockedspectrometers, it has become feasible to obtain accurate data by measuring the spectra of sample andreference in two separate experiments. If the sample and the reference compound are each dissolved inthe same solvent at low concentration (which, where feasible, we recommend), the substitution methodis equivalent to use of an internal reference, except that the reference substance does not contaminatethe sample or interact with it, chemically or physically. If the reference compound is a nearly neat liq-uid with only a small amount of the deuterated “solvent” to serve as a lock, the measured chemical shiftsmay be slightly different from those obtained with an internal reference because of differing molecularinteractions. It might appear that a magnetic susceptibility correction would be needed if the suscepti-bilities of sample and reference differ, but this is not the case. With the field/frequency lock establishedvia the deuterated solvent, the applied magnetic field simply shifts slightly to maintain the magneticinduction inside the sample tube constant so as to keep the 2H nuclei on resonance. There is, thus, a dis-tinct difference between the commonly used internally locked system, in which the magnetic inductionB0 is maintained constant and an unlocked (or externally locked) system in which the applied field H0is constant.
If the lock signal of the sample differs from that of the reference, a lock correction may need tobe applied according to:
(8)
Except for very strongly hydrogen-bonded systems [46–48], no primary isotope effects between protonand deuterium have been firmly established, and none are expected on theoretical grounds. Hence, thedifference between deuterium lock frequencies in eq. 8 may be obtained from a table of proton chemi-cal shifts. However, when polyhydrogenated groups are involved, corrections may be needed for sec-ondary isotope effects [46] arising from 1H → 2H replacement. When high precision is required themeasurement of the shift difference between the locks may be obtained via direct observation of thedeuterium spectrum of the two solvents, placed in coaxial tubes.
However, for most modern spectrometers, the manufacturers have incorporated compensatingprocedures for lock changes, largely for the users’ convenience of retaining the spectral window in thesame position on the screen or chart. Unfortunately, these procedures vary between manufacturers andbetween spectrometers of different ages from the same manufacturer, so no completely general com-ments on this question can be made here. NMR spectroscopists must refer to the relevant operatingmanual for details. In most cases with modern instruments, the effect is to keep the magnetic field insidethe samples constant when different lock compounds are used. In such situations, the correction termin brackets in eq. 8 is not necessary. Of course, the accuracy of the result clearly depends on what the
R. K. HARRIS et al.
© 2001 IUPAC, Pure and Applied Chemistry 73, 1795–1818
1808
( ) ( )true obs sample referenceδ δ κ κ− = −k
δ δ δ δtrue measured samplelock
referencelock = + −( )
manufacturers use for the term in brackets, generally present in a “look-up” table in the spectrometersoftware. We recommend that manufacturers give clear, explicit, and accurate guidance on their pro-cedures in this matter and quote their “look-up” tables prominently.
Another situation where isotope shifts have some effect is when signals of the reference com-pound are affected, for instance for 19F measurements. In this case, the signal is split into four lines withintensities approximately 27:27:9:1 because the natural-abundance isotopic ratio 35Cl:37Cl is ca. 3:1.Since CFCl3 is firmly accepted as the local reference for 19F, it is not reasonable to suggest a new alter-native. It is recommended that the reference signal is that of CF(35Cl)2(37Cl).
Earlier IUPAC documentation [1,2] did not suggest any specific composition for the referencesample, or choice of solvents. Ideally, for most referencing methods, a nonpolar solvent consisting ofnearly spherical molecules should be used, and measurements should be extrapolated to zero referenceconcentration. Clearly, such procedures are not generally feasible, so that caution always needs to beexercised when comparing shift data from different sources.
3.5 Unified scale
As NMR studies of various nuclei were initiated, each was, of necessity, treated independently, withsome substance containing the nuclide being studied selected as a reference compound. The result is avast collection of data in the literature for multinuclear magnetic resonance based on a large array ofreference compounds. The proliferation of reference substances is, however, unnecessary and in someways unhelpful. In a given magnetic field, all resonance frequencies form a single spectral range, andit is only because different nuclides resonate at markedly different frequencies that use of separate ref-erences has arisen. With modern instruments, in which all frequencies are derived from a single source,it is therefore possible to relate the observed frequencies of all nuclides in a particular sample to that ofa single primary reference—preferably the proton resonance of TMS.*
There are, however, two reasons for wishing to retain the concept of a separate reference for eachnucleus: (i) It is convenient to speak of, say, an aromatic 13C resonance at x ppm from the 13C line ofTMS, rather than always quoting a frequency to many significant figures, and (ii) many data tabulationsare available with values only expressed relative to separate heteronuclear references. Thus, for a uni-fied scale to be of practical use, there must be agreed frequency relations between a set of commonlyused secondary (heteronuclear) references and the primary reference. Measurements of such relationshave been reported sporadically since the time of early double-resonance experiments [49], and it hasbeen proposed to relate the separate reference frequencies to a primary standard originally defined fora magnetic field such that the 1H TMS signal is at exactly 100 MHz. These frequencies have been given[49] the symbol Ξ (capital Greek xi), and some tabulations have been presented [5,14,50–52]. However,it is clearer and more appropriate for users of modern high-field NMR spectrometers simply to defineΞ as the ratio of the secondary (isotope-specific) frequency to that of 1H in TMS in the same magneticfield. Therefore, it is convenient to express Ξ as a percentage by the use of eq. 9:
(9)
where vTMSobs is the measured 1H frequency of TMS. The use of percentage ensures that values of Ξ with
this recommendation are numerically identical to those based on the earlier [49] definition.Recently, the question of a unified reference has been addressed for multinuclear studies in bio-
molecular NMR: Wishart et al. [53] surveyed the relevant literature, pointed out inconsistencies in
© 2001 IUPAC, Pure and Applied Chemistry 73, 1795–1818
NMR nomenclature 1809
*TMS has a low boiling point (28 °C), which can be advantageous in facilitating removal from nonvolatile samples after use, butcan in other circumstances be a severe disadvantage. To overcome this problem, a substance such as [(CH3)3Si]4C (m.p. 267 °C),can be used as a reference [54] and the results converted to the TMS standard.
Ξ / /% Xobs
TMSobs= ( )100 ν ν
existing practices, and proposed the use of a single internal reference—for their purposes, one that ishighly soluble in water (sodium 2,2-dimethyl-2-silapentane-5-sulfonate, DSS*, preferably deuterated atthe CH2 positions). Operationally, as discussed in the following sections, it is often easier to obtain thenecessary heteronuclear frequency data directly via the lock signal than to make additional measure-ments with various reference materials for different nuclei.
IUPAC recommends that a unified chemical shift scale for all nuclides be based on the proton res-onance of TMS as the primary reference. This recommendation is in line with the “Recommendationsfor presentation of NMR structures of proteins and nucleic acids”, recently promulgated [4] by IUPACin conjunction with the International Union of Biochemistry and Molecular Biology and theInternational Union of Pure and Applied Biophysics, which include recommended Ξ values for severalnuclei of importance in such studies for aqueous solutions, but which uses the proton resonance of DSSas the primary standard because of its solubility in water (see Section 3.9).
In conformity with other areas in physical chemistry, it would be desirable to define a precisestandard state—for example, pure liquid TMS or TMS at infinite dilution in CDCl3 at 293 K and 1 bar.[Indeed, in principle a better standard might be 3He or 129Xe in the gaseous state at a very low pressure(see ref. 55 and references therein), but this is not practicable.] However, in this document we concen-trate on aspects that are of immediate practical utility. Temperature and pressure effects on chemicalshifts for solutions and solid samples are sufficiently small for the lighter elements to be generallyignored for most chemical usage of NMR (largely carried out at ambient probe temperature and pres-sure), so we make no detailed recommendations regarding these parameters. References 55 and 56 con-tain some data on the temperature dependence of 1H and 13C resonances for TMS. Variations of solventand/or change in sample concentration are known to have important effects on many chemical shifts,but they are relatively small for a symmetrical, nonpolarizable molecule like TMS.
To assess the magnitude of the concentration effect, measurements have been obtained [12] of theproton chemical shift for TMS in solutions of volume fractions, ϕ = 0.01%, 1%, and 80% in CDCl3 (seethe Appendix). The 1H NMR frequency of TMS (ϕ = 1%) in chloroform is essentially at the infinitedilution level, the value for a ϕ = 0.01% solution differing by of the order of 10–7% in Ξ , which is nor-mally reported to only 10–6%. However, for a ϕ = 80% solution Ξ is 9 × 10⁻⁶% larger than for a ϕ =1% solution. Therefore, for the primary reference in multinuclear magnetic resonance, we recommenda dilute solution (approximately ϕ = 1% or less) of TMS in CDCl3. This recommendation does not pre-clude the use of TMS in other solvents as alternative references for 1H NMR, and it is consistent withthe use of DSS in aqueous solutions (see Section 3.7).
These recommendations should not be taken in any way to preclude the design and implementa-tion of experiments to measure specific properties, such as very high precision relative frequency meas-urements and special sample arrangements designed to minimize certain molecular interactions. Datawill continue to be reported in the most effective way for the purpose at hand, but we believe that adop-tion of the unified chemical shift scale will facilitate comparison of the vast majority of NMR frequen-cy measurements. The choice of the base reference as the proton signal of TMS is in accord with thevirtually universal use of this signal as a reference for proton NMR.**
If the recommendation for use of a unified scale is widely adopted, future measurements shouldbe reported as Ξ values. However, to assure consistency with data already in the literature, it is impor-tant to have a set of Ξ values of sufficient accuracy to permit conversion between the primary TMS ref-erence and at least one secondary homonuclear reference for each nuclide (other than 1H). Tables 1–3list values of Ξ for a number of commonly used secondary references, which are hereby recommended
R. K. HARRIS et al.
© 2001 IUPAC, Pure and Applied Chemistry 73, 1795–1818
1810
*The name sodium 3-(trimethylsilyl)propane-1-sulfonate is strictly the correct one for this compound.**With hindsight, it might have been better to choose the 29Si signal of TMS since that is arguably even less susceptible to out-side influence than the 1H resonance (silicon being at the symmetry center of the molecule). However, because of the largeamount of literature based on the proton signal, we recommend that the primary reference remain the 1H signal of TMS.
for further use. These values come from a number of sources, as indicated in the tables. However, itshould be noted that a number of these compounds are hazardous [for example, Me2Se, Me2Te,Ni(CO)4, and, especially, Me2Hg]. The unified scale has the advantage that its use avoids direct han-dling of any secondary references (see Section 3.6). For most of the nuclides listed in Table 3, there arefew data available, and the values of Ξ are simply approximations based on magnetogyric ratios.
However, for Tables 1 and 2, values of Ξ are stated for almost all nuclides to 10–6%. For 69 of themost commonly studied nuclides, careful measurements of Ξ have been made specifically for the pur-pose of this tabulation. The frequencies of 13C and 29Si were determined for samples of TMS in dilutesolution in CDCl3 [12,13,15]. The remaining 67 measurements were made [9] by the substitutionmethod (as described in the Appendix). Since all observation frequencies and the 2H lock frequency arederived from a single source, the measured frequencies (Ξ) are reproducible to better than 10–7% andare reported to 10–6%. Experimental details are given in the Appendix. Values of Ξ for the remaining30 nuclides in Tables 1 and 2 are taken from published values, which have been converted to be con-sistent with the choice of the 1H signal for TMS in very dilute solution as the primary reference. Theliterature cited should be consulted for details of the experimental procedure and for estimates of exper-imental precision and accuracy.
For 1H and 13C NMR, internal referencing has been used almost exclusively, primarily to avoidbulk magnetic susceptibility effects, which can be of the same magnitude as some chemical shift dif-ferences that are interpretable with regard to chemical structure. The recommended reference for thesenuclides is, therefore, TMS in a dilute solution in CDCl3, and for consistency this reference is recom-mended also for 29Si. For most other nuclides, magnetic susceptibility effects are small relative tochemical shift differences, and many of the published data have been reported relative to an external orreplacement reference, often a neat liquid where feasible. To provide maximum utility, most of theentries in Tables 1 and 2 refer to such neat liquids or concentrated solutions, usually with a minimumamount of deuterated substance added to provide a stable lock. Of course, a very large number of suchreference materials and lock substances could be used, but as described in Section 3.6, it is relativelysimple to convert from one to another if necessary.
Values of Ξ can generally be determined to 10–6%, which represents resonance measurement dif-ferences of only 0.01 ppm for nuclides with large values of γ to 0.5 ppm for nuclides with very low γvalues (an imprecision that is usually negligible compared with their generally large chemical shiftranges). Under the unified scale, chemical shifts can thus be reported to a precision that is often depend-ent on line-width or other sample-related factors, rather than instrumental factors. Since literature datafor a number of nuclides are usually referred to a secondary reference and hence are often of consider-ably lower precision, small discrepancies in values of Ξ are of little practical consequence in mostinstances.
3.6 Practical application of the unified scale
Modern NMR spectrometers invariably include field/frequency locking and frequency synthesizers, sothat all frequencies are reliably interrelated by locking to a master clock frequency. There are two waysin which this fact can be used to determine chemical shifts, either directly on the Ξ scale or with respectto a recognized reference for the nucleus in question. These two ways are equivalent to the use of theconventional internal reference and substitution methods, respectively. In the former case, if a nucleusX is to be studied, and the sample can be prepared with a small amount of TMS, then two direct fre-quency measurements made while maintaining the same 2H locking conditions will provide the chem-ical shift of X on the unified scale according to eq. 9. If this procedure is applied to a series of samples,the effect is to replace “medium effects” on the shielding of X (given by measurements using a refer-ence compound containing the nuclide X) by medium effects on the shielding of 1H in TMS. In gener-al, this should result in a reduction of medium effects due to the referencing procedure, which is desir-able. Clearly, the substitution method can be used similarly and is particularly valuable when it is not
© 2001 IUPAC, Pure and Applied Chemistry 73, 1795–1818
NMR nomenclature 1811
convenient to add TMS to the sample. Equation 9 is still pertinent. However, as noted in Section 3.4,medium effects may vary to some extent if different concentrations of sample and reference are used.
In the future, reporting of chemical shift data as Ξ values may become more common and accept-able. Conversion of Ξ values to conventional chemical shifts relative to a reference of an X-containingcompound requires only subtraction of the Ξ value of a suitable homonuclear reference, as given inTables 1 and 2, followed by division by the Ξ value of the homonuclear reference. Thus:
δX / ppm = 106 (ΞX,sample – ΞX,reference) / ΞX,reference (10)
The widespread use of a 2H lock for NMR measurements on isotropic samples suggests a modi-fication of the substitution approach, since the relevant reference frequency should not vary with time.Thus, the chemical shifts of the X nuclei can, in principle, be determined on the unified (TMS-based)scale merely by measuring the resonance frequency of the sample and using a predetermined referencefrequency for the nuclide in question. Thus, only one (sample) tube is required and no reference sub-stance needs to be added. The predetermined reference frequency is obtained by measuring the protonresonance of TMS under similar conditions to the sample (i.e., with the same lock compound) in a sin-gle experiment for the spectrometer being used. Then, the frequency of the usual secondary referencefor the X nucleus can be calculated using the predetermined value of νTMS:
νreference = νTMS × Ξreference / 100% (11)
where Ξreference takes the appropriate value given in Tables 1–3. Thence, the chemical shift (or the valueof ΞX) for the sample can be readily derived. If the lock substance in the sample solution is not the sameas that of the reference solution, a lock correction must be applied (eq. 8).
As an example, suppose that a 77Se resonance has been measured on a compound dissolved inacetone-d6, resulting in a value:
νsample = 76 344 378 Hz
On this spectrometer, the 1H resonance of a ϕ = 1% solution of TMS in CDCl3 has been found at400 103 342 Hz when the spectrometer was installed. The reference frequency of selenium is then, fromTable 1:
400 103 342 Hz × 19.071 513 ÷ 100 = 76 305 761 Hz
The proton chemical shifts of the resonances of the lock compounds are:
δH(CHCl3) = 7.27 ppm and δH(acetone) = 2.17 ppm
Then:
δSe, sample = (76 344 378 – 76 305 761)/76.305 761 + (2.17 – 7.27) = 501.0 ppm
Since this is still basically a substitution method, an error will arise if the 2H frequency of the solventhas been influenced by the particular sample used. For many samples that consist of dilute solutions theerror is small, and for many nuclei with large chemical shift ranges the error introduced in this way isprobably smaller than would occur if a homonuclear (X) reference were used in the conventional man-ner.
Reporting of ΞX and δX measurements in future heteronuclear magnetic resonance studies willultimately lead to a large set of consistent data, provided that values of Ξ X,ref are established and usedconsistently in all future work. Therefore, particularly for comparison with chemical shifts reported rel-ative to a homonuclear (X) reference via conventional internal referencing procedures, it is essential thatthe values of Ξ in Tables 1 and 2 represent the accepted values for the substances listed (which are the“best” available at the present time). We therefore recommend that the defined local chemical shift scalezero values are established as those listed in Tables 1 and 2, and that such definitions are not subjectto future change arising from remeasurement even where this results in increasing accuracy for the ref-
R. K. HARRIS et al.
© 2001 IUPAC, Pure and Applied Chemistry 73, 1795–1818
1812
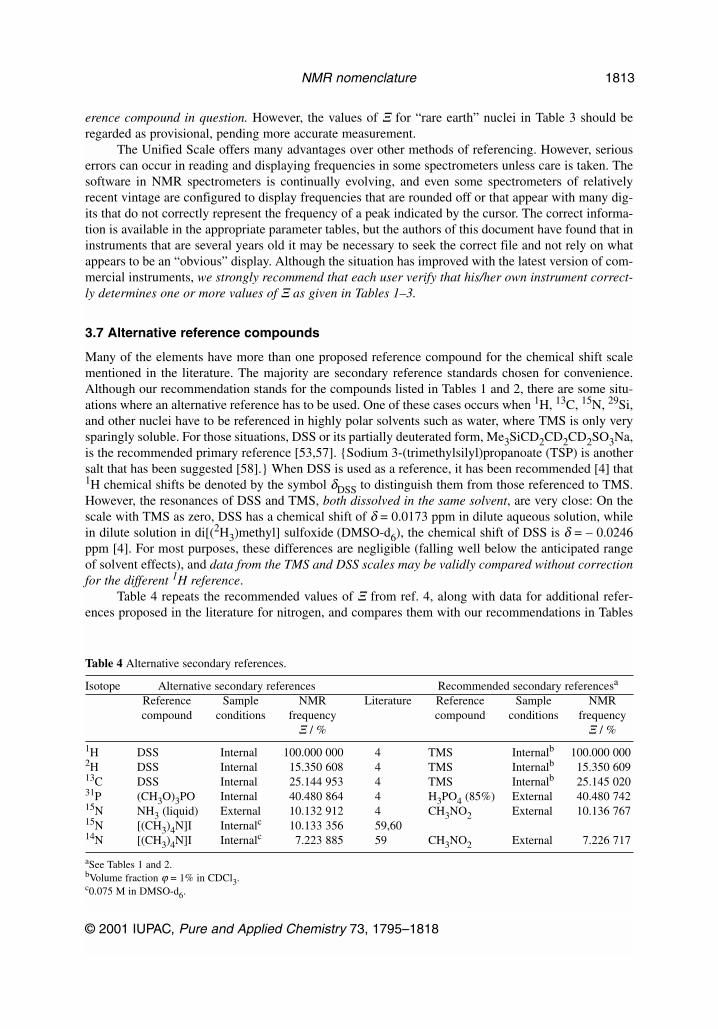
erence compound in question. However, the values of Ξ for “rare earth” nuclei in Table 3 should beregarded as provisional, pending more accurate measurement.
The Unified Scale offers many advantages over other methods of referencing. However, seriouserrors can occur in reading and displaying frequencies in some spectrometers unless care is taken. Thesoftware in NMR spectrometers is continually evolving, and even some spectrometers of relativelyrecent vintage are configured to display frequencies that are rounded off or that appear with many dig-its that do not correctly represent the frequency of a peak indicated by the cursor. The correct informa-tion is available in the appropriate parameter tables, but the authors of this document have found that ininstruments that are several years old it may be necessary to seek the correct file and not rely on whatappears to be an “obvious” display. Although the situation has improved with the latest version of com-mercial instruments, we strongly recommend that each user verify that his/her own instrument correct-ly determines one or more values of Ξ as given in Tables 1–3.
3.7 Alternative reference compounds
Many of the elements have more than one proposed reference compound for the chemical shift scalementioned in the literature. The majority are secondary reference standards chosen for convenience.Although our recommendation stands for the compounds listed in Tables 1 and 2, there are some situ-ations where an alternative reference has to be used. One of these cases occurs when 1H, 13C, 15N, 29Si,and other nuclei have to be referenced in highly polar solvents such as water, where TMS is only verysparingly soluble. For those situations, DSS or its partially deuterated form, Me3SiCD2CD2CD2SO3Na,is the recommended primary reference [53,57]. {Sodium 3-(trimethylsilyl)propanoate (TSP) is anothersalt that has been suggested [58].} When DSS is used as a reference, it has been recommended [4] that1H chemical shifts be denoted by the symbol δDSS to distinguish them from those referenced to TMS.However, the resonances of DSS and TMS, both dissolved in the same solvent, are very close: On thescale with TMS as zero, DSS has a chemical shift of δ = 0.0173 ppm in dilute aqueous solution, whilein dilute solution in di[(2H3)methyl] sulfoxide (DMSO-d6), the chemical shift of DSS is δ = – 0.0246ppm [4]. For most purposes, these differences are negligible (falling well below the anticipated rangeof solvent effects), and data from the TMS and DSS scales may be validly compared without correctionfor the different 1H reference.
Table 4 repeats the recommended values of Ξ from ref. 4, along with data for additional refer-ences proposed in the literature for nitrogen, and compares them with our recommendations in Tables
© 2001 IUPAC, Pure and Applied Chemistry 73, 1795–1818
NMR nomenclature 1813
Table 4 Alternative secondary references.
Isotope Alternative secondary references Recommended secondary referencesa
Reference Sample NMR Literature Reference Sample NMR compound conditions frequency compound conditions frequency
Ξ / % Ξ / %
1H DSS Internal 100.000 000 4 TMS Internalb 100.000 0002H DSS Internal 15.350 608 4 TMS Internalb 15.350 60913C DSS Internal 25.144 953 4 TMS Internalb 25.145 02031P (CH3O)3PO Internal 40.480 864 4 H3PO4 (85%) External 40.480 74215N NH3 (liquid) External 10.132 912 4 CH3NO2 External 10.136 76715N [(CH3)4N]I Internalc 10.133 356 59,6014N [(CH3)4N]I Internalc 7.223 885 59 CH3NO2 External 7.226 717
aSee Tables 1 and 2.bVolume fraction ϕ = 1% in CDCl3.c0.075 M in DMSO-d6.
1 and 2. For 13C studies in aqueous solution, ref. 4 recommends using the 13C methyl resonance of DSS,rather than that of TMS, as the secondary reference. Carbon-13 chemical shifts based on DSS and TMSdiffer by about 2 ppm, which can cause confusion if not clarified. We recommend that when 13C chem-ical shifts are referenced to DSS, that point should be made clear by using a notation such as δDSS(13C).
Reference 4 recommends use of trimethyl phosphate (internal) as a secondary reference for 31Pstudies in aqueous solution, whereas Table 1 recommends 85% phosphoric acid (external), which hasbeen used more widely, particularly for chemical systems where use of an internal reference is not fea-sible. The two secondary references differ by about 3 ppm, so it is important to specify which is beingused.
Several reference compounds have been used historically for nitrogen NMR, partly resulting fromthe very different properties and natural abundances of the two nuclides (14N and 15N). Nitromethaneas either an internal or external reference has been the most widely used for 14N and to some extent for15N, while liquid ammonia has been a popular external reference for 15N. Ammonium and tetramethy-lammonium salts have been used as internal references for both 14N and 15N. Reference 4 recommendsliquid NH3 as a secondary reference for 15N in aqueous solutions, since most biochemical applicationsof 15N NMR have used this reference. In Tables 1 and 2 we recommend nitromethane as a reference, inline with common usage in many other applications. The values of Ξ for different nitrogen referencecompounds are presented in Table 4, along with those for tetramethylammonium iodide, which has beensuggested as an internal reference for both 14N and 15N since the tetrahedral geometry results in sharplines for both isotopomers.
For most of the nuclei listed in Tables 1 and 2, Ξ values are listed for only one homonuclear ref-erence, since conversions to other reference compounds can be readily made from literature values.
3.8 Magic-angle spinning
It has been shown [61–63] that, in theory, bulk isotropic magnetic susceptibility effects are eliminatedby spinning an infinitely long cylindrical sample with its axis at the magic angle (54.7°) to the staticmagnetic field of an NMR spectrometer. Therefore, in principle, magic-angle spinning (MAS) can beused in the external referencing method to obtain chemical shifts free from bulk susceptibility problems.Whereas this technique was proposed in the context of solid-state NMR (see below), its utility appliesequally well to the solution state [64,65]. In practice, an infinitely long cylinder is not necessary toreduce bulk susceptibility effects on chemical shifts to an acceptable level. Strictly speaking, to correctfor isotropic bulk magnetic susceptibility effects, it is also not necessary to spin at the magic angle, butmerely to orient the cylinder containing the sample at the magic angle (see eq. 7). However, spinningmay narrow the lines significantly and so is normally essential for accurate chemical shift measurement.
3.9 Solids
Sample-handling procedures differ substantially for solids from those appropriate for solutions, andthere are clear advantages to using suitable solids as secondary references. This is almost always doneusing sample replacement. However, the spectrometers are generally used without field/frequency lock-ing, so that the resulting chemical shifts are inevitably less accurate than those for solutions. This is nota significant problem, because line-widths are usually substantially greater than those for solutions andthey impose an upper limit to accuracy. High-resolution NMR of solids almost invariably relies onmagic-angle spinning, and, as discussed in Section 3.8, this eliminates the effects of differences in bulkisotropic magnetic susceptibilities. Early papers [61,62] addressed this matter, and a recent review byVanderHart [45], which refers to both liquids and solutions, further discusses the influence of MAS forreferencing spectra. Unfortunately, the situation is simple only for systems with isotropic magnetic sus-ceptibility. VanderHart [45] discusses the case of anisotropic susceptibility, but there has been to date
R. K. HARRIS et al.
© 2001 IUPAC, Pure and Applied Chemistry 73, 1795–1818
1814
little experimental work in this area. However, in general it may be taken that, within the accuracy ofmeasurement, referencing by sample replacement under MAS conditions in an unlocked but stablespectrometer is to a good approximation equivalent to the substitution method as described in Section3.5.
Several papers [66–68] take advantage of the MAS technique to suggest secondary solid stan-dards for practical use in solid-state NMR. For example, the 13C signals of solid adamantane, glycine,hexamethylbenzene, and [(CH3)3Si]4Si have been referenced to those for liquids and solutions usingMAS, and data were reported to accuracies in the region of 0.004–0.04 ppm.
Chemical shift referencing for solid-state NMR is not yet at the stage where much further discus-sion is warranted here, so the only recommendation that we make is for referencing procedures to bealways clearly and carefully stated in publications.
4. SUMMARY OF RECOMMENDATIONS
In addition to the endorsements of earlier Recommendations stated in Section 3.2 above, IUPAC re-commends the following:
(a) Equation 5 should be used to define chemical shift scales, with symbol δ and with ppm (or ppbor %, as appropriate) explicitly stated after the numerical values. Equation 6 provides a simpleway to calculate chemical shift values in ppm.
(b) The 1H signal of tetramethylsilane in dilute solution (ca. volume fraction ϕ = 1% in CDCl3)should be used as the primary internal or substitution reference for the resonance frequencies (andhence chemical shifts) for all nuclei. However, for aqueous solutions, the recommendations of ref.4 are supported.
(c) The secondary references listed in Tables 1 and 2 may be used for the nuclei of the various ele-ments, with their Ξ taking the fixed values given (not subject to revision).
(d) Internal referencing may be used for solutions, but its limitations should be recognized. (e) For solution-state measurements, referencing via an internal 2H lock signal may be used, either
to give the value of Ξ directly or to calculate the chemical shift with respect to the relevant sec-ondary reference (via eq. 8, where relevant).
(f) Referencing by the substitution method with field/frequency lock spectrometers may also be usedfor solutions.
(g) External referencing for either liquids or solids may be carried out with magic-angle spinning.(h) External referencing by means other than (f) and (g) is to be discouraged unless corrections are
applied for bulk magnetic susceptibility effects.(i) In all circumstances, and especially where strict adherence to these Recommendations is not fea-
sible, details of experimental procedures should be given clearly so that results may be validlyintercompared.
ACKNOWLEDGMENTS
We thank H. J. C. Yeh (National Institutes of Health), A. M. Kenwright (University of Durham), andB. Ancian (Université de Paris VII) for measurements of Ξ for 13C and 29Si in solutions of TMS inCDCl3. Other special measurements of Ξ have also been made by C. Brevard, R. Hoffman, J. Raya,M. Bourdonneau, T. Meersmann, B. Ancian, and L. Helm. We are also grateful to W. Bremser, whoparticipated in some of the early discussions on the topic of these recommendations, and to J. Kowalewski and G. Martin for comments and encouragement. Specific comments were receivedfrom members of IDCNS (W. V. Metanomski, K. Hatada, A. D. Jenkins, J. W. Lorimer, W. H. Powell,S. E. Schwartz, A. J. Thor, H. A. Favre, T. Cvitaš) and a wide range of NMR experts and others (A. D. McNaught, D. L. VanderHart, D. T. Burns, M. Duteil, J. R. Everett, B. E. Mann, W. McFarlane,
© 2001 IUPAC, Pure and Applied Chemistry 73, 1795–1818
NMR nomenclature 1815
P. S. Pregosin, B. Mandava, W. von Philipsborn, T. D. W. Claridge, C. Ye, D. Neuhaus, P. Jonsen, G. Hägele, J. C. Lindon, P. E. Meadows, B. Wrackmeyer, K. Mizuno, T. Richert); we are very grate-ful for their assistance and guidance. P. Pyykko very helpfully supplied details of his review of quadru-pole moments in advance of publication, and R. Hoffman not only supplied data for Ξ on several nucleibut also made many pertinent and useful suggestions.
APPENDIX
As noted in the body of this document, a number of new experimental measurements have been madeto verify values of Ξ for various nuclides. Experimental details are given here.
Concentration dependence of dH (TMS) [12]. Measurements were made with a Varian VXR-500S spectrometer, sample at ambient probe temperature (about 23 °C), locked onto the signal forCDCl3. Measured 1H frequencies were as follows:
ϕ = 0.01%: 499.872 5048 MHzϕ = 1%: 499.872 5054 MHzϕ = 80%: 499.872 5495 MHz
N for 13C and 29Si. Three measurements were made of Ξ (13C) for TMS in CDCl3 at ϕ = 1%, allat ambient probe temperature using the following spectrometers: Varian VXR-500S [13], Ξ = 25.1450188%; Varian Unity-300 [12], Ξ = 25.145 0202%; and Varian Inova-500 [13], Ξ = 25.145 0196%. Thereported value [15] (Table 1) of Ξ (29Si) for TMS in CDCl3 at ϕ = 1% was obtained at ambient probetemperature using a Bruker Avance-400 spectrometer.
Other values of N. Most of the remaining 67 new measurements presented in Tables 1 and 2 weremade by the substitution method (as described above) with a Bruker Model MSL spectrometer, operat-ing at a nominal frequency of 300 MHz for 1H, and with corrections applied for the lock signals (seeequation 8) [9]. However, Ξ was measured for the following nuclei using a Bruker Avance-400 spec-trometer: 2H, 17O, 45Sc, 47Ti, 49Ti, 55Mn, 75As, 81Br, 87Rb, 127I, 131Xe, 133Cs, 135Ba, and 137Ba. The21Ne value was measured [9] using a Chemagnetics Infinity 600. All 67 measurements were made atambient probe temperature, approximately 298–300 K. The replacement reference samples used wereeither a concentrated solution (m = 4.75 mol kg–1, ϕ = 80%) of TMS in CDCl3, or a ϕ = 1% solutionof TMS in CDCl3. In the former case, the values have been converted to refer to TMS (ϕ = 1%) inCDCl3 (see above).
REFERENCES
1. “Recommendations for the presentation of NMR data for publication in chemical journals”, PureAppl. Chem. 29, 627 (1972).
2. “Presentation of NMR data for publication in chemical journals – B. Conventions relating to spec-tra from nuclei other than protons”, Pure Appl. Chem. 45, 217 (1976).
3. R. K. Harris, J. Kowalewski, S. C. de Menezes. “Parameters and symbols for use in nuclear mag-netic resonance”, Pure Appl. Chem. 69, 2489 (1997).
4. J. L. Markley, A. Bax, Y. Arata, C. W. Hilbers, R. Kaptein, B. D. Sykes, P. E. Wright, K.Wüthrich. “Recommendations for the presentation of NMR structures of proteins and nucleicacids”, Pure Appl. Chem. 70, 117 (1998).
5. NMR and the Periodic Table, R. K. Harris and B. E. Mann (Eds.), Academic Press (1978).6. I. Mills, T. Cvitaš, K. Homann, N. Kallay, K. Kuchitsu. Quantities, Units and Symbols in Physical
Chemistry, 2nd ed., published for IUPAC by Blackwell Scientific Publications (1993).7. R. K. Harris. Encyclopedia of Nuclear Magnetic Resonance, D. M. Grant and R. K. Harris (Eds.-
in-Chief), 5, 3301, Wiley, Chichester (1996).8. K. J. R. Rosman and P. D. P. Taylor. Pure Appl. Chem. 70, 217 (1998).
R. K. HARRIS et al.
© 2001 IUPAC, Pure and Applied Chemistry 73, 1795–1818
1816
9. P. Granger, J. Raya, M. Bourdonneau, L. Helm, T. Meersmann. Measurements previously unpub-lished in the primary literature. See the Appendix for details.
10. J. P. Bloxsidge, J. A. Elvidge, J. R. Jones, R. B. Mane, M. Saljoughian. Org. Magn. Reson. 12,574 (1979).
11. R. Hoffman. Private communication.12. H. J. C. Yeh. Previously unpublished work.13. A. M. Kenwright. Previously unpublished work.14. S. Brownstein and J. Bornais. J. Magn. Reson. 38, 131 (1980).15. B. Ancian. Previously unpublished work.16. H. T. Edzes. Magn. Reson. Chem. 30, 850 (1992).17. P. L. Goggin, R. J. Goodfellow, F. J. S. Reed, J. Chem. Soc., Dalton Trans. 576 (1974); S.
J. Anderson, J. R. Barnes, P. L. Goggin, R. J. Goodfellow. J. Chem. Res. (M), 3601 (1978).18. R. Benn and A. Rufinska. Angew. Chem., Int. Ed. Engl. 25, 861 (1986).19. J. D. Kennedy and W. McFarlane. J. Chem. Soc., Perkin Trans. 2 1187 (1977).20. M. Gerken and G. J. Schrobilgen. Coord. Chem. Rev. 197, 335 (2000).21. G. A. Schumacker and G. J. Schrobilgen. Inorg. Chem. 23, 2923 (1984).22. C. Brevard. Previously unpublished work.23. M. B. Blayney, J. S. Winn, D. W. Nierenberg. Chem. Eng. News May 12, 7 (1997); T. Y. Toribara,
T. W. Clarkson, D. W. Nierenberg. Chem. Eng. News June 16, 6 (1997); D. Love. Chem. Eng.News July 14, 7 (1997); R. K. Harris. Chem. Eng. News July 14, 7 (1997).
24. J. F. Hinton, G. L. Turner, G. Young, K. R. Metz. Pure Appl. Chem. 54, 2359 (1982).25. J. F. Hinton and R. W. Briggs. J. Magn. Reson. 25, 555 (1977).26. P. Pyykko. Z. Naturforsch., A 47, 189 (1992).27. P. Raghavan. At. Data Nucl. Data Tables 42, 189 (1989).28. P. Pyykko. Mol. Phys. 99, 1617 (2001).29. J. D. Kennedy. In Multinuclear NMR, J. Mason (Ed.), Ch. 8, p. 221, Plenum Press (1987).30. J. T. LaTourrette, W. E. Quinn, R. F. Ramsey. Phys. Rev. 107, 1202 (1957).31. W. Sahm and A. Schwenk. Z. Naturforsch., A 29, 1754 (1974).32. O. Lutz, A. Schwenk, A. Uhl. Z. Naturforsch., A 30, 1122 (1975).33. N. Hao, M. J. McGlinchey, B. G. Sayer, G. J. Schrobilgen. J. Magn. Reson. 46, 158 (1982).34. J. Kodweiss, O. Lutz, W. Messner, K. R. Mohn, A. Nolle, B. Stütz, D. Zepf. J. Magn. Reson. 43,
495 (1981).35. J. Kaufmann, W. Sahm, A. Schwenk. Z. Naturforsch., A 26, 1384 (1971).36. D. Brinkman. Helv. Phys. Acta 41, 367 (1968).37. W. Sahm and A. Schwenk. Z. Naturforsch. A 29, 1763 (1974).38. O. Lutz and H. Oehler. Z. Physik A 288, 11 (1978).39. O. Lutz and H. Oehler. J. Magn. Reson. 37, 261 (1980).40. C. Brevard and P. Granger. Handbook of High Resolution Multinuclear NMR, Wiley, New York
(1981).41. G. Wu and R. E. Wasylishen. Magn. Reson. Chem. 31, 537 (1993).42. A. G. Avent, M. A. Edelman, M. F. Lappert, G. A. Lawless. J. Am. Chem. Soc. 111, 3423, (1989).43. H. LeBail, C. Chachaty, P. Rigny, R. Bougon. C. R. Acad. Sci. 297, 451 (1983).44. G. V. D. Tiers. J. Phys. Chem. 62, 1151 (1958).45. D. L. VanderHart. Encyclopedia of Nuclear Magnetic Resonance, D. M. Grant and R. K. Harris
(Eds.-in-Chief), 5, 2938, Wiley, Chichester (1996).46. P. E. Hansen. Prog. Nucl. Magn. Reson. Spectrosc. 20, 207 (1988).47. D. F. Evans. J. Chem. Soc., Chem. Comm. 1226 (1982).48. L. J. Altman, D. Laungani, G. Gunnarson, H. Wennerström, S. Forsen. J. Amer. Chem. Soc. 100,
8264 (1978).49. W. McFarlane. Proc. R. Soc. London, Ser. A 306, 185 (1968) and references therein.
© 2001 IUPAC, Pure and Applied Chemistry 73, 1795–1818
NMR nomenclature 1817
50. W. McFarlane. Annu. Rep. NMR Spectrosc. 1, 135 (1968).51. R. K. Harris and B. J. Kimber. J. Magn. Reson. 17, 174 (1975).52. D. Canet, C. Goulon-Ginet, J. P. Marchal. J. Magn. Reson. 22, 537 (1976).53. D. S. Wishart, C. G. Bigam, J. Yao, F. Abildgaard, H. J. Dyson, E. Oldfield, J. L. Markley, B. D.
Sykes. J. Biomol. NMR 6, 135 (1995).54. N. N. Zemlyanskii and O. K. Sokolikova. Russ. J. Anal. Chem. 36, 1421 (1981).55. C. J. Jameson, A. K. Jameson, S. M. Cohen. J. Magn. Reson. 19, 385 (1975).56. F. G. Morin, M. S. Solum, J. D. Withers, D. M. Grant. J. Magn. Reson. 48, 138 (1982).57. G. V. D. Tiers and A. Kowalewsky. Paper presented to the Division of Physical Chemistry, 137th
ACS National Meeting, Cleveland, Ohio, 1960; Abstracts, p. 1712; G. V. D. Tiers and R. I. Coon.J. Org. Chem. 26, 2097 (1961).
58. G. V. Tiers and A. Kowalewsky. Division of Physical Chemistry, 137th ACS National Meeting,Cleveland, Ohio, 1960; L. Pohl and M. Ecke. Angew Chem., Int. Ed. Engl. 8, 381 (1969); D. H.Live and S. I. Chan. Org. Magn. Reson. 5, 275 (1973).
59. E. D. Becker. J. Magn. Reson. 4, 142(1971).60. E. D. Becker, R. B. Bradley, T. Axenrod. J. Magn. Reson. 4, 136 (1971).61. D. Doskočilová and B. Schneider. Macromolecules 5, 125 (1972).62. D. Doskočilová, D. D. Tao, B. Schneider. Czech. J. Phys. B 25, 202 (1975). 63. W. L. Earl and D. L. VanderHart. J. Magn. Reson. 48, 35 (1982).64. A. N. Garroway. J. Magn. Reson. 49, 168 (1982).65. S. Hayashi, M. Yanagisawa, K. Hayamizu. Anal. Sci. 7, 955 (1991).66. S. Hayashi and K. Hayamizu. Bull. Chem. Soc. Jpn. 62, 2429 (1989).67. S. Hayashi and K. Hayamizu. Bull. Chem. Soc. Jpn. 64, 685 (1991).68. S. Hayashi and K. Hayamizu. Bull. Chem. Soc. Jpn. 64, 688 (1991).
R. K. HARRIS et al.
© 2001 IUPAC, Pure and Applied Chemistry 73, 1795–1818
1818