Embed Size (px)
Citation preview
NC BEACH AND INLET MANAGEMENT PLAN FINAL REPORT ______________________________________________________________________________________
April 2011 IV-1
IV. Socio-Economic Value of North Carolina Beaches and Inlets
The existing information on the economic value of North Carolina beaches and inlets varies in several dimensions – the information varies by topic (beach recreation value, fishing value, property value, etc.), date, geographic coverage area, methodology used to produce the information, and by degree of technical and peer review. The information also varies in terms of whether the values measured are stock variables or flow variables. A stock variable provides an estimate of an economic value at a point in time – for example, the value of property on Topsail Island on December 31, 2008 is a stock variable. (In business, a balance sheet measures stock variables; it measures the value of a company’s assets and liabilities at a point in time.) In contrast, a flow variable provides an estimate of the change in an economic value over a period of time; for example, the decrease in property value due to a hurricane strike is a flow variable. (In business, an income statement measures flow variables; it measures the amounts of money entering and leaving the firm over a period of time). Several types of economic value can be measured, including stock flow variables. Stock variables include household wealth, the value of coastal property, the value of public infrastructure, and the level of employment. Flow variables include household income, business profits, government tax collections, and consumer surplus. Consumer surplus is the economic value (measured in dollars) that consumers receive from some good or service beyond their expenditures for the good or service. Consumer surplus is typically measured as the difference between what consumers actually pay for something and the maximum amount they would be willing to pay. For example, if you would be willing to pay $50 to enjoy a day at the beach but you only pay $10 in gasoline and parking fees, your consumer surplus would be $40 ($50-$10 = $40). Consumer surplus is most important for goods and services that have free or very low-cost access, such as beach recreation and some types of fishing. The economic value supported by North Carolina beaches and inlets can be affected in several ways. First, there are short-term effects, which can be local, such as rip tide deaths or shark attacks that reduce tourism for a few days, or widespread, such as the damage caused by a particular tropical storm or hurricane. Second, there are intermediate-term effects, such as beach erosion and natural inlet shifting and shoaling, and development patterns that do not achieve the optimal mix of land uses (and thus lessen the potential economic value). Finally, there are long-term effects, such as sea level rise. A goal of beach and inlet management is to anticipate and mitigate all of these effects. In doing so, management seeks to minimize net costs or damages. When adequate resources are not available to address all effects simultaneously, as is typically the case, effects must be prioritized and decisions must be made regarding which effects to address, to what degree, and in what order.
NC BEACH AND INLET MANAGEMENT PLAN FINAL REPORT ______________________________________________________________________________________
April 2011 IV-2
A. Data Sources
1. National-Level Data Sources Established in 1999, the National Ocean Economics Program (NOEP 2008) provides a full range of the most current economic and socio-economic information available on changes and trends along the U.S. coast and in coastal waters, including population, housing, and general economic data. The program is funded by federal, state, university, and private grants and contracts. The National Oceanic and Atmospheric Administration (NOAA) Fisheries Economics & Social Sciences Program provides information on the economics of commercial and recreational fishing.
2. State-Level Data Sources The North Carolina Department of Commerce Tourism Services Division provides information on tourism expenditure and economic impact by county for North Carolina.
The North Carolina Division of Marine Fisheries provides information on employment, economic output, and economic impact of commercial and recreational fishing in North Carolina.
3. Issue-Specific Studies There are many topic-specific studies addressing the economics of particular issues related to North Carolina beaches and inlets. These studies are produced by government agencies, consulting firms, research institutes, and academics publishing in professional journals. These studies will be introduced below under the relevant topical heading.
B. Value of Beaches
1. Value of Coastal Property at Risk
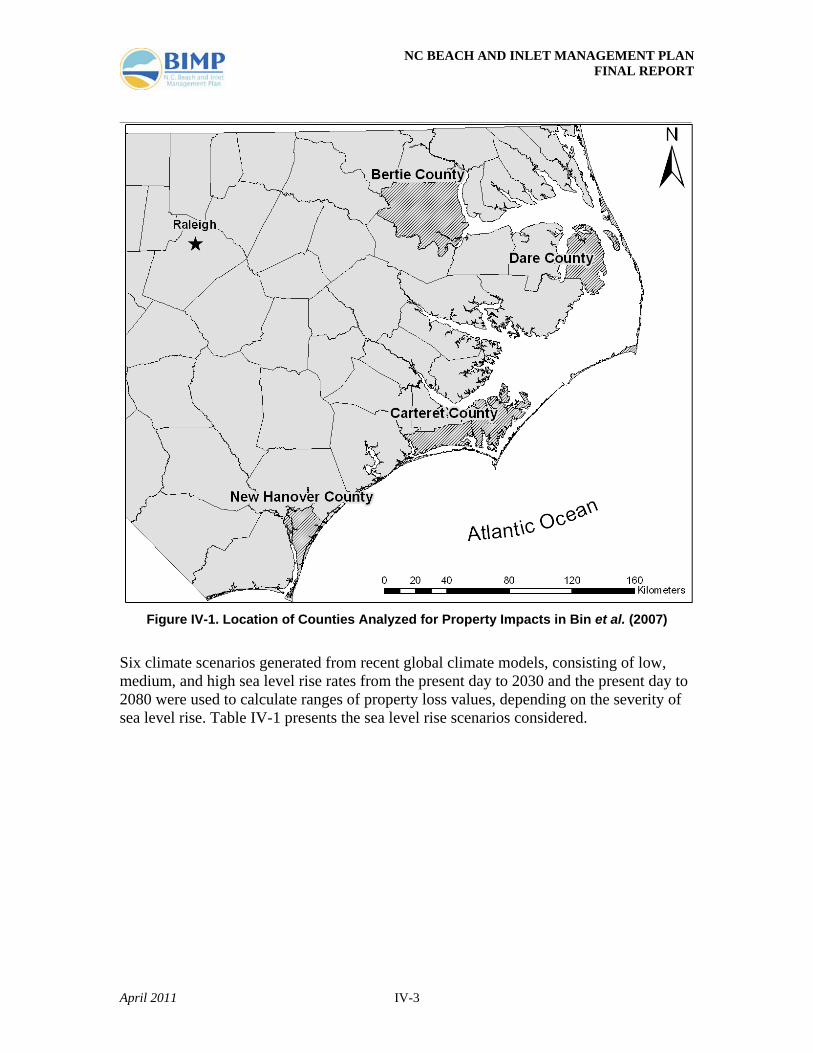
a) Background and Past Studies Bin et al. (2007) examined parcel-level property value, both residential and commercial, for selected coastal counties examining the impacts of sea level rise on North Carolina coastal resources. The authors estimated the impacts of sea level rise on coastal real estate markets in Dare, Bertie, Carteret, and New Hanover Counties (Figure IV-1). The study area represents a cross-section of the North Carolina coastline in geographical distribution and economic development.
NC BEACH AND INLET MANAGEMENT PLAN FINAL REPORT ______________________________________________________________________________________
April 2011 IV-3
Figure IV-1. Location of Counties Analyzed for Property Impacts in Bin et al. (2007)
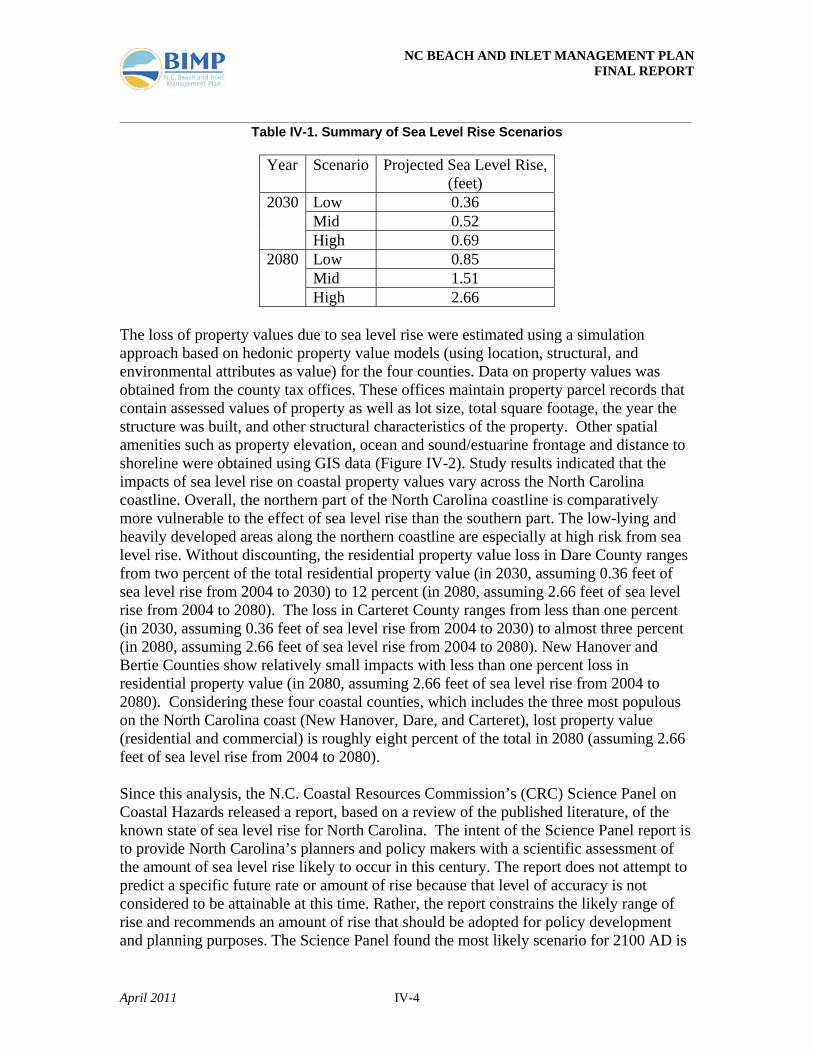
Six climate scenarios generated from recent global climate models, consisting of low, medium, and high sea level rise rates from the present day to 2030 and the present day to 2080 were used to calculate ranges of property loss values, depending on the severity of sea level rise. Table IV-1 presents the sea level rise scenarios considered.
NC BEACH AND INLET MANAGEMENT PLAN FINAL REPORT ______________________________________________________________________________________
April 2011 IV-4
Table IV-1. Summary of Sea Level Rise Scenarios
Year Scenario Projected Sea Level Rise, (feet)
2030 Low 0.36 Mid 0.52 High 0.69
2080 Low 0.85 Mid 1.51 High 2.66
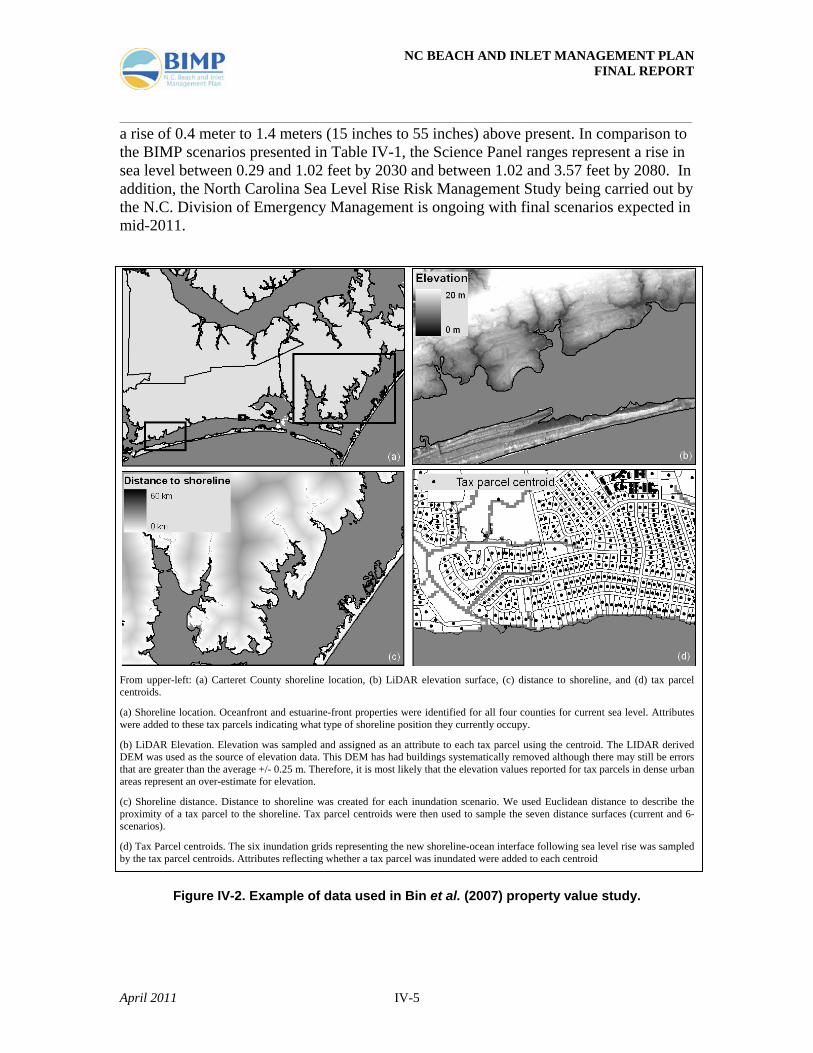
The loss of property values due to sea level rise were estimated using a simulation approach based on hedonic property value models (using location, structural, and environmental attributes as value) for the four counties. Data on property values was obtained from the county tax offices. These offices maintain property parcel records that contain assessed values of property as well as lot size, total square footage, the year the structure was built, and other structural characteristics of the property. Other spatial amenities such as property elevation, ocean and sound/estuarine frontage and distance to shoreline were obtained using GIS data (Figure IV-2). Study results indicated that the impacts of sea level rise on coastal property values vary across the North Carolina coastline. Overall, the northern part of the North Carolina coastline is comparatively more vulnerable to the effect of sea level rise than the southern part. The low-lying and heavily developed areas along the northern coastline are especially at high risk from sea level rise. Without discounting, the residential property value loss in Dare County ranges from two percent of the total residential property value (in 2030, assuming 0.36 feet of sea level rise from 2004 to 2030) to 12 percent (in 2080, assuming 2.66 feet of sea level rise from 2004 to 2080). The loss in Carteret County ranges from less than one percent (in 2030, assuming 0.36 feet of sea level rise from 2004 to 2030) to almost three percent (in 2080, assuming 2.66 feet of sea level rise from 2004 to 2080). New Hanover and Bertie Counties show relatively small impacts with less than one percent loss in residential property value (in 2080, assuming 2.66 feet of sea level rise from 2004 to 2080). Considering these four coastal counties, which includes the three most populous on the North Carolina coast (New Hanover, Dare, and Carteret), lost property value (residential and commercial) is roughly eight percent of the total in 2080 (assuming 2.66 feet of sea level rise from 2004 to 2080). Since this analysis, the N.C. Coastal Resources Commission’s (CRC) Science Panel on Coastal Hazards released a report, based on a review of the published literature, of the known state of sea level rise for North Carolina. The intent of the Science Panel report is to provide North Carolina’s planners and policy makers with a scientific assessment of the amount of sea level rise likely to occur in this century. The report does not attempt to predict a specific future rate or amount of rise because that level of accuracy is not considered to be attainable at this time. Rather, the report constrains the likely range of rise and recommends an amount of rise that should be adopted for policy development and planning purposes. The Science Panel found the most likely scenario for 2100 AD is
NC BEACH AND INLET MANAGEMENT PLAN FINAL REPORT ______________________________________________________________________________________
April 2011 IV-5
a rise of 0.4 meter to 1.4 meters (15 inches to 55 inches) above present. In comparison to the BIMP scenarios presented in Table IV-1, the Science Panel ranges represent a rise in sea level between 0.29 and 1.02 feet by 2030 and between 1.02 and 3.57 feet by 2080. In addition, the North Carolina Sea Level Rise Risk Management Study being carried out by the N.C. Division of Emergency Management is ongoing with final scenarios expected in mid-2011.
From upper-left: (a) Carteret County shoreline location, (b) LiDAR elevation surface, (c) distance to shoreline, and (d) tax parcel centroids.
(a) Shoreline location. Oceanfront and estuarine-front properties were identified for all four counties for current sea level. Attributes were added to these tax parcels indicating what type of shoreline position they currently occupy.
(b) LiDAR Elevation. Elevation was sampled and assigned as an attribute to each tax parcel using the centroid. The LIDAR derived DEM was used as the source of elevation data. This DEM has had buildings systematically removed although there may still be errors that are greater than the average +/- 0.25 m. Therefore, it is most likely that the elevation values reported for tax parcels in dense urban areas represent an over-estimate for elevation.
(c) Shoreline distance. Distance to shoreline was created for each inundation scenario. We used Euclidean distance to describe the proximity of a tax parcel to the shoreline. Tax parcel centroids were then used to sample the seven distance surfaces (current and 6-scenarios).
(d) Tax Parcel centroids. The six inundation grids representing the new shoreline-ocean interface following sea level rise was sampled by the tax parcel centroids. Attributes reflecting whether a tax parcel was inundated were added to each centroid
Figure IV-2. Example of data used in Bin et al. (2007) property value study.
NC BEACH AND INLET MANAGEMENT PLAN FINAL REPORT ______________________________________________________________________________________
April 2011 IV-6
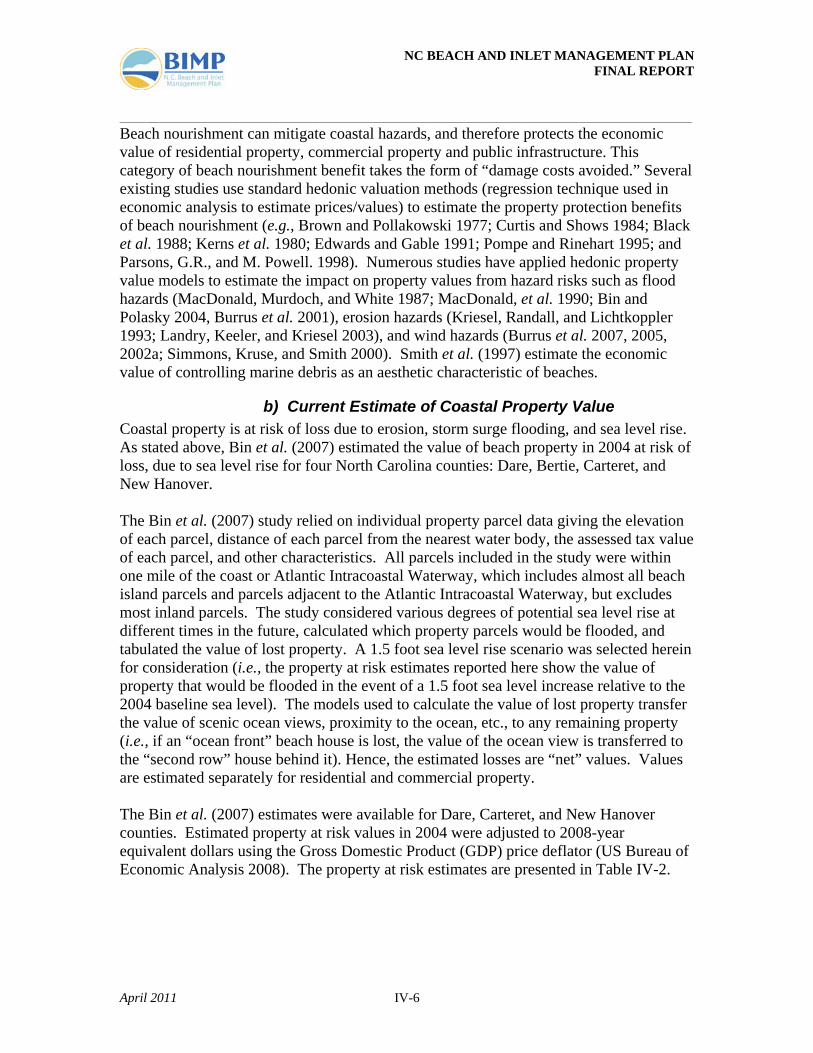
Beach nourishment can mitigate coastal hazards, and therefore protects the economic value of residential property, commercial property and public infrastructure. This category of beach nourishment benefit takes the form of “damage costs avoided.” Several existing studies use standard hedonic valuation methods (regression technique used in economic analysis to estimate prices/values) to estimate the property protection benefits of beach nourishment (e.g., Brown and Pollakowski 1977; Curtis and Shows 1984; Black et al. 1988; Kerns et al. 1980; Edwards and Gable 1991; Pompe and Rinehart 1995; and Parsons, G.R., and M. Powell. 1998). Numerous studies have applied hedonic property value models to estimate the impact on property values from hazard risks such as flood hazards (MacDonald, Murdoch, and White 1987; MacDonald, et al. 1990; Bin and Polasky 2004, Burrus et al. 2001), erosion hazards (Kriesel, Randall, and Lichtkoppler 1993; Landry, Keeler, and Kriesel 2003), and wind hazards (Burrus et al. 2007, 2005, 2002a; Simmons, Kruse, and Smith 2000). Smith et al. (1997) estimate the economic value of controlling marine debris as an aesthetic characteristic of beaches.
b) Current Estimate of Coastal Property Value Coastal property is at risk of loss due to erosion, storm surge flooding, and sea level rise. As stated above, Bin et al. (2007) estimated the value of beach property in 2004 at risk of loss, due to sea level rise for four North Carolina counties: Dare, Bertie, Carteret, and New Hanover. The Bin et al. (2007) study relied on individual property parcel data giving the elevation of each parcel, distance of each parcel from the nearest water body, the assessed tax value of each parcel, and other characteristics. All parcels included in the study were within one mile of the coast or Atlantic Intracoastal Waterway, which includes almost all beach island parcels and parcels adjacent to the Atlantic Intracoastal Waterway, but excludes most inland parcels. The study considered various degrees of potential sea level rise at different times in the future, calculated which property parcels would be flooded, and tabulated the value of lost property. A 1.5 foot sea level rise scenario was selected herein for consideration (i.e., the property at risk estimates reported here show the value of property that would be flooded in the event of a 1.5 foot sea level increase relative to the 2004 baseline sea level). The models used to calculate the value of lost property transfer the value of scenic ocean views, proximity to the ocean, etc., to any remaining property (i.e., if an “ocean front” beach house is lost, the value of the ocean view is transferred to the “second row” house behind it). Hence, the estimated losses are “net” values. Values are estimated separately for residential and commercial property. The Bin et al. (2007) estimates were available for Dare, Carteret, and New Hanover counties. Estimated property at risk values in 2004 were adjusted to 2008-year equivalent dollars using the Gross Domestic Product (GDP) price deflator (US Bureau of Economic Analysis 2008). The property at risk estimates are presented in Table IV-2.
NC BEACH AND INLET MANAGEMENT PLAN FINAL REPORT ______________________________________________________________________________________
April 2011 IV-7
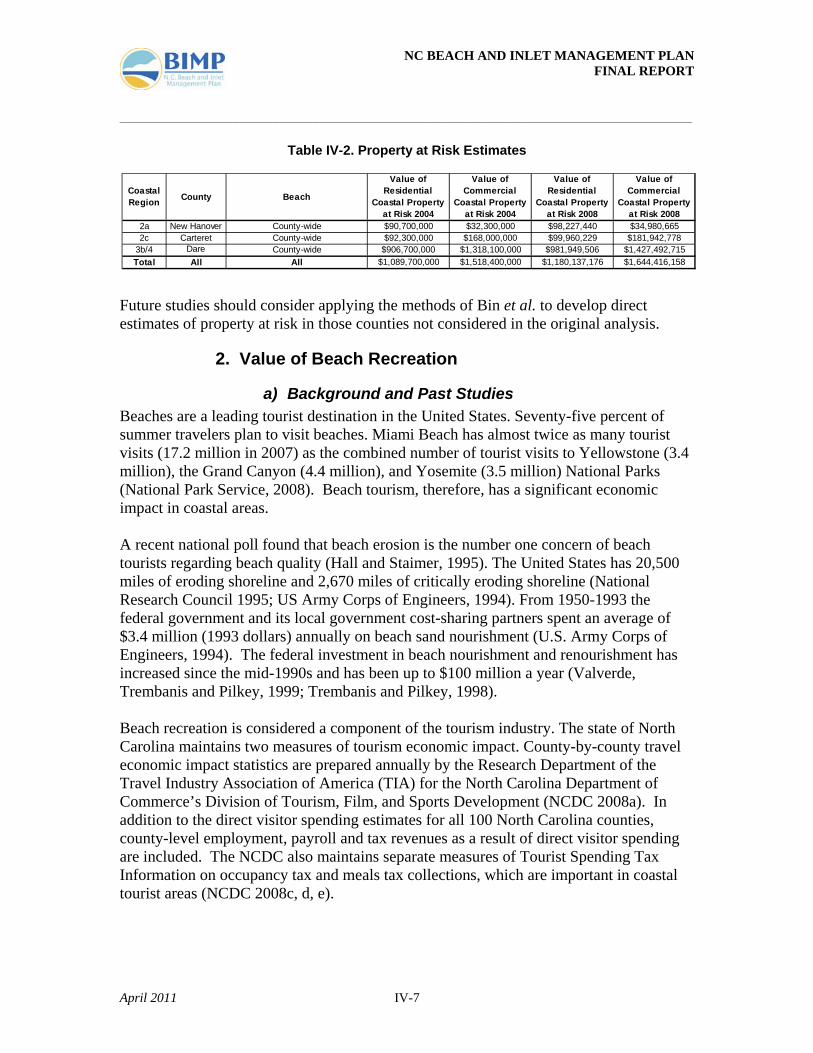
Table IV-2. Property at Risk Estimates
Future studies should consider applying the methods of Bin et al. to develop direct estimates of property at risk in those counties not considered in the original analysis.
2. Value of Beach Recreation
a) Background and Past Studies Beaches are a leading tourist destination in the United States. Seventy-five percent of summer travelers plan to visit beaches. Miami Beach has almost twice as many tourist visits (17.2 million in 2007) as the combined number of tourist visits to Yellowstone (3.4 million), the Grand Canyon (4.4 million), and Yosemite (3.5 million) National Parks (National Park Service, 2008). Beach tourism, therefore, has a significant economic impact in coastal areas. A recent national poll found that beach erosion is the number one concern of beach tourists regarding beach quality (Hall and Staimer, 1995). The United States has 20,500 miles of eroding shoreline and 2,670 miles of critically eroding shoreline (National Research Council 1995; US Army Corps of Engineers, 1994). From 1950-1993 the federal government and its local government cost-sharing partners spent an average of $3.4 million (1993 dollars) annually on beach sand nourishment (U.S. Army Corps of Engineers, 1994). The federal investment in beach nourishment and renourishment has increased since the mid-1990s and has been up to $100 million a year (Valverde, Trembanis and Pilkey, 1999; Trembanis and Pilkey, 1998). Beach recreation is considered a component of the tourism industry. The state of North Carolina maintains two measures of tourism economic impact. County-by-county travel economic impact statistics are prepared annually by the Research Department of the Travel Industry Association of America (TIA) for the North Carolina Department of Commerce’s Division of Tourism, Film, and Sports Development (NCDC 2008a). In addition to the direct visitor spending estimates for all 100 North Carolina counties, county-level employment, payroll and tax revenues as a result of direct visitor spending are included. The NCDC also maintains separate measures of Tourist Spending Tax Information on occupancy tax and meals tax collections, which are important in coastal tourist areas (NCDC 2008c, d, e).
Coastal Region County Beach
Value of Residential
Coastal Property at Risk 2004
Value of Commercial
Coastal Property at Risk 2004
Value of Residential
Coastal Property at Risk 2008
Value of Commercial
Coastal Property at Risk 2008
2a New Hanover County-wide $90,700,000 $32,300,000 $98,227,440 $34,980,6652c Carteret County-wide $92,300,000 $168,000,000 $99,960,229 $181,942,778
3b/4 Dare County-wide $906,700,000 $1,318,100,000 $981,949,506 $1,427,492,715Total All All $1,089,700,000 $1,518,400,000 $1,180,137,176 $1,644,416,158
NC BEACH AND INLET MANAGEMENT PLAN FINAL REPORT ______________________________________________________________________________________
April 2011 IV-8
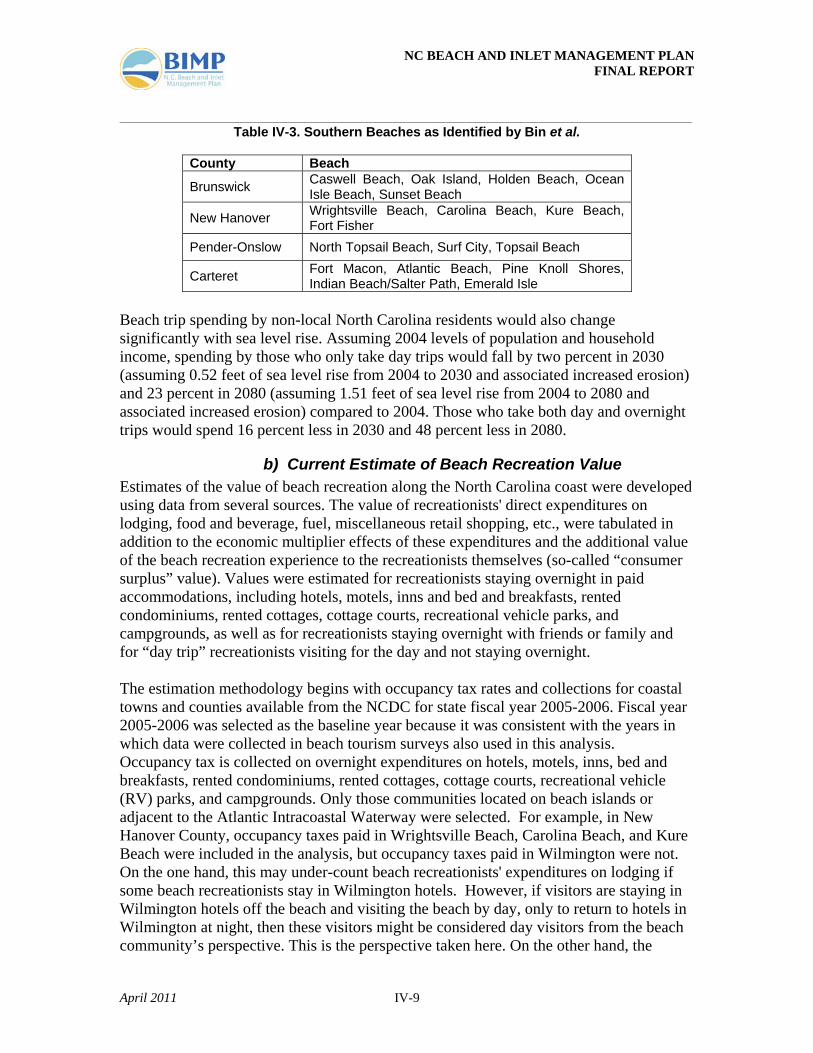
The second measure of tourism economic impact is the Tourism Satellite Account (TSA) produced for NCDC by GlobalInsight (NCDC 2006). This measure follows the official international standard for measuring the economic contribution of tourism. The TSA methodology was developed by the World Tourism Organization and ratified by the United Nations in 2000. The TSA for North Carolina provides measures of the contribution of travel and tourism to income, employment, gross state product, government tax revenues, and other measures. The economic impact measure produced by the TSA methodology is typically larger than that produced by the TIA methodology because the TSA methodology includes the spending of the following groups (in addition to domestic in-bound traveler spending measured by TIA): the spending of international and resident outbound visitors, North Carolina’s Tourism Office budget, the construction of tourism sector infrastructure, and the rental income from a large number of seasonal second homes. Recently, Bin et al. (2005) provided estimates of consumer surplus value for beach recreation in North Carolina. The authors estimated consumer surplus of a beach day using the single-site travel cost method. Onsite visitation data for southern North Carolina beaches were collected between July and November of 2003. One model pertained to beach visitors that make single day trips to the beach, while the other was for visitors that stay onsite overnight. Depending upon the site, the estimated net benefits of a day at a beach in North Carolina ranged between $11 and $80 for those users making day trips and between $11 and $41 for those users staying overnight. These estimates are of the same order of magnitude as the results from earlier studies using travel cost methods but are considerably larger than the previous findings based upon other (stated preference) methods. Additionally, Bin et al. (2007) examined the impacts of sea level rise on North Carolina coastal resources (see sea level rise scenarios in Table IV-1). The authors use two sets of recreation data and the travel cost method for recreation demand estimation. The first data set includes information on beach trips to southern North Carolina beaches, listed below in Table IV-3. Assuming 2004 levels of population and household income, the authors estimate that the lost beach recreation value of sea level rise to beach goers is $93 million per year in 2030 (assuming 0.52 feet of sea level rise from 2004 to 2030 and associated increased erosion) and $203 million per year in 2080 (assuming 1.51 feet of sea level rise from 2004 to 2080 and associated increased erosion) for the southern North Carolina beaches. For those households who only take day trips, 4.3 percent of recreation value is lost in 2030 and 11 percent is lost in 2080 relative to 2004 baseline values. For those households who take both day and overnight beach trips, 16 percent and 34 percent of recreation value is lost in 2030 and 2080, respectively. The present value of the welfare costs are estimated by assuming the impacts are equal to zero in 2004 and increase linearly to 2080. Assuming 2004 levels of population and household income, the present value of the cumulative lost recreation benefits due to sea level rise from 2004 to 2080 would be $3.5 billion when discounted at a two percent rate for the southern North Carolina beaches.
NC BEACH AND INLET MANAGEMENT PLAN FINAL REPORT ______________________________________________________________________________________
April 2011 IV-9
Table IV-3. Southern Beaches as Identified by Bin et al.
County Beach
Brunswick Caswell Beach, Oak Island, Holden Beach, Ocean Isle Beach, Sunset Beach
New Hanover Wrightsville Beach, Carolina Beach, Kure Beach, Fort Fisher
Pender-Onslow North Topsail Beach, Surf City, Topsail Beach
Carteret Fort Macon, Atlantic Beach, Pine Knoll Shores, Indian Beach/Salter Path, Emerald Isle
Beach trip spending by non-local North Carolina residents would also change significantly with sea level rise. Assuming 2004 levels of population and household income, spending by those who only take day trips would fall by two percent in 2030 (assuming 0.52 feet of sea level rise from 2004 to 2030 and associated increased erosion) and 23 percent in 2080 (assuming 1.51 feet of sea level rise from 2004 to 2080 and associated increased erosion) compared to 2004. Those who take both day and overnight trips would spend 16 percent less in 2030 and 48 percent less in 2080.
b) Current Estimate of Beach Recreation Value Estimates of the value of beach recreation along the North Carolina coast were developed using data from several sources. The value of recreationists' direct expenditures on lodging, food and beverage, fuel, miscellaneous retail shopping, etc., were tabulated in addition to the economic multiplier effects of these expenditures and the additional value of the beach recreation experience to the recreationists themselves (so-called “consumer surplus” value). Values were estimated for recreationists staying overnight in paid accommodations, including hotels, motels, inns and bed and breakfasts, rented condominiums, rented cottages, cottage courts, recreational vehicle parks, and campgrounds, as well as for recreationists staying overnight with friends or family and for “day trip” recreationists visiting for the day and not staying overnight. The estimation methodology begins with occupancy tax rates and collections for coastal towns and counties available from the NCDC for state fiscal year 2005-2006. Fiscal year 2005-2006 was selected as the baseline year because it was consistent with the years in which data were collected in beach tourism surveys also used in this analysis. Occupancy tax is collected on overnight expenditures on hotels, motels, inns, bed and breakfasts, rented condominiums, rented cottages, cottage courts, recreational vehicle (RV) parks, and campgrounds. Only those communities located on beach islands or adjacent to the Atlantic Intracoastal Waterway were selected. For example, in New Hanover County, occupancy taxes paid in Wrightsville Beach, Carolina Beach, and Kure Beach were included in the analysis, but occupancy taxes paid in Wilmington were not. On the one hand, this may under-count beach recreationists' expenditures on lodging if some beach recreationists stay in Wilmington hotels. However, if visitors are staying in Wilmington hotels off the beach and visiting the beach by day, only to return to hotels in Wilmington at night, then these visitors might be considered day visitors from the beach community’s perspective. This is the perspective taken here. On the other hand, the
NC BEACH AND INLET MANAGEMENT PLAN FINAL REPORT ______________________________________________________________________________________
April 2011 IV-10
procedure may over-count beach recreation expenditures if some beach hotel visitors do not intend to recreate at the beach, but are there for some other reason, such as to attend a workshop or conference. To some extent, these sources of over- and under-counting should work to cancel one another and the net effect should be minor relative to overall levels of occupancy taxes. Occupancy tax collections in each beach town community were divided by community-specific occupancy tax rates to derive estimates of overnight beach recreationists' lodging expenditures at hotels, motels, inns, bed and breakfasts, rented condominiums, rented cottages, cottage courts, RV parks, and campgrounds. When community-specific occupancy tax collections and rates were not available from NCDC, the individual counties were contacted to obtain community-specific tax collections and rates. For each beach community, overnight lodging expenditures were partitioned into three categories; (1) hotels/motels/inns/bed and breakfasts, (2) condo and cottage rentals, and (3) RV parks and campgrounds. In some cases the data needed to partition lodging expenditures were part of county occupancy tax records, in other cases the data were drawn from surveys of beach recreationists (NCOBVB 2006, Herstine et al. 2005, Imperial et al. 2004). Numbers of overnight beach trips by lodging category for each beach community were then calculated by dividing the lodging expenditures in each community and category by the estimated lodging expenditures per trip made by overnight beach recreationists in each community and category. A trip is defined as all persons traveling together to the beach for all days of the trip, not the number of individual persons making trips, and not the individual number of days. So, the lodging expenditures made by all persons in a family traveling together to the beach for all days spent at the beach on the trip are counted as the expenditures made on one trip. Estimates of average overnight lodging expenditures per beach trip by lodging category for Dare County are provided by NCOBVB (2006) (cottage & condo rentals: $1,312 per trip; hotel/motel/B&B: $358 per trip; RV and campgrounds: $265 per trip), and similar data are provided for Wrightsville Beach in Imperial et al. (2004) (cottage & condo rentals: $1,616 per trip; hotel/motel/B&B: $511 per trip; RV and campgrounds: not available, so Dare County value was used: $265 per trip). Per trip lodging expenditures by lodging category for Currituck County (Corolla area) and Hyde County (Ocracoke area) are assumed to be similar to those in Dare County. Per trip lodging expenditures by lodging category for Carteret, Pender, and Brunswick Counties and other beach communities in New Hanover County are assumed to be similar to those in Wrightsville Beach. The number of overnight beach trips made by beach recreationists staying with family and friends at the beach (and therefore not paying occupancy tax) were estimated for Dare County based on data in NCOBVB (2006) indicating that six percent of all overnight trips are of this type. Estimates for Hyde and Currituck Counties are made based on the six percent figure for Dare County. Imperial et al. (2004) found that a much higher percentage (i.e., 47 percent) of all overnight trips at Wrightsville Beach are trips in
NC BEACH AND INLET MANAGEMENT PLAN FINAL REPORT ______________________________________________________________________________________
April 2011 IV-11
which visitors stay with family and friends. The Wrightsville Beach percentage is used to estimate “family and friend lodging” trips for Carteret, Pender, Hyde, and Brunswick Counties and the remaining beach communities in New Hanover County. The numbers of day (non-overnight) beach recreation trips for each community are estimated using information on: (1) numbers of overnight trips as estimated above, (2) the proportions of day trips to overnight trips, and (3) the average number of days per overnight trip. Data for (2) are provided by Herstine et al. (2005) for Carteret, Pender, Onslow, and Brunswick County beaches and by Imperial et al. (2004) for Wrightsville Beach (assumed to be the same for other New Hanover County beaches). Due to relatively remote location, it is assumed that only five percent of beach trips made to Currituck County and Dare County communities north of Oregon Inlet are day trips and zero percent of beach trips made to Dare County and Hyde County communities south of Oregon Inlet are day trips. (It is very likely that many visitors staying overnight in Manteo or Bodie Island communities make day trips to Hatteras communities, but the expenditures of these visitors are counted in the overnight category rather than the day trip category.) Data for (3) are provided by NCOBVB (2006) for Dare County (6.7 days per overnight trip) and by Herstine et al. (2005) and Imperial et al. (2004) for Carteret County and counties south of Carteret (five to seven days per overnight trip). Given these data, the numbers of day trips for each community are estimated by multiplying the number of overnight trips by the proportion of day trips to overnight trips and then multiplying by the average number of days per overnight trip. The last multiplication, called the naïve estimate, is done to correct for sampling bias associated with the on-site beach surveys that are the source of the estimates of the proportions of day trips to overnight trips. (For example, if an on-site beach survey finds that on each of three different days of beach surveying, one person was a day visitor and one person was an overnight visitor, then a naïve estimate of the proportion of day visitors to overnight visitors is one-to-one. But, what if the average overnight visitor stays three days per trip? Then, on average, the beach survey picked up the same overnight visitor on each of the three different survey days, so the true proportion of day visitors to overnight visitors is three-to-one. Multiplying the naïve estimate of day trips by the average number of days per overnight trip corrects for this potential bias.) Given estimates of the number of overnight trips (by overnight trip category) and day trips for each beach community, estimates of the direct non-lodging expenditures made by beach recreationists on food and beverage purchased in restaurants and bars, food and beverage purchased in grocery stores and convenience stores, fuel, entertainment (movies, golf, etc.), retail shopping, etc., are developed by multiplying the number of trips in each trip category by the average expenditure per trip in each expenditure category for each trip category. Data on expenditures per trip for overnight trips and day trips by expenditure category are provided by NCOBVB (2006) for Dare County and by Imperial et al. (2004) for Wrightsville Beach. The expenditure per trip estimates for Dare County are used for Hyde County, and the estimates for Wrightsville Beach are used for Carteret, Pender, Onslow, New Hanover, and Brunswick County beach communities. Estimated direct expenditures are summed across expenditure categories and trip types
NC BEACH AND INLET MANAGEMENT PLAN FINAL REPORT ______________________________________________________________________________________
April 2011 IV-12
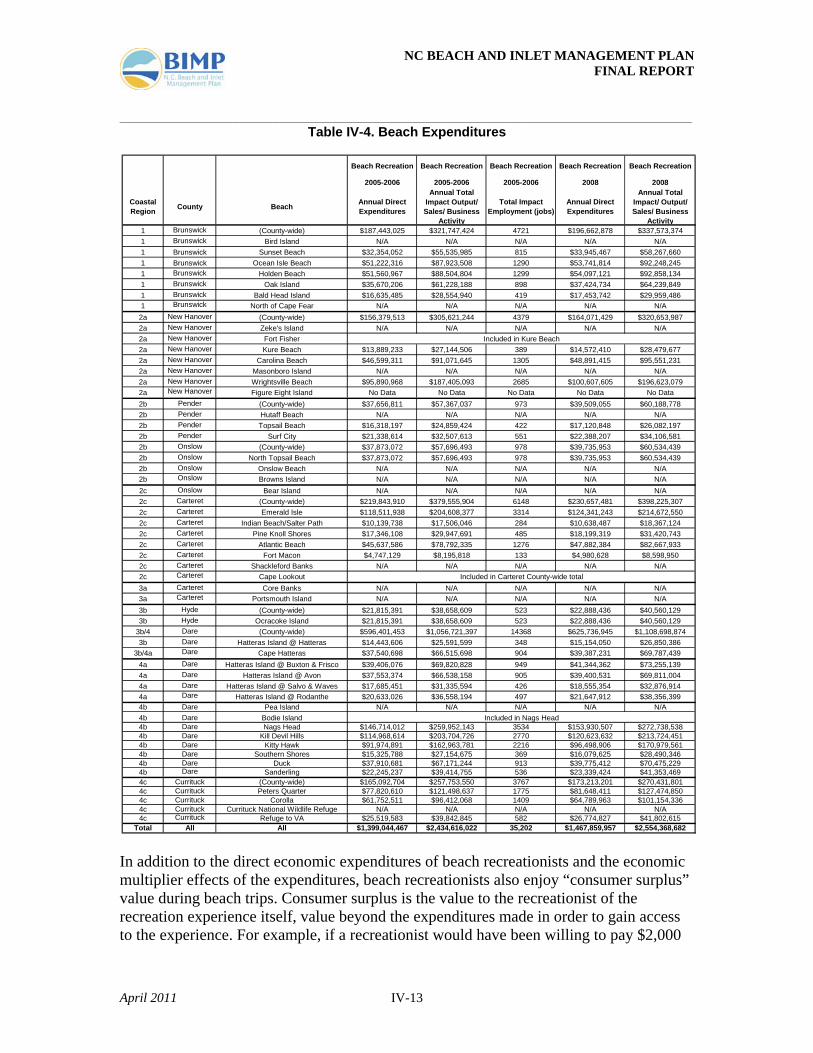
and are reported for each beach community in both base year (2005-2006) and inflation-adjusted year 2008 dollars. Direct expenditures by expenditure category are summed across all trip types for all communities in each county. These county-level direct expenditures (by expenditure category) were then entered into county-level economic input-output models (see Miller and Blair 1985 for additional information on input-output models) to estimate the county-wide economic multiplier effects of the direct expenditures. County-level IMPLAN software models (MIG 2005) were used to estimate multiplier effects. The input-output models provide estimates of total business sales (also known as economic output or business activity) and employment supported in each county by the direct beach recreation expenditures. Estimates of total impacts on business sales and employment were provided at the county level because multiplier effects occur county-wide rather than being confined to particular beach communities. Estimates of business sales were provided in both base year (2005-2006) and inflation-adjusted year 2008 dollars. Inflation adjustment does not change employment estimates. These estimates are presented in Table IV-4.
NC BEACH AND INLET MANAGEMENT PLAN FINAL REPORT ______________________________________________________________________________________
April 2011 IV-13
Table IV-4. Beach Expenditures
In addition to the direct economic expenditures of beach recreationists and the economic multiplier effects of the expenditures, beach recreationists also enjoy “consumer surplus” value during beach trips. Consumer surplus is the value to the recreationist of the recreation experience itself, value beyond the expenditures made in order to gain access to the experience. For example, if a recreationist would have been willing to pay $2,000
Beach Recreation Beach Recreation Beach Recreation Beach Recreation Beach Recreation
2005-2006 2005-2006 2005-2006 2008 2008
Coastal Region County Beach Annual Direct
Expenditures
Annual Total Impact Output/ Sales/ Business
Activity
Total Impact Employment (jobs)
Annual Direct Expenditures
Annual Total Impact/ Output/ Sales/ Business
Activity1 Brunswick (County-wide) $187,443,025 $321,747,424 4721 $196,662,878 $337,573,3741 Brunswick Bird Island N/A N/A N/A N/A N/A1 Brunswick Sunset Beach $32,354,052 $55,535,985 815 $33,945,467 $58,267,6601 Brunswick Ocean Isle Beach $51,222,316 $87,923,508 1290 $53,741,814 $92,248,2451 Brunswick Holden Beach $51,560,967 $88,504,804 1299 $54,097,121 $92,858,1341 Brunswick Oak Island $35,670,206 $61,228,188 898 $37,424,734 $64,239,8491 Brunswick Bald Head Island $16,635,485 $28,554,940 419 $17,453,742 $29,959,4861 Brunswick North of Cape Fear N/A N/A N/A N/A N/A
2a New Hanover (County-wide) $156,379,513 $305,621,244 4379 $164,071,429 $320,653,9872a New Hanover Zeke's Island N/A N/A N/A N/A N/A2a New Hanover Fort Fisher2a New Hanover Kure Beach $13,889,233 $27,144,506 389 $14,572,410 $28,479,6772a New Hanover Carolina Beach $46,599,311 $91,071,645 1305 $48,891,415 $95,551,2312a New Hanover Masonboro Island N/A N/A N/A N/A N/A2a New Hanover Wrightsville Beach $95,890,968 $187,405,093 2685 $100,607,605 $196,623,0792a New Hanover Figure Eight Island No Data No Data No Data No Data No Data2b Pender (County-wide) $37,656,811 $57,367,037 973 $39,509,055 $60,188,7782b Pender Hutaff Beach N/A N/A N/A N/A N/A2b Pender Topsail Beach $16,318,197 $24,859,424 422 $17,120,848 $26,082,1972b Pender Surf City $21,338,614 $32,507,613 551 $22,388,207 $34,106,5812b Onslow (County-wide) $37,873,072 $57,696,493 978 $39,735,953 $60,534,4392b Onslow North Topsail Beach $37,873,072 $57,696,493 978 $39,735,953 $60,534,4392b Onslow Onslow Beach N/A N/A N/A N/A N/A2b Onslow Browns Island N/A N/A N/A N/A N/A2c Onslow Bear Island N/A N/A N/A N/A N/A2c Carteret (County-wide) $219,843,910 $379,555,904 6148 $230,657,481 $398,225,3072c Carteret Emerald Isle $118,511,938 $204,608,377 3314 $124,341,243 $214,672,5502c Carteret Indian Beach/Salter Path $10,139,738 $17,506,046 284 $10,638,487 $18,367,1242c Carteret Pine Knoll Shores $17,346,108 $29,947,691 485 $18,199,319 $31,420,7432c Carteret Atlantic Beach $45,637,586 $78,792,335 1276 $47,882,384 $82,667,9332c Carteret Fort Macon $4,747,129 $8,195,818 133 $4,980,628 $8,598,9502c Carteret Shackleford Banks N/A N/A N/A N/A N/A2c Carteret Cape Lookout3a Carteret Core Banks N/A N/A N/A N/A N/A3a Carteret Portsmouth Island N/A N/A N/A N/A N/A3b Hyde (County-wide) $21,815,391 $38,658,609 523 $22,888,436 $40,560,1293b Hyde Ocracoke Island $21,815,391 $38,658,609 523 $22,888,436 $40,560,129
3b/4 Dare (County-wide) $596,401,453 $1,056,721,397 14368 $625,736,945 $1,108,698,8743b Dare Hatteras Island @ Hatteras $14,443,606 $25,591,599 348 $15,154,050 $26,850,386
3b/4a Dare Cape Hatteras $37,540,698 $66,515,698 904 $39,387,231 $69,787,4394a Dare Hatteras Island @ Buxton & Frisco $39,406,076 $69,820,828 949 $41,344,362 $73,255,1394a Dare Hatteras Island @ Avon $37,553,374 $66,538,158 905 $39,400,531 $69,811,0044a Dare Hatteras Island @ Salvo & Waves $17,685,451 $31,335,594 426 $18,555,354 $32,876,9144a Dare Hatteras Island @ Rodanthe $20,633,026 $36,558,194 497 $21,647,912 $38,356,3994b Dare Pea Island N/A N/A N/A N/A N/A4b Dare Bodie Island4b Dare Nags Head $146,714,012 $259,952,143 3534 $153,930,507 $272,738,5384b Dare Kill Devil Hills $114,968,614 $203,704,726 2770 $120,623,632 $213,724,4514b Dare Kitty Hawk $91,974,891 $162,963,781 2216 $96,498,906 $170,979,5614b Dare Southern Shores $15,325,788 $27,154,675 369 $16,079,625 $28,490,3464b Dare Duck $37,910,681 $67,171,244 913 $39,775,412 $70,475,2294b Dare Sanderling $22,245,237 $39,414,755 536 $23,339,424 $41,353,4694c Currituck (County-wide) $165,092,704 $257,753,550 3767 $173,213,201 $270,431,8014c Currituck Peters Quarter $77,820,610 $121,498,637 1775 $81,648,411 $127,474,8504c Currituck Corolla $61,752,511 $96,412,068 1409 $64,789,963 $101,154,3364c Currituck Currituck National Wildlife Refuge N/A N/A N/A N/A N/A4c Currituck Refuge to VA $25,519,583 $39,842,845 582 $26,774,827 $41,802,615
Total All All $1,399,044,467 $2,434,616,022 35,202 $1,467,859,957 $2,554,368,682
Included in Kure Beach
Included in Carteret County-wide total
Included in Nags Head
NC BEACH AND INLET MANAGEMENT PLAN FINAL REPORT ______________________________________________________________________________________
April 2011 IV-14
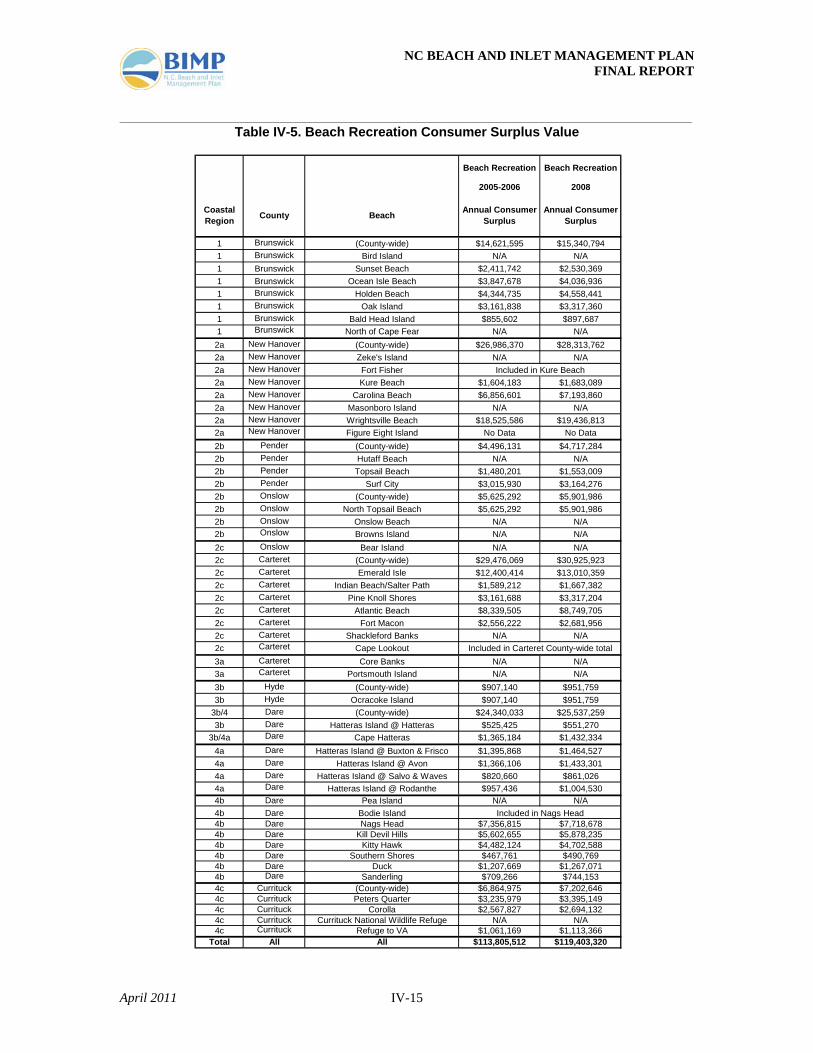
for a beach vacation but only ends up spending $1,300, then the consumer surplus is the difference, $700. Bin et al. (2007) estimated consumer surplus values per trip for day trips and overnight trips to Carteret, Pender, Onslow, New Hanover, and Brunswick County beaches based on data provided in Herstine et al. (2005). The average estimates of consumer surplus value are $55 per day trip and $65 per overnight trip. These values are similar to other estimates of consumer surplus per beach trip for North Carolina beach trips (e.g., Bin et al. 2005, Whitehead et al. 2008). These estimates of consumer surplus per trip were multiplied by the number of trips to provide estimates of consumer surplus value by beach community for both base year (2005-2006) and inflation-adjusted year 2008 dollars. These estimates are presented in Table IV-5.
NC BEACH AND INLET MANAGEMENT PLAN FINAL REPORT ______________________________________________________________________________________
April 2011 IV-15
Table IV-5. Beach Recreation Consumer Surplus Value
Beach Recreation Beach Recreation
2005-2006 2008
Coastal Region County Beach Annual Consumer
SurplusAnnual Consumer
Surplus
1 Brunswick (County-wide) $14,621,595 $15,340,7941 Brunswick Bird Island N/A N/A1 Brunswick Sunset Beach $2,411,742 $2,530,3691 Brunswick Ocean Isle Beach $3,847,678 $4,036,9361 Brunswick Holden Beach $4,344,735 $4,558,4411 Brunswick Oak Island $3,161,838 $3,317,3601 Brunswick Bald Head Island $855,602 $897,6871 Brunswick North of Cape Fear N/A N/A2a New Hanover (County-wide) $26,986,370 $28,313,7622a New Hanover Zeke's Island N/A N/A2a New Hanover Fort Fisher2a New Hanover Kure Beach $1,604,183 $1,683,0892a New Hanover Carolina Beach $6,856,601 $7,193,8602a New Hanover Masonboro Island N/A N/A2a New Hanover Wrightsville Beach $18,525,586 $19,436,8132a New Hanover Figure Eight Island No Data No Data2b Pender (County-wide) $4,496,131 $4,717,2842b Pender Hutaff Beach N/A N/A2b Pender Topsail Beach $1,480,201 $1,553,0092b Pender Surf City $3,015,930 $3,164,2762b Onslow (County-wide) $5,625,292 $5,901,9862b Onslow North Topsail Beach $5,625,292 $5,901,9862b Onslow Onslow Beach N/A N/A2b Onslow Browns Island N/A N/A2c Onslow Bear Island N/A N/A2c Carteret (County-wide) $29,476,069 $30,925,9232c Carteret Emerald Isle $12,400,414 $13,010,3592c Carteret Indian Beach/Salter Path $1,589,212 $1,667,3822c Carteret Pine Knoll Shores $3,161,688 $3,317,2042c Carteret Atlantic Beach $8,339,505 $8,749,7052c Carteret Fort Macon $2,556,222 $2,681,9562c Carteret Shackleford Banks N/A N/A2c Carteret Cape Lookout3a Carteret Core Banks N/A N/A3a Carteret Portsmouth Island N/A N/A3b Hyde (County-wide) $907,140 $951,7593b Hyde Ocracoke Island $907,140 $951,759
3b/4 Dare (County-wide) $24,340,033 $25,537,2593b Dare Hatteras Island @ Hatteras $525,425 $551,270
3b/4a Dare Cape Hatteras $1,365,184 $1,432,3344a Dare Hatteras Island @ Buxton & Frisco $1,395,868 $1,464,5274a Dare Hatteras Island @ Avon $1,366,106 $1,433,3014a Dare Hatteras Island @ Salvo & Waves $820,660 $861,0264a Dare Hatteras Island @ Rodanthe $957,436 $1,004,5304b Dare Pea Island N/A N/A4b Dare Bodie Island4b Dare Nags Head $7,356,815 $7,718,6784b Dare Kill Devil Hills $5,602,655 $5,878,2354b Dare Kitty Hawk $4,482,124 $4,702,5884b Dare Southern Shores $467,761 $490,7694b Dare Duck $1,207,669 $1,267,0714b Dare Sanderling $709,266 $744,1534c Currituck (County-wide) $6,864,975 $7,202,6464c Currituck Peters Quarter $3,235,979 $3,395,1494c Currituck Corolla $2,567,827 $2,694,1324c Currituck Currituck National Wildlife Refuge N/A N/A4c Currituck Refuge to VA $1,061,169 $1,113,366
Total All All $113,805,512 $119,403,320
Included in Kure Beach
Included in Carteret County-wide total
Included in Nags Head
NC BEACH AND INLET MANAGEMENT PLAN FINAL REPORT ______________________________________________________________________________________
April 2011 IV-16
3. Value of Shore and Pier Fishing
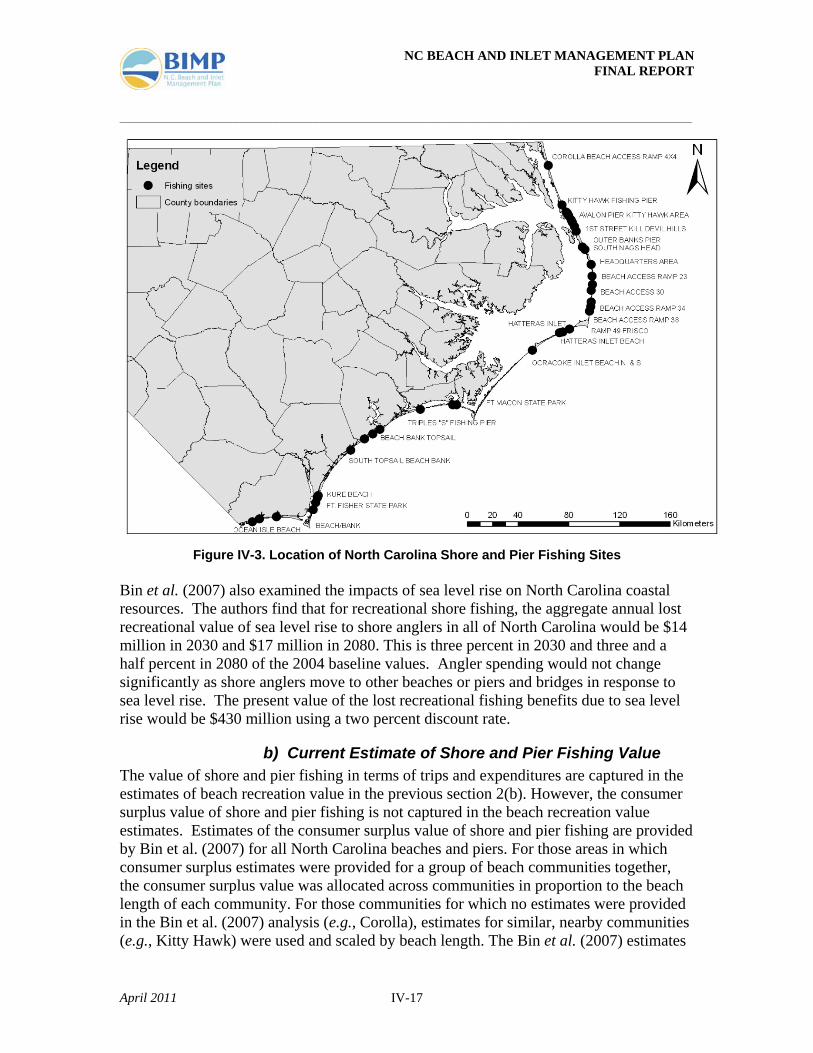
a) Background and Past Studies In addition to consumer surplus value from beach recreation, beaches also support consumer surplus value arising from shore and pier fishing (Figure IV-3). Whitehead et al. (2008b) developed estimates of the economic effects of climate change-induced sea level rise on marine recreational shore fishing in North Carolina. The most popular target species of pier and shore fisherman are spot, flounder, kingfish, seatrout, bluefish, striped bass, Spanish mackerel, red drum, and king mackerel. With regard to fishing location, 62 percent of the anglers fish from manmade structures (piers and jetties), with 38 percent fishing directly on the beach. The frequency of trips, average respondent travel cost at each site and the three-year historic average catch at each site were developed for the 22 manmade fishing sites and the 28 beach fishing sites. A large number of consumer surplus estimates were developed from the model including the loss of access to fishing sites, changes in catch rates, and changes in beach width. For example, the change in consumer surplus per trip from a change in the catch rate of one fish per hour at each site is $12.52. The change in consumer surplus per trip from an increase in beach width of 10 meters (32.81 feet) is $2.09. Both results seem to be of an appropriate magnitude which lends validity to the model. Whitehead et al. (2008) found that the cumulative loss in recreation value (consumer surplus) of shore and pier fishermen resulting from loss of beaches and beach width due to sea level rise occurring from 2006 to 2080 (assumed 1.51 feet of sea level rise from 2006 to 2080 and associated increased erosion) is potentially substantial, ranging from $757 million to $1.29 billion in present value, depending on population growth and using conservative estimates of fishing participation growth and a two percent discount rate. In addition, the present value (using a two percent discount rate) of lost business sales, labor income, capital income, and state and local tax revenue in coastal North Carolina from 2006 to 2080 due to reduced angler spending amounted to $828 million, $307 million, $130 million, and $63 million, respectively, resulting in the loss of more than 500 jobs.
NC BEACH AND INLET MANAGEMENT PLAN FINAL REPORT ______________________________________________________________________________________
April 2011 IV-17
Figure IV-3. Location of North Carolina Shore and Pier Fishing Sites
Bin et al. (2007) also examined the impacts of sea level rise on North Carolina coastal resources. The authors find that for recreational shore fishing, the aggregate annual lost recreational value of sea level rise to shore anglers in all of North Carolina would be $14 million in 2030 and $17 million in 2080. This is three percent in 2030 and three and a half percent in 2080 of the 2004 baseline values. Angler spending would not change significantly as shore anglers move to other beaches or piers and bridges in response to sea level rise. The present value of the lost recreational fishing benefits due to sea level rise would be $430 million using a two percent discount rate.
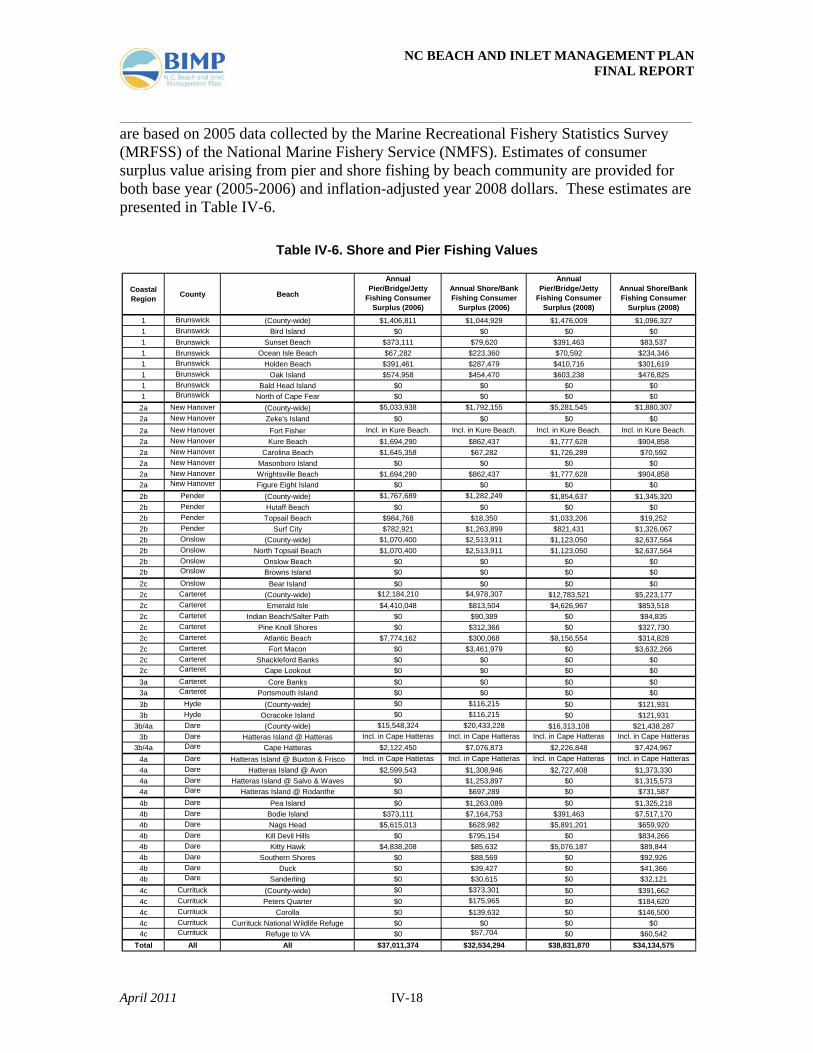
b) Current Estimate of Shore and Pier Fishing Value The value of shore and pier fishing in terms of trips and expenditures are captured in the estimates of beach recreation value in the previous section 2(b). However, the consumer surplus value of shore and pier fishing is not captured in the beach recreation value estimates. Estimates of the consumer surplus value of shore and pier fishing are provided by Bin et al. (2007) for all North Carolina beaches and piers. For those areas in which consumer surplus estimates were provided for a group of beach communities together, the consumer surplus value was allocated across communities in proportion to the beach length of each community. For those communities for which no estimates were provided in the Bin et al. (2007) analysis (e.g., Corolla), estimates for similar, nearby communities (e.g., Kitty Hawk) were used and scaled by beach length. The Bin et al. (2007) estimates
NC BEACH AND INLET MANAGEMENT PLAN FINAL REPORT ______________________________________________________________________________________
April 2011 IV-18
are based on 2005 data collected by the Marine Recreational Fishery Statistics Survey (MRFSS) of the National Marine Fishery Service (NMFS). Estimates of consumer surplus value arising from pier and shore fishing by beach community are provided for both base year (2005-2006) and inflation-adjusted year 2008 dollars. These estimates are presented in Table IV-6.
Table IV-6. Shore and Pier Fishing Values
Coastal Region County Beach
Annual Pier/Bridge/Jetty
Fishing Consumer Surplus (2006)
Annual Shore/Bank Fishing Consumer
Surplus (2006)
Annual Pier/Bridge/Jetty
Fishing Consumer Surplus (2008)
Annual Shore/Bank Fishing Consumer
Surplus (2008)
1 Brunswick (County-wide) $1,406,811 $1,044,929 $1,476,009 $1,096,3271 Brunswick Bird Island $0 $0 $0 $01 Brunswick Sunset Beach $373,111 $79,620 $391,463 $83,5371 Brunswick Ocean Isle Beach $67,282 $223,360 $70,592 $234,3461 Brunswick Holden Beach $391,461 $287,479 $410,716 $301,6191 Brunswick Oak Island $574,958 $454,470 $603,238 $476,8251 Brunswick Bald Head Island $0 $0 $0 $01 Brunswick North of Cape Fear $0 $0 $0 $0
2a New Hanover (County-wide) $5,033,938 $1,792,155 $5,281,545 $1,880,3072a New Hanover Zeke's Island $0 $0 $0 $02a New Hanover Fort Fisher Incl. in Kure Beach. Incl. in Kure Beach. Incl. in Kure Beach. Incl. in Kure Beach.2a New Hanover Kure Beach $1,694,290 $862,437 $1,777,628 $904,8582a New Hanover Carolina Beach $1,645,358 $67,282 $1,726,289 $70,5922a New Hanover Masonboro Island $0 $0 $0 $02a New Hanover Wrightsville Beach $1,694,290 $862,437 $1,777,628 $904,8582a New Hanover Figure Eight Island $0 $0 $0 $02b Pender (County-wide) $1,767,689 $1,282,249 $1,854,637 $1,345,3202b Pender Hutaff Beach $0 $0 $0 $02b Pender Topsail Beach $984,768 $18,350 $1,033,206 $19,2522b Pender Surf City $782,921 $1,263,899 $821,431 $1,326,0672b Onslow (County-wide) $1,070,400 $2,513,911 $1,123,050 $2,637,5642b Onslow North Topsail Beach $1,070,400 $2,513,911 $1,123,050 $2,637,5642b Onslow Onslow Beach $0 $0 $0 $02b Onslow Browns Island $0 $0 $0 $02c Onslow Bear Island $0 $0 $0 $02c Carteret (County-wide) $12,184,210 $4,978,307 $12,783,521 $5,223,1772c Carteret Emerald Isle $4,410,048 $813,504 $4,626,967 $853,5182c Carteret Indian Beach/Salter Path $0 $90,389 $0 $94,8352c Carteret Pine Knoll Shores $0 $312,366 $0 $327,7302c Carteret Atlantic Beach $7,774,162 $300,068 $8,156,554 $314,8282c Carteret Fort Macon $0 $3,461,979 $0 $3,632,2662c Carteret Shackleford Banks $0 $0 $0 $02c Carteret Cape Lookout $0 $0 $0 $03a Carteret Core Banks $0 $0 $0 $03a Carteret Portsmouth Island $0 $0 $0 $03b Hyde (County-wide) $0 $116,215 $0 $121,9313b Hyde Ocracoke Island $0 $116,215 $0 $121,931
3b/4a Dare (County-wide) $15,548,324 $20,433,228 $16,313,108 $21,438,2873b Dare Hatteras Island @ Hatteras Incl. in Cape Hatteras Incl. in Cape Hatteras Incl. in Cape Hatteras Incl. in Cape Hatteras
3b/4a Dare Cape Hatteras $2,122,450 $7,076,873 $2,226,848 $7,424,9674a Dare Hatteras Island @ Buxton & Frisco Incl. in Cape Hatteras Incl. in Cape Hatteras Incl. in Cape Hatteras Incl. in Cape Hatteras4a Dare Hatteras Island @ Avon $2,599,543 $1,308,946 $2,727,408 $1,373,3304a Dare Hatteras Island @ Salvo & Waves $0 $1,253,897 $0 $1,315,5734a Dare Hatteras Island @ Rodanthe $0 $697,289 $0 $731,5874b Dare Pea Island $0 $1,263,089 $0 $1,325,2184b Dare Bodie Island $373,111 $7,164,753 $391,463 $7,517,1704b Dare Nags Head $5,615,013 $628,982 $5,891,201 $659,9204b Dare Kill Devil Hills $0 $795,154 $0 $834,2664b Dare Kitty Hawk $4,838,208 $85,632 $5,076,187 $89,8444b Dare Southern Shores $0 $88,569 $0 $92,9264b Dare Duck $0 $39,427 $0 $41,3664b Dare Sanderling $0 $30,615 $0 $32,1214c Currituck (County-wide) $0 $373,301 $0 $391,6624c Currituck Peters Quarter $0 $175,965 $0 $184,6204c Currituck Corolla $0 $139,632 $0 $146,5004c Currituck Currituck National Wildlife Refuge $0 $0 $0 $04c Currituck Refuge to VA $0 $57,704 $0 $60,542
Total All All $37,011,374 $32,534,294 $38,831,870 $34,134,575
NC BEACH AND INLET MANAGEMENT PLAN FINAL REPORT ______________________________________________________________________________________
April 2011 IV-19
4. Value of Marine Recreational Services
a) Background and Past Studies To date, little investigation has been made into the value of marine recreational services in North Carolina. Dumas and Ayres (2008) completed a study, and this work was the basis of the analysis outlined below.
b) Current Estimate of Marine Recreational Service Value
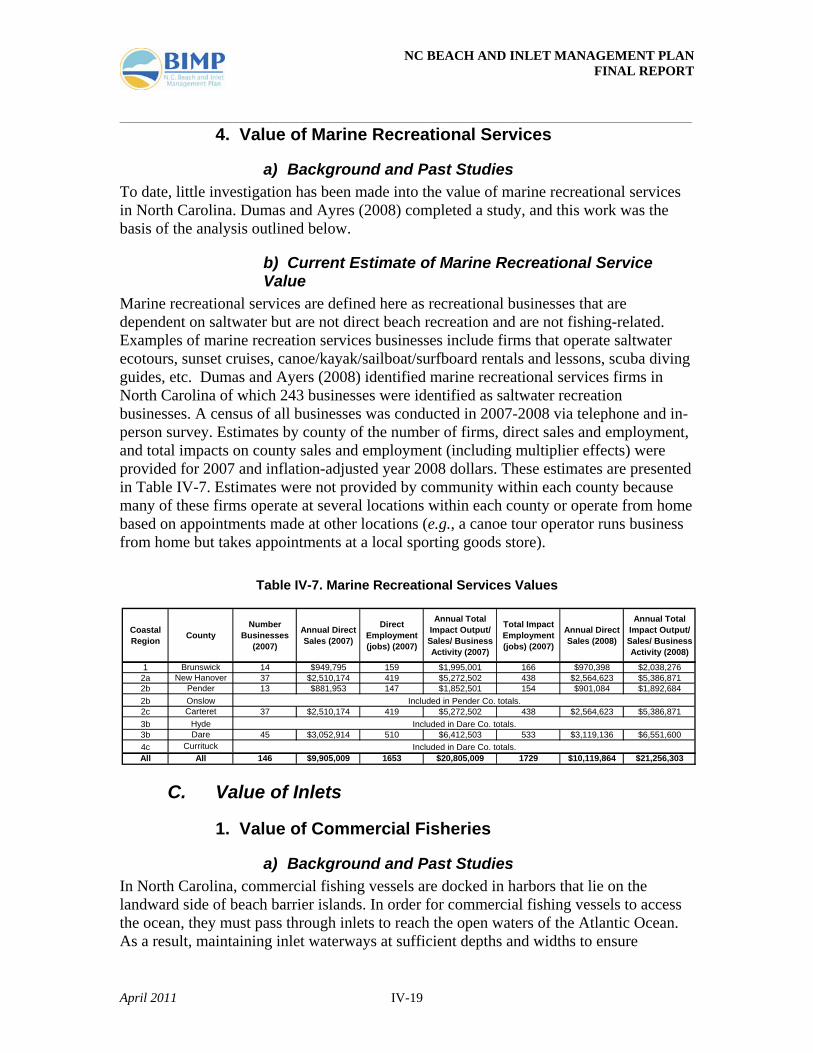
Marine recreational services are defined here as recreational businesses that are dependent on saltwater but are not direct beach recreation and are not fishing-related. Examples of marine recreation services businesses include firms that operate saltwater ecotours, sunset cruises, canoe/kayak/sailboat/surfboard rentals and lessons, scuba diving guides, etc. Dumas and Ayers (2008) identified marine recreational services firms in North Carolina of which 243 businesses were identified as saltwater recreation businesses. A census of all businesses was conducted in 2007-2008 via telephone and in-person survey. Estimates by county of the number of firms, direct sales and employment, and total impacts on county sales and employment (including multiplier effects) were provided for 2007 and inflation-adjusted year 2008 dollars. These estimates are presented in Table IV-7. Estimates were not provided by community within each county because many of these firms operate at several locations within each county or operate from home based on appointments made at other locations (e.g., a canoe tour operator runs business from home but takes appointments at a local sporting goods store).
Table IV-7. Marine Recreational Services Values
C. Value of Inlets
1. Value of Commercial Fisheries
a) Background and Past Studies In North Carolina, commercial fishing vessels are docked in harbors that lie on the landward side of beach barrier islands. In order for commercial fishing vessels to access the ocean, they must pass through inlets to reach the open waters of the Atlantic Ocean. As a result, maintaining inlet waterways at sufficient depths and widths to ensure
Coastal Region County
Number Businesses
(2007)
Annual Direct Sales (2007)
Direct Employment (jobs) (2007)
Annual Total Impact Output/ Sales/ Business Activity (2007)
Total Impact Employment (jobs) (2007)
Annual Direct Sales (2008)
Annual Total Impact Output/ Sales/ Business Activity (2008)
1 Brunswick 14 $949,795 159 $1,995,001 166 $970,398 $2,038,2762a New Hanover 37 $2,510,174 419 $5,272,502 438 $2,564,623 $5,386,8712b Pender 13 $881,953 147 $1,852,501 154 $901,084 $1,892,6842b Onslow2c Carteret 37 $2,510,174 419 $5,272,502 438 $2,564,623 $5,386,8713b Hyde3b Dare 45 $3,052,914 510 $6,412,503 533 $3,119,136 $6,551,6004c CurrituckAll All 146 $9,905,009 1653 $20,805,009 1729 $10,119,864 $21,256,303
Included in Pender Co. totals.
Included in Dare Co. totals.
Included in Dare Co. totals.
NC BEACH AND INLET MANAGEMENT PLAN FINAL REPORT ______________________________________________________________________________________
April 2011 IV-20
navigability is important for maintaining ocean access for the commercial fishery. Not all commercial fishing requires ocean access. Some fishing is done in the sounds and waterways landward of the barrier islands. However, most fishing vessels fish in the ocean at least part of the year, and many fish exclusively in the ocean.
A recent study (Moffatt & Nichol and Dumas, 2006) to assess the economic benefits of Oregon Inlet to Dare County and the surrounding region found that commercial fishing through Oregon Inlet provides a total annual economic benefit of 90 jobs and $7.2 million to Dare County and the surrounding region. The associated seafood packing and processing industry provides a total annual economic benefit of 238 jobs and $33.4 million to Dare County and the surrounding region through Oregon Inlet-dependent landings.
b) Current Estimate of Commercial Fishing Value The N.C. Division of Marine Fisheries (DMF) tracks sales of commercial fishery landings at dockside (DMF 2008b). These dockside sales data provide information on the magnitude of commercial fishery landings value and its geographic distribution along the coast. However, the dockside sales data are actually reported by the seafood dealer who buys the fish from the fisherman, and the sales are attributed to the seafood dealer's business location (referred to as “landings by dealer city”). For example, if a seafood dealer based in New Hanover County travels to Brunswick County to buy fish from a Brunswick County fisherman who landed the fish at a Brunswick County location, the fish are recorded as being landed in New Hanover County, the seafood dealer’s location. This implies that there is some discrepancy between the geographic distribution of landings as reported in the DMF data and the actual geographic distribution of landings. This is important if one is trying to determine the relative value of seafood landings in various ports or counties since the geographic distribution of landings in the DMF data may not reflect the true distribution of landings. Personal communication with DMF License and Statistics Section staff confirmed that the distribution of landings in the DMF data provide the best estimate of the true distribution of landings. With this caveat, this study proceeded with the analysis on the assumption that the distribution of landings in the DMF data is equivalent to the true distribution of landings. In making this assumption, the estimates of statewide commercial fishery value and regional (northern, central, southern coast) values should not be greatly biased, but estimates of relative value at adjacent ports or counties could be significantly biased in cases where there is significant seafood dealer activity between ports and across counties.
DMF commercial seafood landings values by dealer city for 2007 were used as estimates of direct sales/output of the commercial fishery by port. These values were then attributed to use of the nearest inlet. Exceptions include landings in Currituck, Pasquotank, Perquimans, Camden, Chowan, Tyrrell, Washington, Beaufort, Pamlico, and Craven Counties, which were assumed to be based primarily on fishing in the sounds and bays without making use of the ocean inlets and so are not considered in the analysis. All landings in Hyde County were attributed to Ocracoke Inlet except landings at Engelhard
NC BEACH AND INLET MANAGEMENT PLAN FINAL REPORT ______________________________________________________________________________________
April 2011 IV-21
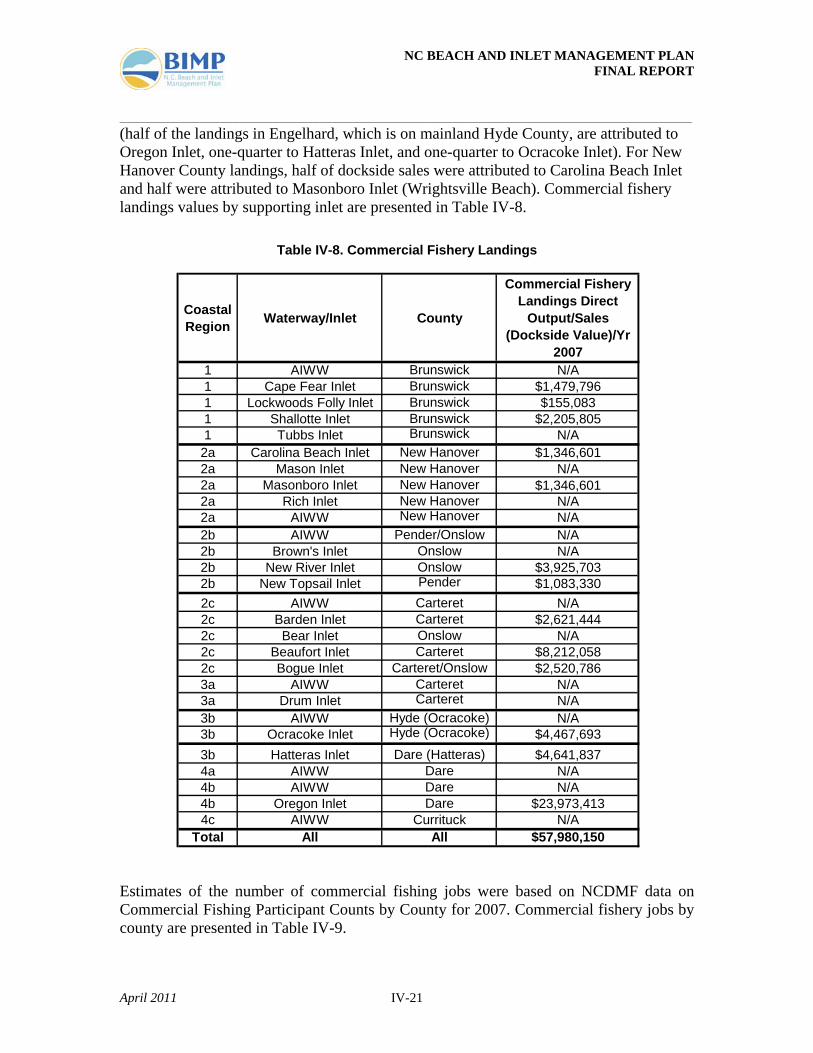
(half of the landings in Engelhard, which is on mainland Hyde County, are attributed to Oregon Inlet, one-quarter to Hatteras Inlet, and one-quarter to Ocracoke Inlet). For New Hanover County landings, half of dockside sales were attributed to Carolina Beach Inlet and half were attributed to Masonboro Inlet (Wrightsville Beach). Commercial fishery landings values by supporting inlet are presented in Table IV-8.
Table IV-8. Commercial Fishery Landings
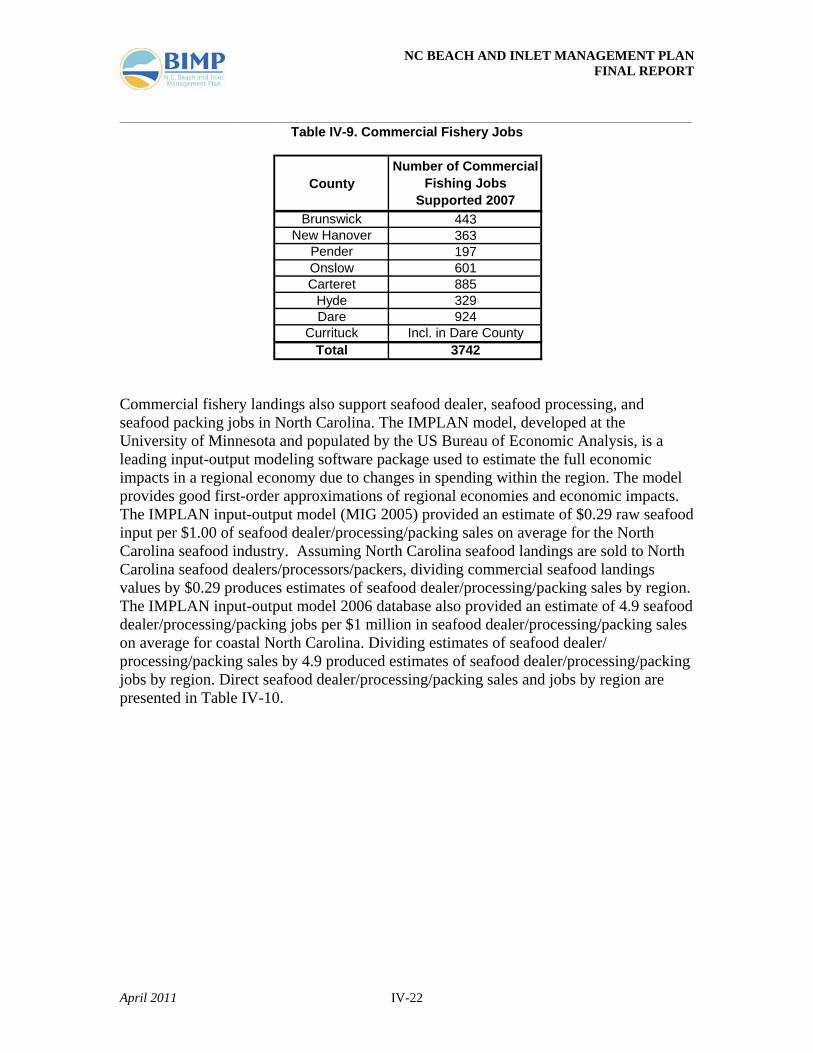
Estimates of the number of commercial fishing jobs were based on NCDMF data on Commercial Fishing Participant Counts by County for 2007. Commercial fishery jobs by county are presented in Table IV-9.
Coastal Region Waterway/Inlet County
Commercial Fishery Landings Direct
Output/Sales (Dockside Value)/Yr
20071 AIWW Brunswick N/A1 Cape Fear Inlet Brunswick $1,479,7961 Lockwoods Folly Inlet Brunswick $155,0831 Shallotte Inlet Brunswick $2,205,8051 Tubbs Inlet Brunswick N/A2a Carolina Beach Inlet New Hanover $1,346,6012a Mason Inlet New Hanover N/A2a Masonboro Inlet New Hanover $1,346,6012a Rich Inlet New Hanover N/A2a AIWW New Hanover N/A2b AIWW Pender/Onslow N/A2b Brown's Inlet Onslow N/A2b New River Inlet Onslow $3,925,7032b New Topsail Inlet Pender $1,083,3302c AIWW Carteret N/A2c Barden Inlet Carteret $2,621,4442c Bear Inlet Onslow N/A2c Beaufort Inlet Carteret $8,212,0582c Bogue Inlet Carteret/Onslow $2,520,7863a AIWW Carteret N/A3a Drum Inlet Carteret N/A3b AIWW Hyde (Ocracoke) N/A3b Ocracoke Inlet Hyde (Ocracoke) $4,467,6933b Hatteras Inlet Dare (Hatteras) $4,641,8374a AIWW Dare N/A4b AIWW Dare N/A4b Oregon Inlet Dare $23,973,4134c AIWW Currituck N/A
Total All All $57,980,150
NC BEACH AND INLET MANAGEMENT PLAN FINAL REPORT ______________________________________________________________________________________
April 2011 IV-22
Table IV-9. Commercial Fishery Jobs
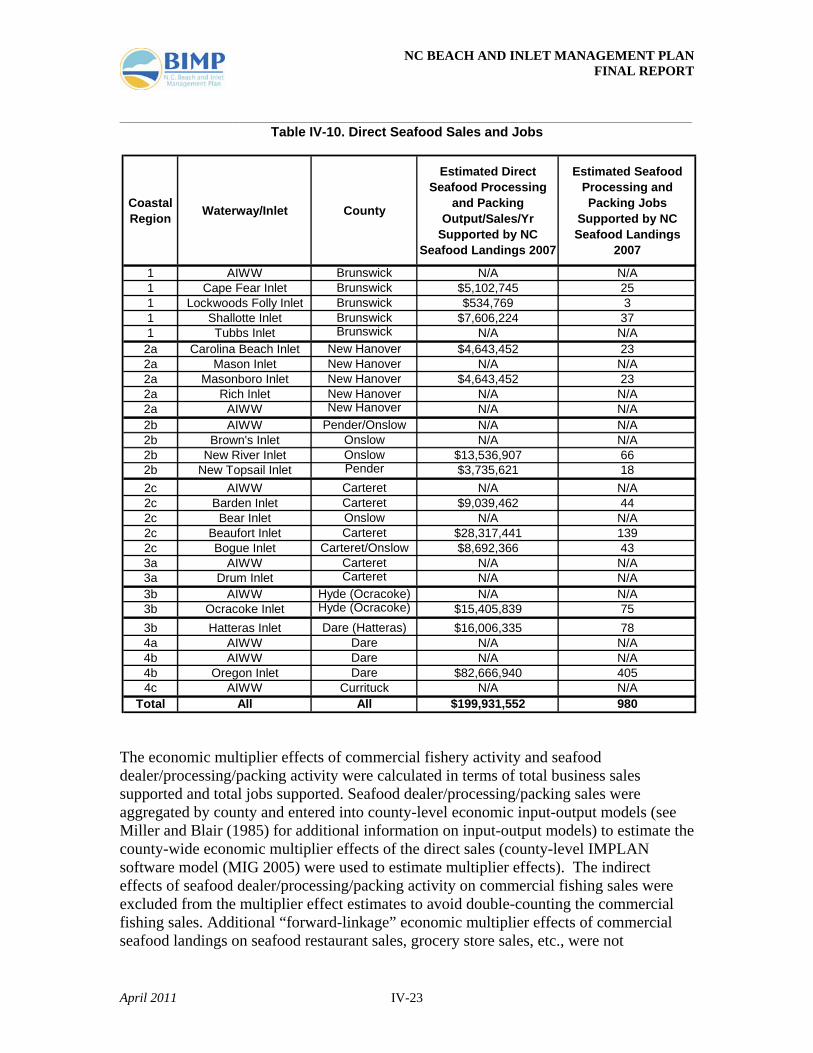
Commercial fishery landings also support seafood dealer, seafood processing, and seafood packing jobs in North Carolina. The IMPLAN model, developed at the University of Minnesota and populated by the US Bureau of Economic Analysis, is a leading input-output modeling software package used to estimate the full economic impacts in a regional economy due to changes in spending within the region. The model provides good first-order approximations of regional economies and economic impacts. The IMPLAN input-output model (MIG 2005) provided an estimate of $0.29 raw seafood input per $1.00 of seafood dealer/processing/packing sales on average for the North Carolina seafood industry. Assuming North Carolina seafood landings are sold to North Carolina seafood dealers/processors/packers, dividing commercial seafood landings values by $0.29 produces estimates of seafood dealer/processing/packing sales by region. The IMPLAN input-output model 2006 database also provided an estimate of 4.9 seafood dealer/processing/packing jobs per $1 million in seafood dealer/processing/packing sales on average for coastal North Carolina. Dividing estimates of seafood dealer/ processing/packing sales by 4.9 produced estimates of seafood dealer/processing/packing jobs by region. Direct seafood dealer/processing/packing sales and jobs by region are presented in Table IV-10.
CountyNumber of Commercial
Fishing Jobs Supported 2007
Brunswick 443New Hanover 363
Pender 197Onslow 601Carteret 885
Hyde 329Dare 924
Currituck Incl. in Dare CountyTotal 3742
NC BEACH AND INLET MANAGEMENT PLAN FINAL REPORT ______________________________________________________________________________________
April 2011 IV-23
Table IV-10. Direct Seafood Sales and Jobs
The economic multiplier effects of commercial fishery activity and seafood dealer/processing/packing activity were calculated in terms of total business sales supported and total jobs supported. Seafood dealer/processing/packing sales were aggregated by county and entered into county-level economic input-output models (see Miller and Blair (1985) for additional information on input-output models) to estimate the county-wide economic multiplier effects of the direct sales (county-level IMPLAN software model (MIG 2005) were used to estimate multiplier effects). The indirect effects of seafood dealer/processing/packing activity on commercial fishing sales were excluded from the multiplier effect estimates to avoid double-counting the commercial fishing sales. Additional “forward-linkage” economic multiplier effects of commercial seafood landings on seafood restaurant sales, grocery store sales, etc., were not
Coastal Region Waterway/Inlet County
Estimated Direct Seafood Processing
and Packing Output/Sales/Yr
Supported by NC Seafood Landings 2007
Estimated Seafood Processing and Packing Jobs
Supported by NC Seafood Landings
2007
1 AIWW Brunswick N/A N/A1 Cape Fear Inlet Brunswick $5,102,745 251 Lockwoods Folly Inlet Brunswick $534,769 31 Shallotte Inlet Brunswick $7,606,224 371 Tubbs Inlet Brunswick N/A N/A2a Carolina Beach Inlet New Hanover $4,643,452 232a Mason Inlet New Hanover N/A N/A2a Masonboro Inlet New Hanover $4,643,452 232a Rich Inlet New Hanover N/A N/A2a AIWW New Hanover N/A N/A2b AIWW Pender/Onslow N/A N/A2b Brown's Inlet Onslow N/A N/A2b New River Inlet Onslow $13,536,907 662b New Topsail Inlet Pender $3,735,621 182c AIWW Carteret N/A N/A2c Barden Inlet Carteret $9,039,462 442c Bear Inlet Onslow N/A N/A2c Beaufort Inlet Carteret $28,317,441 1392c Bogue Inlet Carteret/Onslow $8,692,366 433a AIWW Carteret N/A N/A3a Drum Inlet Carteret N/A N/A3b AIWW Hyde (Ocracoke) N/A N/A3b Ocracoke Inlet Hyde (Ocracoke) $15,405,839 753b Hatteras Inlet Dare (Hatteras) $16,006,335 784a AIWW Dare N/A N/A4b AIWW Dare N/A N/A4b Oregon Inlet Dare $82,666,940 4054c AIWW Currituck N/A N/A
Total All All $199,931,552 980
NC BEACH AND INLET MANAGEMENT PLAN FINAL REPORT ______________________________________________________________________________________
April 2011 IV-24
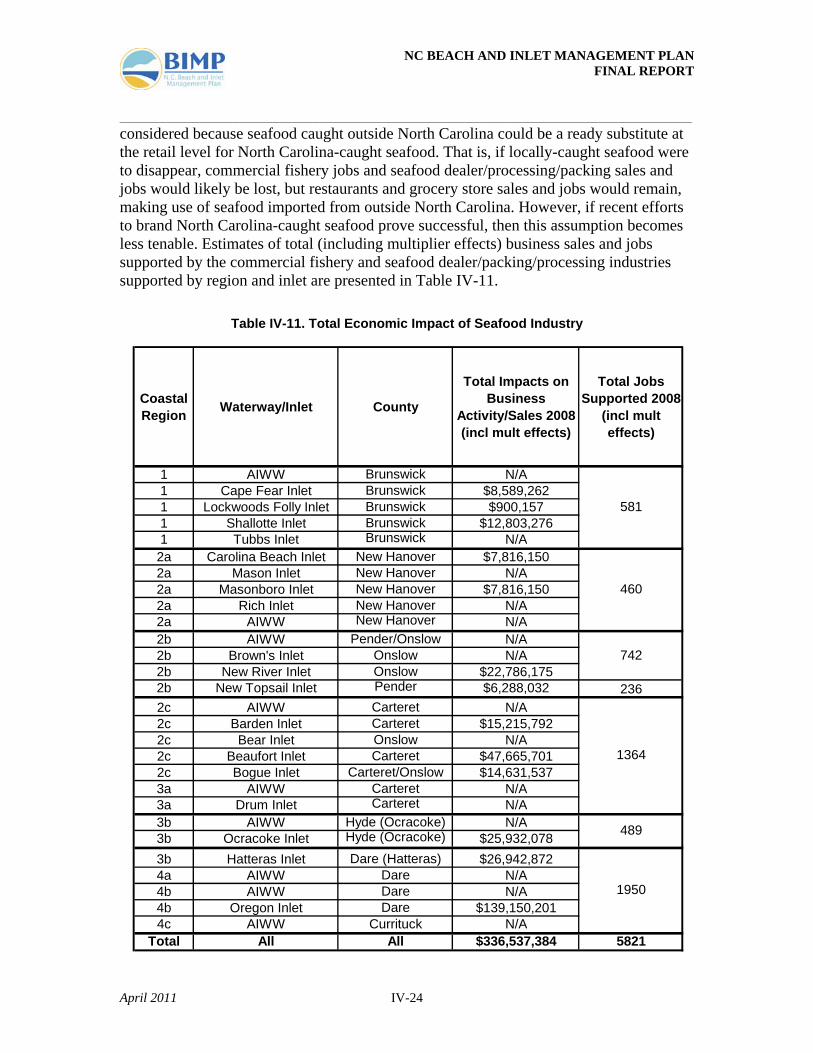
considered because seafood caught outside North Carolina could be a ready substitute at the retail level for North Carolina-caught seafood. That is, if locally-caught seafood were to disappear, commercial fishery jobs and seafood dealer/processing/packing sales and jobs would likely be lost, but restaurants and grocery store sales and jobs would remain, making use of seafood imported from outside North Carolina. However, if recent efforts to brand North Carolina-caught seafood prove successful, then this assumption becomes less tenable. Estimates of total (including multiplier effects) business sales and jobs supported by the commercial fishery and seafood dealer/packing/processing industries supported by region and inlet are presented in Table IV-11.
Table IV-11. Total Economic Impact of Seafood Industry
Coastal Region Waterway/Inlet County
Total Impacts on Business
Activity/Sales 2008 (incl mult effects)
Total Jobs Supported 2008
(incl mult effects)
1 AIWW Brunswick N/A1 Cape Fear Inlet Brunswick $8,589,2621 Lockwoods Folly Inlet Brunswick $900,1571 Shallotte Inlet Brunswick $12,803,2761 Tubbs Inlet Brunswick N/A2a Carolina Beach Inlet New Hanover $7,816,1502a Mason Inlet New Hanover N/A2a Masonboro Inlet New Hanover $7,816,1502a Rich Inlet New Hanover N/A2a AIWW New Hanover N/A2b AIWW Pender/Onslow N/A2b Brown's Inlet Onslow N/A2b New River Inlet Onslow $22,786,1752b New Topsail Inlet Pender $6,288,032 2362c AIWW Carteret N/A2c Barden Inlet Carteret $15,215,7922c Bear Inlet Onslow N/A2c Beaufort Inlet Carteret $47,665,7012c Bogue Inlet Carteret/Onslow $14,631,5373a AIWW Carteret N/A3a Drum Inlet Carteret N/A3b AIWW Hyde (Ocracoke) N/A3b Ocracoke Inlet Hyde (Ocracoke) $25,932,0783b Hatteras Inlet Dare (Hatteras) $26,942,8724a AIWW Dare N/A4b AIWW Dare N/A4b Oregon Inlet Dare $139,150,2014c AIWW Currituck N/A
Total All All $336,537,384 5821
489
1950
581
1364
460
742
NC BEACH AND INLET MANAGEMENT PLAN FINAL REPORT ______________________________________________________________________________________
April 2011 IV-25
2. Value of For-Hire (Charter Boat and Head Boat) Fisheries
a) Background and Past Studies The “for-hire” fisheries of North Carolina include the charter boat fishery and the head boat fishery. Charter boats take three to 12 (typically six) anglers on half-day or full-day saltwater fishing trips for a fee. Charter boat trips are customized, relatively expensive ($100-$250 per person) fishing trips. Head boats take 20 to 100 anglers on half-day or full-day saltwater fishing trips for a lower fee ($30-$125 per person). Head boat trips are less customized and less exclusive, and, therefore, less expensive. In 2002, a study of a prime recreational fishing area northeast of Cape Hatteras, known as The Point, was performed to evaluate economic impacts that would result from the proposed construction of exploratory wells for potential oil and gas production by Chevron Corporation (Palmquist, Schumann and Michael, 2002). Although not directly related to Oregon Inlet, the goals of the study included providing information on the value of recreational fishing at The Point and estimating the potential losses to recreational fishing if an oil spill were to occur in this area. Given the location of The Point, it is likely a large percentage of anglers in this area come from Dare County through Oregon Inlet. The study used Marine Recreational Fisheries Statistics Survey (MRFSS) data from 1990 and National Marine Fisheries Service (NMFS) statistics on trip numbers to estimate losses, in dollars, to recreational anglers due to various closure scenarios. The total number of trips involving private and charter boats originating in Dare County and traveling to a location greater than three miles offshore was estimated at approximately 97,800 for 1990. Determined economic losses from various scenarios involving closure of the site and for some scenarios prolonged reduction in available catch (e.g., 50 percent reduction in probability of success for a six-month period) ranged from as low as $1,300 during January and February (an off-season period) to $460,000 for July and August (peak period, worst-case scenario).
Another recent study (Moffatt & Nichol and Dumas, 2006) to assess the economic benefits of Oregon Inlet to Dare County and the surrounding region found that Oregon Inlet-dependent recreational fishing and tourism provides a total annual economic benefit of 8,288 jobs and $502.8 million to Dare County and the surrounding region. Recreational charter fishing accounted for 596 jobs and $39.3 million and recreational sportfish tournaments for 480 jobs and $31.0 million. Unfortunately, a complete breakdown was not available for the private versus rental (head boat) fishing benefits.
b) Current Estimate of For Hire Fisheries Value Dumas et al. (2009) conducted a study to estimate the economic impacts and benefits of the North Carolina for-hire fishery. Two surveys were conducted in 2007-2008 to collect data for the study. A mail survey of charter and head boat captains obtained information on the home ports, numbers of vessels by type (charter boat vs. head boat) and length, numbers of vessel trips by month, fish species targeted, crew sizes, fees charged, and
NC BEACH AND INLET MANAGEMENT PLAN FINAL REPORT ______________________________________________________________________________________
April 2011 IV-26
fixed and variable vessel costs. Over 150 captain surveys were obtained. Two surveys of for-hire passengers, an on-site dockside survey, and a telephone follow-up survey collected information from passengers on fees paid, fish caught, numbers of trips per year and trip locations, numbers of non-fishing traveling companions accompanying the angler on the visit to the coast, and “off vessel” expenditures of both the angler and non-fishing travelling companions on lodging, restaurants, groceries, gasoline, shopping, etc. More than 1,300 passenger surveys were obtained.
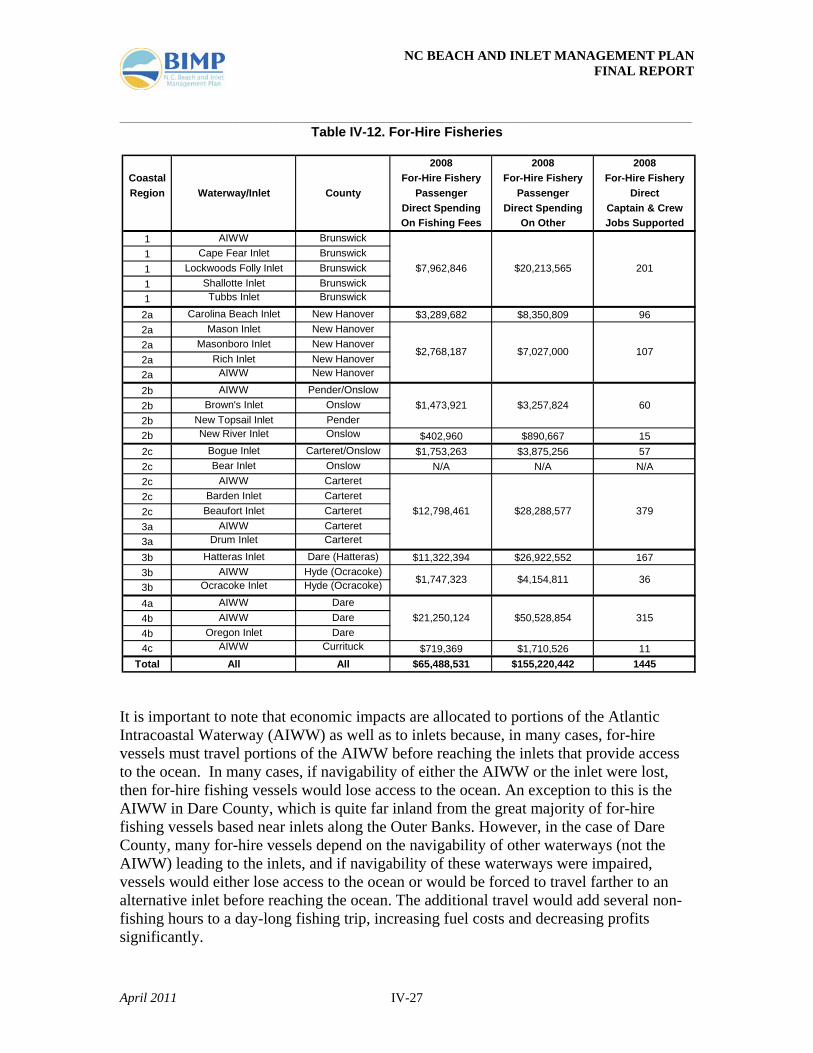
The Dumas et al. (2009) study data were used to estimate numbers of trips and expenditures per vessel per year by vessel type (charter vs. head boat), trip type (half-day vs. full-day trips), and vessel length. Data from the DMF on the numbers of for-hire vessels by port and by vessel length (DMF 2008a) were used to aggregate the per vessel values from the Dumas et al. (2000) study to total amounts for all vessel by port and inlet. Estimates of the numbers of for-hire captain and crew jobs, direct expenditures by passengers on for-hire fishing fees (equal to the direct sales of the for-hire industry), and additional direct “off-vessel” expenditures by for-hire passengers on restaurants, gasoline for car, shopping, etc., by inlet are presented in Table IV-12. “Off-vessel” expenditures do not include expenditures on lodging or any expenditure made by non-fishing traveling companions. It is assumed that non-fishing traveling companions go to the beach, and any expenditure made by these traveling companions are included under the beach recreation impacts reported in this study. It is also assumed that the lodging expenditures reported by non-fishing traveling companions include the lodging expenses of the for-hire passengers. Taken together, these assumptions produce a conservative estimate of the off-vessel spending of for-hire anglers and their traveling companions; if the assumptions are incorrect, then it is likely that off-vessel spending and its economic impact are larger than reported here.
NC BEACH AND INLET MANAGEMENT PLAN FINAL REPORT ______________________________________________________________________________________
April 2011 IV-27
Table IV-12. For-Hire Fisheries
It is important to note that economic impacts are allocated to portions of the Atlantic Intracoastal Waterway (AIWW) as well as to inlets because, in many cases, for-hire vessels must travel portions of the AIWW before reaching the inlets that provide access to the ocean. In many cases, if navigability of either the AIWW or the inlet were lost, then for-hire fishing vessels would lose access to the ocean. An exception to this is the AIWW in Dare County, which is quite far inland from the great majority of for-hire fishing vessels based near inlets along the Outer Banks. However, in the case of Dare County, many for-hire vessels depend on the navigability of other waterways (not the AIWW) leading to the inlets, and if navigability of these waterways were impaired, vessels would either lose access to the ocean or would be forced to travel farther to an alternative inlet before reaching the ocean. The additional travel would add several non-fishing hours to a day-long fishing trip, increasing fuel costs and decreasing profits significantly.
2008 2008 2008Coastal For-Hire Fishery For-Hire Fishery For-Hire FisheryRegion Waterway/Inlet County Passenger Passenger Direct
Direct Spending Direct Spending Captain & CrewOn Fishing Fees On Other Jobs Supported
1 AIWW Brunswick1 Cape Fear Inlet Brunswick1 Lockwoods Folly Inlet Brunswick1 Shallotte Inlet Brunswick1 Tubbs Inlet Brunswick
2a Carolina Beach Inlet New Hanover $3,289,682 $8,350,809 962a Mason Inlet New Hanover2a Masonboro Inlet New Hanover2a Rich Inlet New Hanover2a AIWW New Hanover
2b AIWW Pender/Onslow2b Brown's Inlet Onslow2b New Topsail Inlet Pender2b New River Inlet Onslow $402,960 $890,667 152c Bogue Inlet Carteret/Onslow $1,753,263 $3,875,256 572c Bear Inlet Onslow N/A N/A N/A2c AIWW Carteret2c Barden Inlet Carteret2c Beaufort Inlet Carteret3a AIWW Carteret3a Drum Inlet Carteret
3b Hatteras Inlet Dare (Hatteras) $11,322,394 $26,922,552 1673b AIWW Hyde (Ocracoke)3b Ocracoke Inlet Hyde (Ocracoke)
4a AIWW Dare4b AIWW Dare4b Oregon Inlet Dare4c AIWW Currituck $719,369 $1,710,526 11
Total All All $65,488,531 $155,220,442 1445
$1,473,921 $3,257,824 60
$2,768,187 $7,027,000 107
$1,747,323 $4,154,811 36
$21,250,124 $50,528,854 315
$12,798,461 $28,288,577 379
$7,962,846 $20,213,565 201
NC BEACH AND INLET MANAGEMENT PLAN FINAL REPORT ______________________________________________________________________________________
April 2011 IV-28
Direct expenditures of for-hire vessels and their passengers by expenditure category (fuel, engine repair, restaurants, gasoline for car, fishing tackle, etc.) were summed across all inlets by county. These county-level direct expenditures by expenditure category were then entered into county-level economic input-output models (see Miller and Blair 1985 for additional information on input-output models) to estimate the county-wide economic multiplier effects of the direct expenditures (county-level IMPLAN software models (MIG 2005) were used to estimate multiplier effects). The input-output models provided estimates of total business sales (also known as economic output or business activity) and employment supported in each county by the expenditures of for-hire vessels and their passengers. County-level impacts were then allocated to inlets in proportion to direct expenditures supported by each inlet. Adjustment for inflation was not required because the data were already in baseline year 2008 dollars. These estimates are presented in Table IV-13.

NC BEACH AND INLET MANAGEMENT PLAN FINAL REPORT ______________________________________________________________________________________
April 2011 IV-29
Table IV-13. For-Hire Fisheries Total Impacts
2008 2008Coastal For-Hire Fishery For-Hire FisheryRegion Waterway/Inlet County Total Impact Total Impact
(incl mult effects) (incl mult effects)Business Activity Jobs Supported
1 AIWW Brunswick1 Cape Fear Inlet Brunswick1 Lockwoods Folly Inlet Brunswick1 Shallotte Inlet Brunswick1 Tubbs Inlet Brunswick
2a Carolina Beach Inlet New Hanover $23,391,045 3742a Mason Inlet New Hanover2a Masonboro Inlet New Hanover2a Rich Inlet New Hanover2a AIWW New Hanover
2b AIWW Pender/Onslow2b Brown's Inlet Onslow2b New Topsail Inlet Pender2b New River Inlet Onslow $2,635,124 472c Bogue Inlet Carteret/Onslow $11,465,311 1942c Bear Inlet Onslow N/A N/A2c AIWW Carteret2c Barden Inlet Carteret2c Beaufort Inlet Carteret3a AIWW Carteret3a Drum Inlet Carteret
3b Hatteras Inlet Dare (Hatteras) $77,341,738 9633b AIWW Hyde (Ocracoke)3b Ocracoke Inlet Hyde (Ocracoke)
4a AIWW Dare4b AIWW Dare4b Oregon Inlet Dare4c AIWW Currituck $4,913,911 61
Total All All $446,474,798 6368
359
$9,638,580 183
$19,682,988
1809
$11,935,729 166
$145,156,721
852
$83,694,419 1358
$56,619,233
NC BEACH AND INLET MANAGEMENT PLAN FINAL REPORT ______________________________________________________________________________________
April 2011 IV-30
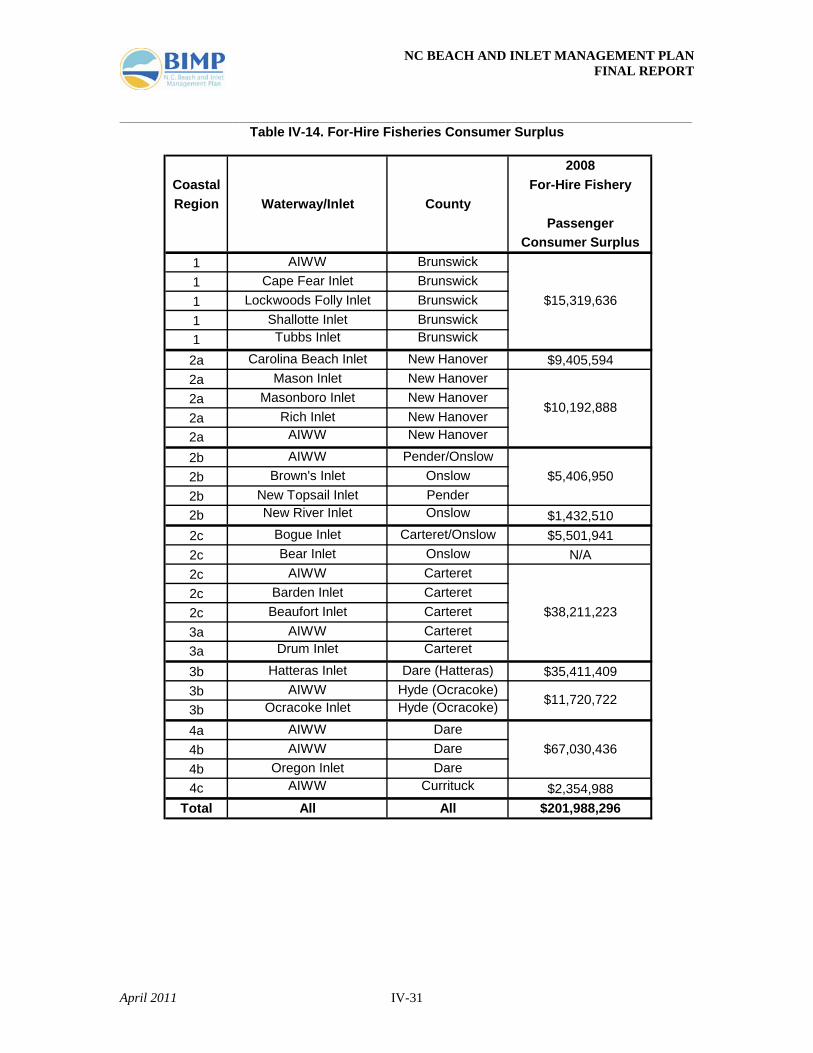
In addition to the direct economic expenditures of beach recreationists and the economic multiplier effects of the expenditures, for-hire anglers also enjoy “consumer surplus” value during fishing trips. Consumer surplus is the value to the recreationist of the recreation experience itself, value beyond the expenditures made in order to gain access to the experience. For example, if an angler would have been willing to pay $2,000 for a for-hire fishing trip but ends up spending only $1,300, then the consumer surplus is the difference of $700. Dumas et al. (2009) estimated consumer surplus values for for-hire fishing passengers in North Carolina. The average estimates of consumer surplus value are $624 per trip per passenger for charter trips and $102 per trip per passenger for head boat trips. These estimates of consumer surplus per trip are multiplied by the number of passenger trips to obtain estimates of consumer surplus value by inlet. These consumer surplus estimates are presented in Table IV-14.
NC BEACH AND INLET MANAGEMENT PLAN FINAL REPORT ______________________________________________________________________________________
April 2011 IV-31
Table IV-14. For-Hire Fisheries Consumer Surplus
2008Coastal For-Hire FisheryRegion Waterway/Inlet County
PassengerConsumer Surplus
1 AIWW Brunswick1 Cape Fear Inlet Brunswick1 Lockwoods Folly Inlet Brunswick1 Shallotte Inlet Brunswick1 Tubbs Inlet Brunswick
2a Carolina Beach Inlet New Hanover $9,405,5942a Mason Inlet New Hanover2a Masonboro Inlet New Hanover2a Rich Inlet New Hanover2a AIWW New Hanover
2b AIWW Pender/Onslow2b Brown's Inlet Onslow2b New Topsail Inlet Pender2b New River Inlet Onslow $1,432,5102c Bogue Inlet Carteret/Onslow $5,501,9412c Bear Inlet Onslow N/A2c AIWW Carteret2c Barden Inlet Carteret2c Beaufort Inlet Carteret3a AIWW Carteret3a Drum Inlet Carteret
3b Hatteras Inlet Dare (Hatteras) $35,411,4093b AIWW Hyde (Ocracoke)3b Ocracoke Inlet Hyde (Ocracoke)
4a AIWW Dare4b AIWW Dare4b Oregon Inlet Dare4c AIWW Currituck $2,354,988
Total All All $201,988,296
$10,192,888
$5,406,950
$67,030,436
$11,720,722
$15,319,636
$38,211,223
NC BEACH AND INLET MANAGEMENT PLAN FINAL REPORT ______________________________________________________________________________________
April 2011 IV-32
3. Value of Private Recreational Boating
a) Background and Previous Studies In 1995, Dare County initiated a study geared at understanding transient boater trends through the area in an effort to attract more boaters to Dare County ports (Professional Management Group, Inc, 1995). In the context of the study, transient boaters were defined as those using the AIWW to travel between northern and southern states. Since the AIWW is within a few hours by boat to Dare County ports, the goal of the study was to profile transient boaters and determine strategies to attract boaters along an alternative route through the Pamlico Sound. The study profiled various marinas throughout North Carolina and in other states for comparison, surveying boaters themselves, collecting data on boaters’ perceptions and typical expenditures. On average, boaters surveyed indicated average expenditures of $340 per day. For power boaters only, 40 percent stated they spent $500 to $700 per day including fuel and dockage while approximately 25 percent indicated they spent $100 to $200 per day. Of those surveyed, only six to eight percent indicated they had docked previously at either Roanoke Island or Hatteras Island. The economic analysis portion of the study summarized previous work including a 1994 study of the Pirates Cove Big Game tournaments which looked at visitor expenditures on fuel, supplies, lodging, meals, shopping, and entertainment. For the summer tournaments, it was determined that average expenditures per boat per day ranged from $1,100 to $1,500. There were on average six people per boat. For the fall tournaments, expenses per boat per day ranged from $750 to $1,000. In May 2005, Herstine, Dumas and Whitehead (2006) surveyed private (not charter or head boats) recreational boaters utilizing the AIWW in North Carolina. The survey instrument was designed to solicit responses from both transient and local recreational boaters along the AIWW in North Carolina regarding their frequency of use of the AIWW, economic data regarding expenditures while using the AIWW, and the impact that dredging or the lack of dredging of the AIWW and its associated shallow draft inlets would have on their future use of the AIWW. Survey administration began in June 2005 and concluded in late November 2005 at multiple locations from the Virginia – North Carolina border in Currituck County to the North Carolina – South Carolina border in Brunswick County. The survey administration locations in North Carolina along the AIWW included Coinjock (Currituck), the Dismal Swamp Visitors’ Center (Currituck), Belhaven (Beaufort), Oriental (Pamlico), Beaufort (Carteret), Morehead City (Carteret), Atlantic Beach (Carteret), Swansboro (Onslow), Scott’s Hill (Pender), Wrightsville Beach (New Hanover), Carolina Beach (New Hanover), and Southport (Brunswick). Approximately 1,400 field surveys and 250 mail surveys were collected. Two general categories of economic results were presented: consumer surplus and economic impacts. Consumer surplus estimates measure the value of the AIWW recreational boating experience to the boaters themselves. Economic impacts measure the economic effects of the boaters’ spending on businesses, employment, wages, and government tax revenues. Consumer surplus estimates were provided for North Carolina resident and non-North Carolina resident (transient) boaters. The changes in consumer surplus resulting from changes in AIWW navigability were also estimated. Economic impacts were calculated
NC BEACH AND INLET MANAGEMENT PLAN FINAL REPORT ______________________________________________________________________________________
April 2011 IV-33
for three coastal North Carolina regions (northern, central and southern) and for the state as a whole. Changes in economic impacts resulting from changes in AIWW navigability were estimated. Data from this survey were used in the economic analysis presented below.
b) Current Estimate of Private Recreational Boating Value
North Carolina’s AIWW, sounds, bays, inlets, and near-shore ocean provide tremendous opportunities for private recreational boating. Boaters with waterfront residences along North Carolina's extensive waterway, estuarine, and river coastlines dock their vessels at their own private docks. Other boaters pay to dock their vessels at marinas either in the water (“wet slips”) or in a storage warehouse (“dry slips”). Still other boaters keep their vessels at home on a trailer and use either a marina boat ramp or a public boat ramp facility to access the water. In addition to resident boaters, many non-resident transient boaters travel through North Carolina on the AIWW twice a year, heading south to Florida for the winter and to New York, New Jersey and points north for the summer. All of these boaters support economic activity along the coast, and this economic activity depends on access to boating waters and waterways of sufficient depth to allow boats to pass safely without grounding. To estimate the economic impacts and benefits of private recreational boating along the coast of North Carolina, this study relies on data collected in 2005 by Herstine et al. (2007), who conducted surveys of private recreational boaters along the AIWW. As stated above, more than 1,400 surveys were collected at waterside marinas, boat ramps, welcome centers and other facilities from Currituck County to Brunswick County. Data were collected on the numbers of trips per boat per year, and expenditures per boat per year on fuel, dockage, repairs, and on-shore spending on restaurants, lodging, shopping, etc. For North Carolina resident boaters, the annual per boater estimates were multiplied by the number of registered private boats greater than 16 feet in length (smaller boats are relatively unaffected by waterway and inlet depth and dredging issues) with residence zip codes within the region of boater origin identified in the survey (about 20,000 boaters). For non-residents, the annual per boater estimates were multiplied by the number of transient non-resident boaters as measured by the number of non-resident boaters passing through the AIWW at the Great Dismal Swamp and Albemarle and Chesapeake Canal (average from 2001-2005 is 14,600 transient boaters per year). Estimates of total direct spending by private boaters per year by county are presented in Table IV-15 in both base year (2005) and inflation-adjusted year 2008 dollars. Any expenditure made by a surveyed boater outside the coastal county in which the interview occurred were excluded from the analysis; this excluded expenditures made outside the coastal area while towing vessels to the coast (e.g., fuel purchased outside the coastal area) and prevented double-counting of any expenditures made by boaters traveling along the AIWW through multiple counties.
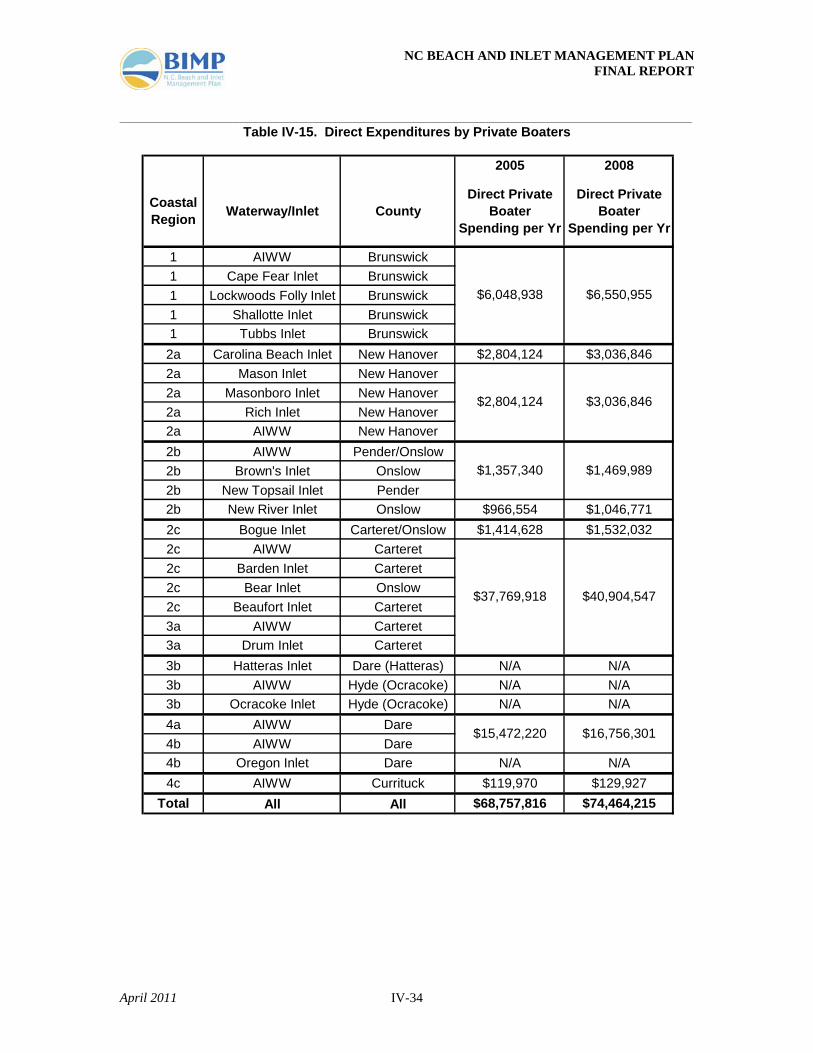
NC BEACH AND INLET MANAGEMENT PLAN FINAL REPORT ______________________________________________________________________________________
April 2011 IV-34
Table IV-15. Direct Expenditures by Private Boaters
2005 2008
Coastal Region Waterway/Inlet County
Direct Private Boater
Spending per Yr
Direct Private Boater
Spending per Yr
1 AIWW Brunswick1 Cape Fear Inlet Brunswick1 Lockwoods Folly Inlet Brunswick1 Shallotte Inlet Brunswick1 Tubbs Inlet Brunswick2a Carolina Beach Inlet New Hanover $2,804,124 $3,036,8462a Mason Inlet New Hanover2a Masonboro Inlet New Hanover2a Rich Inlet New Hanover2a AIWW New Hanover2b AIWW Pender/Onslow2b Brown's Inlet Onslow2b New Topsail Inlet Pender2b New River Inlet Onslow $966,554 $1,046,7712c Bogue Inlet Carteret/Onslow $1,414,628 $1,532,0322c AIWW Carteret2c Barden Inlet Carteret2c Bear Inlet Onslow2c Beaufort Inlet Carteret3a AIWW Carteret3a Drum Inlet Carteret3b Hatteras Inlet Dare (Hatteras) N/A N/A3b AIWW Hyde (Ocracoke) N/A N/A3b Ocracoke Inlet Hyde (Ocracoke) N/A N/A4a AIWW Dare4b AIWW Dare4b Oregon Inlet Dare N/A N/A4c AIWW Currituck $119,970 $129,927
Total All All $68,757,816 $74,464,215
$1,357,340 $1,469,989
$2,804,124 $3,036,846
$15,472,220 $16,756,301
$37,769,918 $40,904,547
$6,048,938 $6,550,955
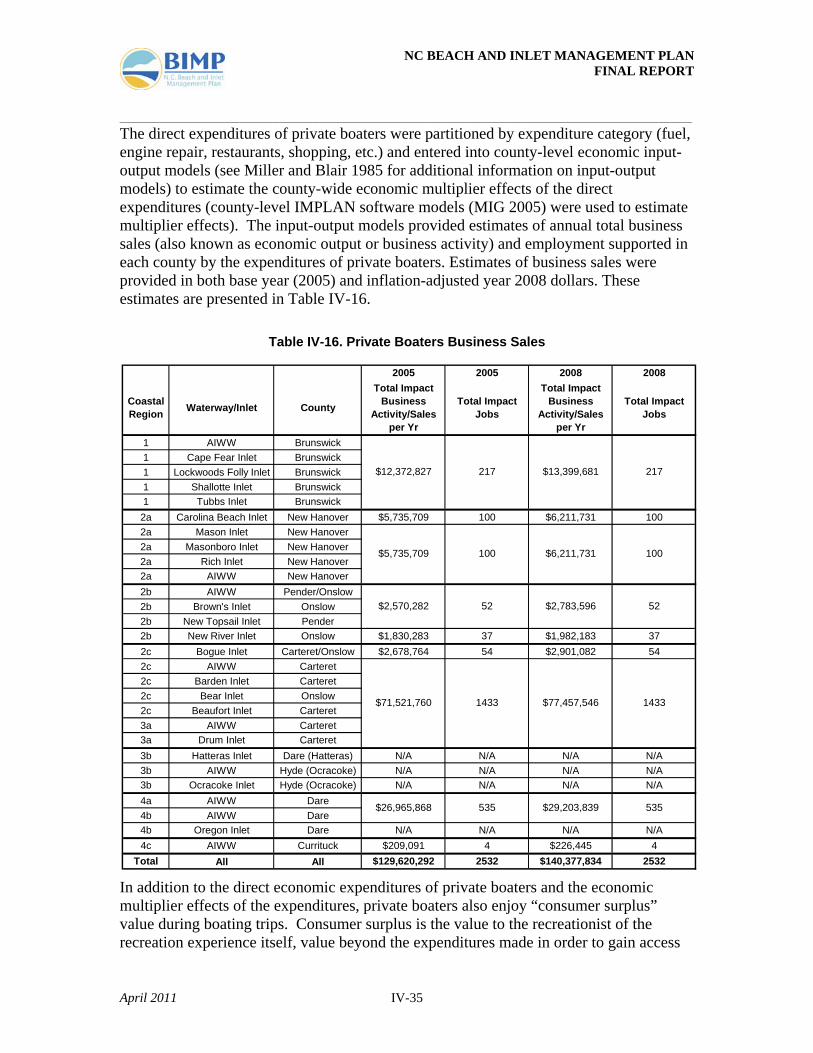
NC BEACH AND INLET MANAGEMENT PLAN FINAL REPORT ______________________________________________________________________________________
April 2011 IV-35
The direct expenditures of private boaters were partitioned by expenditure category (fuel, engine repair, restaurants, shopping, etc.) and entered into county-level economic input-output models (see Miller and Blair 1985 for additional information on input-output models) to estimate the county-wide economic multiplier effects of the direct expenditures (county-level IMPLAN software models (MIG 2005) were used to estimate multiplier effects). The input-output models provided estimates of annual total business sales (also known as economic output or business activity) and employment supported in each county by the expenditures of private boaters. Estimates of business sales were provided in both base year (2005) and inflation-adjusted year 2008 dollars. These estimates are presented in Table IV-16.
Table IV-16. Private Boaters Business Sales
In addition to the direct economic expenditures of private boaters and the economic multiplier effects of the expenditures, private boaters also enjoy “consumer surplus” value during boating trips. Consumer surplus is the value to the recreationist of the recreation experience itself, value beyond the expenditures made in order to gain access
2005 2005 2008 2008
Coastal Region Waterway/Inlet County
Total Impact Business
Activity/Sales per Yr
Total Impact Jobs
Total Impact Business
Activity/Sales per Yr
Total Impact Jobs
1 AIWW Brunswick1 Cape Fear Inlet Brunswick1 Lockwoods Folly Inlet Brunswick1 Shallotte Inlet Brunswick1 Tubbs Inlet Brunswick2a Carolina Beach Inlet New Hanover $5,735,709 100 $6,211,731 1002a Mason Inlet New Hanover2a Masonboro Inlet New Hanover2a Rich Inlet New Hanover2a AIWW New Hanover2b AIWW Pender/Onslow2b Brown's Inlet Onslow2b New Topsail Inlet Pender2b New River Inlet Onslow $1,830,283 37 $1,982,183 372c Bogue Inlet Carteret/Onslow $2,678,764 54 $2,901,082 542c AIWW Carteret2c Barden Inlet Carteret2c Bear Inlet Onslow2c Beaufort Inlet Carteret3a AIWW Carteret3a Drum Inlet Carteret3b Hatteras Inlet Dare (Hatteras) N/A N/A N/A N/A3b AIWW Hyde (Ocracoke) N/A N/A N/A N/A3b Ocracoke Inlet Hyde (Ocracoke) N/A N/A N/A N/A4a AIWW Dare4b AIWW Dare4b Oregon Inlet Dare N/A N/A N/A N/A4c AIWW Currituck $209,091 4 $226,445 4
Total All All $129,620,292 2532 $140,377,834 2532
$2,783,596 52$2,570,282 52
$29,203,839 535
$5,735,709 100 $6,211,731 100
$26,965,868 535
$13,399,681 217
$71,521,760 1433 $77,457,546 1433
$12,372,827 217
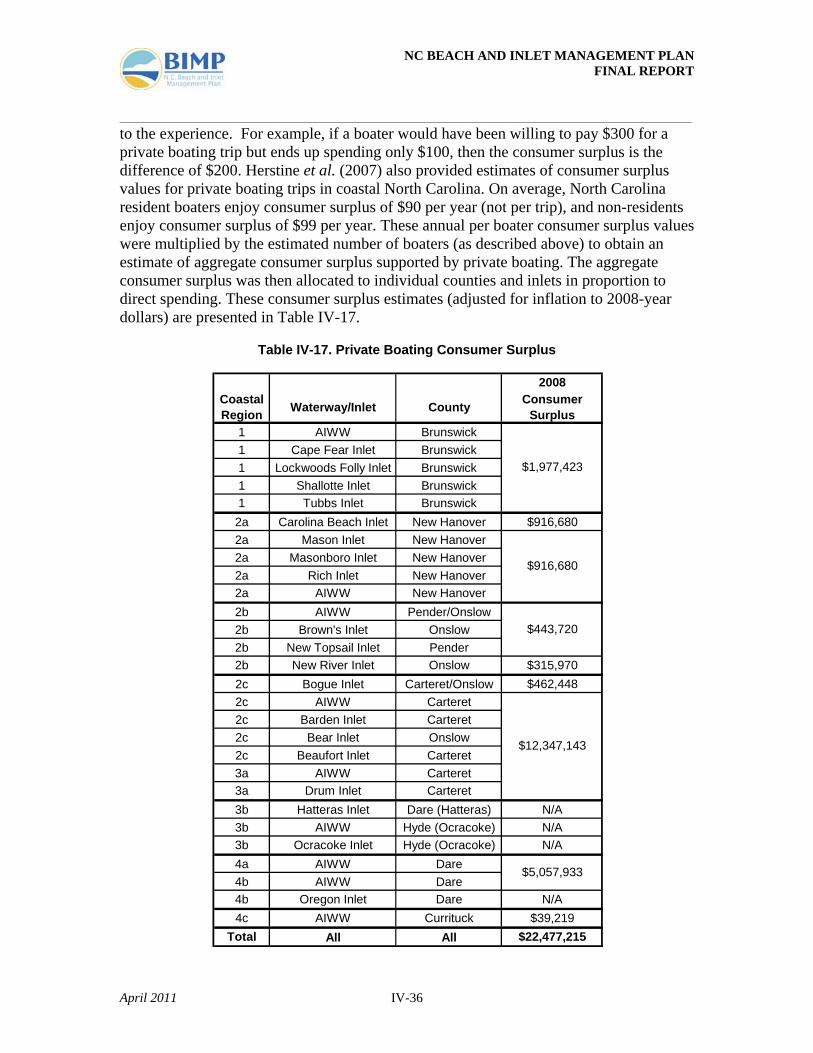
NC BEACH AND INLET MANAGEMENT PLAN FINAL REPORT ______________________________________________________________________________________
April 2011 IV-36
to the experience. For example, if a boater would have been willing to pay $300 for a private boating trip but ends up spending only $100, then the consumer surplus is the difference of $200. Herstine et al. (2007) also provided estimates of consumer surplus values for private boating trips in coastal North Carolina. On average, North Carolina resident boaters enjoy consumer surplus of $90 per year (not per trip), and non-residents enjoy consumer surplus of $99 per year. These annual per boater consumer surplus values were multiplied by the estimated number of boaters (as described above) to obtain an estimate of aggregate consumer surplus supported by private boating. The aggregate consumer surplus was then allocated to individual counties and inlets in proportion to direct spending. These consumer surplus estimates (adjusted for inflation to 2008-year dollars) are presented in Table IV-17.
Table IV-17. Private Boating Consumer Surplus
2008Coastal Region Waterway/Inlet County Consumer
Surplus1 AIWW Brunswick1 Cape Fear Inlet Brunswick1 Lockwoods Folly Inlet Brunswick1 Shallotte Inlet Brunswick1 Tubbs Inlet Brunswick2a Carolina Beach Inlet New Hanover $916,6802a Mason Inlet New Hanover2a Masonboro Inlet New Hanover2a Rich Inlet New Hanover2a AIWW New Hanover2b AIWW Pender/Onslow2b Brown's Inlet Onslow2b New Topsail Inlet Pender2b New River Inlet Onslow $315,9702c Bogue Inlet Carteret/Onslow $462,4482c AIWW Carteret2c Barden Inlet Carteret2c Bear Inlet Onslow2c Beaufort Inlet Carteret3a AIWW Carteret3a Drum Inlet Carteret3b Hatteras Inlet Dare (Hatteras) N/A3b AIWW Hyde (Ocracoke) N/A3b Ocracoke Inlet Hyde (Ocracoke) N/A4a AIWW Dare4b AIWW Dare4b Oregon Inlet Dare N/A4c AIWW Currituck $39,219
Total All All $22,477,215
$443,720
$5,057,933
$916,680
$1,977,423
$12,347,143
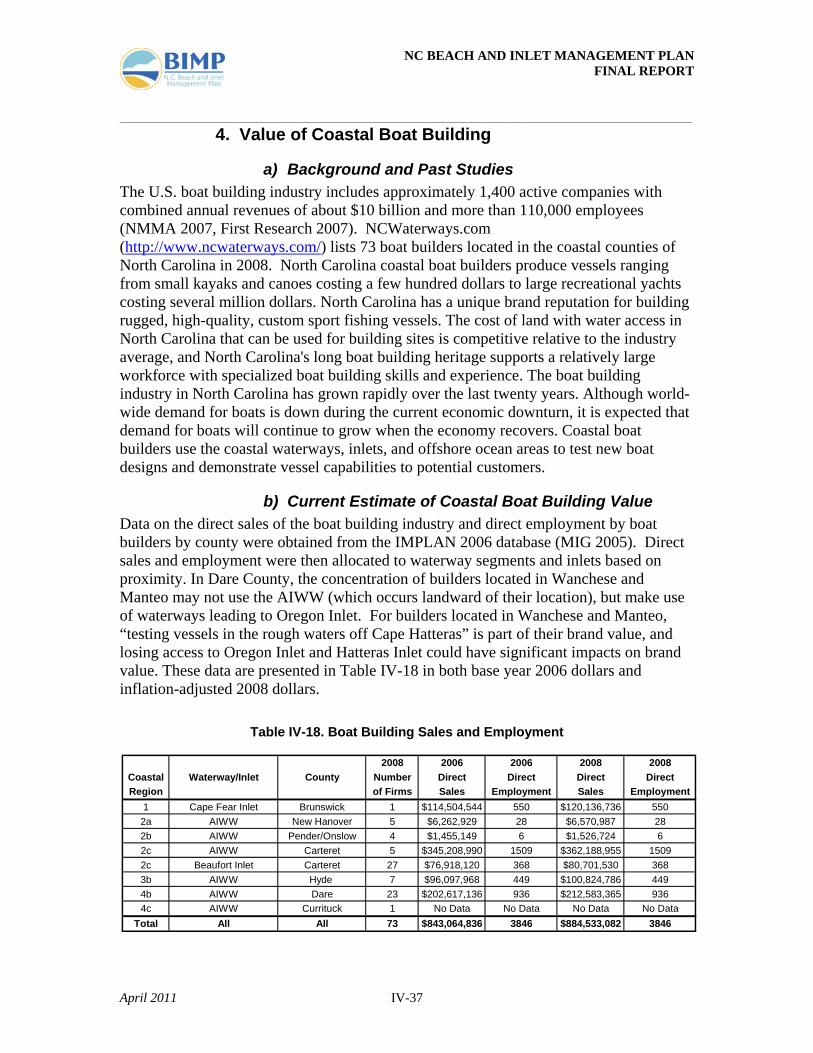
NC BEACH AND INLET MANAGEMENT PLAN FINAL REPORT ______________________________________________________________________________________
April 2011 IV-37
4. Value of Coastal Boat Building
a) Background and Past Studies The U.S. boat building industry includes approximately 1,400 active companies with combined annual revenues of about $10 billion and more than 110,000 employees (NMMA 2007, First Research 2007). NCWaterways.com (http://www.ncwaterways.com/) lists 73 boat builders located in the coastal counties of North Carolina in 2008. North Carolina coastal boat builders produce vessels ranging from small kayaks and canoes costing a few hundred dollars to large recreational yachts costing several million dollars. North Carolina has a unique brand reputation for building rugged, high-quality, custom sport fishing vessels. The cost of land with water access in North Carolina that can be used for building sites is competitive relative to the industry average, and North Carolina's long boat building heritage supports a relatively large workforce with specialized boat building skills and experience. The boat building industry in North Carolina has grown rapidly over the last twenty years. Although world-wide demand for boats is down during the current economic downturn, it is expected that demand for boats will continue to grow when the economy recovers. Coastal boat builders use the coastal waterways, inlets, and offshore ocean areas to test new boat designs and demonstrate vessel capabilities to potential customers.
b) Current Estimate of Coastal Boat Building Value Data on the direct sales of the boat building industry and direct employment by boat builders by county were obtained from the IMPLAN 2006 database (MIG 2005). Direct sales and employment were then allocated to waterway segments and inlets based on proximity. In Dare County, the concentration of builders located in Wanchese and Manteo may not use the AIWW (which occurs landward of their location), but make use of waterways leading to Oregon Inlet. For builders located in Wanchese and Manteo, “testing vessels in the rough waters off Cape Hatteras” is part of their brand value, and losing access to Oregon Inlet and Hatteras Inlet could have significant impacts on brand value. These data are presented in Table IV-18 in both base year 2006 dollars and inflation-adjusted 2008 dollars.
Table IV-18. Boat Building Sales and Employment
2008 2006 2006 2008 2008Coastal Waterway/Inlet County Number Direct Direct Direct DirectRegion of Firms Sales Employment Sales Employment
1 Cape Fear Inlet Brunswick 1 $114,504,544 550 $120,136,736 5502a AIWW New Hanover 5 $6,262,929 28 $6,570,987 282b AIWW Pender/Onslow 4 $1,455,149 6 $1,526,724 62c AIWW Carteret 5 $345,208,990 1509 $362,188,955 15092c Beaufort Inlet Carteret 27 $76,918,120 368 $80,701,530 3683b AIWW Hyde 7 $96,097,968 449 $100,824,786 4494b AIWW Dare 23 $202,617,136 936 $212,583,365 9364c AIWW Currituck 1 No Data No Data No Data No Data
Total All All 73 $843,064,836 3846 $884,533,082 3846
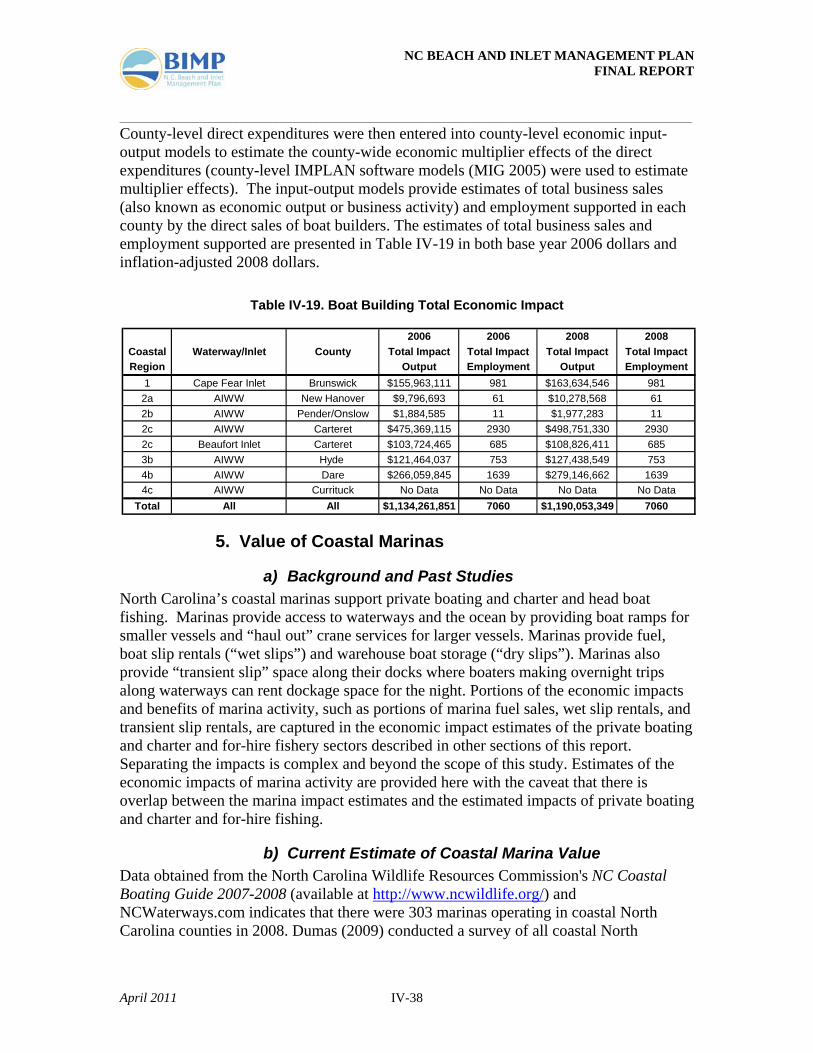
NC BEACH AND INLET MANAGEMENT PLAN FINAL REPORT ______________________________________________________________________________________
April 2011 IV-38
County-level direct expenditures were then entered into county-level economic input-output models to estimate the county-wide economic multiplier effects of the direct expenditures (county-level IMPLAN software models (MIG 2005) were used to estimate multiplier effects). The input-output models provide estimates of total business sales (also known as economic output or business activity) and employment supported in each county by the direct sales of boat builders. The estimates of total business sales and employment supported are presented in Table IV-19 in both base year 2006 dollars and inflation-adjusted 2008 dollars.
Table IV-19. Boat Building Total Economic Impact
5. Value of Coastal Marinas
a) Background and Past Studies North Carolina’s coastal marinas support private boating and charter and head boat fishing. Marinas provide access to waterways and the ocean by providing boat ramps for smaller vessels and “haul out” crane services for larger vessels. Marinas provide fuel, boat slip rentals (“wet slips”) and warehouse boat storage (“dry slips”). Marinas also provide “transient slip” space along their docks where boaters making overnight trips along waterways can rent dockage space for the night. Portions of the economic impacts and benefits of marina activity, such as portions of marina fuel sales, wet slip rentals, and transient slip rentals, are captured in the economic impact estimates of the private boating and charter and for-hire fishery sectors described in other sections of this report. Separating the impacts is complex and beyond the scope of this study. Estimates of the economic impacts of marina activity are provided here with the caveat that there is overlap between the marina impact estimates and the estimated impacts of private boating and charter and for-hire fishing.
b) Current Estimate of Coastal Marina Value Data obtained from the North Carolina Wildlife Resources Commission's NC Coastal Boating Guide 2007-2008 (available at http://www.ncwildlife.org/) and NCWaterways.com indicates that there were 303 marinas operating in coastal North Carolina counties in 2008. Dumas (2009) conducted a survey of all coastal North
2006 2006 2008 2008Coastal Waterway/Inlet County Total Impact Total Impact Total Impact Total ImpactRegion Output Employment Output Employment
1 Cape Fear Inlet Brunswick $155,963,111 981 $163,634,546 9812a AIWW New Hanover $9,796,693 61 $10,278,568 612b AIWW Pender/Onslow $1,884,585 11 $1,977,283 112c AIWW Carteret $475,369,115 2930 $498,751,330 29302c Beaufort Inlet Carteret $103,724,465 685 $108,826,411 6853b AIWW Hyde $121,464,037 753 $127,438,549 7534b AIWW Dare $266,059,845 1639 $279,146,662 16394c AIWW Currituck No Data No Data No Data No Data
Total All All $1,134,261,851 7060 $1,190,053,349 7060
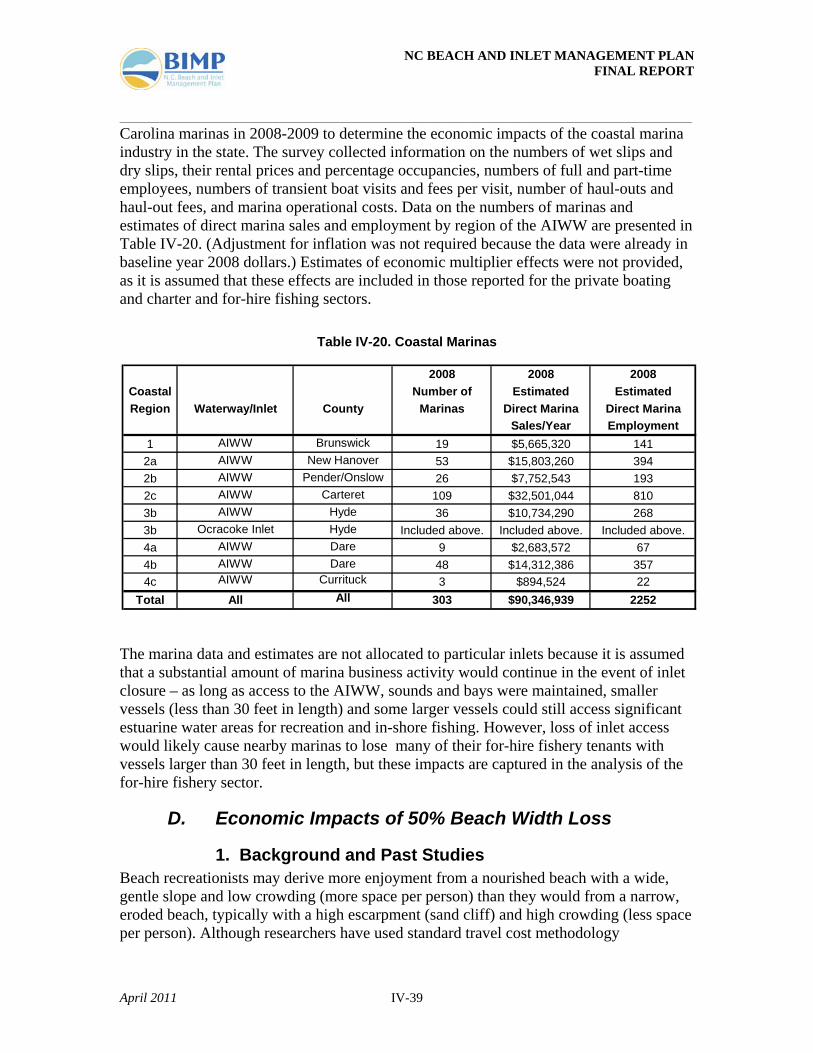
NC BEACH AND INLET MANAGEMENT PLAN FINAL REPORT ______________________________________________________________________________________
April 2011 IV-39
Carolina marinas in 2008-2009 to determine the economic impacts of the coastal marina industry in the state. The survey collected information on the numbers of wet slips and dry slips, their rental prices and percentage occupancies, numbers of full and part-time employees, numbers of transient boat visits and fees per visit, number of haul-outs and haul-out fees, and marina operational costs. Data on the numbers of marinas and estimates of direct marina sales and employment by region of the AIWW are presented in Table IV-20. (Adjustment for inflation was not required because the data were already in baseline year 2008 dollars.) Estimates of economic multiplier effects were not provided, as it is assumed that these effects are included in those reported for the private boating and charter and for-hire fishing sectors.
Table IV-20. Coastal Marinas
The marina data and estimates are not allocated to particular inlets because it is assumed that a substantial amount of marina business activity would continue in the event of inlet closure – as long as access to the AIWW, sounds and bays were maintained, smaller vessels (less than 30 feet in length) and some larger vessels could still access significant estuarine water areas for recreation and in-shore fishing. However, loss of inlet access would likely cause nearby marinas to lose many of their for-hire fishery tenants with vessels larger than 30 feet in length, but these impacts are captured in the analysis of the for-hire fishery sector.
D. Economic Impacts of 50% Beach Width Loss
1. Background and Past Studies Beach recreationists may derive more enjoyment from a nourished beach with a wide, gentle slope and low crowding (more space per person) than they would from a narrow, eroded beach, typically with a high escarpment (sand cliff) and high crowding (less space per person). Although researchers have used standard travel cost methodology
2008 2008 2008Coastal Number of Estimated EstimatedRegion Waterway/Inlet County Marinas Direct Marina Direct Marina
Sales/Year Employment1 AIWW Brunswick 19 $5,665,320 1412a AIWW New Hanover 53 $15,803,260 3942b AIWW Pender/Onslow 26 $7,752,543 1932c AIWW Carteret 109 $32,501,044 8103b AIWW Hyde 36 $10,734,290 2683b Ocracoke Inlet Hyde Included above. Included above. Included above.4a AIWW Dare 9 $2,683,572 674b AIWW Dare 48 $14,312,386 3574c AIWW Currituck 3 $894,524 22
Total All All 303 $90,346,939 2252
NC BEACH AND INLET MANAGEMENT PLAN FINAL REPORT ______________________________________________________________________________________
April 2011 IV-40
(Hanemann 1978; Bockstael et al. 1987; Bell and Leeworthy 1990; and Parsons and Kealy 1992) to value beach recreation, “few, if any, travel cost models have been applied specifically to beach nourishment valuation problems” (National Research Council 1995). In addition to the existing travel costs studies, contingent valuation (CV) methodology has been used to value beach recreation (e.g., King 2002), and a few CV studies have examined the incremental value attributable to beach nourishment. McConnell (1977) and Bell (1986) find that the economic value of beach recreation per person increases with increasing beach width. These authors attribute this result to the reduction in crowding associated with wider beaches. Silberman et al. (1992) found that both users and non-users of New Jersey beaches have existence values for non-eroded beaches. While the existing travel cost studies estimate the impacts of changing travel costs on beach visits, and existing contingent valuation studies estimate the impact of changing beach width on beach recreation value for tourists already on the beach, until recently, only one existing study investigates the impact of renourishment on the number of beach visits. Silberman and Klock (1988) find that renourishment of New Jersey beaches in the mid-1980s increased tourist visits to the renourished beach while decreasing visits to nearby, substitute beaches. The net number of visits to all beaches increased with renourishment. Whitehead et al. (2008a) studied beach recreation demand for southern North Carolina beaches using data from a 2003 survey. The study provided estimates of the changes in recreation demand that might occur with beach nourishment and parking improvements necessary to satisfy the requirements for USACE cost-share. The number of beach trips made by each survey respondent to any of the beaches in the study region in 2003 was elicited by asking how many of the respondents oceanfront beach trips were made to beaches along the southern North Carolina coast (from Beaufort/Morehead City - Carteret County) to the South Carolina border (Brunswick County). The responses include both day and over-night trips, although most were day trips, as all telephone survey respondents lived within 120 miles of the beach study area. The average annual number of trips per year per respondent was 11. Respondents who planned to take at least one oceanfront beach trip to the southern North Carolina coast during 2004 were asked how many trips they intended to take. The average number of planned trips in 2004 with current access and width conditions was 13. Respondents were also asked about their perceptions of current beach access and parking quality. Thirty-nine percent of respondents think that the current beach parking situation is either good or excellent. The following hypothetical scenario was then presented to respondents: “Suppose that parking facilities and beach access at southern North Carolina beaches were improved so that you would not have to spend time searching for a parking space or access area, the parking space and access area would be located within reasonable walking distance of the beach, and parking was free or reasonably priced. Also suppose that the number of beach users at the beaches does not change.” Under these conditions, 65 percent of respondents think that the improved parking situation would be either good or excellent, and the average number of beach trips under these improved conditions would be 17 per year. Respondents were then told that “the width of the dry sand beach area from the dune to the ocean at high tide at southern North Carolina beaches is between 10 and 100 feet with
NC BEACH AND INLET MANAGEMENT PLAN FINAL REPORT ______________________________________________________________________________________
April 2011 IV-41
an average of 75 feet.” Sixty-nine percent of respondents think that the current beach width conditions are either good or excellent. The following beach nourishment policy was then presented to respondents: “Suppose a beach nourishment policy is implemented for all southern North Carolina beaches. Beach nourishment would be performed in each county periodically, at least once every three to five years, for the 50-year life of the project. Periodic nourishment is done to maintain an increased beach width to provide shore protection and recreation benefit. The goal would be to make the average beach width increase by 100 feet.” The respondents were split on whether beach nourishment is the right beach management option. Forty-four percent of respondents think that adding 100 feet of width to the beaches would be the right amount, 21 percent think that the current beach width is fine, and 18 percent think that people should not alter the width of the beach. Fifty-eight percent of respondents either support or strongly support the hypothetical beach nourishment policy. Eighty-five percent of respondents think that the beach nourishment policy would be an effective means of maintaining beach width. The average number of beach trips with the nourishment policy is 14. Model results indicated that nine beach trips are predicted per season under status quo beach conditions, 12 trips are predicted with improved access, and 10 trips are predicted with increased beach width. The baseline consumer surplus estimates were about $90 per trip; this is an estimate of the value of the recreation experience to the beachgoer. The increase in consumer surplus per trip with the improvement in beach access is about $25. The increase in consumer surplus per trip with the increase in beach width is about $7. The consumer surplus per-trip estimates in this study ($90) are high relative to those in the single-site beach valuation literature. For example, Bin et al. (2005) estimated that the value of a day trip to individual North Carolina beaches ranges from $11 to $80. This may be due to the aggregation of a large number of beaches into a single recreation site (e.g., southern NC beaches) in the Whitehead et al. (2008) study.
2. Scenario Analysis To investigate the potential impacts of beach loss in coastal North Carolina, a scenario was considered in which approximately 50 percent of current beach width is lost due to erosion. This scenario was investigated to determine the potential economic impact of not maintaining the current beach widths in North Carolina. A reduction in beach width would affect primarily beach recreation and shore-based fishing. It is assumed that no structures would be lost utilizing a 50-percent-beach-width-loss scenario. However, some structures might decline in value due to: (1) increased risk of loss during storms due to a narrower beach or (2) fewer years remaining until the ocean reaches beach front structures for given erosion rates. Studies that have measured these impacts were not identified during the course of this investigation. Marine recreation services would not be significantly affected because they involve use of waterways, estuarine marshes, waves, etc., instead of the beach itself. These resources would remain intact after the reduction in beach width considered here.
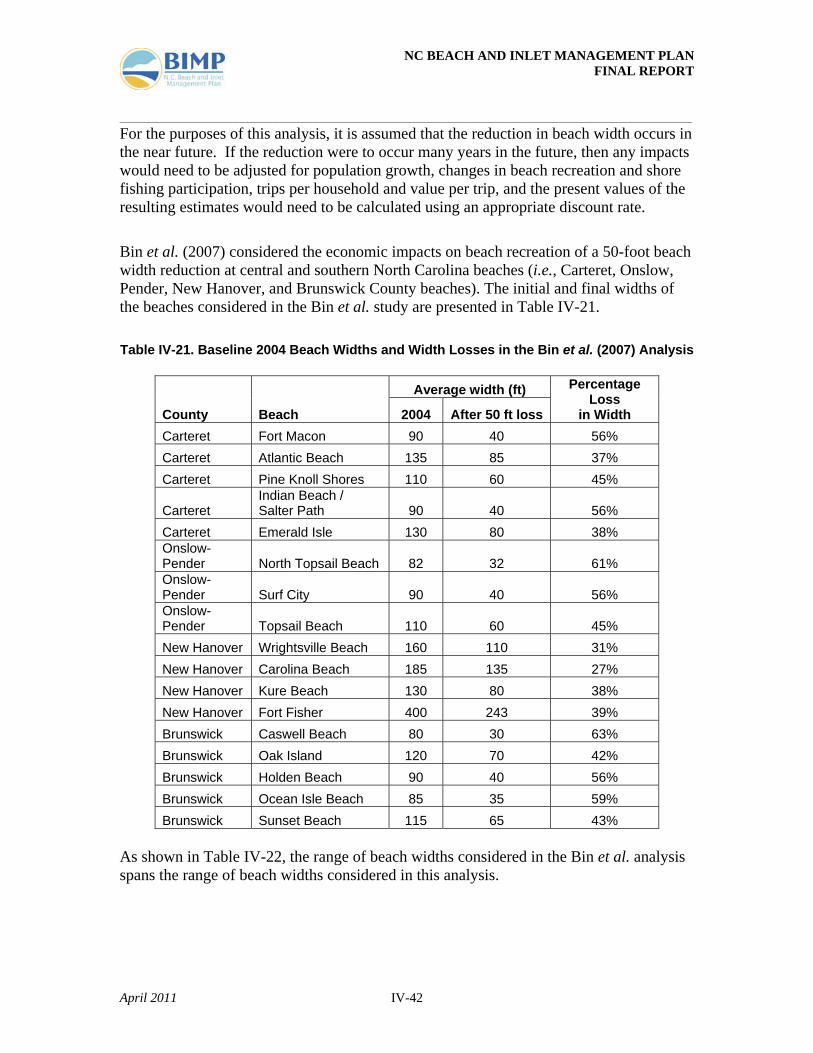
NC BEACH AND INLET MANAGEMENT PLAN FINAL REPORT ______________________________________________________________________________________
April 2011 IV-42
For the purposes of this analysis, it is assumed that the reduction in beach width occurs in the near future. If the reduction were to occur many years in the future, then any impacts would need to be adjusted for population growth, changes in beach recreation and shore fishing participation, trips per household and value per trip, and the present values of the resulting estimates would need to be calculated using an appropriate discount rate.
Bin et al. (2007) considered the economic impacts on beach recreation of a 50-foot beach width reduction at central and southern North Carolina beaches (i.e., Carteret, Onslow, Pender, New Hanover, and Brunswick County beaches). The initial and final widths of the beaches considered in the Bin et al. study are presented in Table IV-21. Table IV-21. Baseline 2004 Beach Widths and Width Losses in the Bin et al. (2007) Analysis
County Beach
Average width (ft) Percentage Loss
in Width 2004 After 50 ft loss Carteret Fort Macon 90 40 56% Carteret Atlantic Beach 135 85 37% Carteret Pine Knoll Shores 110 60 45%
Carteret Indian Beach / Salter Path 90 40 56%
Carteret Emerald Isle 130 80 38% Onslow-Pender North Topsail Beach 82 32 61% Onslow-Pender Surf City 90 40 56% Onslow-Pender Topsail Beach 110 60 45% New Hanover Wrightsville Beach 160 110 31% New Hanover Carolina Beach 185 135 27% New Hanover Kure Beach 130 80 38% New Hanover Fort Fisher 400 243 39% Brunswick Caswell Beach 80 30 63% Brunswick Oak Island 120 70 42% Brunswick Holden Beach 90 40 56% Brunswick Ocean Isle Beach 85 35 59% Brunswick Sunset Beach 115 65 43%
As shown in Table IV-22, the range of beach widths considered in the Bin et al. analysis spans the range of beach widths considered in this analysis.
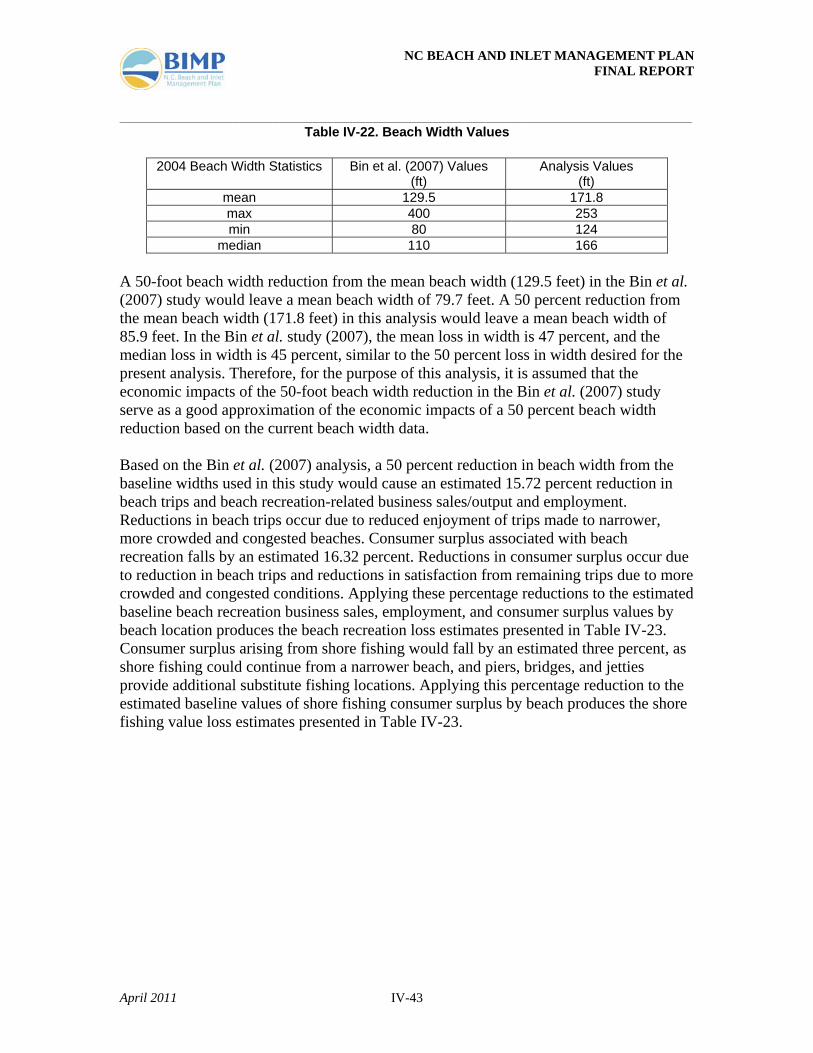
NC BEACH AND INLET MANAGEMENT PLAN FINAL REPORT ______________________________________________________________________________________
April 2011 IV-43
Table IV-22. Beach Width Values
2004 Beach Width Statistics Bin et al. (2007) Values (ft)
Analysis Values (ft)
mean 129.5 171.8 max 400 253 min 80 124
median 110 166 A 50-foot beach width reduction from the mean beach width (129.5 feet) in the Bin et al. (2007) study would leave a mean beach width of 79.7 feet. A 50 percent reduction from the mean beach width (171.8 feet) in this analysis would leave a mean beach width of 85.9 feet. In the Bin et al. study (2007), the mean loss in width is 47 percent, and the median loss in width is 45 percent, similar to the 50 percent loss in width desired for the present analysis. Therefore, for the purpose of this analysis, it is assumed that the economic impacts of the 50-foot beach width reduction in the Bin et al. (2007) study serve as a good approximation of the economic impacts of a 50 percent beach width reduction based on the current beach width data. Based on the Bin et al. (2007) analysis, a 50 percent reduction in beach width from the baseline widths used in this study would cause an estimated 15.72 percent reduction in beach trips and beach recreation-related business sales/output and employment. Reductions in beach trips occur due to reduced enjoyment of trips made to narrower, more crowded and congested beaches. Consumer surplus associated with beach recreation falls by an estimated 16.32 percent. Reductions in consumer surplus occur due to reduction in beach trips and reductions in satisfaction from remaining trips due to more crowded and congested conditions. Applying these percentage reductions to the estimated baseline beach recreation business sales, employment, and consumer surplus values by beach location produces the beach recreation loss estimates presented in Table IV-23. Consumer surplus arising from shore fishing would fall by an estimated three percent, as shore fishing could continue from a narrower beach, and piers, bridges, and jetties provide additional substitute fishing locations. Applying this percentage reduction to the estimated baseline values of shore fishing consumer surplus by beach produces the shore fishing value loss estimates presented in Table IV-23.
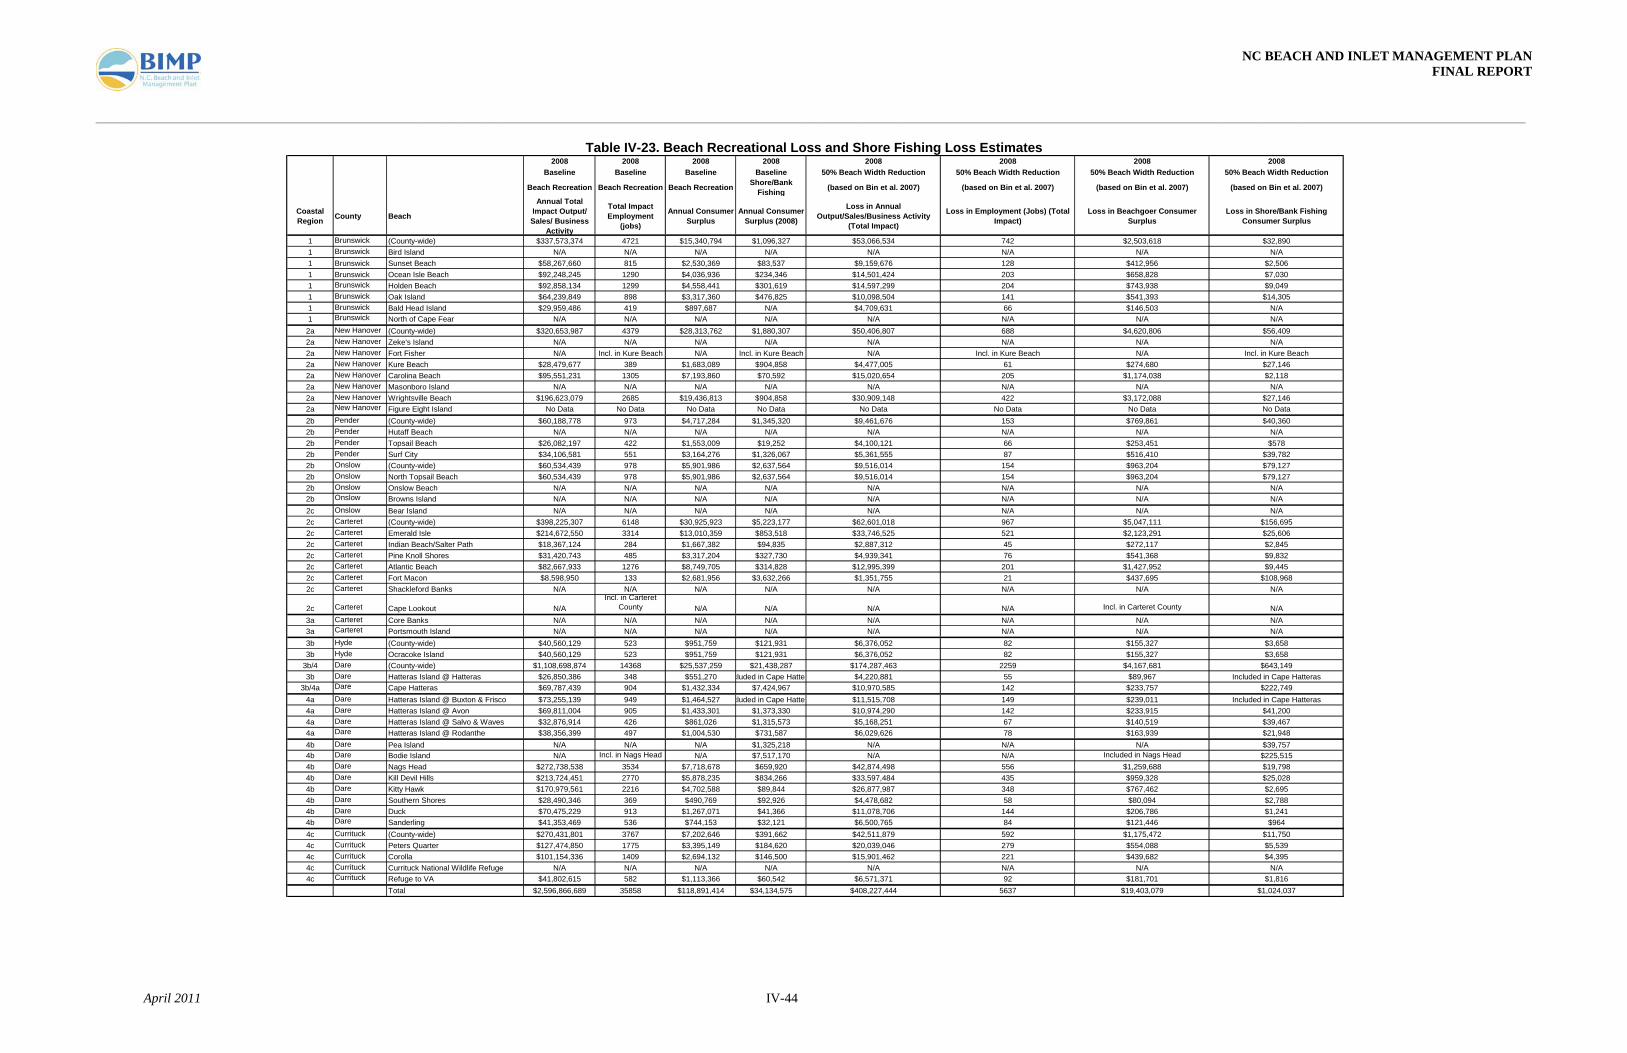
NC BEACH AND INLET MANAGEMENT PLAN FINAL REPORT
_______________________________________________________________________________________________________________________________________________________________________________________________________________________
April 2011 IV-44
Table IV-23. Beach Recreational Loss and Shore Fishing Loss Estimates
2008 2008 2008 2008 2008 2008 2008 2008Baseline Baseline Baseline Baseline 50% Beach Width Reduction 50% Beach Width Reduction 50% Beach Width Reduction 50% Beach Width Reduction
Beach Recreation Beach Recreation Beach Recreation Shore/Bank Fishing (based on Bin et al. 2007) (based on Bin et al. 2007) (based on Bin et al. 2007) (based on Bin et al. 2007)
Coastal Region County Beach
Annual Total Impact Output/ Sales/ Business
Activity
Total Impact Employment
(jobs)
Annual Consumer Surplus
Annual Consumer Surplus (2008)
Loss in Annual Output/Sales/Business Activity
(Total Impact)
Loss in Employment (Jobs) (Total Impact)
Loss in Beachgoer Consumer Surplus
Loss in Shore/Bank Fishing Consumer Surplus
1 Brunswick (County-wide) $337,573,374 4721 $15,340,794 $1,096,327 $53,066,534 742 $2,503,618 $32,8901 Brunswick Bird Island N/A N/A N/A N/A N/A N/A N/A N/A1 Brunswick Sunset Beach $58,267,660 815 $2,530,369 $83,537 $9,159,676 128 $412,956 $2,5061 Brunswick Ocean Isle Beach $92,248,245 1290 $4,036,936 $234,346 $14,501,424 203 $658,828 $7,0301 Brunswick Holden Beach $92,858,134 1299 $4,558,441 $301,619 $14,597,299 204 $743,938 $9,0491 Brunswick Oak Island $64,239,849 898 $3,317,360 $476,825 $10,098,504 141 $541,393 $14,3051 Brunswick Bald Head Island $29,959,486 419 $897,687 N/A $4,709,631 66 $146,503 N/A1 Brunswick North of Cape Fear N/A N/A N/A N/A N/A N/A N/A N/A
2a New Hanover (County-wide) $320,653,987 4379 $28,313,762 $1,880,307 $50,406,807 688 $4,620,806 $56,4092a New Hanover Zeke's Island N/A N/A N/A N/A N/A N/A N/A N/A2a New Hanover Fort Fisher N/A Incl. in Kure Beach N/A Incl. in Kure Beach N/A Incl. in Kure Beach N/A Incl. in Kure Beach2a New Hanover Kure Beach $28,479,677 389 $1,683,089 $904,858 $4,477,005 61 $274,680 $27,1462a New Hanover Carolina Beach $95,551,231 1305 $7,193,860 $70,592 $15,020,654 205 $1,174,038 $2,1182a New Hanover Masonboro Island N/A N/A N/A N/A N/A N/A N/A N/A2a New Hanover Wrightsville Beach $196,623,079 2685 $19,436,813 $904,858 $30,909,148 422 $3,172,088 $27,1462a New Hanover Figure Eight Island No Data No Data No Data No Data No Data No Data No Data No Data2b Pender (County-wide) $60,188,778 973 $4,717,284 $1,345,320 $9,461,676 153 $769,861 $40,3602b Pender Hutaff Beach N/A N/A N/A N/A N/A N/A N/A N/A2b Pender Topsail Beach $26,082,197 422 $1,553,009 $19,252 $4,100,121 66 $253,451 $5782b Pender Surf City $34,106,581 551 $3,164,276 $1,326,067 $5,361,555 87 $516,410 $39,7822b Onslow (County-wide) $60,534,439 978 $5,901,986 $2,637,564 $9,516,014 154 $963,204 $79,1272b Onslow North Topsail Beach $60,534,439 978 $5,901,986 $2,637,564 $9,516,014 154 $963,204 $79,1272b Onslow Onslow Beach N/A N/A N/A N/A N/A N/A N/A N/A2b Onslow Browns Island N/A N/A N/A N/A N/A N/A N/A N/A2c Onslow Bear Island N/A N/A N/A N/A N/A N/A N/A N/A2c Carteret (County-wide) $398,225,307 6148 $30,925,923 $5,223,177 $62,601,018 967 $5,047,111 $156,6952c Carteret Emerald Isle $214,672,550 3314 $13,010,359 $853,518 $33,746,525 521 $2,123,291 $25,6062c Carteret Indian Beach/Salter Path $18,367,124 284 $1,667,382 $94,835 $2,887,312 45 $272,117 $2,8452c Carteret Pine Knoll Shores $31,420,743 485 $3,317,204 $327,730 $4,939,341 76 $541,368 $9,8322c Carteret Atlantic Beach $82,667,933 1276 $8,749,705 $314,828 $12,995,399 201 $1,427,952 $9,4452c Carteret Fort Macon $8,598,950 133 $2,681,956 $3,632,266 $1,351,755 21 $437,695 $108,9682c Carteret Shackleford Banks N/A N/A N/A N/A N/A N/A N/A N/A
2c Carteret Cape Lookout N/AIncl. in Carteret
County N/A N/A N/A N/A Incl. in Carteret County N/A3a Carteret Core Banks N/A N/A N/A N/A N/A N/A N/A N/A3a Carteret Portsmouth Island N/A N/A N/A N/A N/A N/A N/A N/A3b Hyde (County-wide) $40,560,129 523 $951,759 $121,931 $6,376,052 82 $155,327 $3,6583b Hyde Ocracoke Island $40,560,129 523 $951,759 $121,931 $6,376,052 82 $155,327 $3,658
3b/4 Dare (County-wide) $1,108,698,874 14368 $25,537,259 $21,438,287 $174,287,463 2259 $4,167,681 $643,1493b Dare Hatteras Island @ Hatteras $26,850,386 348 $551,270 cluded in Cape Hatter $4,220,881 55 $89,967 Included in Cape Hatteras
3b/4a Dare Cape Hatteras $69,787,439 904 $1,432,334 $7,424,967 $10,970,585 142 $233,757 $222,7494a Dare Hatteras Island @ Buxton & Frisco $73,255,139 949 $1,464,527 cluded in Cape Hatter $11,515,708 149 $239,011 Included in Cape Hatteras4a Dare Hatteras Island @ Avon $69,811,004 905 $1,433,301 $1,373,330 $10,974,290 142 $233,915 $41,2004a Dare Hatteras Island @ Salvo & Waves $32,876,914 426 $861,026 $1,315,573 $5,168,251 67 $140,519 $39,4674a Dare Hatteras Island @ Rodanthe $38,356,399 497 $1,004,530 $731,587 $6,029,626 78 $163,939 $21,9484b Dare Pea Island N/A N/A N/A $1,325,218 N/A N/A N/A $39,7574b Dare Bodie Island N/A Incl. in Nags Head N/A $7,517,170 N/A N/A Included in Nags Head $225,5154b Dare Nags Head $272,738,538 3534 $7,718,678 $659,920 $42,874,498 556 $1,259,688 $19,7984b Dare Kill Devil Hills $213,724,451 2770 $5,878,235 $834,266 $33,597,484 435 $959,328 $25,0284b Dare Kitty Hawk $170,979,561 2216 $4,702,588 $89,844 $26,877,987 348 $767,462 $2,6954b Dare Southern Shores $28,490,346 369 $490,769 $92,926 $4,478,682 58 $80,094 $2,7884b Dare Duck $70,475,229 913 $1,267,071 $41,366 $11,078,706 144 $206,786 $1,2414b Dare Sanderling $41,353,469 536 $744,153 $32,121 $6,500,765 84 $121,446 $9644c Currituck (County-wide) $270,431,801 3767 $7,202,646 $391,662 $42,511,879 592 $1,175,472 $11,7504c Currituck Peters Quarter $127,474,850 1775 $3,395,149 $184,620 $20,039,046 279 $554,088 $5,5394c Currituck Corolla $101,154,336 1409 $2,694,132 $146,500 $15,901,462 221 $439,682 $4,3954c Currituck Currituck National Wildlife Refuge N/A N/A N/A N/A N/A N/A N/A N/A4c Currituck Refuge to VA $41,802,615 582 $1,113,366 $60,542 $6,571,371 92 $181,701 $1,816
Total $2,596,866,689 35858 $118,891,414 $34,134,575 $408,227,444 5637 $19,403,079 $1,024,037
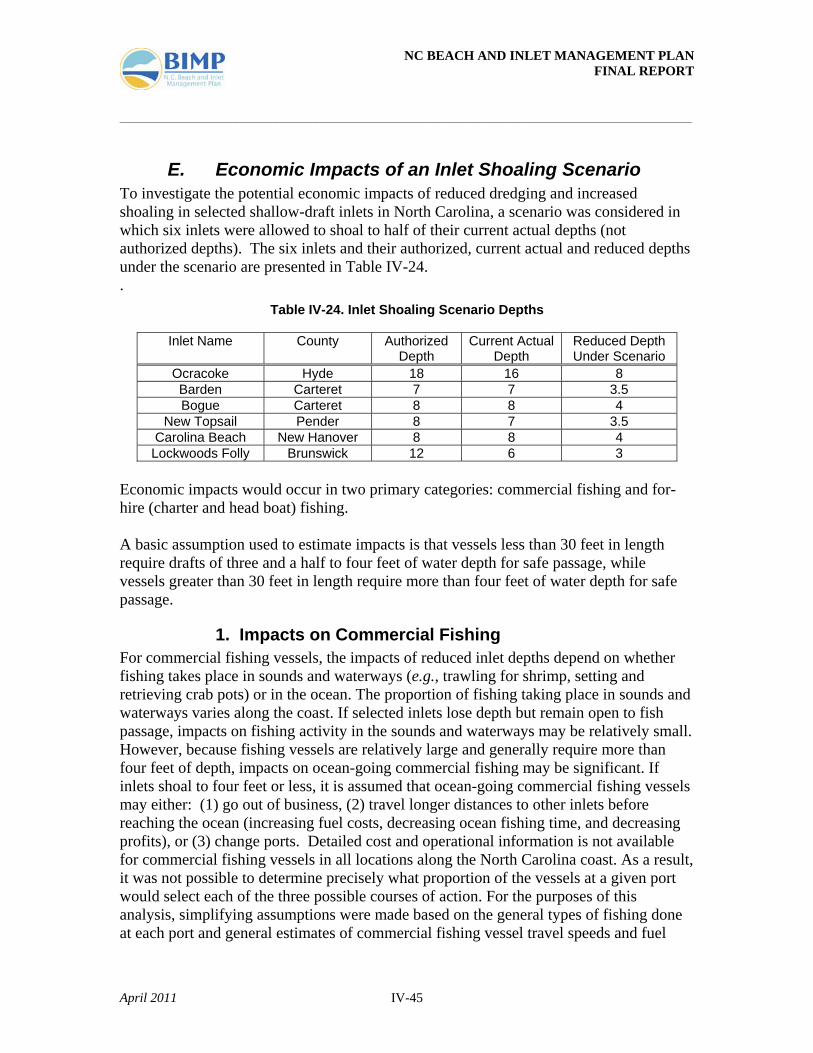
NC BEACH AND INLET MANAGEMENT PLAN FINAL REPORT ______________________________________________________________________________________
April 2011 IV-45
E. Economic Impacts of an Inlet Shoaling Scenario To investigate the potential economic impacts of reduced dredging and increased shoaling in selected shallow-draft inlets in North Carolina, a scenario was considered in which six inlets were allowed to shoal to half of their current actual depths (not authorized depths). The six inlets and their authorized, current actual and reduced depths under the scenario are presented in Table IV-24. .
Table IV-24. Inlet Shoaling Scenario Depths
Inlet Name County Authorized Depth
Current Actual Depth
Reduced Depth Under Scenario
Ocracoke Hyde 18 16 8 Barden Carteret 7 7 3.5 Bogue Carteret 8 8 4
New Topsail Pender 8 7 3.5 Carolina Beach New Hanover 8 8 4 Lockwoods Folly Brunswick 12 6 3
Economic impacts would occur in two primary categories: commercial fishing and for-hire (charter and head boat) fishing. A basic assumption used to estimate impacts is that vessels less than 30 feet in length require drafts of three and a half to four feet of water depth for safe passage, while vessels greater than 30 feet in length require more than four feet of water depth for safe passage.
1. Impacts on Commercial Fishing For commercial fishing vessels, the impacts of reduced inlet depths depend on whether fishing takes place in sounds and waterways (e.g., trawling for shrimp, setting and retrieving crab pots) or in the ocean. The proportion of fishing taking place in sounds and waterways varies along the coast. If selected inlets lose depth but remain open to fish passage, impacts on fishing activity in the sounds and waterways may be relatively small. However, because fishing vessels are relatively large and generally require more than four feet of depth, impacts on ocean-going commercial fishing may be significant. If inlets shoal to four feet or less, it is assumed that ocean-going commercial fishing vessels may either: (1) go out of business, (2) travel longer distances to other inlets before reaching the ocean (increasing fuel costs, decreasing ocean fishing time, and decreasing profits), or (3) change ports. Detailed cost and operational information is not available for commercial fishing vessels in all locations along the North Carolina coast. As a result, it was not possible to determine precisely what proportion of the vessels at a given port would select each of the three possible courses of action. For the purposes of this analysis, simplifying assumptions were made based on the general types of fishing done at each port and general estimates of commercial fishing vessel travel speeds and fuel
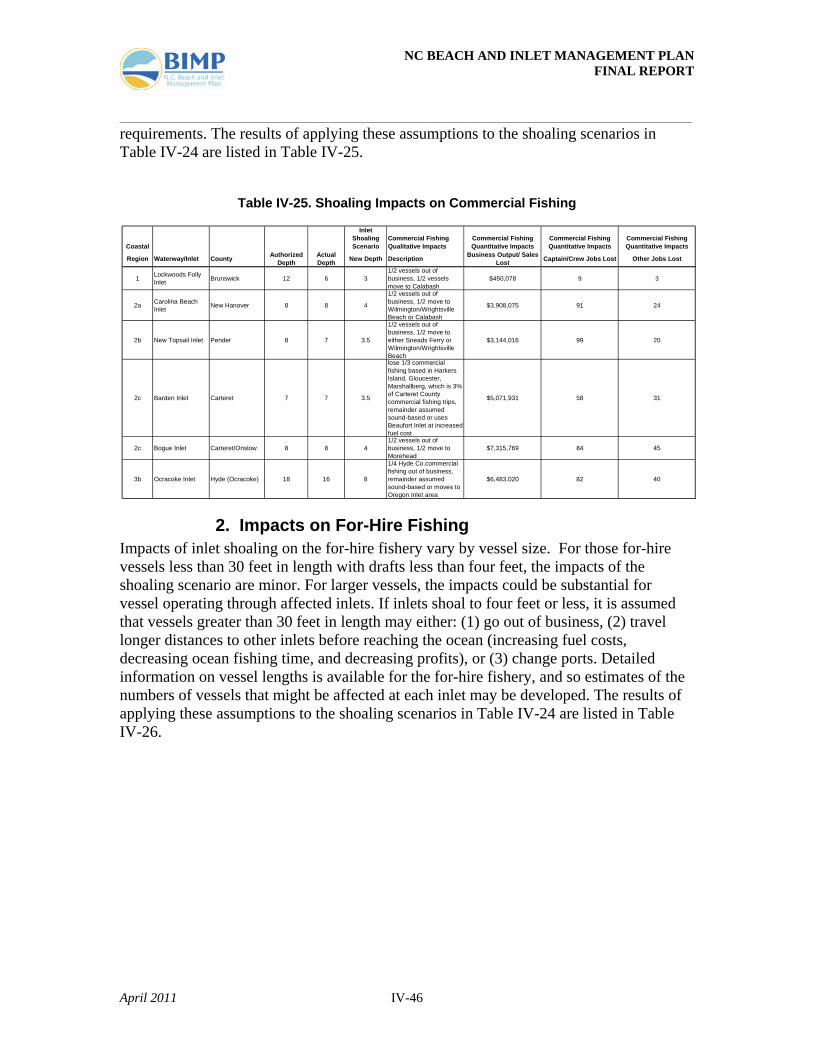
NC BEACH AND INLET MANAGEMENT PLAN FINAL REPORT ______________________________________________________________________________________
April 2011 IV-46
requirements. The results of applying these assumptions to the shoaling scenarios in Table IV-24 are listed in Table IV-25.
Table IV-25. Shoaling Impacts on Commercial Fishing
2. Impacts on For-Hire Fishing Impacts of inlet shoaling on the for-hire fishery vary by vessel size. For those for-hire vessels less than 30 feet in length with drafts less than four feet, the impacts of the shoaling scenario are minor. For larger vessels, the impacts could be substantial for vessel operating through affected inlets. If inlets shoal to four feet or less, it is assumed that vessels greater than 30 feet in length may either: (1) go out of business, (2) travel longer distances to other inlets before reaching the ocean (increasing fuel costs, decreasing ocean fishing time, and decreasing profits), or (3) change ports. Detailed information on vessel lengths is available for the for-hire fishery, and so estimates of the numbers of vessels that might be affected at each inlet may be developed. The results of applying these assumptions to the shoaling scenarios in Table IV-24 are listed in Table IV-26.
InletShoaling Commercial Fishing Commercial Fishing Commercial Fishing Commercial Fishing
Coastal Scenario Qualitative Impacts Quantitative Impacts Quantitative Impacts Quantitative Impacts
Region Waterway/Inlet County Authorized Depth
Actual Depth New Depth Description Business Output/ Sales
Lost Captain/Crew Jobs Lost Other Jobs Lost
1 Lockwoods Folly Inlet Brunswick 12 6 3
1/2 vessels out of business, 1/2 vessels move to Calabash
$450,078 9 3
2a Carolina Beach Inlet New Hanover 8 8 4
1/2 vessels out of business, 1/2 move to Wilmington/Wrightsville Beach or Calabash
$3,908,075 91 24
2b New Topsail Inlet Pender 8 7 3.5
1/2 vessels out of business, 1/2 move to either Sneads Ferry or Wilmington/Wrightsville Beach
$3,144,016 99 20
2c Barden Inlet Carteret 7 7 3.5
lose 1/3 commercial fishing based in Harkers Island, Gloucester, Marshallberg, which is 3% of Carteret County commercial fishing trips, remainder assumed sound-based or uses Beaufort Inlet at increased fuel cost
$5,071,931 58 31
2c Bogue Inlet Carteret/Onslow 8 8 41/2 vessels out of business, 1/2 move to Morehead
$7,315,769 84 45
3b Ocracoke Inlet Hyde (Ocracoke) 18 16 8
1/4 Hyde Co.commercial fishing out of business, remainder assumed sound-based or moves to Oregon Inlet area
$6,483,020 82 40
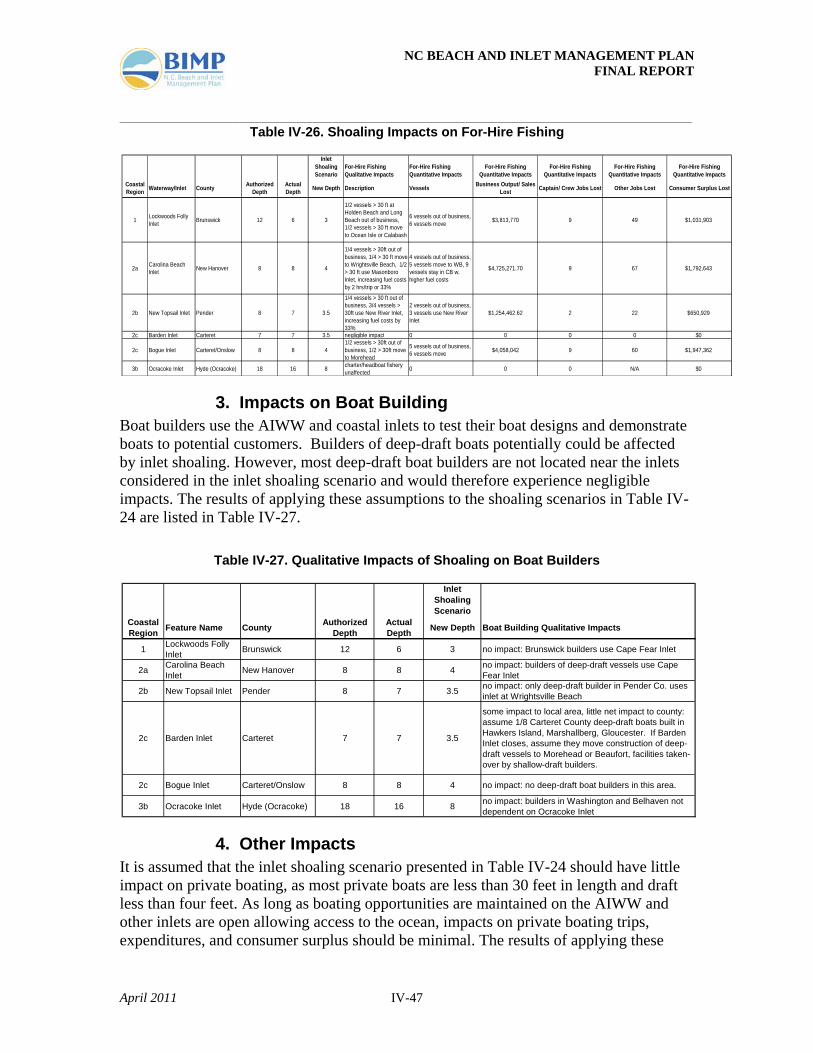
NC BEACH AND INLET MANAGEMENT PLAN FINAL REPORT ______________________________________________________________________________________
April 2011 IV-47
Table IV-26. Shoaling Impacts on For-Hire Fishing
3. Impacts on Boat Building Boat builders use the AIWW and coastal inlets to test their boat designs and demonstrate boats to potential customers. Builders of deep-draft boats potentially could be affected by inlet shoaling. However, most deep-draft boat builders are not located near the inlets considered in the inlet shoaling scenario and would therefore experience negligible impacts. The results of applying these assumptions to the shoaling scenarios in Table IV-24 are listed in Table IV-27.
Table IV-27. Qualitative Impacts of Shoaling on Boat Builders
4. Other Impacts It is assumed that the inlet shoaling scenario presented in Table IV-24 should have little impact on private boating, as most private boats are less than 30 feet in length and draft less than four feet. As long as boating opportunities are maintained on the AIWW and other inlets are open allowing access to the ocean, impacts on private boating trips, expenditures, and consumer surplus should be minimal. The results of applying these
InletShoaling For-Hire Fishing For-Hire Fishing For-Hire Fishing For-Hire Fishing For-Hire Fishing For-Hire FishingScenario Qualitative Impacts Quantitative Impacts Quantitative Impacts Quantitative Impacts Quantitative Impacts Quantitative Impacts
Coastal Region Waterway/Inlet County Authorized
DepthActual Depth New Depth Description Vessels Business Output/ Sales
Lost Captain/ Crew Jobs Lost Other Jobs Lost Consumer Surplus Lost
1 Lockwoods Folly Inlet Brunswick 12 6 3
1/2 vessels > 30 ft at Holden Beach and Long Beach out of business, 1/2 vessels > 30 ft move to Ocean Isle or Calabash
6 vessels out of business, 6 vessels move $3,813,770 9 49 $1,031,903
2a Carolina Beach Inlet New Hanover 8 8 4
1/4 vessels > 30ft out of business, 1/4 > 30 ft move to Wrightsville Beach, 1/2 > 30 ft use Masonboro Inlet, increasing fuel costs by 2 hrs/trip or 33%
4 vessels out of business, 5 vessels move to WB, 9 vessels stay in CB w. higher fuel costs
$4,725,271.70 9 67 $1,792,643
2b New Topsail Inlet Pender 8 7 3.5
1/4 vessels > 30 ft out of business, 3/4 vessels > 30ft use New River Inlet, increasing fuel costs by 33%
2 vessels out of business, 3 vessels use New River Inlet
$1,254,462.62 2 22 $650,929
2c Barden Inlet Carteret 7 7 3.5 negligible impact 0 0 0 0 $0
2c Bogue Inlet Carteret/Onslow 8 8 41/2 vessels > 30ft out of business, 1/2 > 30ft move to Morehead
5 vessels out of business, 6 vessels move $4,058,042 9 60 $1,947,362
3b Ocracoke Inlet Hyde (Ocracoke) 18 16 8 charter/headboat fishery unaffected 0 0 0 N/A $0
InletShoalingScenario
Coastal Region Feature Name County Authorized
DepthActual Depth New Depth Boat Building Qualitative Impacts
1 Lockwoods Folly Inlet Brunswick 12 6 3 no impact: Brunswick builders use Cape Fear Inlet
2a Carolina Beach Inlet New Hanover 8 8 4 no impact: builders of deep-draft vessels use Cape
Fear Inlet
2b New Topsail Inlet Pender 8 7 3.5 no impact: only deep-draft builder in Pender Co. uses inlet at Wrightsville Beach
2c Barden Inlet Carteret 7 7 3.5
some impact to local area, little net impact to county: assume 1/8 Carteret County deep-draft boats built in Hawkers Island, Marshallberg, Gloucester. If Barden Inlet closes, assume they move construction of deep-draft vessels to Morehead or Beaufort, facilities taken-over by shallow-draft builders.
2c Bogue Inlet Carteret/Onslow 8 8 4 no impact: no deep-draft boat builders in this area.
3b Ocracoke Inlet Hyde (Ocracoke) 18 16 8 no impact: builders in Washington and Belhaven not dependent on Ocracoke Inlet
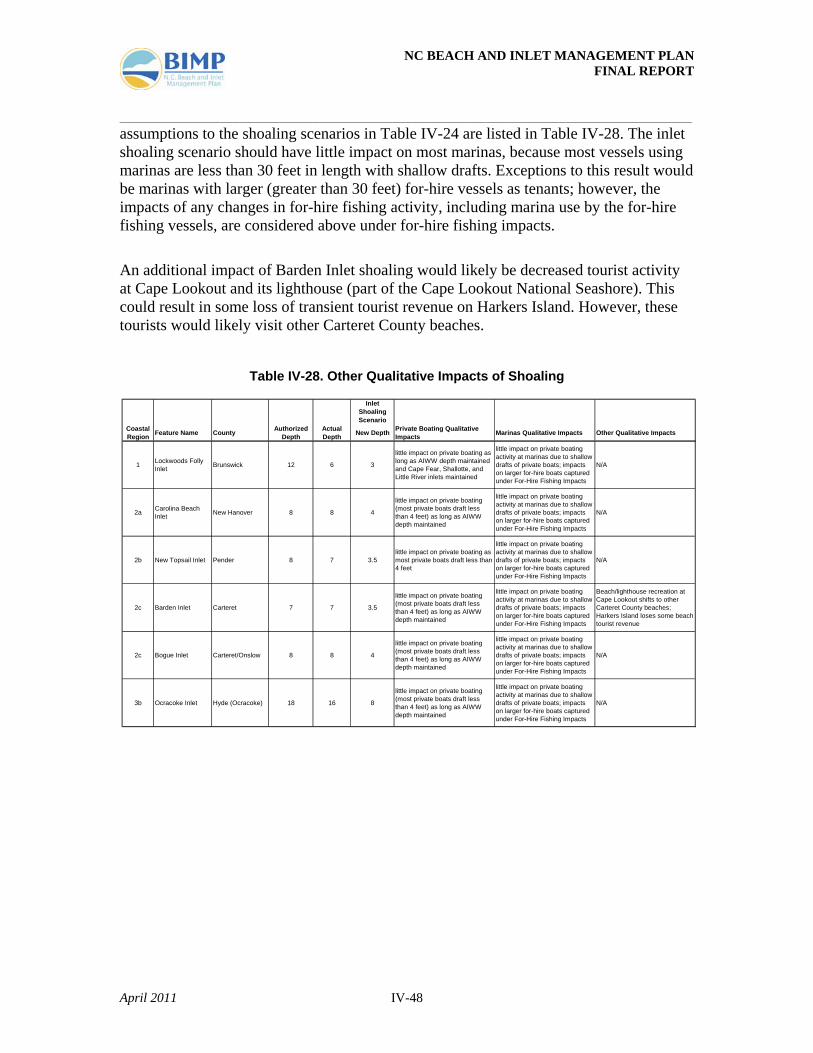
NC BEACH AND INLET MANAGEMENT PLAN FINAL REPORT ______________________________________________________________________________________
April 2011 IV-48
assumptions to the shoaling scenarios in Table IV-24 are listed in Table IV-28. The inlet shoaling scenario should have little impact on most marinas, because most vessels using marinas are less than 30 feet in length with shallow drafts. Exceptions to this result would be marinas with larger (greater than 30 feet) for-hire vessels as tenants; however, the impacts of any changes in for-hire fishing activity, including marina use by the for-hire fishing vessels, are considered above under for-hire fishing impacts.
An additional impact of Barden Inlet shoaling would likely be decreased tourist activity at Cape Lookout and its lighthouse (part of the Cape Lookout National Seashore). This could result in some loss of transient tourist revenue on Harkers Island. However, these tourists would likely visit other Carteret County beaches.
Table IV-28. Other Qualitative Impacts of Shoaling
InletShoalingScenario
Coastal Region Feature Name County Authorized
DepthActual Depth New Depth Private Boating Qualitative
Impacts Marinas Qualitative Impacts Other Qualitative Impacts
1 Lockwoods Folly Inlet Brunswick 12 6 3
little impact on private boating as long as AIWW depth maintained and Cape Fear, Shallotte, and Little River inlets maintained
little impact on private boating activity at marinas due to shallow drafts of private boats; impacts on larger for-hire boats captured under For-Hire Fishing Impacts
N/A
2a Carolina Beach Inlet New Hanover 8 8 4
little impact on private boating (most private boats draft less than 4 feet) as long as AIWW depth maintained
little impact on private boating activity at marinas due to shallow drafts of private boats; impacts on larger for-hire boats captured under For-Hire Fishing Impacts
N/A
2b New Topsail Inlet Pender 8 7 3.5little impact on private boating as most private boats draft less than 4 feet
little impact on private boating activity at marinas due to shallow drafts of private boats; impacts on larger for-hire boats captured under For-Hire Fishing Impacts
N/A
2c Barden Inlet Carteret 7 7 3.5
little impact on private boating (most private boats draft less than 4 feet) as long as AIWW depth maintained
little impact on private boating activity at marinas due to shallow drafts of private boats; impacts on larger for-hire boats captured under For-Hire Fishing Impacts
Beach/lighthouse recreation at Cape Lookout shifts to other Carteret County beaches; Harkers Island loses some beach tourist revenue
2c Bogue Inlet Carteret/Onslow 8 8 4
little impact on private boating (most private boats draft less than 4 feet) as long as AIWW depth maintained
little impact on private boating activity at marinas due to shallow drafts of private boats; impacts on larger for-hire boats captured under For-Hire Fishing Impacts
N/A
3b Ocracoke Inlet Hyde (Ocracoke) 18 16 8
little impact on private boating (most private boats draft less than 4 feet) as long as AIWW depth maintained
little impact on private boating activity at marinas due to shallow drafts of private boats; impacts on larger for-hire boats captured under For-Hire Fishing Impacts
N/A
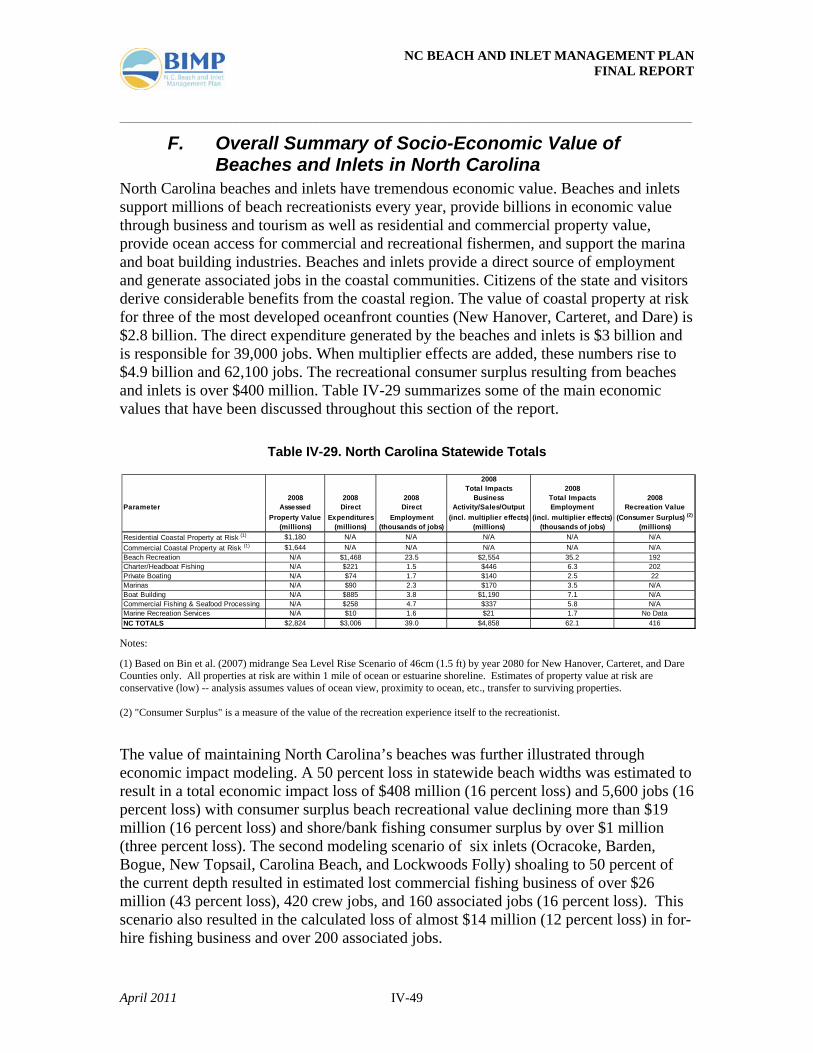
NC BEACH AND INLET MANAGEMENT PLAN FINAL REPORT ______________________________________________________________________________________
April 2011 IV-49
F. Overall Summary of Socio-Economic Value of Beaches and Inlets in North Carolina
North Carolina beaches and inlets have tremendous economic value. Beaches and inlets support millions of beach recreationists every year, provide billions in economic value through business and tourism as well as residential and commercial property value, provide ocean access for commercial and recreational fishermen, and support the marina and boat building industries. Beaches and inlets provide a direct source of employment and generate associated jobs in the coastal communities. Citizens of the state and visitors derive considerable benefits from the coastal region. The value of coastal property at risk for three of the most developed oceanfront counties (New Hanover, Carteret, and Dare) is $2.8 billion. The direct expenditure generated by the beaches and inlets is $3 billion and is responsible for 39,000 jobs. When multiplier effects are added, these numbers rise to $4.9 billion and 62,100 jobs. The recreational consumer surplus resulting from beaches and inlets is over $400 million. Table IV-29 summarizes some of the main economic values that have been discussed throughout this section of the report.
Table IV-29. North Carolina Statewide Totals
Notes:
(1) Based on Bin et al. (2007) midrange Sea Level Rise Scenario of 46cm (1.5 ft) by year 2080 for New Hanover, Carteret, and Dare Counties only. All properties at risk are within 1 mile of ocean or estuarine shoreline. Estimates of property value at risk are conservative (low) -- analysis assumes values of ocean view, proximity to ocean, etc., transfer to surviving properties. (2) "Consumer Surplus" is a measure of the value of the recreation experience itself to the recreationist.
The value of maintaining North Carolina’s beaches was further illustrated through economic impact modeling. A 50 percent loss in statewide beach widths was estimated to result in a total economic impact loss of $408 million (16 percent loss) and 5,600 jobs (16 percent loss) with consumer surplus beach recreational value declining more than $19 million (16 percent loss) and shore/bank fishing consumer surplus by over $1 million (three percent loss). The second modeling scenario of six inlets (Ocracoke, Barden, Bogue, New Topsail, Carolina Beach, and Lockwoods Folly) shoaling to 50 percent of the current depth resulted in estimated lost commercial fishing business of over $26 million (43 percent loss), 420 crew jobs, and 160 associated jobs (16 percent loss). This scenario also resulted in the calculated loss of almost $14 million (12 percent loss) in for-hire fishing business and over 200 associated jobs.
2008Total Impacts 2008
2008 2008 2008 Business Total Impacts 2008Parameter Assessed Direct Direct Activity/Sales/Output Employment Recreation Value
Property Value Expenditures Employment (incl. multiplier effects) (incl. multiplier effects) (Consumer Surplus) (2)
(millions) (millions) (thousands of jobs) (millions) (thousands of jobs) (millions)Residential Coastal Property at Risk (1) $1,180 N/A N/A N/A N/A N/ACommercial Coastal Property at Risk (1) $1,644 N/A N/A N/A N/A N/ABeach Recreation N/A $1,468 23.5 $2,554 35.2 192Charter/Headboat Fishing N/A $221 1.5 $446 6.3 202Private Boating N/A $74 1.7 $140 2.5 22Marinas N/A $90 2.3 $170 3.5 N/ABoat Building N/A $885 3.8 $1,190 7.1 N/ACommercial Fishing & Seafood Processing N/A $258 4.7 $337 5.8 N/AMarine Recreation Services N/A $10 1.6 $21 1.7 No DataNC TOTALS $2,824 $3,006 39.0 $4,858 62.1 416