Embed Size (px)
Citation preview

Article J. Braz. Chem. Soc., Vol. 22, No. 10, 1968-1978, 2011.Printed in Brazil - ©2011 Sociedade Brasileira de Química0103 - 5053 $6.00+0.00A
*e-mail: [email protected]
Evaluation of Turbidimetric and Nephelometric Techniques for Analytical Determination of N-Acetylcysteine and Thiamine in Pharmaceutical Formulations Employing a
Lab-Made Portable Microcontrolled Turbidimeter and Nephelometer
Vagner B. dos Santos,a Thiago B. Guerreiro,a Willian T. Suarez,b Ronaldo C. Fariaa and Orlando Fatibello-Filho*,a
aDepartamento de Química, Universidade Federal de São Carlos, Centro de Ciências Exatas e de Tecnologia, CP 676, 13560-970 São Carlos-SP, Brazil
bDepartamento de Química, Universidade Federal de Viçosa, Centro de Ciências Exatas e Tecnológicas, 36570-000 Viçosa-MG, Brazil
A análise turbidimétrica e nefelométrica sequencial (STN) para duas aplicações analíticas empregando um nefelômetro e turbidímetro microcontrolado portátil (PMTN) é proposta. O PMTN é constituído de diodos emissores de luz, fotodiodos, microcontrolador como unidade de processamento central (CPU) e um um LCD (liquid crystal display) como amostrador. Os métodos STN foram aplicados para a determinação de N-acetilcisteína em formulações farmacêuticas nos intervalos de concentração de 8,0 × 10⁻⁵ a 5,0 × 10⁻³ mol L-1 (nefelometria) e de 5,0 × 10⁻⁵ a 1,2 × 10⁻³ mol L-1 (turbidimetria) com limites de detecção (LOD) de 2.6 × 10⁻⁶ e 7,5 × 10⁻⁶ mol L-1
, respectivamente. As análises STN também foram executadas para a determinação de tiamina na faixa de concentração de 5,0 × 10⁻⁶ a 2,5 × 10⁻⁴ mol L-1 e de 5,0 × 10⁻⁶ a 1,0 × 10⁻⁴ mol L-1 com LOD de 5,91 × 10⁻⁸ e 3,11 × 10⁻⁸ mol L-1 respectivamente no modo nefelométrico e turbidimétrico.
Sequential turbidimetric and nephelometric (STN) analysis for two distinct analytical applications employing a portable microcontrolled turbidimeter and nephelometer (PMTN) is proposed. The PMTN is based on light emitting diodes, photodiodes and, a microcontroller as a central processing unit with a LCD (liquid crystal display) as displayer. The STN methods were applied to determine N-acetylcysteine and two analytical curves in the concentration ranges from 8.0 × 10⁻⁵ to 5.0 × 10⁻³ mol L-1 and from 5.0 × 10⁻⁵ to 1.2 × 10⁻³ mol L-1 were obtained to nephelometry and turbidimetry, respectively. Limits of detection (LOD) of 2.6 × 10⁻⁶ and 7.5 × 10⁻⁶ mol L-1 were acquired for these procedures. The STN analyses were also performed to determinate thiamine and two analytical curves in the concentration ranges from 5.0 × 10⁻⁶ to 2.5 × 10⁻⁴ mol L-1 and from 5.0 × 10⁻⁶ to 1.0 × 10⁻⁴ mol L-1 with LOD of 5.91 × 10⁻⁸ and 3.11 × 10⁻⁸ mol L-1 were acquired for nephelometry and turbidimetry, respectively.
Keywords: turbidimetry, nephelometry, N-acetylcysteine, thiamine, microcontrolled photometric detector
Introduction
Nephelometry is a spectroscopic technique based on the radiation scattered by suspended particles in a solution and sensing the radiation scattered at an angle of 90° from the incident radiation beam. On the other hand, turbidimetry is a technique based on the attenuation of the incident radiation (transmitted radiation) due to particulates in suspension with a detector located at 180° from the incident
beam.1,2 In both techniques, the wavelength of the incident beam does not change, which characterizes an elastic scattering of incident electromagnetic radiation. The elastic scattering of electromagnetic radiation by small particles depends on the particle size (d) and incident radiation beam wavelength (λ). In general, Mie scattering or Fraunhofer diffraction is dominant for particles measuring about 1 µm or larger. On the other hand, Rayleigh scattering is common for small particles (d << λ).3,4 Radiations can be scattered in different directions, but the scattering at 30 ± 15°, 90°, 180° and, forward scattering (where the detector is localized

Santos et al. 1969Vol. 22, No. 10, 2011
between 90° and 180°) are widely employed for analytical purposes. The radiation scattering patterns by hypothetic particles are shown in Figure 1.
In turbidimetry, the analytical signal is not directly proportional to the intensity of the incident radiation (I0), but the logarithm, as can be seen in equation 1:
(1)
where I is the transmitted radiation. Because I and I0 change proportionately, an increase in I0 will not increase the obtained signal. On the other hand, for nephelometric analysis, the relationship between I, I0, and concentration (C) is linear, given by equation 2:
I = KI0C (2)
where K is a constant for the particular instrument at controlled experimental conditions. Therefore, a more intense incident radiation produces a greater magnitude of scattered radiation that will reach the detector located at 90° from the incident radiation beam.3 However, the performance of the analytical method is not only dependent on the power of the incident radiation beam and sensitivity of the sensor but also dependent on the characteristics of the suspension to be analyzed. This is due to distinct radiation scattering patterns that can be generated by particles in suspension.5 Some properties of the suspension such as particle shape and size are affected by changes in pH value, concentration of the reagents, and surfactants that are used to prepare the suspensions. Other variables such as rate and order of mixing, time for stabilization of the suspension and temperature of the solution are other factors that affect the properties of the particles, and consequently, the analytical signal. Thus, this variables should be carefully controlled in order to obtain a good analytical performance.6
Turbidimeters or nephelometers are widely used to measure the radiation scattering. Those are categorized according to the type of radiation source used (LASER,
incandescent light (tungsten filament lamp) and light emitting diode (LED)), angle between the detector and the radiation source (30°, 90°, 180°, and 90° < θ < 180°) and the presence of multiples detectors (multibeams). Optical instruments based on LED as a radiation source have been described in the literature;7-16 however, a few were dedicated to the construction of either turbidimeters or nephelometers.12 Besides, with the use of microcontrollers, the analytical instrumentation becomes portable and presents a lower cost, lower power consumption and higher stability. On the other hand, few microcontrollers have been applied as central processing units (CPU) mainly to lab-made instrumentation.13,14 Santos et al.17 in a previous work developed a microcotrolled nephelometer applied to determine potassium ions in beverages with good performance. A LOD of 4.0 × 10⁻⁷ mol L-1 to potassium determination was obtained. Additionally, microcontrolled equipment can be very useful for providing favorable features of both (turbidimetry and nephelometry techniques) due to the possibility of the multi-detector arrangements (multichannel detection). In fact, a multichannel microcontrolled device can increase the linear calibration range because turbidimetric analyses are often used to determine analytes in concentrated media, while nephelometric analyses are used for less concentrated solutions. Besides, particle size can change the intensity and direction of the radiation scattering and so, a method can be more sensitive than another. Different limits of detection can be obtained in function of this property.6 In order to explore those features, a microcontrolled turbidimeter and nephelometer to perform multiple sequential tasks during a short time is described. This equipment was applied for sequential determination of N-acetylcysteine and thiamine in pharmaceutical formulations in order to verify its performance and applicability.
N-Acetylcysteine (l-α-acetamido-β-mercaptopropionic acid) is a drug mainly used due to its thiol group (R−SH) that gives its reducing properties. This drug is used mainly as a mucolytic and antioxidant agent.18,19 HPLC (high performance liquid chromatography) with amperometric,20 fluorimetric,21 mass22 and ultraviolet23 detectors have been widely applied as the main methods of detection.
Thiamine (vitamin B1) is very important to prevent a disease known as Beriberi, whose frequent symptoms are insomnia, nervousness, irritability, depression, loss of appetite, abdomen and chest pain, and problems associated with lack of memory and concentration.24,25 The American Pharmacopoeia26 recommended the spectrofluorimetric method based on thiochrome formation in which fluorescence is measured between 400 and 450 nm. The British Pharmacopoeia27 recommends a gravimetric procedure by the reaction of thiamine with silicotungstic
Figure 1. Scheme of the light scattering in different directions. Some arrangements between the source of the electromagnetic radiation and the detector are shown.

Evaluation of Turbidimetric and Nephelometric Techniques for Analytical Determination J. Braz. Chem. Soc.1970
acid. Polarographic,28 potentiometric,29 chromatographic,30 electrophoretic,31 fluorescence32 and spectrophotometric33 methods have also been employed.
Experimental
Reagents and solutions
Deionized water (resistivity > 18.2 MΩ cm) was obtained from a Milli-Q plus system (Millipore Corp., Bedford, MA, USA) and used to prepare all aqueous solutions. A 8.5 × 10⁻³ mol L-1 N-acetylcysteine (Sigma) stock solution and a 0.1 mol L-1 copper sulfate (Mallinckrodt) stock solution were prepared daily. A 1.5% (m/v) polyethylene glycol (Aldrich) solution and concentrated hydrochloric acid (Merck) were also used. Tablet samples of N-acetylcysteine (10 of each sample) purchased from local pharmacies were macerated and masses of 2.0 and 6.0 g were weighed and dissolved in deionized water to prepare 100 mL of N-acetylcysteine solution. The solutions containing the active principle were subjected to ultrasound for 30 min and then filtered through 0.5 µm filter paper. A 7.5 × 10⁻³ mol L-1 thiamine (Sigma) stock solution and 7.5 × 10⁻³ mol L-1 silicotungstic acid (Sigma) were prepared daily. The tablets of thiamine (10 of each sample) also purchased from local pharmacies were macerated and masses of 300 mg were weighed and dissolved in deionized water to prepare 500 mL of stock solutions. After, stock solutions were subjected to ultrasound for 30 min and then filtered.
Apparatus
All electrochemical measurements were performed using a potentiostat/galvanostat (Autolab, Eco Chemie, Netherlands) controlled by the GPES 4.9 software (Eco Chemie). These measurements were done using a conventional three electrode electrochemical cell (30 mL). A hanging mercury drop electrode (HMDE), Metrohm (model EA 410), was used as the working electrode, Ag/AgCl (3.0 mol L-1 KCl), Metrohm (model AG 9101), as the reference electrode and platinum foil as the counter electrode. An Orion model EA 940 (USA) pH meter equipped with a combined glass electrode (Analion, model V 620), with an external Ag/AgCl (3.0 mol L-1 KCl) reference electrode, was used to determine pH. A Micronal model B330 (USA) conductivimeter with a glass conductivity cell was also used. An Ocean Optics model USB 2000 (USA) spectrophotometer equipped with an optical fiber (model ps50-2) was used to measure the emission spectra of LED, which was used as radiation sources. The ultrabright blue LED (InGaN, 465 nm) model OVLGB0C6B9 was acquired from Electronics (USA),
and the infrared LED (AlGaAs, 880 nm) model QED 223 from Fairchild Semiconductor (China). Photodiodes (Texas Advanced Optoelectronic Solutions, USA), model TSLB257 (visible sensor), and TSL260R-LF (IR sensor) were used as the detectors.34,35 A peripheral interface controller (PIC) microcontroller, acquired from Microchip Technology (USA), model PIC18F4550,36 was used as the CPU. Dynamic light scattering (DLS) measurements were performed employing a Zetasizer from Malvern Instruments model Nano ZS using a standard LASER of He-Ne with maxima emission at 632.8 nm and maximum power of 4 mW.
Portable microcontrolled turbidimeter and nephelometer
The wavelengths of maximum emission (λmax) for blue and infrared LED were 465 and 880 nm, respectively. The blue LED was chosen because most turbidity analyses found in the literature use radiation sources that emit light ranging from 400 to 480 nm in the electromagnetic spectrum.3,6 However, the infrared LED (IR LEDs) was installed in the portable microcontrolled turbidimeter and nephelometer (PMTN) in order to determine particles in colored suspension. This strategy was necessary because the presence of these colored suspension led to a decrease of the light scattering by absorption of incident beam leading to systematic errors. As already known, the radiation source of a nephelometer should be more intense than that of a turbidimeter.3,6,17 Thus, the ultrabright LED was coupled to a BC548 transistor driven by the microcontroller to provide 50 and 100 mA of current to the blue and IR LEDs, respectively, supplying high-intensity radiation for the nephelometric analyses.17 On the other hand, whether the same LED was displaced to 180° of the sensor as in turbidimetric analyses, the sensor will lead to an unwanted saturation. For this, a low electric current is needed to provide a low luminous intensity to the turbidimetric module. A working current lower than 1 mA in LED causes instability in the luminescence of the radiation source. So, 2.0 mA was selected to supply a steady radiation source to the PMTN which showed good reproducibility, precision and accuracy. The electric currents were limited by the variable resistor of 5 and 1 kΩ to supply the electric current mentioned above. The details of the use of TSLB257 (blue sensor), TSL260R-LF (infrared sensor) photodiodes and 18F455036 microcontroller as a CPU for the PMTN were described by Santos et al.17 in previous article of our research group. Figure 2 illustrates how the LED, photodiodes and LCD were coupled to the PIC microcontroller.
A 12 V rechargeable battery (7.0 A h-1) was used to provide the power to the PMTN for a period of 35 h without interruption. The analyses were performed in batch, although it may be adapted for flow injection analyses. The

Santos et al. 1971Vol. 22, No. 10, 2011
measures of instrument noise, reading of the blank, and then the turbidimetric and nephelometric sequential analyses at 465 nm or at 880 nm, respectively, are executed by applying a program written in language C embedded within PIC memory. Additional details of this program were presented in our previous work.17 However, in order to perform the STN analyses new routines of software were developed to select the proper LED and photodiode. The PMTN takes only 0.50 s to execute the STN analyses and display the data on the LCD screen.
Evaluation of performance of the PMTN
To verify the performance and reliability of the proposed microcontrolled turbidimeter and nephelometer
(PMTN), studies of stability, signal-to-noise ratio and calibration were performed. These assays were carried out on different days.
Analytical application employing the PMTN
Analytical application of the PMTN was evaluated in the STN determination of N-acetylcysteine and thiamine in pharmaceutical formulations. In order to optimize the applied analytical methods, the variables related to the formation of a suspension, such as the concentration of the reagent, analyte, surfactant and the pH solution, were evaluated employing a factorial design for each studied analyte. To determine N-acetylcysteine, the method based on the precipitation reaction with copper ions (Cu2+) was used,
Figure 2. Electronic circuit of the developed PMTN (a). The arrangement of cuvette, LED (D1, D2, D3 and D4), and photodiodes (PD1 and PD2) are also shown (b). Power supply (battery of +12 V); GND is ground; PT1, PT2, PT3, PT4 e PT5 are 5, 1, 5, 5 and 1 kΩ respectively; the blue LED1 (LED used to nephelometry; dashed line) and LED3 (LED used to turbidimetry; solid line) and the blue PD1 (photodiode 1) are employed to STN analyses with measurement at 465 nm. Similarly, the infrared LED2 (LED used to turbidimetry) and LED4 (LED used to nephelometry) and PD2 (photodiode 2) are employed to STN analyses with measurement at 880 nm. BT1, BT2 and BT3 are the buttons (switches) respectively.
Evaluation of Turbidimetric and Nephelometric Techniques for Analytical Determination J. Braz. Chem. Soc.1972
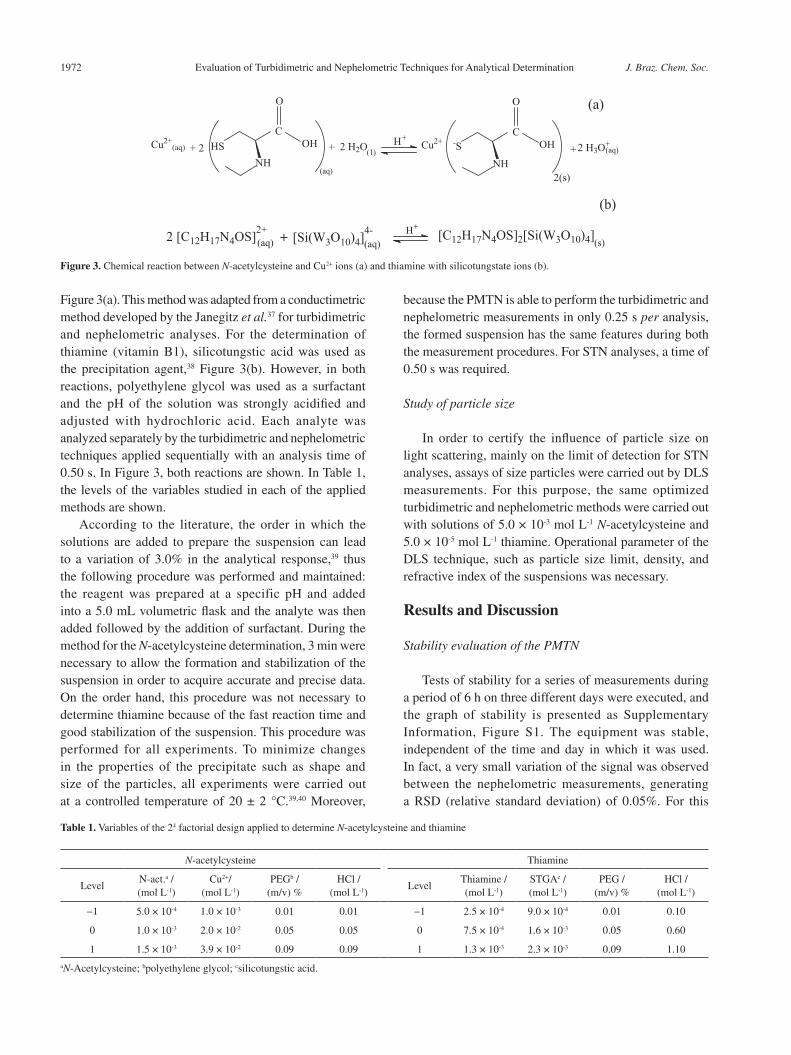
Figure 3(a). This method was adapted from a conductimetric method developed by the Janegitz et al.37 for turbidimetric and nephelometric analyses. For the determination of thiamine (vitamin B1), silicotungstic acid was used as the precipitation agent,38 Figure 3(b). However, in both reactions, polyethylene glycol was used as a surfactant and the pH of the solution was strongly acidified and adjusted with hydrochloric acid. Each analyte was analyzed separately by the turbidimetric and nephelometric techniques applied sequentially with an analysis time of 0.50 s. In Figure 3, both reactions are shown. In Table 1, the levels of the variables studied in each of the applied methods are shown.
According to the literature, the order in which the solutions are added to prepare the suspension can lead to a variation of 3.0% in the analytical response,39 thus the following procedure was performed and maintained: the reagent was prepared at a specific pH and added into a 5.0 mL volumetric flask and the analyte was then added followed by the addition of surfactant. During the method for the N-acetylcysteine determination, 3 min were necessary to allow the formation and stabilization of the suspension in order to acquire accurate and precise data. On the order hand, this procedure was not necessary to determine thiamine because of the fast reaction time and good stabilization of the suspension. This procedure was performed for all experiments. To minimize changes in the properties of the precipitate such as shape and size of the particles, all experiments were carried out at a controlled temperature of 20 ± 2 °C.39,40 Moreover,
because the PMTN is able to perform the turbidimetric and nephelometric measurements in only 0.25 s per analysis, the formed suspension has the same features during both the measurement procedures. For STN analyses, a time of 0.50 s was required.
Study of particle size
In order to certify the influence of particle size on light scattering, mainly on the limit of detection for STN analyses, assays of size particles were carried out by DLS measurements. For this purpose, the same optimized turbidimetric and nephelometric methods were carried out with solutions of 5.0 × 10⁻³ mol L-1 N-acetylcysteine and 5.0 × 10⁻⁵ mol L-1 thiamine. Operational parameter of the DLS technique, such as particle size limit, density, and refractive index of the suspensions was necessary.
Results and Discussion
Stability evaluation of the PMTN
Tests of stability for a series of measurements during a period of 6 h on three different days were executed, and the graph of stability is presented as Supplementary Information, Figure S1. The equipment was stable, independent of the time and day in which it was used. In fact, a very small variation of the signal was observed between the nephelometric measurements, generating a RSD (relative standard deviation) of 0.05%. For this
Figure 3. Chemical reaction between N-acetylcysteine and Cu2+ ions (a) and thiamine with silicotungstate ions (b).
Table 1. Variables of the 24 factorial design applied to determine N-acetylcysteine and thiamine
N-acetylcysteine Thiamine
LevelN-act.a / (mol L-1)
Cu2+/ (mol L-1)
PEGb / (m/v) %
HCl / (mol L-1)
LevelThiamine / (mol L-1)
STGAc / (mol L-1)
PEG / (m/v) %
HCl / (mol L-1)
−1 5.0 × 10⁻⁴ 1.0 × 10⁻³ 0.01 0.01 −1 2.5 × 10⁻⁴ 9.0 × 10⁻⁴ 0.01 0.10
0 1.0 × 10⁻³ 2.0 × 10⁻² 0.05 0.05 0 7.5 × 10⁻⁴ 1.6 × 10⁻³ 0.05 0.60
1 1.5 × 10⁻³ 3.9 × 10⁻² 0.09 0.09 1 1.3 × 10⁻³ 2.3 × 10⁻³ 0.09 1.10
aN-Acetylcysteine; bpolyethylene glycol; csilicotungstic acid.
Santos et al. 1973Vol. 22, No. 10, 2011
study, only the nephelometric data were discussed, but the turbidimetric data also presented the same results with low values of RSD. At this stage of development of the device, preliminary tests are necessary only to check the stability of the PMTN electronic circuit and not the chemical system under study, which thus explains the use of the empty cuvette (without solution) in the optical path. The nephelometric signal was about 90 mV mainly due to reflection of the radiation by the wall of the cuvette and subsequently detected at 90°. However, before each analysis this spurious signal is read by the PMTN and discounted automatically from the analytical signal of radiation scattering by a software written in C language as described by Cantrell and Ingle.16 This small disadvantage does not compromise in any manner the results obtained with the equipment. In some cases, experimental results of turbidity or nephelometry were suppressed since they showed similar results and interpretations, avoiding that data might be presented repeatedly.
Multivariate optimization applied for determination of N-acetylcysteine and thiamine in pharmaceutical formulations
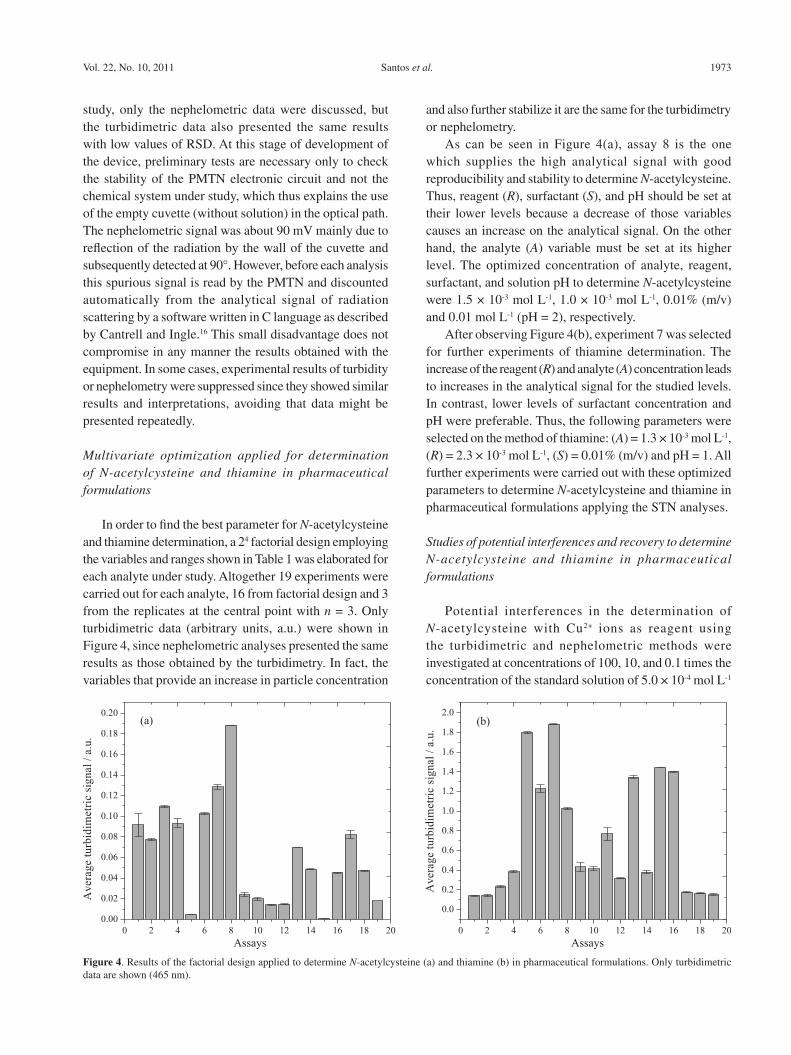
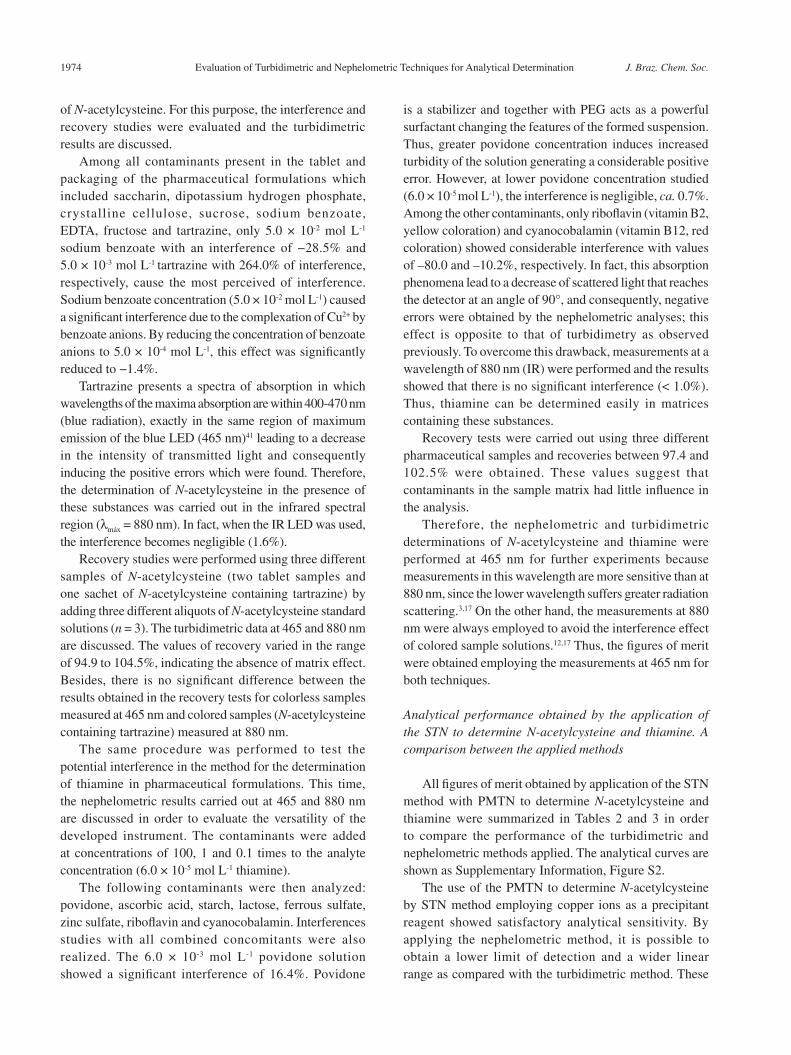
In order to find the best parameter for N-acetylcysteine and thiamine determination, a 24 factorial design employing the variables and ranges shown in Table 1 was elaborated for each analyte under study. Altogether 19 experiments were carried out for each analyte, 16 from factorial design and 3 from the replicates at the central point with n = 3. Only turbidimetric data (arbitrary units, a.u.) were shown in Figure 4, since nephelometric analyses presented the same results as those obtained by the turbidimetry. In fact, the variables that provide an increase in particle concentration
and also further stabilize it are the same for the turbidimetry or nephelometry.
As can be seen in Figure 4(a), assay 8 is the one which supplies the high analytical signal with good reproducibility and stability to determine N-acetylcysteine. Thus, reagent (R), surfactant (S), and pH should be set at their lower levels because a decrease of those variables causes an increase on the analytical signal. On the other hand, the analyte (A) variable must be set at its higher level. The optimized concentration of analyte, reagent, surfactant, and solution pH to determine N-acetylcysteine were 1.5 × 10⁻³ mol L-1, 1.0 × 10⁻³ mol L-1, 0.01% (m/v) and 0.01 mol L-1 (pH = 2), respectively.
After observing Figure 4(b), experiment 7 was selected for further experiments of thiamine determination. The increase of the reagent (R) and analyte (A) concentration leads to increases in the analytical signal for the studied levels. In contrast, lower levels of surfactant concentration and pH were preferable. Thus, the following parameters were selected on the method of thiamine: (A) = 1.3 × 10⁻³ mol L-1, (R) = 2.3 × 10⁻³ mol L-1, (S) = 0.01% (m/v) and pH = 1. All further experiments were carried out with these optimized parameters to determine N-acetylcysteine and thiamine in pharmaceutical formulations applying the STN analyses.
Studies of potential interferences and recovery to determine N-acetylcysteine and thiamine in pharmaceutical formulations
Potential interferences in the determination of N-acetylcysteine with Cu2+ ions as reagent using the turbidimetric and nephelometric methods were investigated at concentrations of 100, 10, and 0.1 times the concentration of the standard solution of 5.0 × 10⁻⁴ mol L-1
Figure 4. Results of the factorial design applied to determine N-acetylcysteine (a) and thiamine (b) in pharmaceutical formulations. Only turbidimetric data are shown (465 nm).
Evaluation of Turbidimetric and Nephelometric Techniques for Analytical Determination J. Braz. Chem. Soc.1974
of N-acetylcysteine. For this purpose, the interference and recovery studies were evaluated and the turbidimetric results are discussed.
Among all contaminants present in the tablet and packaging of the pharmaceutical formulations which included saccharin, dipotassium hydrogen phosphate, crystalline cellulose, sucrose, sodium benzoate, EDTA, fructose and tartrazine, only 5.0 × 10⁻² mol L-1 sodium benzoate with an interference of −28.5% and 5.0 × 10⁻³ mol L-1 tartrazine with 264.0% of interference, respectively, cause the most perceived of interference. Sodium benzoate concentration (5.0 × 10⁻² mol L-1) caused a significant interference due to the complexation of Cu2+ by benzoate anions. By reducing the concentration of benzoate anions to 5.0 × 10⁻⁴ mol L-1, this effect was significantly reduced to −1.4%.
Tartrazine presents a spectra of absorption in which wavelengths of the maxima absorption are within 400-470 nm (blue radiation), exactly in the same region of maximum emission of the blue LED (465 nm)41 leading to a decrease in the intensity of transmitted light and consequently inducing the positive errors which were found. Therefore, the determination of N-acetylcysteine in the presence of these substances was carried out in the infrared spectral region (λmáx = 880 nm). In fact, when the IR LED was used, the interference becomes negligible (1.6%).
Recovery studies were performed using three different samples of N-acetylcysteine (two tablet samples and one sachet of N-acetylcysteine containing tartrazine) by adding three different aliquots of N-acetylcysteine standard solutions (n = 3). The turbidimetric data at 465 and 880 nm are discussed. The values of recovery varied in the range of 94.9 to 104.5%, indicating the absence of matrix effect. Besides, there is no significant difference between the results obtained in the recovery tests for colorless samples measured at 465 nm and colored samples (N-acetylcysteine containing tartrazine) measured at 880 nm.
The same procedure was performed to test the potential interference in the method for the determination of thiamine in pharmaceutical formulations. This time, the nephelometric results carried out at 465 and 880 nm are discussed in order to evaluate the versatility of the developed instrument. The contaminants were added at concentrations of 100, 1 and 0.1 times to the analyte concentration (6.0 × 10⁻⁵ mol L-1 thiamine).
The following contaminants were then analyzed: povidone, ascorbic acid, starch, lactose, ferrous sulfate, zinc sulfate, riboflavin and cyanocobalamin. Interferences studies with all combined concomitants were also realized. The 6.0 × 10⁻³ mol L-1 povidone solution showed a significant interference of 16.4%. Povidone
is a stabilizer and together with PEG acts as a powerful surfactant changing the features of the formed suspension. Thus, greater povidone concentration induces increased turbidity of the solution generating a considerable positive error. However, at lower povidone concentration studied (6.0 × 10⁻⁵ mol L-1), the interference is negligible, ca. 0.7%. Among the other contaminants, only riboflavin (vitamin B2, yellow coloration) and cyanocobalamin (vitamin B12, red coloration) showed considerable interference with values of –80.0 and –10.2%, respectively. In fact, this absorption phenomena lead to a decrease of scattered light that reaches the detector at an angle of 90°, and consequently, negative errors were obtained by the nephelometric analyses; this effect is opposite to that of turbidimetry as observed previously. To overcome this drawback, measurements at a wavelength of 880 nm (IR) were performed and the results showed that there is no significant interference (< 1.0%). Thus, thiamine can be determined easily in matrices containing these substances.
Recovery tests were carried out using three different pharmaceutical samples and recoveries between 97.4 and 102.5% were obtained. These values suggest that contaminants in the sample matrix had little influence in the analysis.
Therefore, the nephelometric and turbidimetric determinations of N-acetylcysteine and thiamine were performed at 465 nm for further experiments because measurements in this wavelength are more sensitive than at 880 nm, since the lower wavelength suffers greater radiation scattering.3,17 On the other hand, the measurements at 880 nm were always employed to avoid the interference effect of colored sample solutions.12,17 Thus, the figures of merit were obtained employing the measurements at 465 nm for both techniques.
Analytical performance obtained by the application of the STN to determine N-acetylcysteine and thiamine. A comparison between the applied methods
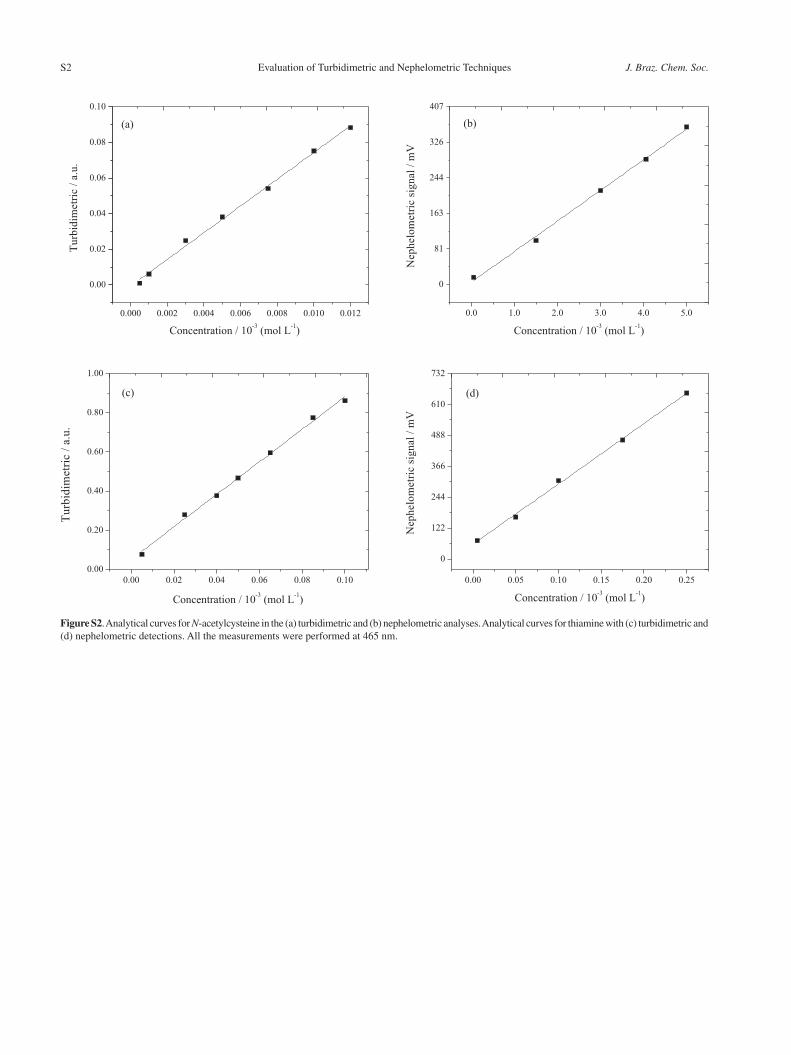
All figures of merit obtained by application of the STN method with PMTN to determine N-acetylcysteine and thiamine were summarized in Tables 2 and 3 in order to compare the performance of the turbidimetric and nephelometric methods applied. The analytical curves are shown as Supplementary Information, Figure S2.
The use of the PMTN to determine N-acetylcysteine by STN method employing copper ions as a precipitant reagent showed satisfactory analytical sensitivity. By applying the nephelometric method, it is possible to obtain a lower limit of detection and a wider linear range as compared with the turbidimetric method. These

Santos et al. 1975Vol. 22, No. 10, 2011
limits of detection were lower than some reported in the literature.37,42 In fact, with this equipment, it was possible to acquire low limits of detections of 2.6 × 10⁻⁶ and 7.5 × 10⁻⁶ mol L-1 for nephelometric and turbidimetric analyses, respectively. The methods show good RSD values as can be seen in Table 2.
The results regarding the determination of thiamine by employing STN methods with PMTN showed to be very encouraging due to the low limits of detections acquired for both methods, wide linearity and high analytical sensitivity (slope of analytical curve) are also obtained. The good performance of the PMTN demonstrates its usefulness, since these results are similar to those reported in the literature.43,44 Moreover, the detection limits obtained when applying the nephelometric method were higher than those obtained when employing the turbidimetric method. Thus, this result was opposite to the one found previously in the determination of N-acetylcysteine, where the nephelometric method shows lower limit of detections than those provided by the turbidimetric method, although the same conditions (temperature, stirring, and time of stabilization) were employed for each technique. Thus, we believe that the particle size parameter may be the factor which most influences this behavior as reported in the literature.1,3,4,6 At the beginning, it was noted that the reaction between N-acetylcysteine and copper ions
formed a suspension in which particle sizes were greater than those produced by the reaction between thiamine and silicotungstic acid, because these particles can be seen by naked eye. Thus, a study of particle size was performed employing the DLS technique.
Light scattering and particles size
According to the results obtained from the STN studies45,46 for the precipitate formed in the of N-acetylcysteine method with Cu2+ ions, it can be verified that the suspension contains large particles or aggregates that presented a particle size larger than the upper limit (13751.5 nm) given by the equipment. In other words, it is outside the technical specifications of the equipment applied to DLS measurements. On the other hand, the particle size of the precipitate formed by the reaction between thiamine and silicotungstic acid produced particles whose sizes were much smaller than those obtained by the N-acetylcysteine method. The graph of particles size distribution vs. intensity is shown in Figure 5.
As can be seen in the graph, there are two peaks of maximum intensity, one in 1376 nm (97.6% of the relative signal intensity) and another in 5560 nm (2.4% of the relative signal intensity). Thus, it can be deduced that the peak in 1376 nm refers to an average diameter of the
Table 2. Figures of merit of linear regression obtained by application of the proposed equipment employing the method based on the reaction between N-acetylcysteine and Cu2+ as a reagent of precipitation with measurement at 465 nm
Parameters Turbidimetric results Nephelometric results
Equation of regression T. S.a (a.u.) = (−7.29 ± 0.02) × 10-4 + (75.10 ± 0.02) × [N-act.]c N. S.b (mV) = (−2 ± 1) + (7.4 ± 0.3) × 104 [N-act.]
Linear range 5.0 × 10⁻⁵ – 1.2 × 10⁻³ (mol L-1) 8.0 × 10⁻⁵ – 5.0 × 10⁻³ (mol L-1)
Coefficient of correlation (r) 0.996 0.998
LODd 7.5 × 10⁻⁶ mol L-1 2.6 × 10⁻⁶ mol L-1
LOQe 2.5 × 10⁻⁵ mol L-1 8.7 × 10⁻⁶ mol L-1
Repeatability, RSD ( n = 3 ) 2.5% for 3.0 × 10⁻⁴ mol L-1 1.4% for 3.0 × 10⁻⁴ mol L-1
aTurbidimetric signal; bnephelometric signal; cN-acetylcysteine concentration; dthe limit of detection was calculated using: LOD = 3 × SD/β, SD is the standard deviation of the blank and β the analytical sensitivity; ethe limit of quantification was calculated using: LOQ = 10 × SD/β.
Table 3. Figures of merit of linear regression obtained by application of the precipitation reaction between thiamine and silicotungstic acid employing the PMNT with measurement at 465 nm
Parameters Turbidimetric results Nephelometric results
Equation of regression T. S.a (a.u.) = (0.05 ± 0.02) + (8.3 ± 0.2) × 103 [thiamine] N. S.b (mV) = (7 ± 1) + (2.4 ± 0.1) × 106 [thiamine]
Linear range 5.0 × 10⁻⁶ – 1.0 ×10⁻⁴ (mol L-1) 5.0 × 10⁻⁶ – 2.5 ×10⁻⁴ (mol L-1)
Coefficient of correlation (r) 0.996 0.998
LOD 3.11 × 10⁻⁸ mol L-1 5.91 × 10⁻⁸ mol L-1
LOQ 1.03 × 10⁻⁷ mol L-1 1.97 × 10⁻⁷ mol L-1
Repeatability, RSD ( n = 3 ) 0.64% to 5.0 × 10⁻⁵ mol L-1 0.60% to 5.0 × 10⁻⁵ mol L-1
aTurbidimetric signal; bnephelometric signal.

Evaluation of Turbidimetric and Nephelometric Techniques for Analytical Determination J. Braz. Chem. Soc.1976
particles in suspension and 5560 nm refers to aggregation processes between the particles. According to these results, we can conclude that, in this case, larger particles (precipitate formed by reaction between N-acetylcysteine and Cu2+ ions) allow the nephelometric technique to achieve lower limits of detection than those obtained when applying the turbidimetric method. On the other hand, small particles are favorable for turbidimetric analyses (precipitate formed by the reaction between thiamine and silicotungstate ions). In fact, small particles lead to the accentuated increase of radiation scattering intensity in all directions, increasing the turbidimetric signal by decreasing the amount of radiation reaching the detector (decreasing the signal of transmittance).1,3,4,40 This attenuation of radiation was more pronounced than the effect of radiation scattering at 90° and thus the turbidimetric method presented a lower limit of detection than that obtained by the nephelometric technique. On the other hand, large particles cause an opposite effect because these particles do not scatter the radiation with the same efficiency of the small particles, mostly angles greater than 90°. This effect leads to a less accentuated decrease of the transmitted radiation intensity, consequently reducing the turbidimetric signal more strongly than the nephelometric signal.
This is reinforced analyzing the analytical sensitivity and the limit of detection obtained using both turbidimetric and nephelometric methods for thiamine (small particles) and N-acetylcysteine determination (large particles). The methods for thiamine detection showed an analytical sensitivity 100 times higher mainly due to the smaller particles, and consequently, the limit of detection was 100 times lower than the methods for N-acetylcysteine detection.
Thus, the PMTN based on radiation scattering can distinguish the scattering patterns of large particles from
small particles because large particles principally scatter radiation to small angles away from the incident radiation beam, while small particles cause more effective scattering for all directions.
Analysis of N-acetylcysteine and thiamine concentrations in pharmaceutical formulations employing conductometry and voltammetry, respectively, used as comparative techniques
The method developed by Janegitz et al.37 was used as a comparative method. This method is based on the conductometric titration of N-acetylcysteine with Cu2+ ions. In Table 4, the results regarding concentration of N-acetylcysteine in pharmaceutical formulations when employing the STN method and the conductometric method used as a reference are shown.
As can be observed by applying the F-test for each analyzed sample, the values obtained were lower than 10.0, well below the critical value (19.0) for a 95% confidence level. Similarly, the values obtained by applying t-paired tests were also below the critical value (4.30). From these results, it can be concluded that there are no statistical differences between the results at a confidence level of 95%. Thus, the PMTN can be used to determine N-acetylcysteine by applying the STN method with good results even in the presence of colored substances.
To determine thiamine in pharmaceutical formulations, the method developed by Lingane and Davies28 based on the differential pulse polarographic technique was applied. In Table 5, the results of the thiamine concentration in pharmaceutical formulations employed for STN method are shown, as well as the polarographic method which was used as a reference.
Figure 5. Study of particle size for the precipitate formed in the reaction between thiamine and silicotungstic acid. Graphic obtained employing a Zetasizer from Malvern Instruments model Nano ZS using a LASER of He-Ne with maximum emission at 632.8 nm.
Santos et al. 1977Vol. 22, No. 10, 2011
Table 4. Results obtained by the application of the conductimetric method and the PMTN for two samples of N-acetylcysteine analyzed in triplicate (n = 3)
Sa Rb / mg Tc (1) / mg Nd (2) / mg E1e / % E2
e / % F1-Testf F2-Testf t1-Testf t2-Testf
A 193 ± 2 190.3 ± 0.8 191.4 ± 0.9 −1.4 −0.8 8.9 4.5 2.5 0.8
Bg 570 ± 2 575.9 ± 0.7 572.5 ± 0.9 1.0 0.4 4.0 1.4 0.5 0.8
F-test (2, 2, α = 0.05) = 19.0 and t-test (2, 2, α = 0.05) = 4.3 (paired), with n = 3; asample; breference; cturbidimetry; dnephelometry; eE1 is the relative error obtained by comparison between the turbidimetric (1) and the comparative method and E2 is the relative error between the nephelometric (2) and comparative method; fF1 test, F2 test, t1 test, and t2 test are the results of application of F-test and t-paired test under results supplied by the turbidimetric (1) and nephelometric (2) methods in comparison to the comparative method, respectively; gB is the sample containing tartrazine (dye) analyzed with IR LED at 880 nm.
Table 5. Thiamine in pharmaceutical samples analyzed by the methods of differential pulse voltammetry (comparative) and the sequential turbidimetric and nephelometric (STN) method with the PMTN (465 nm)
Sa Rb / mg Tc (1 ) / mg Nd (2) / mg E1e / % E2
e / % F1-Testf F2-Testf t1-Testf t2-Testf
A 307.3 ± 0.9 304.5 ± 0.1 303.0 ± 0.1 −0.9 −1.4 3.0 1.4 1.7 1.0
B 288.9 ± 0.3 294.3 ± 0.2 284.3 ± 0.3 1.9 −1.6 1.5 1.0 2.5 1.8
C 292.1 ± 0.9 299.9 ± 0.8 299.0 ± 0.9 2.7 2.4 1.0 3.9 1.0 3.8
F-test (2, 2, α = 0.05) = 19.0 and t-test (2, 2, α = 0.05) = 4.3 (paired), with n = 3; asample; breference; cturbidimetry; dnephelometry; eE1 is the relative error obtained by comparison between the turbidimetric (1) and the comparative method; and E2 is the relative error between the nephelometric (2) and differential pulse voltammetry used as comparative method; fF1 test, F2 test, t1 test, and t2 test are the results of application of F-test and t-paired test under results supplied by the turbidimetric (1) and nephelometric (2) methods in comparison to the differential pulse voltammetry method, respectively.
Analyzing the values obtained by the application of F-test and t-paired test, all values are below the critical (tabulated) values, and therefore there are no differences between the applied methods for a 95% level of confidence. The largest relative error was only 2.7%. According to the results, the PMTN can be used in both methods for the determination of N-acetylcysteine and thiamine with similar results to those achieved employing the comparative methods because there are no significant differences between them at the confidence interval of 95%.
Additionally, the proposed method is also attractive in the environmental point of view mainly because in situ and online analyses can be easily performed since it has a fast response, good portability, low power consumption, and practicality, since acquired experimental data can be filed in the memory of the microcontroller (or external memory). Therefore, once properly calibrated, the equipment is able to identify the concentration of the analytes without requiring recalibration since the concentration values are not more than 10% different from values of the standard solutions. In the case of greater divergence, a message will be displayed on the LCD screen alerting the need of new calibration of the PMTN.
Conclusions
The possibility of analyzing by the turbidimetric and nephelometric methods at practically the same time (0.25 s between each analysis) was important to study the characteristics of each technique applied to two different cases studies (N-acetylcysteine and thiamine). With two
applications, it is possible to compare the linearity, analytical sensitivity, LOD, LOQ and repeatability furnished by these different procedures. In addition, it was concluded that the performance of the employed analytical methods is not only a function of the power of incident radiation and sensitivity of the sensor but also a function of the particle size. In fact, the nephelometric method presented a lower limit of detection than that of the turbidimetric method in the case of N-acetylcysteine determination in which the particles formed were larger. On the other hand, the turbidimetric method for thiamine determination presented better results by producing smaller size particles. The same conditions were used in both turbidimetric and nephelometric methods and particle size was the decisive variable for the obtained results. Thus, the PMTN showed a quite versatile detection system that allow even more capabilities than those supplied by a conventional turbidimeter or nephelometer since configurations for multi-beam and multi-detector arrangements were easily implemented.
Supplementary Information
Supplementary information of the stability of PMTN and analytical curves (Figure S1 and S2, respectively) are available free of charge at http://jbcs.org.br as a PDF file.
Acknowledgments
The authors are grateful to the Conselho Nacional de Desenvolvimento Científico e Tecnológico (CNPq), Fundação de Apoio a Pesquisa do Estado de São Paulo
Evaluation of Turbidimetric and Nephelometric Techniques for Analytical Determination J. Braz. Chem. Soc.1978
(FAPESP) and Coordenação de Aperfeiçoamento de Pessoal de Nível Superior (CAPES) for their financial support and scholarships.
References
1. Braun, R. D.; Radiative Scattering: Introduction to Instrumental
Analysis; McGraw-Hill: New York, 1987.
2. Skoog, D. A.; Leary, J. J.; Principles of Instrumental Analysis,
4th ed.; Saunders College Publishing: New York, 1992.
3. Ingle Jr., J. D; Crouch, S. R.; Spectrochemical Analysis, 1st ed.;
Prentice-Hall Inc.: New Jersey, 1988.
4. Kleizen, H. H.; Putter, A. B.; Van der Beek, M.; Huynink, S. J.;
Filtr. Sep. 1995, 32, 897.
5. Liu, H. H.; Dasgupta, P. K.; Anal. Chim. Acta 1996, 326, 13.
6. Morais, I. P.; Toth, I. V.; Rangel, A. O; Spectroc. Lett. 2006, 39,
547.
7. Dasgupta, P. K.; Eom, I.; Morris, K. J.; Li, J.; Anal. Chim. Acta
2003, 500, 337.
8. Somnam, S.; Grudpan, K.; Jakmunee, J.; Maejo Int. J. Sci.
Technol. 2008, 2, 172.
9. Palma, A. J.; Ortigosa, J. M.; Lapresta-Fernández, A.;
Fernández-Ramos, M. D.; Carvajal, M. A.; Capitán-Vallvey,
L. F.; Rev. Sci. Instrum. 2008, 79, 103105.
10. Gaião, E. D.; Santos, S. R. B.; Santos, V. B.; Nascimento,
E. C. L.; Lima, R. S.; Araujo, M. C. U.; Talanta 2008, 75, 792.
11. Suarez, W. T.; Pessoa-Neto, O. D.; Santos, V. B.; Nogueira,
A. R. A.; Faria, R. C.; Fatibello-Filho, O.; Puyol, M.; Chamarro,
J. A.; Anal. Bioanal. Chem. 2010, 398, 1525.
12. Ródenas-Torralba, E.; Morales-Rubio, A.; Lavorante, A. F.;
Reis, B. F.; de la Guardia, M.; Talanta 2007, 73, 742.
13. Garcia, A.; Perez, M. A.; Ortega, G. J. G.; Dizy, J. T.; IEEE
Trans. Instrum. Meas. 2007, 56, 907.
14. Postolache, O. A.; Girao, P. M. B. S.; Perreira, J. M. D.; Ramos,
H. M. G.; IEEE Sens. J. 2007, 7, 677
15. Omar, A. F. B.; MatJafri, M. Z. B.; Sensors 2009, 9, 8311.
16. Cantrell, K. M.; Ingle, J. D.; Anal. Chem. 2003, 75, 27.
17. Santos, V. B.; Guerreiro, T. B.; Suarez, W. T.; Faria, R. C.;
Fatibello-Filho, O.; J. Braz. Chem. Soc. 2011, 22, 726.
18. Kabasakal, L.; Sehirli, A. O.; Cetinel, S.; Cikler, E.; Gedik, N.;
Sener, G.; Life Sci. 2004, 75, 2329.
19. Ogwu, V.; Cohen, G.; Free Radical Biol. Med. 1998, 25, 362.
20. Huang, X. J.; Kok, W. T.; J. Liq. Chromatogr. 1991, 14, 2207.
21. Oe, T.; Ohyagi, T.; Naganuma, A.; J. Chromatogr., B: Anal.
Technol. Biomed. Life Sci. 1998, 708, 285.
22. Toussaint, B.; Ceccato, A.; Hubert, P.; Graeve, J.; Pauw, E.;
Crommen, J.; J. Chromatogr., A 1998, 819, 161.
23. Toussaint, B.; Pitti, C.; Streel, B.; Ceccato, A.; Hubert, P.;
Crommen, J.; J. Chromatogr., A 2000, 896, 191.
24. Koike, H.; Iijima, M.; Mori, K.; Hattori, N.; Ito, H.; Hirayama,
M.; Sobue, G.; Nutrition 2004, 20, 961.
25. Aboul-Kasim, E.; J. Pharm. Biomed. Anal. 2000, 22, 1047.
26. Association of Official Analytical Chemists; Official Methods
of Analysis of AOAC; AOAC International: Arlington, 1984.
27. British Pharmacopoeia; Her Majesty’s Stationery Office:
London, 1958.
28. Lingane, J. J.; Davies, O. L.; J. Biol. Chem. 1941, 137, 567.
29. Campiglio, A.; Analyst 1994, 119, 2209.
30. Vidovic, S.; Stojanovic, B.; Veljkovic, J.; Prazic-Arsic, L.;
Roglic, G.; Manojlovic, D.; J. Chromatogr., A 2008, 1202, 155.
31. Okamoto, H.; Nakajima, T.; Ito, Y.; J. Chromatogr., A 2003,
986, 153.
32. Lopez-Flores, J.; Cordova, M. L. F. D.; Molina-Diaz, A.; Anal.
Chim. Acta 2005, 535, 161.
33. Rocha, F. R. P.; Fatibello-Filho, O.; Reis, B. F.; Talanta 2003,
59, 191.
34. http://www.alldatasheet.com/datasheet-pdf/pdf/203057/TAOS/
TSLB257.html accessed in January 2011.
35. http://pdf1.alldatasheet.com/datasheet-pdf/view/203027/TAOS/
TSL260R-LF.html accessed in January 2011.
36. http://ww1.microchip.com/downloads/en/DeviceDoc/39632e.
pdf accessed in January 2011.
37. Janegitz, B. C.; Suarez, W. T.; Fatibello-Filho, O.; Marcolino-Jr.,
L. H.; Anal. Lett. 2008, 41, 3264.
38. Costa-Neto, C. O.; Pereira, A.; Aniceto, C.; Fatibello-Filho, O.;
Talanta 1999, 48, 659.
39. Jiang, X. Y.; Chen, X. Q.; Xu, M.; J. Food Drug Anal. 2007,
15, 178.
40. Shaw, D. J.; Introduction to Colloid and Surface Chemistry,
4th ed.; Butterworth-Heinemann: Oxford, 1992.
41. Bagirova, V. L.; Mit’kina, L. I.; Pharm. Chem. J. 2003, 37, 558.
42. Suarez, W. T.; Vieira, H. J.; Fatibello-Filho, O.; J. Braz. Chem.
Soc. 2007, 18, 1028.
43. Xing, J.; Wang, F.; Zou, J.; Chen, X.; J. Nanosci. Nanotechnol.
2010, 10, 5783.
44. Li, Y.; Wang, P.; Wang, X.; Cao, M.; Xia, Y.; Cao, C.; Liu, M.;
Zhu, C.; Microchim. Acta 2010, 169, 65.
45. Kaszuba, M.; Corbett, J.; Watson, F. M.; Jones, A.; Phil. Trans.
R. Soc. A 2010, 368, 4439.
46. Berne, B. J.; Pecora, R.; Dynamic Light Scattering: with
Applications to Chemistry, Biology and Physics; Dover
Publications: New York, 2000.
Submitted: February 14, 2011
Published online: August 18, 2011
FAPESP has sponsored the publication of this article.

Supplementary Information SIJ. Braz. Chem. Soc., Vol. 22, No. 10, S1-S2, 2011.Printed in Brazil - ©2011 Sociedade Brasileira de Química
0103 - 5053 $6.00+0.00
*e-mail: [email protected]
Evaluation of Turbidimetric and Nephelometric Techniques for Analytical Determination of N-Acetylcysteine and Thiamine in Pharmaceutical Formulations Employing a
Lab-Made Portable Microcontrolled Turbidimeter and Nephelometer
Vagner B. dos Santos,a Thiago B. Guerreiro,a Willian T. Suarez,b Ronaldo C. Fariaa and Orlando Fatibello-Filho*,a
aDepartamento de Química, Universidade Federal de São Carlos, Centro de Ciências Exatas e de Tecnologia, CP 676, 13560-970 São Carlos-SP, Brazil
bDepartamento de Química, Universidade Federal de Viçosa, Centro de Ciências Exatas e Tecnológicas, 36570-000 Viçosa-MG, Brazil
Figure S1. Evaluation of the stability of PMTN. Monitoring performed for a period of 6 h on three different days. Only nephelometric data in mV are shown (465 nm).
Evaluation of Turbidimetric and Nephelometric Techniques J. Braz. Chem. Soc.S2
Figure S2. Analytical curves for N-acetylcysteine in the (a) turbidimetric and (b) nephelometric analyses. Analytical curves for thiamine with (c) turbidimetric and (d) nephelometric detections. All the measurements were performed at 465 nm.