Embed Size (px)
Citation preview

K-1860
APPLICATION OF EDDY CURRENTS TO DETECT
CORROSION IN COPPER AND STAINLESS STEEL TUBING
J. H. Smith
JUNE 1974
'""'
prepared for the U.S. ATOMIC ENERGY COMMISSION
under U.S, GOVERNMENT Contract w.7405 eng 26
DISTRIBUTION OF THIS DOCUMENT IS UNLIMITED.

DISCLAIMER
This report was prepared as an account of work sponsored by an agency of the United States Government. Neither the United States Government nor any agency Thereof, nor any of their employees, makes any warranty, express or implied, or assumes any legal liability or responsibility for the accuracy, completeness, or usefulness of any information, apparatus, product, or process disclosed, or represents that its use would not infringe privately owned rights. Reference herein to any specific commercial product, process, or service by trade name, trademark, manufacturer, or otherwise does not necessarily constitute or imply its endorsement, recommendation, or favoring by the United States Government or any agency thereof. The views and opinions of authors expressed herein do not necessarily state or reflect those of the United States Government or any agency thereof.

DISCLAIMER
Portions of this document may be illegible in electronic image products. Images are produced from the best available original document.

Printed in the United States of America. Available from
National Technical Information Service
U.S. Department of Commerce
5285 Port Royal Road, Springfield, Virginia 22151
Price: Printed Copy $5.45; Microfiche $1 .45
This report was prepared as an account of work sponsored by the United
States Government. Neither the United States nor the United States Atomic Energy Commission , nor any of their employees, nor any of their contractors,
subcontractors, or their employees, makes any warranty, express or implied, or
assumes any legal liability or responsibility for the accuracy, completeness or
usefulness of any information, apparatus, product or process disclosed, or
represents that its use would not infringe privately owned rights .

Date of Issue: June 1974 Report Number: K-1860
Subject Category: UC-25, Materials
APPLICATION OF EDDY CURRENTS TO DETECT CORROSION IN COPPER AND STAINLESS STEEL TUBING
J. H. Smith
Physical Measurements Department Laboratory Division
1-i ,--------N 0 TIC E---------., 1 This report was prepared as an account of work
sponsored by the United States Government. Neither the United States nor the United States Atomic Energy · 1
·Commission, nor any of their employees, nor any of 1 their contractors, subcontractors, or their employees, makes any warranty, express or implied, or assumes any legal liability or responsibilitY for the accuracy, co:m~ pleteness or usefulness of a.nY information, apparatus, product or process disclosed, or represents that its use would not infringe privately owned rights.
Oak Ridge Gaseous Diffusion Plant Union Carbide Corporation
Oak Ridge, Tennessee
Prepared for the U. S. Atomic Energy Commission 1mder U. S, Government Contract W-7405 eng 26
II»STRIBUTIQN QE ti:!JS O"OCUMEI\lT. !S ~

THIS PAGE
WAS INTENTIONALLY .-..
LEFT BLANK

ABSTRACT
The ability of an eddy-current test to detect and evaluate corrosion in heat exchanger tubing is investigated in this report. Two types of tubing are considered; a finned copper tubing us.ed in a water-cooled Freon condenser and a straight-wall cylindrical stainless steel tubing used in a Freon...:Freon heat exchanger. The resolution and s_ensi tivity of these tests are determined and the testing techniques, instrumentation, and theory of the test are discussed. A relationship is shown between the eddy-current indications obtained from drilled through holes and indications obtained from actual corrosion pits.

THIS PAGE
WAS INTENTIONALLY
LEFT BLANK

5
CO~TENTG
INTRODUCTION
SUMMARY AND CONCLUSIONS
DISCUSSION OF EDDY CURRENTS General Theory . . . . . Parameters Affecting Eddy-Current Tests Eddy-Current Testing of Heat Exchanger Tubing
INSTRUMENTATION AND OPERATING PROCEDURES Probolog Test Procedure Data Analysis .
INSPECTION OF COPPER TUBING Description of Tubing . . Evaluation of Deposited Scale Evaluation of Resolution and Sensitivity Metallographic Correlation
INSPECTION OF STAINLESS STEEL TUBING
ACKNOWLEDGMENTS
REFERENCES . . .
9
9
10 10 12 13
15 15 15 17
20 20 20 22 34
44
50
51
THIS PAGE
WAS INTENTIONALLY
· LEFT BLANK

Figure
l
2
3
4
5
6
7
8
9
10
ll
12
13
14
15
16
17
18
19
20
21
22
7
LIST OF FIGURES
Title
Illustrations of Eddy-Current Theory
Illustrations of Phase-Sens·i ti ve Oscilloscope Presentation for Internal Probe
Test Setup for Eddy-Current Inspection of Tubing
Typical Indications from Eddy-Current Inspection of Copp~r Tubing
Scale Accumulation on Inner Diameter of Copper Tube
Eddy-Current Indications Before and After Cleaning of Tube
Copper Tubing Test Sample Sl
Radiograph of Eddy-Current Probe
Copper Tubing Test Sample S2
Copper Tubing Test Sample S3
Copper Tubing Test Sample s4
Copper Tubing Test Sample S5
·copper Tubing Test Sample s6
Corroded Through Hole in Copper Tubing
Typical Corrosion Pattern Found in Copper 'l'ubing
Sequence of Cross Sections of Corrosion Pit
Indication Amplitude Vs. Depth of Corrosion Pits
Corrosion Pit 1
Corrosion Pit 2
Corrosion Pit 3
Corrosion Pit 4
Corrosion Pit 5
11
16
18
19
21.
23
24
26
27
28
30
31
32
33
35
36
38
39
4o
41
42
43
TER

Figure
23
24
25
26
8
LIST OF FIGURES, Continued
Title
Indications from Eddy-Current Inspection of Stainless Steel Tubing
Corroded Through Hole in Stainless Steel Tubing
Corroded Pit in Stainless Steel Tubing
Typical Eddy-Current Corrosion Data
46
47
48

9
APPLICATION OF EDDY CURRENTS TO DETECT CORROSION IN COPPER AND STAINLESS STEEL TUBING
INTRODUCTION
Corrosion is an ever-present. problem associated with heat exchanger tubing. Many steps can be taken to'reduce or retard corrosion but it still occurs
. ' and periodic checks are required to determine not only the presence of cor-rosion, but also to determine the extent to which corrosion has affected critical areas. Conventional eddy-current tests have been used for many years to evaluate corrosion in heat exchanger tubing. Referencesl-3 are available that. describe the testing procedures and techniques to be used, and the types of indications that can be expected for various corroded conditions. Very little reference data could be found that show. the relationship between the amplitude of the eddy-current indication and the depth of a corrosion pit, or the relationship between eddy-current indications for drilled through holes and for actual corrosion pits. It is also difficult to find information that specifically defines the limits of sensitivity and resolution for a particular test instrument.
An acceptable technique for determining the extent of the corrosion found in tubing is to compare the test data with the indications obtained from holes drilled through the tube wall. Proper application of this method requires some knowledge about eddy currents, about the behavior of corrosion in the tubing being examined, and how the eddy-current indications from actual corrosion pits compare with indications from drilled holes in the
. same type tubing. Such a correlation requires metallographic sampling, and the results can vary with different types of tubing and with different test equipment.
The purpose of this investigation was to study the capability of eddycurrent techniques to detect and evaluate corrosion in heat exchanger tubing, and to determine the sensitivity and resolution of the test for two specific applications. A correlation is made between the amplitudes of the eddycurrent indications and the depth of the corresponding corrosion pits. The indications are then compared with those obtained from drilled through holes in the same type tubing.
SUMMARY AND CONCLUSIONS
If properly applied, an eddy-current test can be used effectively to detect corrosion in heat exchanger tubing, and the results can be used to determine the severity of the corrosion and the condition of the tubing. The amplitude of the eddy-current indication is generally proportional to the depth of the relative corrosion pit. The eddy-current response to a 1/8-in.dia hole drilled through the tube wall thickness appears to be representative
10
of a corroded through hole for the two examples studied.in this report. The volume and orientation of a 1/32-in.-dia through hole appears to be near the limit of the sensitivity of the eddy-current test for the two examples studied in this report. Two factors, that can be controlled to optimize the sensitivity and resolution of an eddy-current .corrosion test in tubing, are the probe design and the operating frequency. Differentialtype eddy-current probes can be used to cancel the effects of certain artifacts, such as external fins on tubing, without a loss of test sensitivity.
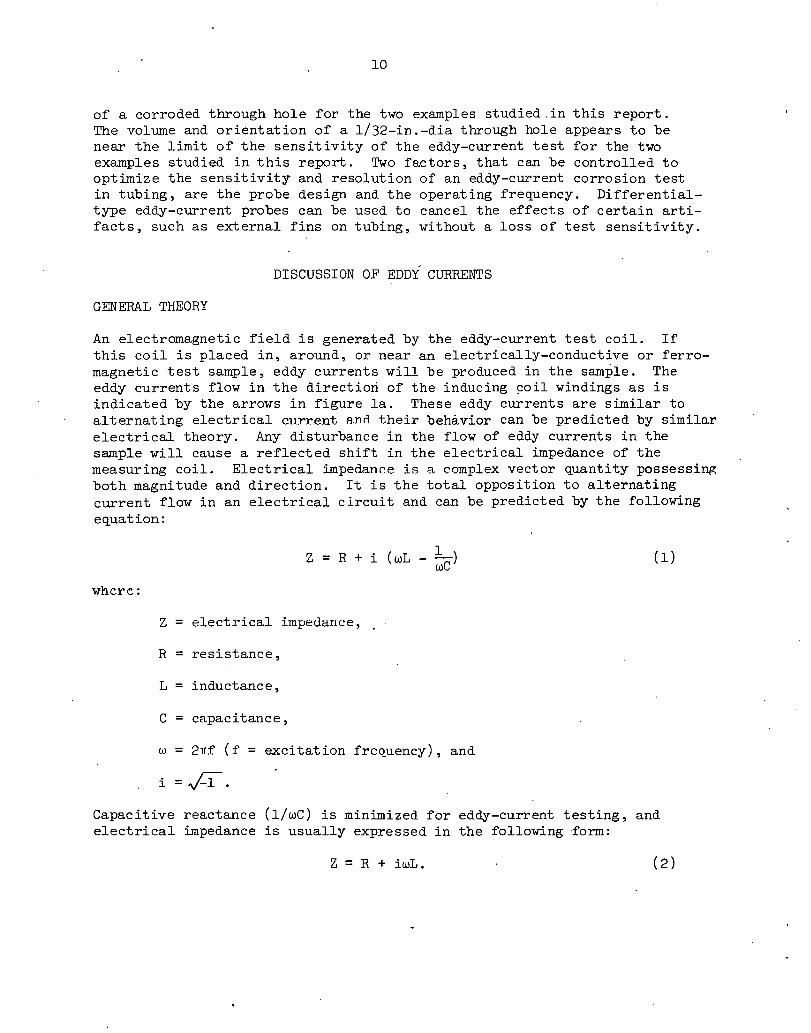
DISCUSSION OF EDDY CURRENTS
GENERAL THEORY
An electromagnetic field is generated by the eddy-current test coil. If this coil is placed in, around, or near an electrically-conductive or ferromagnetic test sample, eddy currents will be produced in the sample. The eddy currents flow in the direction of the inducing ~oil windings as is indicated by the arrows in figure la. These eddy currents are similar to alternating electrical current and their behavior can be predicted by similar electrical theory. Any disturbance in the flow of eddy currents in the sample will cause a reflected shift in the electrical impedance of the measuring coil. Electrical impedance is a complex vector quantity possessing both magnitude and direction. It is the total opposition to alternating current flow in an electrical circuit and can be predicted by the following equation:
where:
z = R + i (wL - L) we
Z = electrical impeua.nce,
R = resistance,
L = inductance,
C = capacitance,
w = 2Tif (f =excitation frequency), and
i=J-1.
(1)
Capacitive reactance (1/wC) is minimized for eddy-current testing, and electrical impedance is usually expressed in the following ·form:
Z = R + iwL. (2)

(a) Eddy-Current Flow
(c) Voltage Relationship
Figure 1
~ X <(
>-co: '<(
z 0 <(
~
L
(b) Electrical Diagram
21Tf L
REAL AXIS
(d) Vector Impedance Diagram
ILLUSTRATIONS OF EDDY-CURRENT THEORY
1--' 1--'

12
Figure lb represents a coil with a de resistance (R) and an inductance (L). The magnitude and phase relations between the voltage across the resistor, VR, and the voltage across the inductance, VL, are shown in figure lc. In a purely inductive circuit, the voltage can lead the current by a phase angle of 90°. Most applied circuits are not purely inductive; therefore, the phase angle will generally be less than 90°. The phase_angle ($) can be mathematically expressed as follows:
$ · = tan-1 (~1 ). (3)
The magnitude of the electrical impedance is as follows:
(4)
Equations 3 and 4 can be obtained from the impedance diagram shown in figure ld. Inductive reactance (wL) is plotted along the imaginary (vertical) axis and resistance is plotted along the real (horizontal) axis.
Eddy-current signals are produced when the eddy-current flow in the sample is disturbed sufficiently to reflect a significant change in the magnitude or phase angle of the receiving coil's electrical impedance. Eddy-current instruments are designed to measure either one or both of these variables.
PARAMETERS AFFECTING .EDDY-CURRENT TESTS
Some of the parameters that can affect eddy-current flow are the electrical conductivity and magnetic permeability of the material being tested, the shape and thickness of the sample, the lift-off or fill-factor,* the excitation frequency of the coil (operating frequency), and the size, shape, and orientation of the eddy-current coil(s). Temperature can affect eddy currents since it can affect the electrical properties of the coil, test instrument, and the material being measured. Material discontinuities in the test sample such as cracks, pits, and porosity can disturb eddy-current flow. External materials that are close enough to the test sample to affect the electromagnetic field produced by the coil can also cause indications on the eddy-current instrument. Examples of this are the baffles or support plates.found in heat exchangers. Foreign materials in or near the test sample can also affect eddy currents. An example of this is the scale that is frequently deposited on the inside surface of heat exchanger tubes, provided the scale is conductive or ferromagnetic.
There are obviously a large number of parameters that can affect the results of eddy-current tests; therefore, a primary objective for obtaining accuracy and good sensitivity from an eddy-current test is to maximize the effect on the output data of the parameter being measured, and minimize the effects of all other variables. Fortunately, many of the variables
*Gap between the eddy-current coil and the test sample.

13
will become virtualJv constant for a given test. For example, one can consider a test on heat exchanger tubing: The tubes generally have a uniform size and shape, electrical conductivity, magnetic permeability, and wall thickness. The effects of slight manufacturing variations in these properties can be reduced by certain testing techniques, such as using differential test coils. Techniques are also av~ilable for reducing or accounting for the effects of baffle plates in heat exchangers and the deposited scale found in the tubing. Other variables, such as temperature, can usually be controlled or accounted for.
Parameters that can usually be optimized to obtain maximum sensitivity from an eddy-current test are the size, ·shape, and geometry of the test coil(s) and the operating frequency of the test instrument. Techniques for optimizing these parameters can be found in references 4 and 5.
EDDY-CURRENT TESTING OF HEAT EXCHANGER TUBING
A test to detect corrosion in tubing generally involves a single operating frequency and utilizes an internal probe which is moved through the tubes during inspection. The probe normally consists of two coils that are connected to adjacent legs of a bridge circuit. The output signal from the bridge circuit is the electrical difference between the signals from the two coils. This arrangement allows the two coils to compare the material properties of adjacent sections of the tube being inspected.
Advantages of using a differential eddy-current probe to inspect tubing are that the effects o~ slow varyingchanges, such as the electrical conductivity, the nominal thickness of the tubing, and the fill factor, will be reduced, and their effect on the output data will be minimized. A differential probe can also cancel the effects of external fins on a tube provided that the fins are uniformly spaced, that they occur continuously along the length of the tube, and that the separation between the two coils is greater than the separation between the fins.
The action of the differential coil arrangement is such that one coil produces a positive signal and the other coiJ. produces a negative signal as the probe moves past a defect. The resultant output signal will have the shape of a single period of a sine curve. The shape of the coils and the spacing between the coils in a differential probe can affect the output signal(s) produced by defects. For example, if two defects in a tube are separated by a distance which is smaller than the distance between the two coils, the resulting output signal will be the electrical average of the two signals produced by the two defects. This averaging effect can cause the output signals to be other than sine wave in shape.
The internal probe should fit snugly inside the tub~, but must be loose enough to easily pass through the tube. Scale buildup on the inside surface of the tube can cause problems in this area. Heat exchanger tubes that contain a liquid will usually have a scale buildup on their inside surface. The rate of scale buildup can be controlled by filtration
14
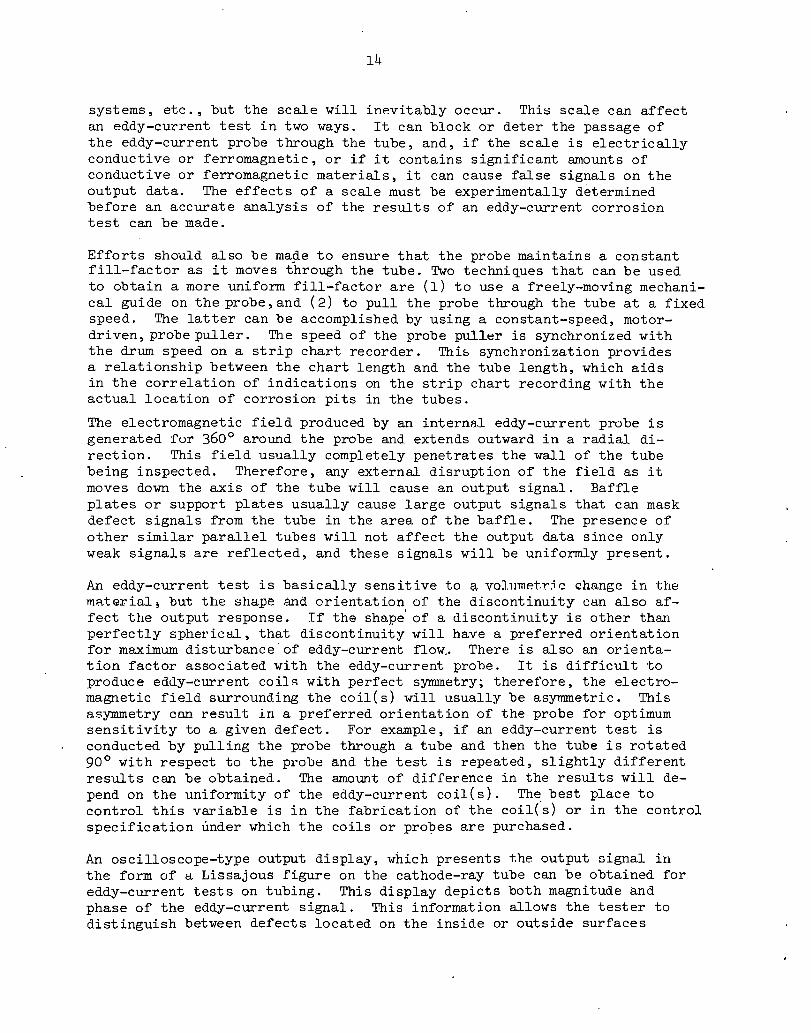
systems, etc., but the scale will im~vitably occur. Thi~ scale can affect an eddy-current test in two ways. It can block or deter the passage of the eddy-current probe through the tube, and, if the scale is electrically conductive or ferromagnetic, or if it contains significant amounts of conductive or ferromagnetic materials, it can cause false signals on the output data. The effects of a scale must be experimentally determined before an accurate analysis of the results of an eddy-current corrosion test can be made.
Efforts should also be ma~e to ensure that the probe maintains a constant fill-factor as it moves through the tube. Two techniques that can be used to obtain a more uniform fill-factor are (l) to use a freely-moving mechanical guide on the probe, and (2) to pull the probe through the tube at a fixed speed. The latter can be accomplished by using a constant-speed, motordriven, probe puller. The speed of the probe puller is synchronized with the drum speed on a strip chart recorder. This synchronization provides a relationship between the chart length and the tube length, which aids in the correlation of indications on the strip chart recording with the actual location of corrosion pits in the tubes.
The electromagnetic field produced by an internal eddy-current probe is generated for 360° around the probe and extends outward in a radial direction. This field usually completely penetrates the wall of the tube being inspected. Therefore, any external disruption of the field as it moves down the axis of the tube will cause an output signal. Baffle plates or support plates usually cause large output signals that can mask defect signals from the tube in the area of the baffle. The presence of other similar parallel tubes will not affect the output data since only weak signals are reflected, and these signals will be uniformly present.
An eddy-current test is basically sensitive to ~ volumetric change in the m::\terial; but the shape and orientation of the discontinuity can also affect the output response. If the shape' of a discontinuity is other than perfectly spherical, that discontinuity will have a preferred orientation for maximum disturbance· of eddy-current flow.. There is also an orientation factor associated with the eddy-current probe. It is difficult to produce eddy-current coils with perfect syoonetry; therefore, the electromagnetic field surrounding the coil(s) will usually be asymmetric. This asymmetry can result ln a preferred orientation of the probe for optimum sensitivity to a given defect. For example, if an eddy-current test is conducted by pulling the probe through a tube and then the tube is rotated 90° with respect to the probe and the test is repeated, slightly different results can be obtained. The amount of difference in the results will depend on the uniformity of the eddy-current coil(s). Th~ best place to control this variable is in the fabrication of the coil(s) or in the control specification under which the coils or pro~es are purchased.
An oscilloscope-type output display, which presents the output nignal in the form of a Lissajous figure on the cathode-ray tube can be obtained for eddy-current tests on tubing. This display depicts both magnitude and phase of the eddy-current signal. This information allows the tester to distinguish between defects located on the inside or outside surfaces

15
of the tubes which is helpful for locating defects around baffle plates. The type of signals that can be expected for a defect of the same size and shape located at different ·depths in the tube wall and using an internal eddy-current probe are illustrated in figure 2. A display of this type was not used in this investigation.
INSTRUMENTATION AND OPERATING PROCEDURES
PROBOLOG
A Model E Probolog* was used in this study, primarily because of its availability. This is a bridge-type eddy-current test instrument that was designed specifically to detect corrosion in nonmagnetic heat exchanger tubing. The instrument operates on the same basic principle as most tubing testers; therefore, the results of this study should be fairly comprehensive.
The instrument utilizes 'an internal differential-type probe which contains two coils that are connected to adjacent legs of a Wheatstone bridge. The output data are presented on a strip chart recorder. A two-speed probe puller is available which is synchronized with the recorder to provide a correlation such that 1 in. of chart length is equivalent to either 1 ft or 2 ft of tube length.
This particular instrument has a single fixed operating frequency of 1000 Hz. More versatile instruments, including newer models of the Probolog, offer a selection of test frequencies. This is a desirable feature, since an optimum operating frequency should be chosen for each particular test. The major variables that determine the optimum frequency for maximum sensitivity for a given eddy-current test are the size of the eddy-current coil, the fill-factor, the type material being inspected, and the thickness of the material being tested. A theoretical determination of the optimum operating frequency can be made using information available in reference 1. Fortunately, the optimum·operating frequency for the combinations of tubing material, tubing thickness, and type coils used in this study was approximately 1000 Hz.
The operation of the instrument is su.ch that an impedance change is required to initiate an output signal. The output signal is then proportional to the amplitude of the electrical impedance change in the eddy-current coils. The instrument can detect holes, cracks, corrosion pits, and variations in the tube wall thickness.
TEST PROCEDURE
The test procedure requires four steps: (1) calibrate the instrument, (2) perform the test, (3) recheck the instrument's calibration, and (4) analyze the data. It is necessary to adjust four controls to calibrate the Probolog. The selectar·switch is set on one of four fixed positions which best corresponds to the conductivity of the material being tested.
*Brand names mentioned in this report are intended to be descriptive, not limiting. Another brand of comparable characteristics could perform equally well.

16
(a) Defect on OD of Tube Wa II
(b) Defect Midway Through Tube Wall
{c) Defect on ID of Tube Wall
Figure 2
ILLUSTRATIONS OF PHASE-SENSITIVE OSCJLLOS_COPE PRESENTATION FOR INTERNAL PROBE

17
The range control is then set at a nominal value for the material being tested. The exact range setting for a given test must be determined experimentally, using a tubing standard. The range control is basically a sensitivity control; it selects the amount of the received signal that is fed through the instrument amplifier to the output recorder. The zero control centers the pen on the recorder chart, and the balance control balances or nulls the Wheatstone bridge circuit containing the two eddycurrent coils. The electrical design of the instrument is such that the two controls (zero and balance) interact and both affect the output signal; therefore, they must be adjusted simultaneously. The method is to place the test probe inside a defect-free tube of the same thickness, type material, and configuration as the tubing being tested, and then adjust the zero and balance controls to center the recorder pen on the chart paper and provide zero output signal to the recorder.
Actual testing is performed by manually pushing the eddy-current probe and cable down a tube to the desired length. The probe is then retracted at a constant speed, using the probe puller while the instrument records the indications of the material discontinuities that are sensed by the eddycurrent probe. The maximum length of tubing that can be tested will depend on the material being tested, the test instrument, the test coil, and the length of cable connected to the coil. The maximum length of tubing inspected in this experiment was 20 ft. A typical experimental test setup is shown in figure 3. A recheck of the instrument's calibration should be made periodically during testing to ensure that no instrument drift or other problems have occurred.
DATA ANALYSIS
The output of the Probolog is presented in the form of a strip chart recording. An accurate analysis of the output data requires an understanding of the theory of the test and the associated instrumentation. Four examples of typical eddy-current data obtained from the finned copper tubing are shown in figure 4. The eddy- current response obtained from a new tube is shown in figure 4a. The signals caused by the baffle plates are quite large, compared to typical corrosion indications. The eddy-current response to three different diameter holes drilled through the tube wall is shown in figure 4b. The differential coil arrangement causes the output response to be a sine wave-shaped signal for a single defect. The inertia of the recorder pen causes a small tail on the ends of the signals obtained from the larger holes. Typical eddy-current response obtained from short lengths of corroded copper tubing taken out of actual service is shown in figures 4c and 4d. Some of the indications are distorted and are not sine-shaped. This distortion is probably caused by the averaging process of the two differential coils. The indication obtained from the corroded through hole in figure 4c has approximately the same amplitude as the indication for the 1/8-in.-dia drilled through hole in figure 4b. An example of two levels of corrosion in a single tube is shown in figure 4d. That portion of the tube in the left side of the figure shows only moderate corrosion, but the portion on the right shows extensive corrosion. Several indications are obtained from corrosion pits that could extend through the tube wall thickness.

TEST SAMPLE
~
=igure 3
TEST SETUP FOR EDDY-CURRENT INSPECTION OF TUBING

19
BAFFLE
--- ---------- -------
(a) New Tube
(b) Holes Drilled in New Tube
{c) Corroded Tube
SEVERE CORROSION (d) Corroded Tube
All dimensions expressed in inches.
Figure 4
TYPICAL INDICATIONS FROM EDDY-CURRENT INSPECTION OF COPPER TUBING

. 20
Other types of eddy-current indications can be obtained from tubing. For example, tube wall thinning is indicated by a shift in the level of the output signal on the strip chart recorder. An example of the output signal obtained from a tube where the wall thickness varied by 12% (5 mils) is shown in figure ll later in this report. Areas of higher electrical conductivity inside the tubing can also be detected with an eddy-current test. This type of indication will occur in low conductivity tubing, such as stainless steel, where a higher conductivity material is deposited in a pit or crack on the inside surface. A high conductivity area will be indicated by a sine-shaped signal on the output recorder that is shifted 180° with respect to the sine-shaped signal that is normally obtained from a pit or crack. No indications of this type were detected in this study.
INSPECTION OF COPPER TUBING
DESCRIPTION OF TUBING
Copper tubes from Freon coolant condensers at the Oak Ridge Gaseous Diffusion Plant (ORGDP) are routinely inspected, using eddy-current techniques. These tubes have an inside diameter of 0.541. in. and a wall thickness of approximately 0.042 in. They also have external fins. The outside diameter of the finned tube is about 3/4 in., and the depth of the fins are approximately l/16 in. A single tube will vary from approximately 30 to 40 ft in length and each tube has a 180° bend at midlength. The curved bend section removed from a typical tube is shown in figure 5. In service, treated recirculated water is forced through the inside of the tube, while the outside tube surface is exposed to Freon gas.
EVALUATION OF DEPOSITED SCALE
Several tubes were examined from Condenser K-902-J. .10 at ORGDP whic:h hR.<'l been in service for several years. The tubes were removed from the heat exchanger, and only the straight lengths of the tubes were examined in this study. The initial investigation of the tubes revealed that a scale deposit approximately 0.050-in. thick had accumulated on the inside walls of the tubes, as shown in figure 5. This scale prevented the insertion of the eddy-current probe into the tubes. An analysis of the scale was made, and it contained corrosion by-products such as copper oxide, copper hydroxylphosphate, and other materials carried in by the treated water. A thin layer of copper oxide wan found below the seale on the ins ide surface of the tubing. Tests were made to determine whether the scale and copper oxide layer hAil any effects on the eddy-current test results. Just enough scale was removed from several lengths of tubing to allow the insertion of the eddycurrent probe. This scale was removed mechanically by running a 3/8-in.-dia brass rod down the tubes similar to cleaning a gun barrel. The tubes were then inspected for corrosion using eddy currents. Following the inspection, the tubes were thorough~y cleaned by running them through a sulfuric acid cleaning solution, followed by a diluted hydrochloric acid

Figure 5
SCALE ACCUMULATION ON INNER DIAMETER OF COPPER TUBE
lX
1\) I-'

22
dip and a water rinse. A subsequent reinspection of the tubes showed no significant difference in the output data. Examples of these data are shown in figure 6. Two independent tests made on the same tube sample at the same test sensitivity prior to cleaning are shown in figures 6a and 6b. Two independent tests made on the same tube at the same test sensitivity following cleaning are shown in figures 6c and 6d. Differences noted in the data obtained following the cleaning operation , are within the limits of variability of the test itself. It was concluded from these tests that the deposited scale, found in the copper tubes from Condenser K-902-1.10, did not significantly affect these eddy-current tests except to impede the travel of the eddy-current probe through the tube.
EVALUATION OF RESOLUTION AND SENSITIVITY
Several lengths of new finned copper tubing were obtained, holes of various diameters were drilled through the wall thickness at several locations, and eddy-current inspections were performed on the samples. These test samples, the associated eddy-current test results, and the conclusions drawn will be discussed in the following paragraphs.
Test Sample Sl, shmm in figure 7a, is approximately 15 in. long and contains twelve 0.0465-in.-dia holes (drilled through the wall thickness) at one end. The first hole was located 11 fins from the end of the tube, and the 12 holes are separated respectively by 1 to ll fins. (A typical tube has 19 fins per linear inch.) The eddy-current test data obtained from the 12 holes are shown in figure 7b. Due to the averaging effect of the differential coil arrangement, only four indications (representing the 12 holes in the tube) are obtained on the output strip chart recording.
Two 0.0465-in.-dia holes were drilled through one wall near the center of Test Sample Sl. These holes are Reparated by l in. Two 0.03125-in.-dia holes were drilled through the tube wall at Lhe other end of the test sample. These holes are separated by 0.5 in. The eddy-current test data obtained from these holes are shown in figure 7c. The indications from the two 0.03125-in.-dia holes are just barely visible, and it is difficult to recognize two distinct signals. A 0.03125-in.-dia through hole appears to be approaching the limit of the instrument's detection sensitivity for the control settings used. (The instrument is basically sensitive to volumetric changes in the material which result in a change in the material's conductivity. The volume of a 0.03125-in.-dia hole drilled through a 0.042-in. wall is approximately 3 x 10- 5 c11 in .) A hie;her instrument gain will produce a larger indication for the 0.03125-in.-dia hole, but the higher gain will cause more noise and will also saturate larger signals which should remain on scale. The two 0.0465-in.-dia holes separated by l in. are clearly visible in figure 7c, and there are two distinct indications. It can be seen in figure 7c that the linear resolution of the eddy-current probe used in this experiment is approximately l/2 in. Thus, two defects spaced closer together than about l/2 in. will not produce two distinct signals on the instrument's output recorder chart .

23
(a) Before Cleaning
(b) Repeat of (a)
(c) After Cleaning
(d) Repeat of (c)
Figure 6
EDDY-CURRENT INDICATIONS BEFORE AND AFTER CLEANING OF TUBE

(
0.03125 D 0.0465 D
1/2 1
r1 r- 1 C5 C5 C5 0
24
TWELVE 0.0465 D HOLES
NUMBERS INDICATE NO. OF FINS BETWEEN HOLES.
1 11 1 1 o 1 9 1 s 1 1 1 6 15 141312111 11 1
a s cs cs o e o cs o ocscs
1+------------14-3/ 4 --------------1~
(a) Sample
R= 2.0
(b) Indications from Twelve Holes (c) Indications from All Holes
(d) Response for Probe Pulled Slowly by Hand
All dimensions expressed in inches.
Figure 7
COPPER TUBING TEST SAMPLES 1

25
A final test was performed by pulling the probe very slowly through the tube by hand. These data are shown in figure 7d. Still only four indications are obtained for the 12 holes. The speed of the test does not appear to affect linear resolution. The instrument's resolution is mainly a function of the test frequency and the size, shape, and spacing of the two coils in the test probe. The four signals representing the 12 holes then are the result of the averaging effects and the resolution of the two differential coils.
The internal construction of the eddy-current test probe used in this report is shown in figure 8, which is a positive print made from a radiographic negative. The two eddy-current coils are identified, and the spacing between their centerlines is approximately 0.4 in. The instrument's resolution to closely-spaced pits is determined largely by this spacing between the two coils.
Test Sample S2, shown in figure 9a, is a 13-in. length of new tubing that has four holes drilled through the wall thickness. The diameters of the holes are l/32, l/16, 3/32, and l/8 in. There is a 2-in. separation between holes and the separations from the ends of the tube are 3 and 4 in. The output recorder scans for Probolog tests on this tube at three different range, or sensitivity, settings are shown in figure 9b. At the normal range setting of 2.0, the l/32-in. hole is barely visible. The magnitudes of the indications from the other holes vary correspondingly with their diameters: and the indication from the l/8-in.-hole just saturates the recorder output. At a range setting of 3.0, the 3/32- and l/8-in.-dia holes both saturate the recorder. At the higher range setting of 4.0 where the indication from the l/32-in. hole is easily visible, the other three indications are saturated. Experimental data have shown that a corroded through hole in these tubes will produce an output indication which has a magnitude comparable with the indications from a l/8-in.-dia through hole. It is desirable to have the amplitude of this signal just below saturation during a test; therefore, a range setting of 2.0 was chosen for the copper condenser tube inspections.
Test Sample S3, shown in figure lOa, is a 15-in. length of new tubing. Two l/16-in.-dia holes were drilled through one tube wall. In order to show the averaging effects of the differential coils on the fins, a 90° section of one fin was removed with a file. The results of the eddy-current test on this sample are shown at two sensitivities in figure lOb. The partiallyremoved fin causes a significant output indication. Also, the spacing of the partially-removed fin and the two holes provides additional information about the linear resolution of this instrument.
One of the l/16-in.-dia holes was filled with soft solder which has an electrical conductivity of approximately 10% International Annealed Copper Standard (IACS). This was done to study the effects of the scale that o~cupies the corroded areas, and to determine whether the same indication is obtained on the eddy-current instrument for a void in the copper tubing as for an equivalent volume filled with the deposited scale (assuming the scale is conductive or ferromagnetic). The results can be seen in figure lOc at two dif'f'P.rP.nt range settings. There is no significant difference between the two signals. Apparently the volume of solder added was not large enough to be detected as a conductivity change with the sensitivity used in this experiment.

26
I ..
I
Figure 8
RADIOGRAPH OF EDDY-CURRENT PROBE
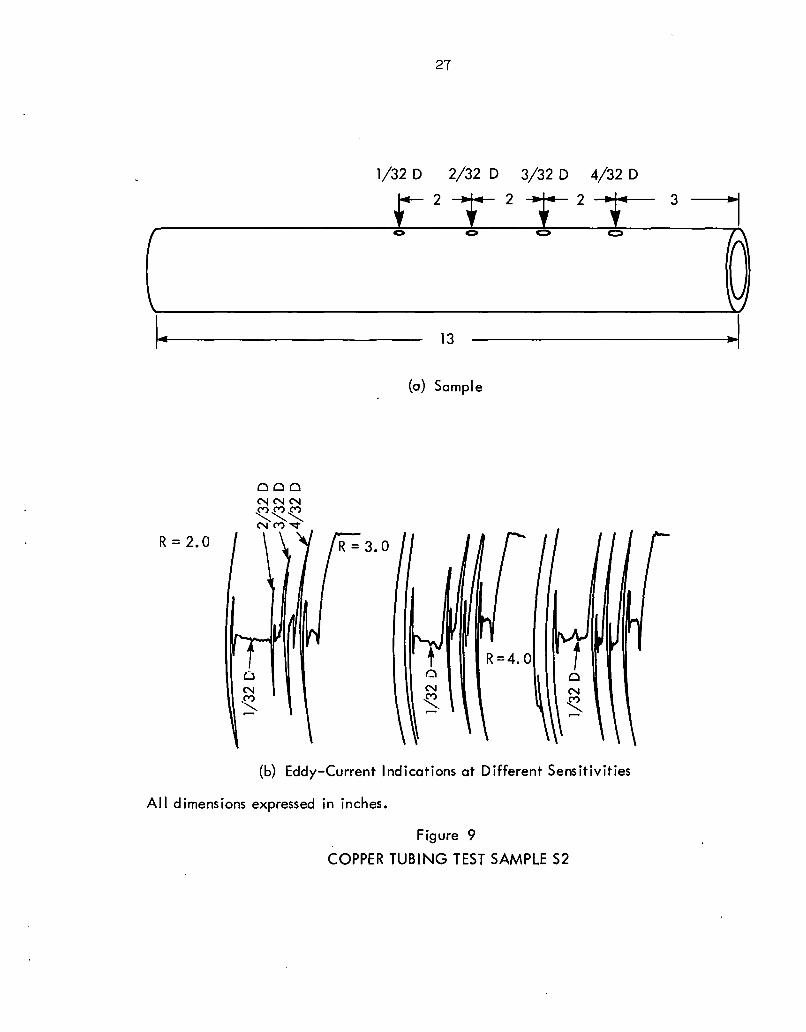
27
1/32 D 2/32 D 3/32 D 4/32 D
3
13
(a) Sample
R = 2.0
R=4. 0
(b) Eddy-Current Indications at Different Sensitivities
All dimensions expressed in inches.
Figure 9
COPPER TUBING TEST SAMPLE 52

28
1/16 D l/16 D SHAVED
FIN FILLED WITH \.14--- 3_1/2 SOLDER 'Jif 3
I c::::r c:>
\ I I
R = 2.0
R = 2.0
a Lll 0::: I.I.J
a~~ oo 0 Vl :r: ::r: ·z
u.
15
(a) Sample
R = 4.0
(b) Eddy-Current lndicatic;ms
R = 4.0
(c) Solder Added to Outside Hole
All dimensions expressed in inches.
Figure 10
COPPER TUBING TEST SAMPLE S3
I

29
Test Sample S4, shown in figure lla, is a 15-in. length of·new tubing that has the fins machined off over a short length of the tube. Two fins were left isolated in the center of the sample, and the tube wall thickness was reduced on one side of the isolated fins. The data in figure llb show the shift of the recorder pen corresponding to a 0.005 in. or 12% variation in tube wall thickness. The data also show that isolated fins cause large output indications. If the fins occur continuously and uniformly down the tube, the output signals will be cancelled by the differential coils. If they occur in isolated groups, output indications will occur. If the spacing between the isolated fins is less than the spacing between the two coils, only one indication will be obtained for the two fins.
Test Sample S5, shown in figure l2a, is a 37-in. length of copper tubing having no fins. The tube had an inside diameter of 0. 500 in., an outside diameter of 0.625 in., and a wall thickness of 0.0625 in. The dimensions are similar to those of the finned copper condenser tubing being evaluated. Two holes (1/32 and l/16-in.-dia) were drilled through one wall of the tube. The data in figure 12b show the results of an eddy-current test on the tube prior to drilling the holes. The indications obtained from an eddy-
.current test on this sample after the holes were drilled are shown in figure 12c for two sensitivities. The results are quite similar to those obtained from the finned tubes. These results show that the cancellation effects of the fins by the differential coils has no significant effect on the sensitivity of the eddy-current test.
Test Sample S6, shown in figure l3a, is a 36-in. length of new finned copper tubing with three holes drilled through one wall. The diameters of the holes are 1/32, 1/16, and l/8 in. The separation between each hole is 6 in. The eddy-current test response obtained from this tube prior to drilling the holes is shown in figure 13b. The eddy-current response to the three holes is shown in figure l3c.
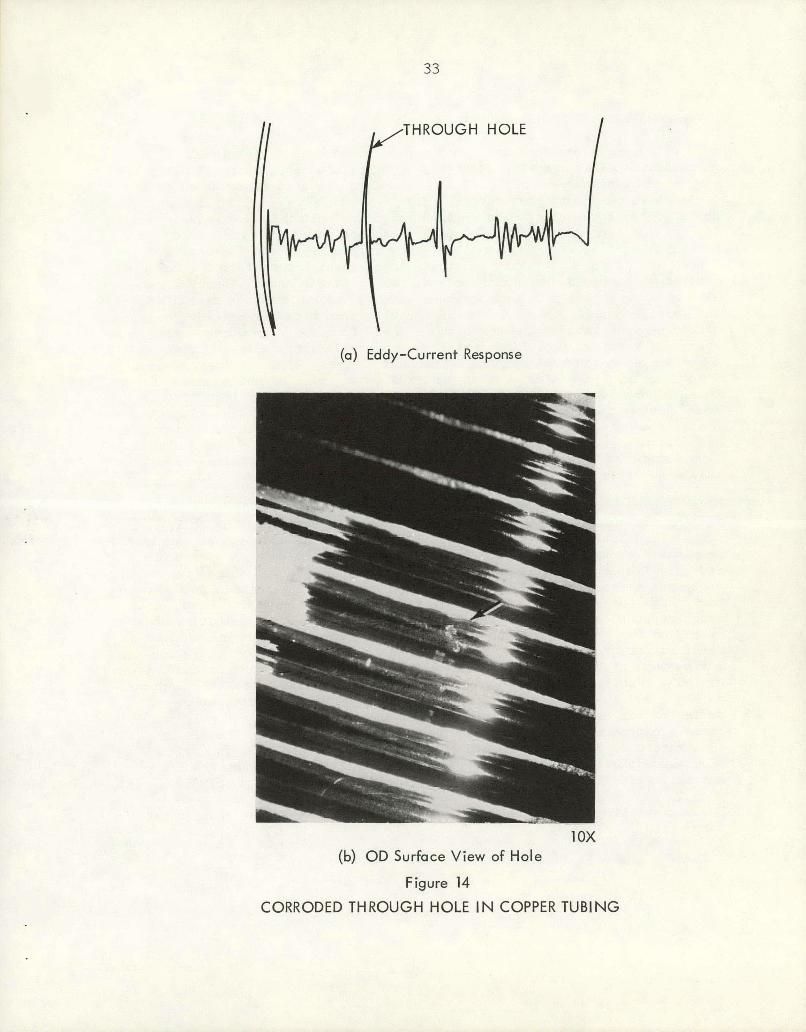
Experimental evidence has shown that an actual corroded through hole will produce an eddy-current indication that has approximately the same amplitude ao the indication obtained f~om a 1/8-in.-dia through hole. An eddycurrent indication that was obtained for a corrosion pit that extends through the wail of the copper tubing is shown in figure l4a. A view of the outside surface of the tube showing the exposed pit is given in figure l4b. Other corroded through holes were found, and in all cases the eddycurrent indications were comparable to the indication from a 1/8-in.-dia drilled through hole. Therefore, for this. particular test, it appears that a l/8-in.-dia through hole w:i.ll cHsrupt the flow of eddy currents in a manner similar to a corroded through hole. Test Sample S6 (figure 13) can then be used as o. calibration st.anciard for the corrosion test. The instrument gain is adjusted so that the indicatio~ f~om the 1/8-in.-dia hole drives the recorder pen deflection to just below saturation. At this gain setting, the instrument's sensitivity should be good enough to detect the 1/32-in.-dia hole. If both of these conditions are met, a wide range of depths of corrosion pitting (from very small .depths to full penetration) can be observed. ,.

0. 625 D
30
0. 615 D
(a) Sample
54
R = 2.0 B = 1. 5 5=4
~ ·SHIFT DUE TO WALL THICKNESS CHANGE
(b) Eddy-Current Indications
All dimensions expressed in inches.
Figure 11
COPPER TUBING TEST SAMPLE 54

31
1/32 D 1/16 D
a-14-l/2 )
~-------------------37----------------------------~
(a} Sample
(b) Before Dri II ing Holes
(c) Response from Holes
All dimensions expressed in inches.
Figure 12
COPPER TUBING TEST SAMPLE 55

32
1/32 D 1/16 D 1/8 D
(a} Sample
(b) Before Drilling Holes
· (c) Response from Holes
All dimensions expressed in inche~.
Figure 13
COPPER TUBING TEST SAMPLE S6
33
THROUGH HOLE
(a) Eddy-Current Response
(b) OD Surface View of Hole
Figure 14
lOX
CORRODED THROUGH HOLE IN COPPER TUBING

34
METALLOGRAPHIC CORRELATION
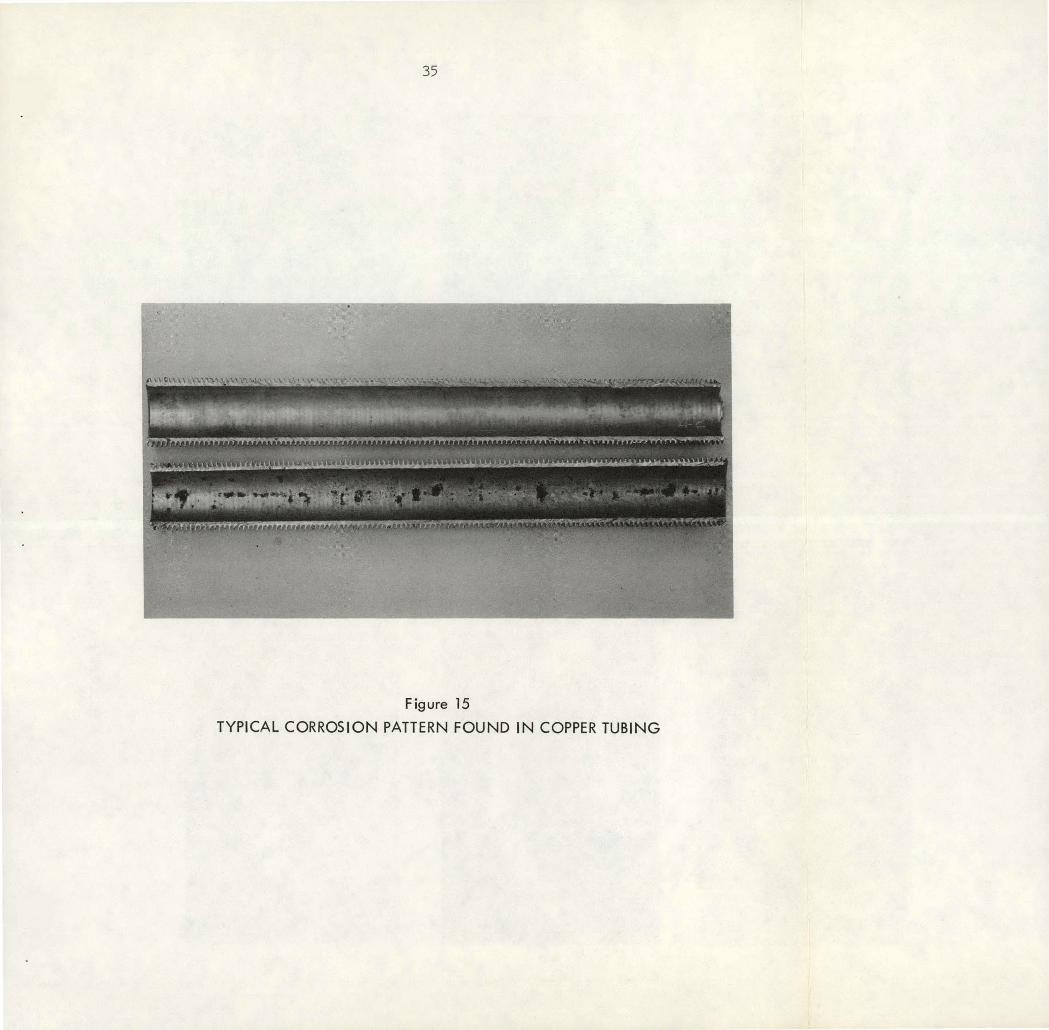
Several copper tubes were sectioned and examined metallographically to gain additional information about the accuracy and sensitivity of the eddy-current measurement. Specific areas were selected from the output strip chart recordings that corresponded to corrosion areas of varying depths . Isolated indications were selected to facilitate the actual location of the corrosion pits. The pits were located on the tubes using the correspondence between the length of the strip chart recording and the length of the tube. A short length of tubing, which ~ontained the corroded area to be examined, was then removed . To allow for error, the cuts were made at approximately 2 in. on either side of the estimated location of the corrosion pit. These short lengths were then visually-examined to determine what pattern the corrosion line(s) followed. Sometimes the corrosion occurred in a linear path on the inside surface in an axial direction down the tube length . (This was the most common pattern found .) Sometimes two lines of corrosion occurred in an axial direction down the tube. These lines could have been caused by standing water resulting from leaving the system out of service for long periods of time without proper drainage. A third condition was noLed in a few tubes; the corrosion line spiraled slowly down the tube in an axial direction. Further examination indicated that the spiral pattern was probably due to prime- corrosioninitiated areas that were caused by the tube fabrication process.
After the corrosion pattern was determined, the short tube lengths containing the corrosion pits to be examined were then split along their axes . (Precautions were taken not to cut through the areas to be examined.) The inside surface of the tube sections were examined using a microscope, and specific corrosion areas were correlated with the indications on the strip chart recording. A typical vi PW nf' the oorro:Jiou .IJa t,t,ern !'ound on U1e lnside surface of the copper tub es is shown in figure 15. Once the exact corroded area was identified, a portion of the tube containing this corrosion was removed and prepared as a metallographic specimen. This specimen was ground down to the edge of the corrosion pit where the corrosion just starts . The specimPn was then ground down in incremental steps, visually examined, and photographed after each grinding operation. Approximately 0.005 in. of material were removed during each grinding step. A series of six cross sections of a corrosion pit, ·viewed as the grinding operation progressed, is shown in figures 16a through 16f. The deepest penetration of the corrosion pit is shown in figure 16d. It is obvious from these photographs that if controlled metalloe;raphic practices are not followed, the maximum depth of the corrosion pit could easily be missed .
Several metallographic samples were examined and some of the results are summarized in table 1.
0 z cc ::) 1
-~
w
a.. a.. 0 u z Q
z ::)
lO
0 u.
11
\
Q) z
.... (Y
) ~ ~
.!2> w
1
-u
. 1
-~
a..
z 0 V)
0 ~ ~
0 u ....J
~
u a.. >-1
-

(c) 6X
(c) 6X
(e) 6X
Figure 16
SEQUENCE OF CROSS SECTIOt-JS OF CORROSION PIT
(b)
(d)
(f)
I
6X
6X
6X
w 0\

37
Table l
RESULTS OF METALLOGRAPHIC SAMPLES
Approximate Approximate Diameter Approximate Height
of Surface Area Maximum Depth of Eddy- Current Corrosion Tube of Corrosion Pit, of Corrosion Pit, Indication,
Pit Sample in . in . mm
l IA 0.020 X 0 . 035 0.035 25 . 5
2 IA 0.020 0 . 035 27 . 0
3 IIA 0 . 015 X 0 . 020 0.015 12 . 5
4 IIIA 0.020 0 . 020 13 . 5
5 IIIA 0 . 020 0 . 025 22 . 0
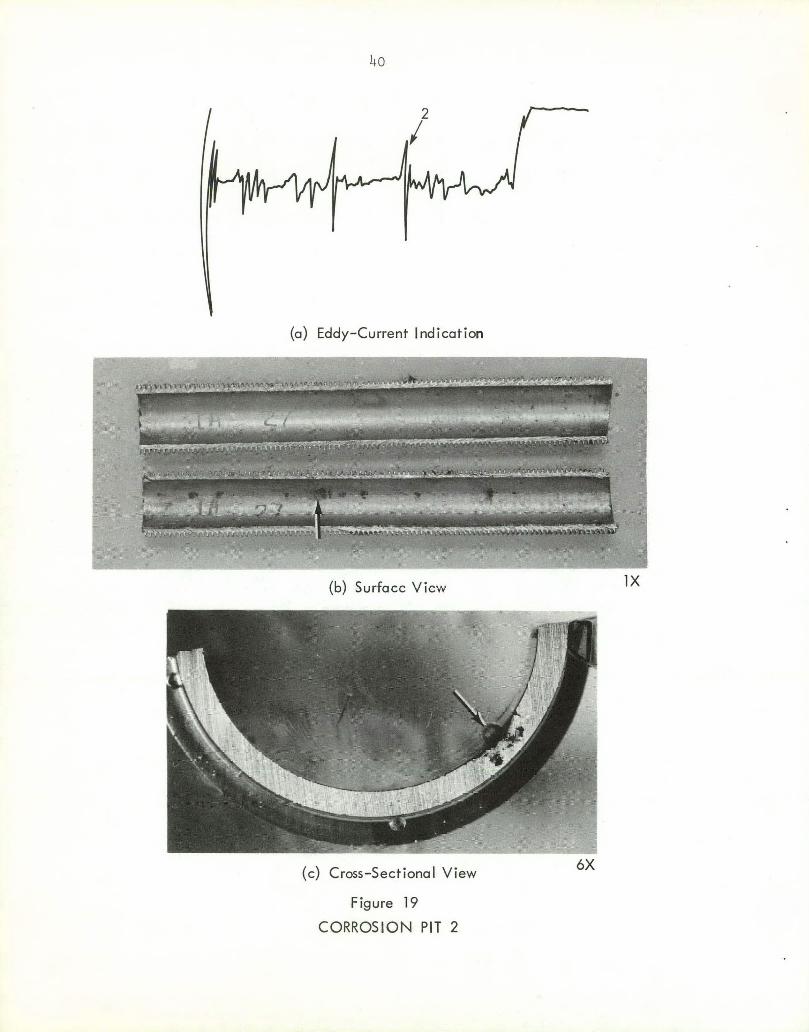
The corrosion pits summarized in table l are arbitrarily numbered from l to 5 for identification purposes only . The approximate diameters of surface areas are those circles or elipses that would encompass the corrosion area . The depth of the corrosion pit was determined by the metallographic method just described. The approximate height of the eddy- current indication was measured on the output strip chart recording . The height or amplitude of the output indication does have a direct correspondence with measured depth of the corrosion pits, as can be seen in figure 17 . The solid line in f i gure 17 was obtained by using linear regression analysis and the method of least squares . The experimental data po i nts were fit by the line y = 0 .1 + l . 29X with a correlation coefficient of 0 .986 in . and a limit of error of about 0 . 0025 in . These data show that a direct relationship exists between the heights of the eddy- current indications and the depths of the the corrosion pits for this exper iment .
The eddy- current indications , surface view and cross- sectional view for the five corrosion areas listed in table l , are shown in figures 18 through 22. The eddy- current indications that can be obtained and the types of corrosion pitting that correspond to these indications are illustrated in these figures . Additional areas of corrosion can be seen in the center photograph (surface view) in each figure . The surface views illustrate the significance of using eddy currents to measure the degree of corros i on in tubing . Even when corroded surfaces are accessible or are viewed with a borescope, it is impossible to visually determine the depths of the pits . An eddy- current test not only nondestructively locates corrosion in inacces sible areas , it also provides a measure of depth which is necessary to evaluate the severity of the corrosion .

"' E
1-,
c...
z 0 V')
0 0,: 0,:
0 u u.. 0 I 1-c... UJ 0
40
35
30
25
20
15
10
5
-CALCULATED
0 EXPERIMENTAL
38
0
0
00·~------L--------L--------~------~------~------~
0 5 10 15 20
HEIGHT OF EDDY CURRENT INDICATION, mm
Figure 17
25
INDICATION AMPLITUDE VS. DEPTH OF CORROSION PITS
30

39
(a) Eddy-Current I nd i cation
(b) Surface View
(c) Cross-Sectional View
Figure 18
CORROSION PIT 1
6X
40
2
I
(a) Eddy-Current Indication
(b) Surface View
(c) Cross-Sectional View
Figure 19
CORROSION PIT 2
lX
6X

41
(a) Eddy-Current Indication
(b) Surface View
(c) Cross-Sectional View
Figure ·20
CORROSION PIT 3
lX
6X

42
(a) Eddy-Current Indication
(b) Surface Y iew
(c) Cross-Sectional View
Figure 21
CORROSION PIT 4
lX
6X

43
(a) Eddy-Current Indication
(b) Surface View
(c) Cross-Sectional View
Figure 22
CORROSION PIT 5

44
The data in figures 18-22, particularly the amplitudes of the indications, apply specifically to this particular experiment since the test parameters were optimized for this case . If the type tubing, test instrument, probe, or instrument sens i tivity vary, these results can vary . Alternativel y, the same types of i ndications and the same general data pattern will be obtained for any eddy- current test of this type . This similarity will be shown in the following section of this report.
INSPECTION OF STAINLESS STEEL Tl~ING
Several type 304L , stainless steel tubes (ASTH- A- 269) were inspected for corros i on , usingeddy- current techniques similar to those discussed in the preced ing s ection. These stainless steel tubes are used in a Freon/Freon heat exchanger for a reactor experiment. The tubes are cyl i ndrically- shaped with no fins ; they have a 1 . 0 - in . ou t er di ameter, and a 0 . 065-·in . wall thickness . The same e d dy-curr ent instrument (Model E Probolog), that is discussed on page 15 was used to perform the tests . The testing techniques were basical ly the same as those used for the copper tub ing . A l arger diameter, internal eddy- current probe was used , and different instrument control settings were requi red to obtain optimum sensitivity for the test . A calibration standard was made by drilling 1/32- , 1/16- , and 1/8- in .-dia holes through the wall thickness of a relatively corrosion- free tube . The eddycurrent t e st response for t h is tub e is shown i n f i gure 23a . A corroded through hole was visually located in another tube, and the eddy- current test response for this tube is shown in figure 23b . It is interesting to note that again (similar to the copper tubing) the eddy- current response to a 1/8- in .-dia drilled through hole has approximately the same amplitude as a corroded through hole .
Two areas of corrosion were examinen metallographically following eddycurrent test i ng , and these results are shown in figures 24 and 25. Each f i gure shows, the eddy- curr ent response, the surface view, and the metallographic cross section of the corrosion pit, respectively. The corrosion pitting i n this material, which was caused by exposure to hydrochlori~ acid in a cleaning solution , gets much larger beneath the surface . ( The corrosion attack on the copper tubing examined in this stuJy behaved in an opposite manner . ) The surface corrosion in the sta i nless steel was so small that some corr osion pits were difficult to visually locate. An example of thi s can be seen in ~igure 25b .
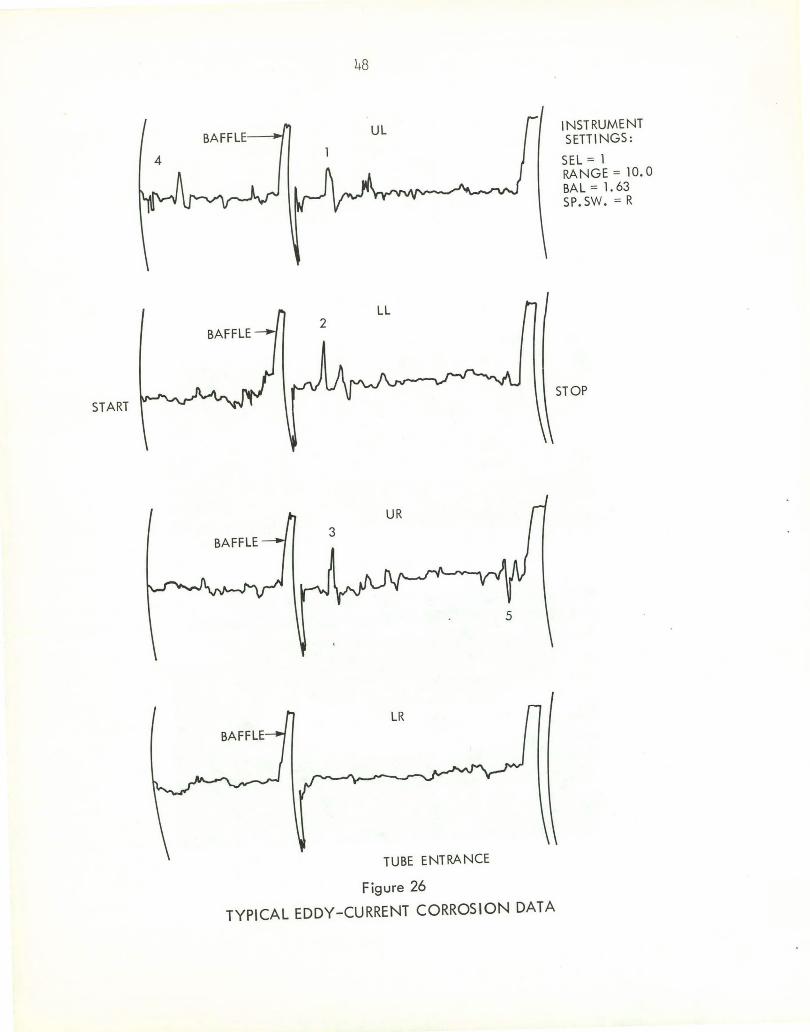
Typical test data that were obtained from the eddy- current corrosion test on four stainless steel tubes are shown in figure 26 . The tests were per formed wh i le the tubes were physically located in a heat exchanger . The baffle pl ates cause quite large indications on the eddy- current response which could mask corrosion pitting at these locations. A phase - sensitive , oscilloscope- type- output device similar to that discussed on page 14 would be requ i red to analyze corros i on in these areas .

45
1/32 D
sss
(a) Drilled Through Holes
THROUGH HOLE
(b) Corroded Through Hole
All dimensions expressed in inches.
Figurt:: 23
INDICATIONS FROM EDDY-CURRENT INSPECTION OF STAINLESS STEEL TUBING

46
THROUGH HOLE INSTRUMENT SETTINGS:
SEL = 1 BAL = l. 90 RANGE = 10.0
STOP
(a) Eddy-Current Indication
(b) Surface View 2X
(c) Cross-Sectional View 6X
Figure 24
CORRODED THROUGH HOLE IN STAINLESS STEEL TUBING

START
47
(a) Eddy-Current Ind ication
(b) Surface View
(c) Cross-Sectional View
Figure 25
STOP
CORRODED PIT IN STAINLESS STEEL TUBING
2X
6X
START
48
TUBE ENTRANCE
Figure 26
TYPICAL EDDY-CURRENT CORROSION DATA
INSTRUMENT SETTINGS:
SEL = l RANGE= 10.0 BAL = l. 63 SP.SW. = R
STOP

49
Five significant eddy-current indications are marked on the data in figure 26. These areas were verified to be corrosion pitting by examining the inside surface of the tubes using a borescope. The degree of severity of.these indicated areas of corrosion was determined by comparing their eddy-current indications to those obtained in figures 23, 24, and 25. The results concluded were that all five indications have about the same amplitude, which is slightly greater than that. for a l/16-in.-dia through hole, and is slightly .smaller than the indication shown in figure 25. Based on this comparison, the actual corrosion pits should have depths in the tube walls of about l/3 to l/2 of the tube wall thickness and their cross sections should resemble figure 25c.

50
ACKNOWLEDGMENTS
The author gratefully acknowledges the ORGDP Operations Engineering group, who helped support this study; J. B. Keen and M. F. Willard, who assisted in obtaining the data; and K. T. Ziehlke, who provided the metallographic data.

51
REFERENCES
1. Dodd, C. V., Deeds, W. E., and Spoeri, W. G., "Optimizing Defect Detection in Eddy-Current Testing," Materials Evaluation, 29, No. 3, 59-63 (1971).
2. Forster, F., "The Nondestructive Inspection of Tubings for Discontinuities and Wall Thickness Using Electromagnetic Test Methods," Part I, Materials Evaluation, 28, No. 4, 2lA-25A, 28A-3lA (1970).
3. Forster, F., "The Nondestructive Inspection of Tubings for Discontinuities and Wall Thickness Using Electromagnetic Test Methods," Part II, Materials Evaluation, 28, No. 5, l9A-23A, 26A-28A (1970).
4. Smith, J. H. and .Dodd, C. V. , Optimization of Eddy-Current Measurements of Coil to Conductor Spacing, Annual Fall Conference of the American Society for Nondestructive Testing, Chicago, Illinois, October l-5, 1973. UNCLASSIFIED.
5. Dodd, C. V., Smith, J. H., and Simpson, W. H., Eddy-Current Evaluation of Nuclear Control Rods, Union Carbide Corporation, Nuclear Division, Oak Ridge, Tennessee, September 1973 (ORNL-TM-4321). UNCLASSIFIED ..

;·
\ ..
THIS PAGE.
WAS INTENTIONALLY
LEFT BLANK

53
DISTRIBUTION
INTERNAL
1- 2. Administrative Offices Stief, S. S. Winkel, R. A.
3. Computing Technology Center Allen, C. L.
4. Engineering Division Patton, F. S.
5-7. Fabrication & Maint. Div. Krieg, E. H., Jr. McDonald, F. B. Studinger, L. A.
8-10. Gaseous Diffusion Dev. Div. Kidd, G. ,J., ,Jr. Trammell, H. E. Vance, J. M.
ll-17. Laboratory Division Arendt, J. W. Barton, J. C. Blake, H. W. Cagle, G. W. Napolitan, D. S. Smith, J. H. Ziehlke, K. T.
18-26. Library Ferguson, J. B.
27-28. Planning and Analysis Div. Lang, D. M. Pasquier, t. P.
29-42. Operations Division Cates, P. S.
EXTERNAL
Davis, W. A. Dalton, J. S. Legeay, A. J. Manley, H. c. Monk, T. H. Patterson, G. P. (5) Peterson, C. H. Tevaul t, D. J. Willard, M. C.
66-2 81. '!'lD-4 )00
43. Sommerfeld, K. W.
44. Technical Director Wilcox, W. J., Jr.
45-47. ORGDP Records Department- (RC)
48. U.~ Atomic Energy Commission Zachry, D. S.
49. Goodyear Atomic Corporation Manning, R. E.
50-53. ORNL Dodd, C. V. Klindt, K. K. McClung, R. W. McGuffey, J. R.
54-59. Paducah Plant Ashwood, T. L. Glenn, M. L. Golliher, W. R. Green, c. H. Levin, R. W. Schlapbach, M.
60-65. Y-12 Plant Griffin, J. D. Jackson, V. c. Long, P. J. Mason, D. L. Ross, w. D. Vanstrum, P. R.
E.

..
~U.S. GOVERNMENT PRINTING OFFICE: 1974-748-189/179


![Pacific Commercial Advertiser. (Honolulu, HI) 1893-02-25 [p ]. · W T Schmi.lt, H Schmidt, Miss L Strain, Mm J A Scott, J R S antun, V S N, J Phillips and Mrs Smith, M S Smith,,1](https://img.pdfslide.net/doc/110x75/60420573fd2e585eb939314b/pacific-commercial-advertiser-honolulu-hi-1893-02-25-p-w-t-schmilt-h-schmidt.jpg)