Embed Size (px)
Citation preview

ANNUAL REPORT2012/13
J. L. MORISON SON & JONES (CEYLON) PLC

J. L. MORISON SON & JONES (CEYLON) PLCAND ITS SUBSIDIARIES
11
Legal Form
Quoted Public Company with Limited Liability.Listed on the Colombo Stock Exchange on 1st January 1964
Date of Incorporation
31st January 1939
Date of Re-registration
5th September 2007
New Registration Number
PQ 77
Accounting Year End
31st March
Registered Office
“Hemas House” No. 75 Braybrooke Place,Colombo 2Tel; 0114 731 731 (Hunting) Fax: 0114731777
Auditors
Ernst & Young Chartered AccountantsNo. 201, De Saram Place, Colombo 10
Directors
Mr. H. N. Esufally (Chairman)Mr. R. A. J. T. Perera (MD/CEO)Mr. A. S. AbeyewardeneProfessor P. R. FernandoMr. S. M. Enderby
Secretaries
Hemas Corporate Services (Pvt) Ltd “Hemas House” No. 75 Braybrooke Place,Colombo 2Tel; 0114 731 731 (Hunting) Fax: 0114731777
Lawyers to the Company
Julius & Creasy No. 41, Janadhipathi Mawatha ,Colombo 1.
Bankers
Bank of CeylonPeople’s Bank Standard Chartered BankNDB BankNations Trust BankSeylan BankHSBC BankSampath Bank
J. L. MORISON SON & JONES (CEYLON) PLCAND ITS SUBSIDIARIES
32
NOTICE OF MEETING
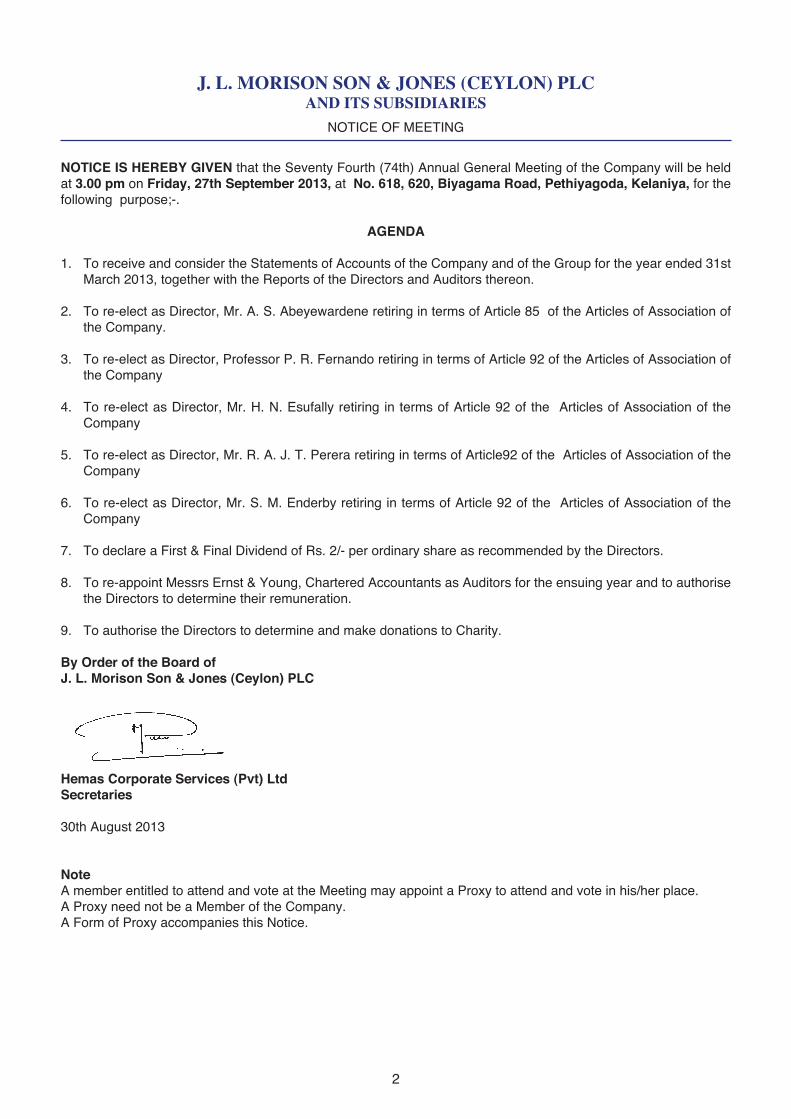
NOTICE IS HEREBY GIVEN that the Seventy Fourth (74th) Annual General Meeting of the Company will be held at 3.00 pm on Friday, 27th September 2013, at No. 618, 620, Biyagama Road, Pethiyagoda, Kelaniya, for the following purpose;-.
AGENDA
1. To receive and consider the Statements of Accounts of the Company and of the Group for the year ended 31st March 2013, together with the Reports of the Directors and Auditors thereon.
2. To re-elect as Director, Mr. A. S. Abeyewardene retiring in terms of Article 85 of the Articles of Association of the Company.
3. To re-elect as Director, Professor P. R. Fernando retiring in terms of Article 92 of the Articles of Association of the Company
4. To re-elect as Director, Mr. H. N. Esufally retiring in terms of Article 92 of the Articles of Association of the Company
5. To re-elect as Director, Mr. R. A. J. T. Perera retiring in terms of Article92 of the Articles of Association of the Company
6. To re-elect as Director, Mr. S. M. Enderby retiring in terms of Article 92 of the Articles of Association of the Company
7. To declare a First & Final Dividend of Rs. 2/- per ordinary share as recommended by the Directors.
8. To re-appoint Messrs Ernst & Young, Chartered Accountants as Auditors for the ensuing year and to authorise the Directors to determine their remuneration.
9. To authorise the Directors to determine and make donations to Charity.
By Order of the Board of J. L. Morison Son & Jones (Ceylon) PLC
Hemas Corporate Services (Pvt) LtdSecretaries
30th August 2013
Note A member entitled to attend and vote at the Meeting may appoint a Proxy to attend and vote in his/her place.A Proxy need not be a Member of the Company. A Form of Proxy accompanies this Notice.
J. L. MORISON SON & JONES (CEYLON) PLCAND ITS SUBSIDIARIES
32
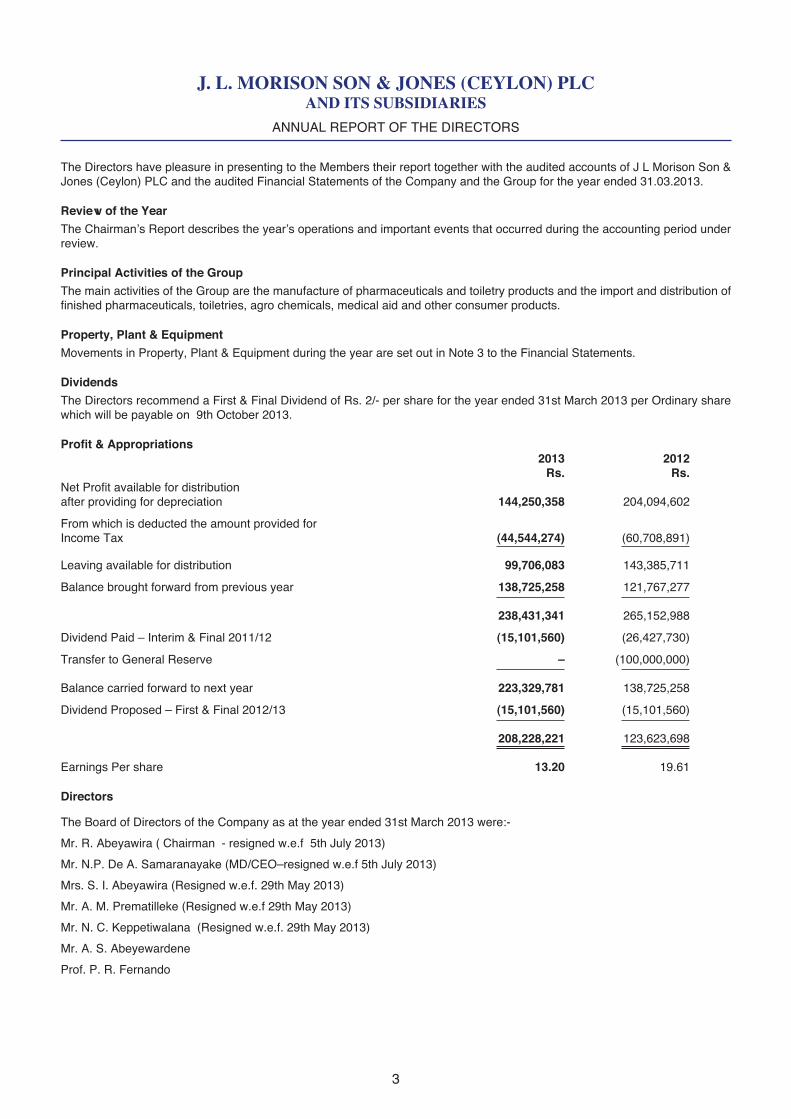
ANNUAL REPORT OF THE DIRECTORS
The Directors have pleasure in presenting to the Members their report together with the audited accounts of J L Morison Son & Jones (Ceylon) PLC and the audited Financial Statements of the Company and the Group for the year ended 31.03.2013.
Review of the YearThe Chairman’s Report describes the year’s operations and important events that occurred during the accounting period under review.
Principal Activities of the Group The main activities of the Group are the manufacture of pharmaceuticals and toiletry products and the import and distribution of finished pharmaceuticals, toiletries, agro chemicals, medical aid and other consumer products.
Property, Plant & EquipmentMovements in Property, Plant & Equipment during the year are set out in Note 3 to the Financial Statements.
DividendsThe Directors recommend a First & Final Dividend of Rs. 2/- per share for the year ended 31st March 2013 per Ordinary share which will be payable on 9th October 2013.
Profit & Appropriations 2013 2012 Rs. Rs.Net Profit available for distribution after providing for depreciation 144,250,358 204,094,602
From which is deducted the amount provided for Income Tax (44,544,274) (60,708,891)
Leaving available for distribution 99,706,083 143,385,711
Balance brought forward from previous year 138,725,258 121,767,277
238,431,341 265,152,988
Dividend Paid – Interim & Final 2011/12 (15,101,560) (26,427,730)
Transfer to General Reserve – (100,000,000)
Balance carried forward to next year 223,329,781 138,725,258
Dividend Proposed – First & Final 2012/13 (15,101,560) (15,101,560)
208,228,221 123,623,698
Earnings Per share 13.20 19.61
Directors
The Board of Directors of the Company as at the year ended 31st March 2013 were:-
Mr. R. Abeyawira ( Chairman - resigned w.e.f 5th July 2013)
Mr. N.P. De A. Samaranayake (MD/CEO–resigned w.e.f 5th July 2013)
Mrs. S. I. Abeyawira (Resigned w.e.f. 29th May 2013)
Mr. A. M. Prematilleke (Resigned w.e.f 29th May 2013)
Mr. N. C. Keppetiwalana (Resigned w.e.f. 29th May 2013)
Mr. A. S. Abeyewardene
Prof. P. R. Fernando
J. L. MORISON SON & JONES (CEYLON) PLCAND ITS SUBSIDIARIES
54
ANNUAL REPORT OF THE DIRECTORS (Contd.)
Changes to the Directorate subsequent to the Balance Sheet Date
The following persons were appointed to the directorate with effect from 29th May 2013:-
Mr. Husein Esufally
Mr. Trihan Perera
Mr. Steven Enderby
Mr. Husein Esufally was elected Chairman on 5th July 2013, consequent to the resignation of Mr. R. Abeyawira.
Mr. Trihan Perera was appointed MD/CEO effective 5th July 2013, upon the resignation of Mr. N. P. De A. Samaranayake.
Re-election of Directors
In terms of Article 85 of the Articles of Association of the Company, Mr. A. S. Abeyewardene retires by rotation from the Board, but being eligible, offers himself for re-election with the unanimous support of the Board.
In accordance with Article 92 of the Articles of Association of the Company, Messrs Husein Esufally, Trihan Perera, Steven Enderby and Professor Ravindra Fernando retire and are eligible for re-election.
Secretaries
Consequent to the resignation of Mr. W.M.G. Wijesundera, Company Secretary, on 30th May 2013, Hemas Corporate Services (Pvt) Ltd, of No. 75, Braybrooke Place, Colombo 2 were appointed Secretaries of the Company with effect from that date.
Registered Office
The Registered Office of the Company was relocated at No. 75, Braybrooke Place, Colombo 2 with effect from 6th June 2013.
Share Information
Information relating to Earnings, Dividend, Net Assets and Market Price per Share is given in the 5 year summary on page 57.
Donations
During the year charitable donations amounting to Rs. 35,650/- were made by the Company. (2012 - Rs. 5,000.00)
Segmental Analysis
A segmental analysis of Group operations is given in Note 28 on page 51 to the accounts.
Major Shareholding
Details of the 20 largest shareholders of Voting & Non-Voting shares of the Company as at 31.03.2013 are given on pages 55 & 56.
Statutory Payments
The Directors, to the best of their knowledge and belief, are satisfied that all statutory payments in relation to the employees and the Government have been made up to date or adequately provided for in the Accounts.
Reserves
Details of Capital and Revenue Reserves of the Company are given in Note 11 on page 43 to the Financial Statements.
Stated Capital
Details of the Stated Capital of the Company are given in Note 10 to the Accounts. There was no movement in the Stated Capital during the period.
Events Occurring after the Reporting Date
Hemas Manufacturing (Pvt) Ltd, (HML) a subsidiary of Hemas Holdings PLC, acquired 71.51% of the issued Ordinary Voting Shares and 50.06% of the issued Ordinary Non-Voting Shares of the Company on 30th May 2013.

J. L. MORISON SON & JONES (CEYLON) PLCAND ITS SUBSIDIARIES
54
ANNUAL REPORT OF THE DIRECTORS (Contd.)
HML’s ordinary voting rights, having thus exceeded the threshold of 30% as set out in the SEC’s Take Overs and Mergers Code, made a Mandatory Offer to the remaining shareholders of Voting shares in accordance with the Code.
Further, in compliance with the provisions of the Code, HML also concurrently made a Voluntary Offer to the remaining shareholders of Non-Voting Shares, with a view to acquire the remaining Non-Voting Shares held by such shareholders.
Resultantly, as at date, HML holds 90.02 % of Ordinary Voting Shares and 84.83% of Ordinary Non-Voting Shares in the Issued Share Capital of the Company.
Interest Register
The Company has maintained an Interest Register in accordance with the Companies Act No. 7 of 2007.
Environmental Protection
The Company has not been engaged in any activities which has caused detriment to the environment.
Significant Accounting Policies
Significant Accounting Policies adopted by the Company in the preparation of the Financial Statements are given on pages 22 to 53 of the Annual Report.
Going Concern
On the basis of the current financial projections and facilities available, the Directors are confident that the Company has adequate resources to continue business operations. Accordingly the Directors consider that it is appropriate to adopt the going concern basis in preparing the financial statements.
External Auditors
The following payments were made to the Group’s external Auditors, Messrs. Ernst & Young;.
Company Group Rs. Rs. 2013 2012 2013 2012
Audit Fees and Expenses 966,000 840,000 1,930,000 1,674,000Fees for other services and Expenses 1,244,734 387,750 1,418,400 744,000
As far as the Directors are aware, the Auditors’ do not have any interest or relationship with the Company or any of its subsidiaries other than those disclosed above.
The Report of the Auditors on the Financial Statements of the Company and the Group is set out on Page 16 of the Annual Report.
A Resolution to re-appoint the present auditors, Messrs Ernst & Young, who have expressed their willingness to continue, will be proposed at the Annual General Meeting.
Annual General Meeting (AGM)
The AGM of the Company for the financial year 2012/13 will be held on Friday, 27th September 2013 at 3.00 p.m at No. 618, 620, Biyagama Road, Pethiyagoda, Kelaniya.
Signed for and on behalf of the Board
Husein Esufally Trihan PereraDirector Director
Hemas Corporate Services (Pvt) LtdSecretaries
Colombo22nd August 2013
J. L. MORISON SON & JONES (CEYLON) PLCAND ITS SUBSIDIARIES
76
CORPORATE GOVERNANCE
The Board of J.L. Morison Son & Jones (Ceylon) PLC recognizes the importance of and takes responsibility for ensuring that proper standards of Governance are maintained. It understands, supports and has applied the core concepts that underlie corporate governance, complying with a majority of the detailed provisions contained in the Combined Code of 2006 and the Listing Rules of the Colombo Stock Exchange.
The following report attempts to explain how the Company is structured and controlled internally and how power is exercised by different groups to ensure that the objectives of the Company are achieved lawfully and ethically.
A. DIRECTORS
1. The Board
Code Provision:- “Every company should be headed by an effective Board, which is collectively responsible for the success of the company”
The Board provides entrepreneurial leadership for the Company within a framework of prudent and effective risk management. The schedule of matters specifically reserved for the Board include approval of the group’s long term objectives and strategy, approval of the operating and capital expenditure budgets, oversight of the group’s operations, changes to the group structure and capital, financial reporting and control, internal controls, proposals for major capital projects and approval of policies.
As part of their role, the non-executive independent directors help develop proposals on strategy. They scrutinize the performance of management in meeting agreed goals and objectives and monitor the reporting of performance.
The Board has four scheduled meetings a year, and will meet further if necessary to consider specific matters which it has reserved to itself for decision.
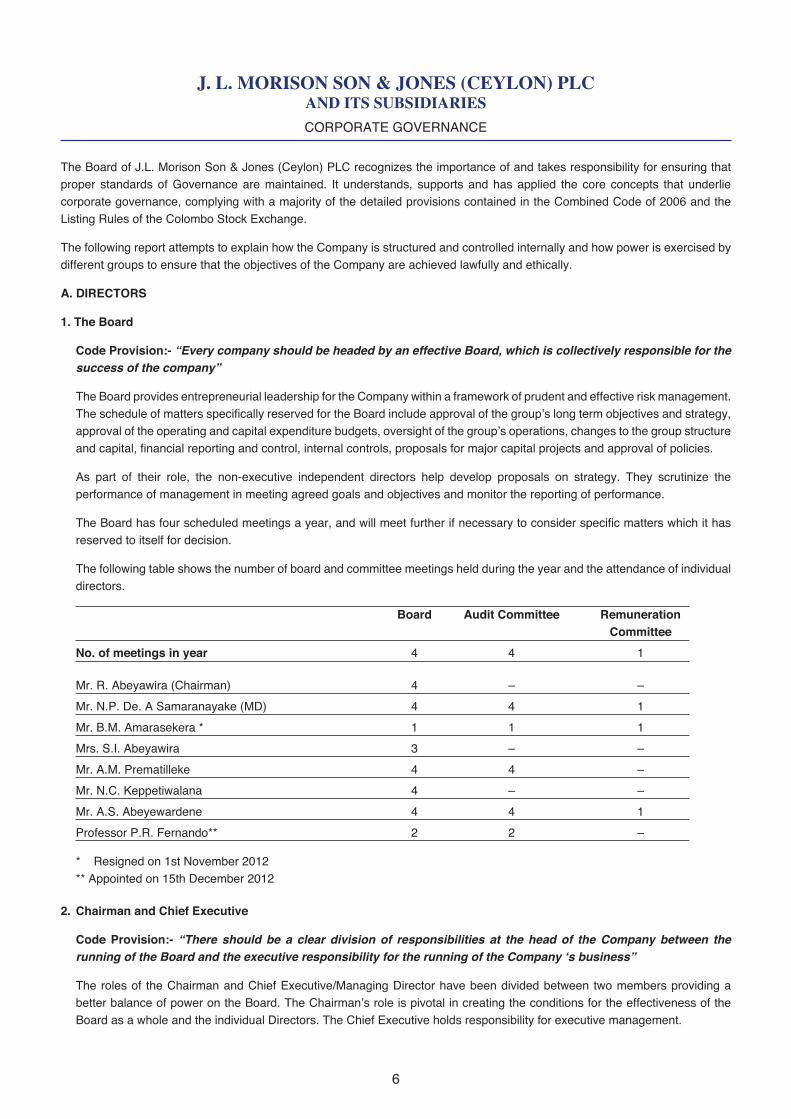
The following table shows the number of board and committee meetings held during the year and the attendance of individual directors.
Board Audit Committee Remuneration Committee
No. of meetings in year 4 4 1
Mr. R. Abeyawira (Chairman) 4 – –
Mr. N.P. De. A Samaranayake (MD) 4 4 1
Mr. B.M. Amarasekera * 1 1 1
Mrs. S.I. Abeyawira 3 – –
Mr. A.M. Prematilleke 4 4 –
Mr. N.C. Keppetiwalana 4 – –
Mr. A.S. Abeyewardene 4 4 1
Professor P.R. Fernando** 2 2 –
* Resigned on 1st November 2012 ** Appointed on 15th December 2012
2. Chairman and Chief Executive
Code Provision:- “There should be a clear division of responsibilities at the head of the Company between the running of the Board and the executive responsibility for the running of the Company ‘s business”
The roles of the Chairman and Chief Executive/Managing Director have been divided between two members providing a better balance of power on the Board. The Chairman’s role is pivotal in creating the conditions for the effectiveness of the Board as a whole and the individual Directors. The Chief Executive holds responsibility for executive management.
J. L. MORISON SON & JONES (CEYLON) PLCAND ITS SUBSIDIARIES
76
CORPORATE GOVERNANCE (Contd.)
3. Board balance and Independence
Code Provision:- “The board should include a balance of executive and non-executive directors such that no individuals or small group of individuals can dominate the board’s decision taking”
The Board comprised four executive directors and three non-executive directors as at 31st March 2013. Your Board believed that it was of sufficient size to bring a balance of skills and experience appropriate for the requirements of the business. The directors had a range of skills and experience and each brought an independent judgment and considerable knowledge to the board’s discussions.
Messrs A.S. Abeyewardene, B.M. Amarasekera (resigned w.e.f. 1st November 2012) , Professor P.R. Fernando (appointed w.e.f. 15th December 2012) and Mrs. S.I. Abeyawira, non-executive directors on the board, were deemed independent, having met the criteria for independence as defined by the Colombo Stock Exchange. The Board received from each of the non-executive directors a written declaration of their independence.
The Board was aware of other commitments of its non-executive directors and were satisfied that these did not conflict with their duties as directors of the Company.
4. Appointments to the Board
Code Provision:- “There should be a formal, rigorous and transparent procedure for the appointment of new directors to the Board”
The Board had not established a Nominations Committee for making recommendations on board appointments. Instead, appointments to the Board were made collectively and with the consent of all Board members, based on merit and against objective criteria.
5. Information and Professional Development
Code Provision:- “The Board should be supplied in a timely manner with information in a form and of a quality appropriate to enable it to discharge its duties.”
The Chairman is responsible for ensuring that the directors receive accurate timely and clear information. Under the direction of the Chairman, the Company Secretary made certain that good information flowed within the board and its committees.
All Directors had access to the advise and services of the Company Secretary who was responsible to the board for ensuring that board procedures are complied with.
6. Re-election
Code Provision:- “ All directors should be submitted for re-election at regular intervals, subject to continued satisfactory performance.”
The Articles of Association require that each director seeks re-election every three years, in line with the provisions of the Combined Code. The Chairman and Managing Director are excluded in determining the directors to retire.
A director who retires by rotation is eligible for re-election by the shareholders at the Annual General Meeting.
B. REMUNERATION
Procedure
Code Provision:- “There should be a transparent procedure for developing policy on executive remuneration and for fixing the remuneration packages
The Remuneration Committee consists of two Independent, non-executive directors & the Managing Director/CEO. The Office of Chairman of the Committee is held by an Independent director.
The Remuneration Committee has been delegated with responsibility for both developing remuneration policy and for setting the remuneration for all executive directors and senior executives.
A description of the work of the Remuneration Committee and the Remuneration Policy are set out in the Committee’s report to the shareholders.
J. L. MORISON SON & JONES (CEYLON) PLCAND ITS SUBSIDIARIES
98
CORPORATE GOVERNANCE (Contd.)
C. ACCOUNTABILITY AND AUDIT
1. Financial Reporting
The responsibility of the directors in relation to the Financial Statements is set out in the Statement of Directors’ Responsibility on page 14.
2. Internal Control
The Board is committed to managing risk and to controlling its business and financial activities in a manner which enables it to maximize profitable business opportunities and avoid or reduce risks which can cause loss or reputational damage, ensure compliance with applicable laws and regulations and enhance resilience to external events. To achieve this, the Board has established a process for the identification, evaluation and management of the risks faced by the group .It should be recognized that such a process can only provide reasonable and not absolute assurance against material misstatement or loss.
Strategic Risk
Strategic risk relates to the risk associated with the markets and industries in which we operate, demand for our products and services, competitor threats, technology and product innovation and public policy.
Operational Risk
Operation risk relates to the risk arising from the execution of business operations. The Company has established internal control systems in all its operations and continuously reviews and monitors those procedures to ensure accountability and transparency in all its operations.
Financial Risk
Financial risk covers the broad area of risk and mainly incorporates credit risk and market risk stemming from business operations.
Credit Risk & Market Risk
Credit risk arises due to the non-payment by debtors which can lead to working capital issues. the company implements proper credit control and debt collection policy to ensure that the company selects as far as possible, reliable distributors who are able to honour their debts.
Market Risk Management
Market risk management refers to the risk arising from volatilities in market forces. the company faces market risk in the financial sphere in terms of the local rates of interest, inflation and exchange rates.
Foreign Exchange Risk
The Company’s business model is such that most of the products and the raw materials are imported. As a result, the Company is highly exposed to foreign exchange risk due to fluctuation in exchange rates. The Company uses a forward exchange rate for accounting purposes and by this means, it efficiently provides for foreign exchange exposure and was able to minimise any adverse impacts.
Interest Rate Risk
The Company continues to restructure its debt portfolio to minimise the effect of rising interest rates. The Company is committed to reduce its level of debt, to ensure that the financial costs remain under control.
Liquidity Risk
Due to the nature of the businesses that the Company operates in, we need to ensure that the working capital cycles are properly maintained, to ensure that the operations are not compromised due to lack of adequate working capital. The company implements an effective credit control policy to ensure collection from debtors and the obligations to its creditors are met on time.
Legal & Compliance Risk
The Company addresses this area with great concern in order to protect its corporate image. The legal and compliance risk relates to the changes in the government and regulatory environment, compliance requirements with policies and procedures, including those relating to financial reporting, environmental health and safety and intellectual property risks.
Business Risk
The intensification of competition from existing players and also from new Entrants are significant business risks that the Company faces. Various consumer spending patterns are also a potential business risk, which the Company monitors closely.
J. L. MORISON SON & JONES (CEYLON) PLCAND ITS SUBSIDIARIES
98
CORPORATE GOVERNANCE (Contd.)
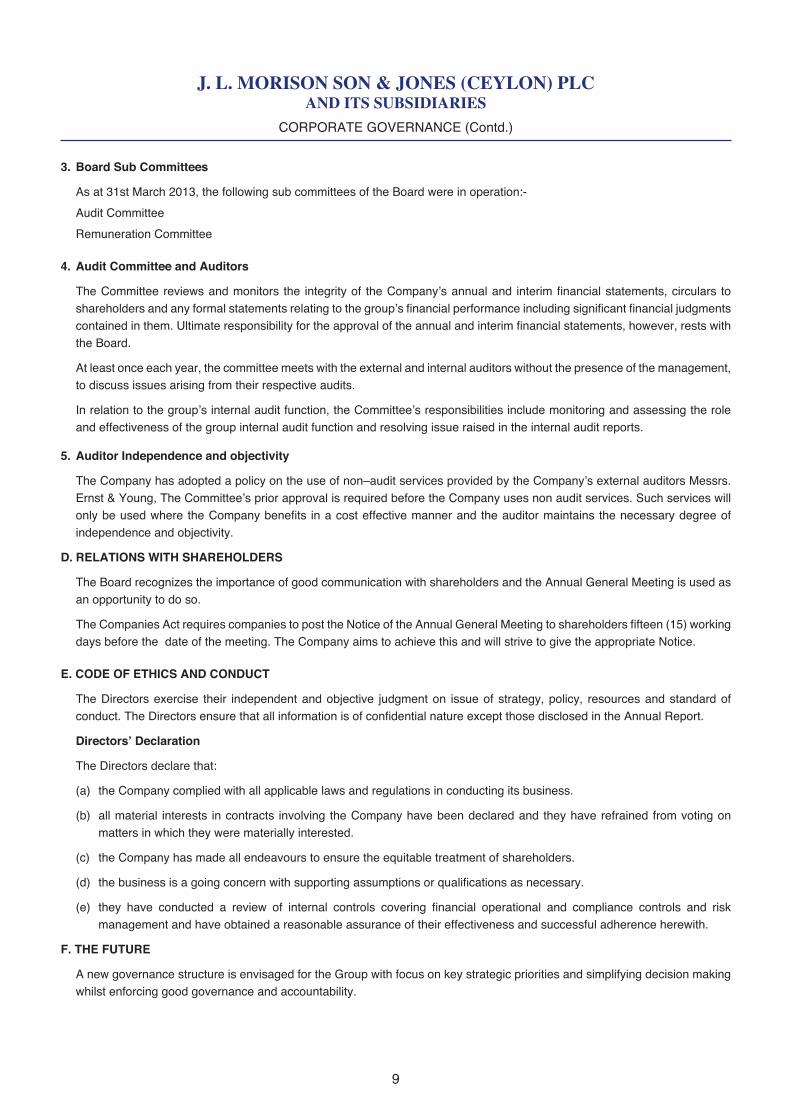
3. Board Sub Committees
As at 31st March 2013, the following sub committees of the Board were in operation:-
Audit Committee
Remuneration Committee
4. Audit Committee and Auditors
The Committee reviews and monitors the integrity of the Company’s annual and interim financial statements, circulars to shareholders and any formal statements relating to the group’s financial performance including significant financial judgments contained in them. Ultimate responsibility for the approval of the annual and interim financial statements, however, rests with the Board.
At least once each year, the committee meets with the external and internal auditors without the presence of the management, to discuss issues arising from their respective audits.
In relation to the group’s internal audit function, the Committee’s responsibilities include monitoring and assessing the role and effectiveness of the group internal audit function and resolving issue raised in the internal audit reports.
5. Auditor Independence and objectivity
The Company has adopted a policy on the use of non–audit services provided by the Company’s external auditors Messrs. Ernst & Young, The Committee’s prior approval is required before the Company uses non audit services. Such services will only be used where the Company benefits in a cost effective manner and the auditor maintains the necessary degree of independence and objectivity.
D. RELATIONS WITH SHAREHOLDERS
The Board recognizes the importance of good communication with shareholders and the Annual General Meeting is used as an opportunity to do so.
The Companies Act requires companies to post the Notice of the Annual General Meeting to shareholders fifteen (15) working days before the date of the meeting. The Company aims to achieve this and will strive to give the appropriate Notice.
E. CODE OF ETHICS AND CONDUCT
The Directors exercise their independent and objective judgment on issue of strategy, policy, resources and standard of conduct. The Directors ensure that all information is of confidential nature except those disclosed in the Annual Report.
Directors’ Declaration
The Directors declare that:
(a) the Company complied with all applicable laws and regulations in conducting its business.
(b) all material interests in contracts involving the Company have been declared and they have refrained from voting on matters in which they were materially interested.
(c) the Company has made all endeavours to ensure the equitable treatment of shareholders.
(d) the business is a going concern with supporting assumptions or qualifications as necessary.
(e) they have conducted a review of internal controls covering financial operational and compliance controls and risk management and have obtained a reasonable assurance of their effectiveness and successful adherence herewith.
F. THE FUTURE
A new governance structure is envisaged for the Group with focus on key strategic priorities and simplifying decision making whilst enforcing good governance and accountability.
J. L. MORISON SON & JONES (CEYLON) PLCAND ITS SUBSIDIARIES
1110
CORPORATE GOVERNANCE (Contd.)
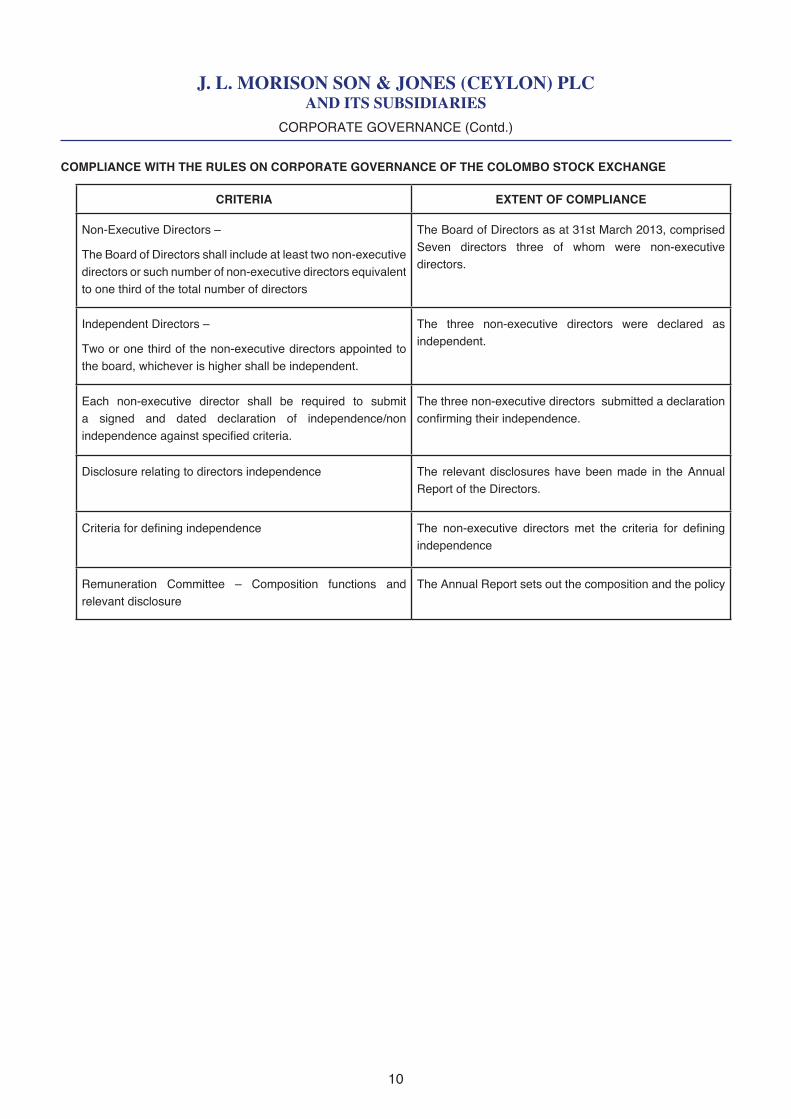
COMPLIANCE WITH THE RULES ON CORPORATE GOVERNANCE OF THE COLOMBO STOCK EXCHANGE
CRITERIA EXTENT OF COMPLIANCE
Non-Executive Directors –
The Board of Directors shall include at least two non-executive directors or such number of non-executive directors equivalent to one third of the total number of directors
The Board of Directors as at 31st March 2013, comprised Seven directors three of whom were non-executive directors.
Independent Directors –
Two or one third of the non-executive directors appointed to the board, whichever is higher shall be independent.
The three non-executive directors were declared as independent.
Each non-executive director shall be required to submit a signed and dated declaration of independence/non independence against specified criteria.
The three non-executive directors submitted a declaration confirming their independence.
Disclosure relating to directors independence The relevant disclosures have been made in the Annual Report of the Directors.
Criteria for defining independence The non-executive directors met the criteria for defining independence
Remuneration Committee – Composition functions and relevant disclosure
The Annual Report sets out the composition and the policy
J. L. MORISON SON & JONES (CEYLON) PLCAND ITS SUBSIDIARIES
1110
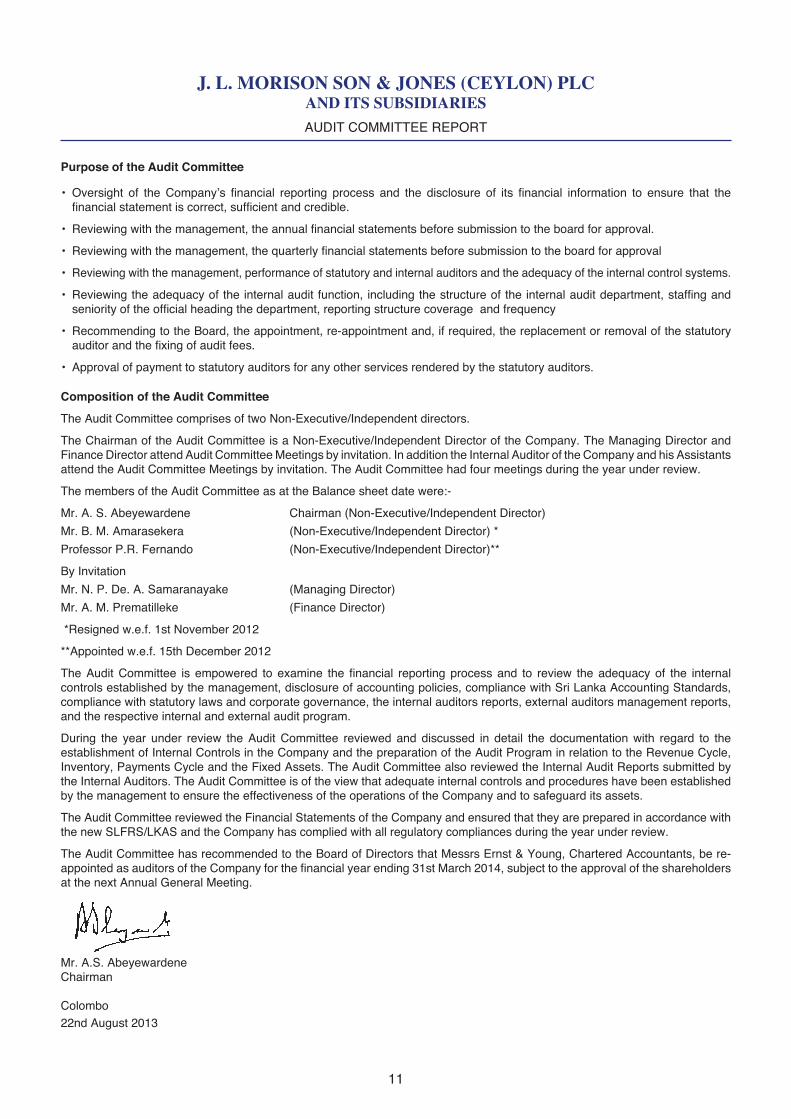
AUDIT COMMITTEE REPORT
Purpose of the Audit Committee
• Oversight of the Company’s financial reporting process and the disclosure of its financial information to ensure that the financial statement is correct, sufficient and credible.
• Reviewing with the management, the annual financial statements before submission to the board for approval.
• Reviewing with the management, the quarterly financial statements before submission to the board for approval
• Reviewing with the management, performance of statutory and internal auditors and the adequacy of the internal control systems.
• Reviewing the adequacy of the internal audit function, including the structure of the internal audit department, staffing and seniority of the official heading the department, reporting structure coverage and frequency
• Recommending to the Board, the appointment, re-appointment and, if required, the replacement or removal of the statutory auditor and the fixing of audit fees.
• Approval of payment to statutory auditors for any other services rendered by the statutory auditors.
Composition of the Audit Committee
The Audit Committee comprises of two Non-Executive/Independent directors.
The Chairman of the Audit Committee is a Non-Executive/Independent Director of the Company. The Managing Director and Finance Director attend Audit Committee Meetings by invitation. In addition the Internal Auditor of the Company and his Assistants attend the Audit Committee Meetings by invitation. The Audit Committee had four meetings during the year under review.
The members of the Audit Committee as at the Balance sheet date were:-
Mr. A. S. Abeyewardene Chairman (Non-Executive/Independent Director)
Mr. B. M. Amarasekera (Non-Executive/Independent Director) *
Professor P.R. Fernando (Non-Executive/Independent Director)**
By Invitation
Mr. N. P. De. A. Samaranayake (Managing Director)
Mr. A. M. Prematilleke (Finance Director)
*Resigned w.e.f. 1st November 2012
**Appointed w.e.f. 15th December 2012
The Audit Committee is empowered to examine the financial reporting process and to review the adequacy of the internal controls established by the management, disclosure of accounting policies, compliance with Sri Lanka Accounting Standards, compliance with statutory laws and corporate governance, the internal auditors reports, external auditors management reports, and the respective internal and external audit program.
During the year under review the Audit Committee reviewed and discussed in detail the documentation with regard to the establishment of Internal Controls in the Company and the preparation of the Audit Program in relation to the Revenue Cycle, Inventory, Payments Cycle and the Fixed Assets. The Audit Committee also reviewed the Internal Audit Reports submitted by the Internal Auditors. The Audit Committee is of the view that adequate internal controls and procedures have been established by the management to ensure the effectiveness of the operations of the Company and to safeguard its assets.
The Audit Committee reviewed the Financial Statements of the Company and ensured that they are prepared in accordance with the new SLFRS/LKAS and the Company has complied with all regulatory compliances during the year under review.
The Audit Committee has recommended to the Board of Directors that Messrs Ernst & Young, Chartered Accountants, be re-appointed as auditors of the Company for the financial year ending 31st March 2014, subject to the approval of the shareholders at the next Annual General Meeting.
Mr. A.S. AbeyewardeneChairman
Colombo22nd August 2013
J. L. MORISON SON & JONES (CEYLON) PLCAND ITS SUBSIDIARIES
1312
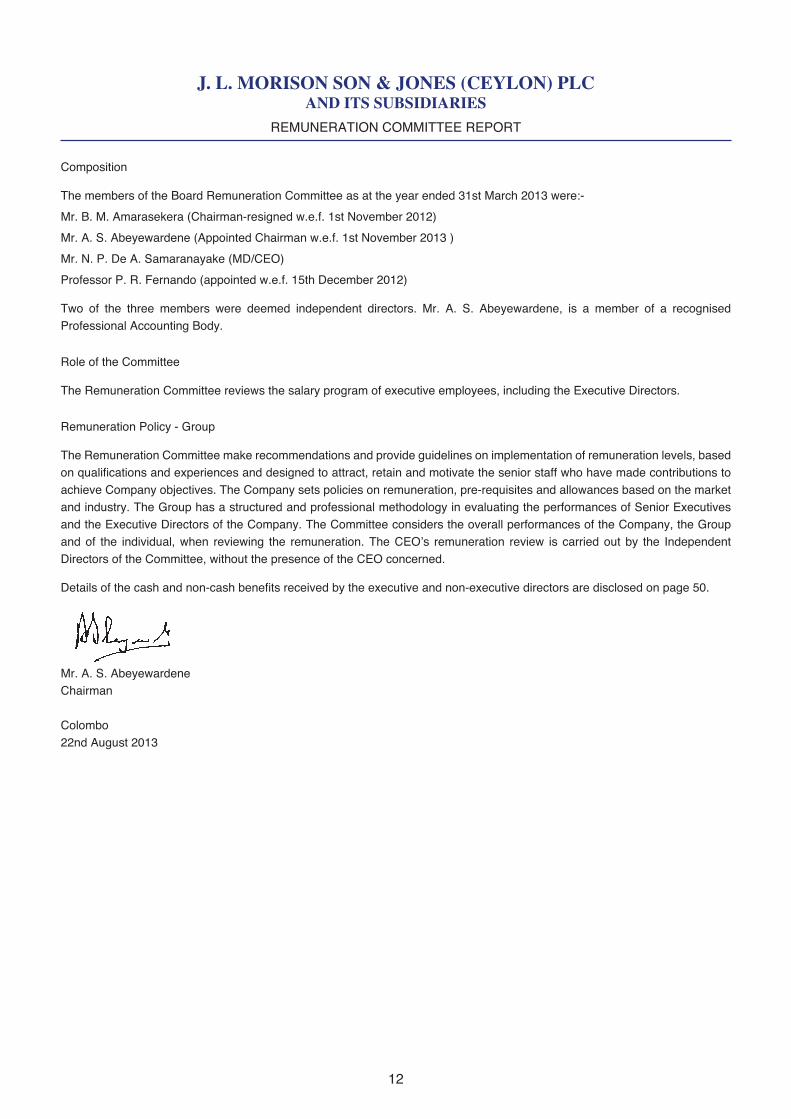
REMUNERATION COMMITTEE REPORT
Composition
The members of the Board Remuneration Committee as at the year ended 31st March 2013 were:-
Mr. B. M. Amarasekera (Chairman-resigned w.e.f. 1st November 2012)
Mr. A. S. Abeyewardene (Appointed Chairman w.e.f. 1st November 2013 )
Mr. N. P. De A. Samaranayake (MD/CEO)
Professor P. R. Fernando (appointed w.e.f. 15th December 2012)
Two of the three members were deemed independent directors. Mr. A. S. Abeyewardene, is a member of a recognised Professional Accounting Body.
Role of the Committee
The Remuneration Committee reviews the salary program of executive employees, including the Executive Directors.
Remuneration Policy - Group
The Remuneration Committee make recommendations and provide guidelines on implementation of remuneration levels, based on qualifications and experiences and designed to attract, retain and motivate the senior staff who have made contributions to achieve Company objectives. The Company sets policies on remuneration, pre-requisites and allowances based on the market and industry. The Group has a structured and professional methodology in evaluating the performances of Senior Executives and the Executive Directors of the Company. The Committee considers the overall performances of the Company, the Group and of the individual, when reviewing the remuneration. The CEO’s remuneration review is carried out by the Independent Directors of the Committee, without the presence of the CEO concerned.
Details of the cash and non-cash benefits received by the executive and non-executive directors are disclosed on page 50.
Mr. A. S. AbeyewardeneChairman
Colombo 22nd August 2013
J. L. MORISON SON & JONES (CEYLON) PLCAND ITS SUBSIDIARIES
1312
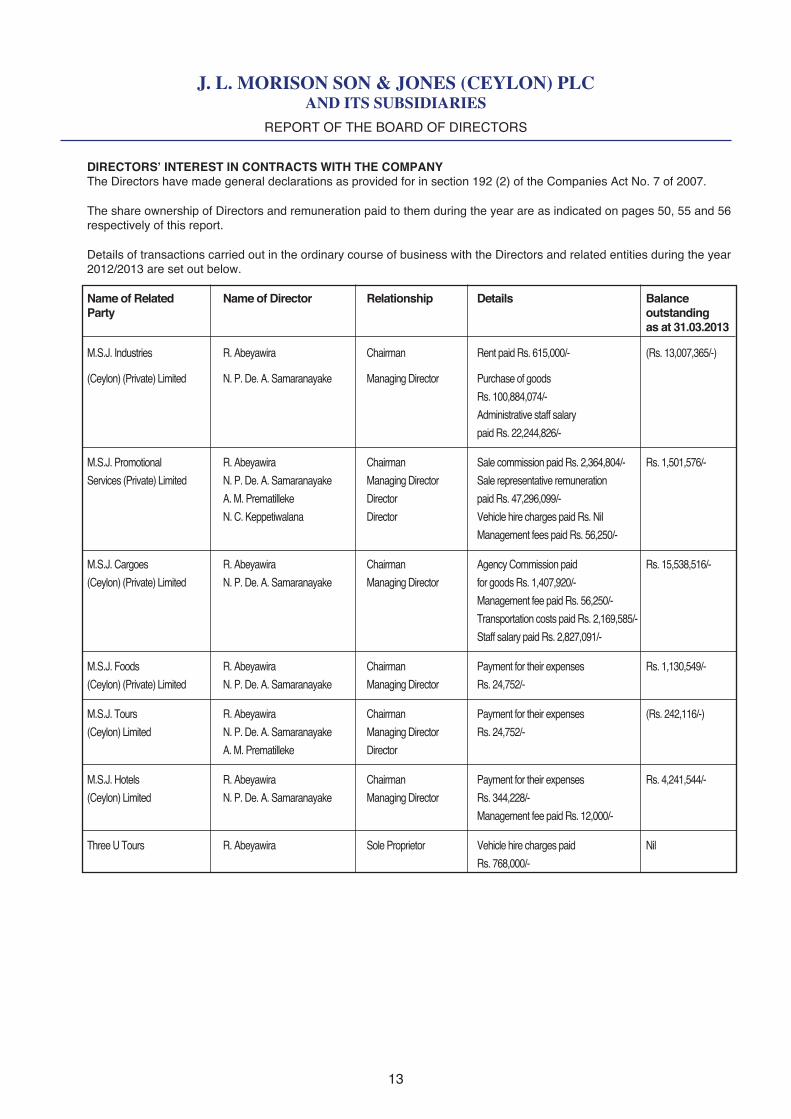
DIRECTORS’ INTEREST IN CONTRACTS WITH THE COMPANY The Directors have made general declarations as provided for in section 192 (2) of the Companies Act No. 7 of 2007.
The share ownership of Directors and remuneration paid to them during the year are as indicated on pages 50, 55 and 56 respectively of this report.
Details of transactions carried out in the ordinary course of business with the Directors and related entities during the year 2012/2013 are set out below.
Name of Related Name of Director Relationship Details Balance Party outstanding as at 31.03.2013
M.S.J. Industries R. Abeyawira Chairman Rent paid Rs. 615,000/- (Rs. 13,007,365/-)
(Ceylon) (Private) Limited N. P. De. A. Samaranayake Managing Director Purchase of goods
Rs. 100,884,074/-
Administrative staff salary
paid Rs. 22,244,826/-
M.S.J. Promotional R. Abeyawira Chairman Sale commission paid Rs. 2,364,804/- Rs. 1,501,576/-
Services (Private) Limited N. P. De. A. Samaranayake Managing Director Sale representative remuneration
A. M. Prematilleke Director paid Rs. 47,296,099/-
N. C. Keppetiwalana Director Vehicle hire charges paid Rs. Nil
Management fees paid Rs. 56,250/-
M.S.J. Cargoes R. Abeyawira Chairman Agency Commission paid Rs. 15,538,516/-
(Ceylon) (Private) Limited N. P. De. A. Samaranayake Managing Director for goods Rs. 1,407,920/-
Management fee paid Rs. 56,250/-
Transportation costs paid Rs. 2,169,585/-
Staff salary paid Rs. 2,827,091/-
M.S.J. Foods R. Abeyawira Chairman Payment for their expenses Rs. 1,130,549/-
(Ceylon) (Private) Limited N. P. De. A. Samaranayake Managing Director Rs. 24,752/-
M.S.J. Tours R. Abeyawira Chairman Payment for their expenses (Rs. 242,116/-)
(Ceylon) Limited N. P. De. A. Samaranayake Managing Director Rs. 24,752/-
A. M. Prematilleke Director
M.S.J. Hotels R. Abeyawira Chairman Payment for their expenses Rs. 4,241,544/-
(Ceylon) Limited N. P. De. A. Samaranayake Managing Director Rs. 344,228/-
Management fee paid Rs. 12,000/-
Three U Tours R. Abeyawira Sole Proprietor Vehicle hire charges paid Nil
Rs. 768,000/-
REPORT OF THE BOARD OF DIRECTORS
J. L. MORISON SON & JONES (CEYLON) PLCAND ITS SUBSIDIARIES
1514
STATEMENT OF DIRECTOR’S RESPONSIBILITIES
Company law requires the Directors to prepare Company and Group Financial Statements for each financial year. Under that
law they are required to prepare the Group Financial Statements in accordance with Section 152 of the Companies’ Act and the
Sri Lanka Accounting Standards. (SLFRS/LKAS)
The Group Financial Statements are required by law and the accounting standards to present fairly, the financial position and
performance of the Group; the Company Financial Statements are required by law to give a true and fair view of the state of
affairs of the Company.
In preparing the Company and Group Financial Statements, the Directors are required;
• to select suitable accounting policies and then apply them consistently;
• to make judgments and estimates that are reasonable and prudent;
• to state whether the Group Financial Statements have been prepared in accordance with the Companies’ Act and the
Accounting Standards.
• to state whether applicable Accounting Standards have been followed, subject to any material departures disclosed and
explained in preparing the Company’s Financial Statements, and
• prepare the Financial Statements on a ‘going concern basis’ unless it is inappropriate to presume the Group and the Company
will continue in operational business for the foreseeable future.
The Directors confirm that they have complied with the above requirements in preparing the Financial Statements.
The Directors are responsible for keeping proper accounting records that disclose with reasonable accuracy at any time the
financial position of the Company and Group and enable them to ensure that it’s Financial Statements comply with the Companies
Act No. 7 of 2007. They have general responsibility for taking such steps as are reasonably open to them to safeguard the assets
of the Group and to prevent and detect fraud and other irregularities.
Under applicable law and regulations, the Directors are also responsible for preparing a Directors’ Report, Directors’ Remuneration
Report and Corporate Governance Statement that comply with the law and those regulations.
Responsibility Statement of the Directors in respect of the Annual Report
We, the Directors of the Company, confirm that to the best of our knowledge the Financial Statements of the Company and the
Group have been prepared in accordance with applicable law and give a true and fair view of the assets, liabilities, financial
position and profit or loss of the Group; and the Directors’ Report includes a fair review of the development and performance of
the business and the position of the Group, together with a description of the principal risks and uncertainties that face the Group.
Anjula Prematilleke Husein Esufally Trihan Perera
Finance Director Chairman MD/CEO
Colombo
22nd August 2013
J. L. MORISON SON & JONES (CEYLON) PLCAND ITS SUBSIDIARIES
1514
HUSEIN ESUFALLY
Mr Husein Esufally serves as the Chairman of J. L. Morison Son
& Jones (Ceylon) PLC. He is also the Chief Executive Officer
of Hemas Holdings PLC, the ultimate Parent company. Mr.
Esufally was appointed a member of the Board of Management
of the Post Graduate Institute of Management in March 2012.
He has over 28 years experience and holds a BSc (Honours)
Degree in Electronics from the University of Sussex, UK. Other
directorships include Hemas Power PLC, Serendib Hotels PLC
and Hemas Manufacturing (Private) Ltd.
TRIHAN PERERA
Mr. Trihan Perera functions as the MD/CEO of the Company.
He is an Associate of the Chartered Institute of Management
Accountants, UK and holds an MBA with distinction from Keele
University, UK. Mr. Perera began his career at NDB and moved
to management consulting and academia. He has worked in
a wide range of industries including banking, shipping and
logistics, aviation, plantations, and FMCG in Sri Lanka and
overseas.
ASOKA ABEYEWARDENE
Mr. Abeyewardene is a Fellow of the Institute of Chartered
Accountants of Sri Lanka, a Fellow of the Society of Certified
Management Accountants of Sri Lanka and a Fellow of the
Institute of Directors UK. He was a former Partner of KPMG
Ford Rhodes Thornton & Co., Chartered Accountants. He is
an independent Director of DFCC Bank, Independent Director
of Ceylon Hospitals PLC and is the Chairman of the Audit
& Remuneration Committees of this company. He is also
an Independent Director of Durdans Medical and Surgical
Hospitals (Pvt) Ltd. He also serves as an Independent Director
of J. L. Morison Son & Jones (Ceylon) PLC and is the Chairman
of the Audit and Remuneration Committees.
PROFESSOR RAVINDRA FERNANDO
Professor Ravindra Fernando is the Senior Professor of
Forensic Medicine and Toxicology at the University of Colombo,
Sri Lanka.
He has served as a Senior Lecturer in the Division of Forensic
Medicine of the United Medical and Dental schools of Guy’s
and St. Thomas’s Hospital, University of London and the
Department of Forensic Medicine and Science in the University
of Glasgow. He was a Consultant Home Office (England and
Wales) and a Crown Office Pathologist in Scotland.
He was a Founder Secretary General of the Indo-Pacific
Association of Law, Medicine and Science and past President
of the Ceylon College of Physicians, Sri Lanka Medical
Association and the College of Forensic Pathologists of Sri
Lanka Asia-Pacific Association of Medical Toxicology.
He was the Founder Head of the National Poisons Information
Centre, National Hospital of Sri Lanka, Colombo. He has also
served as the Chairman of the Dangerous Drugs Control Board.
STEVEN ENDERBY
Mr. Enderby has a long and successful track record in the
private equity space, with Actis, a leading global emerging
markets fund. During his career, he has worked for Actis in
UK, Uganda, Swaziland, Sri Lanka and most recently in India,
finally retiring as an Actis Partner in 2011. He has led multiple
successful private equity transactions in Sri Lanka including
South Asia Gateway Terminals, Ceylon Oxygen and Millennium
information Technologies. He has served on the Boards of
many leading businesses in India and Sri Lanka including John
Keells Holdings, Lion Brewery and Punjab Tractors.
He holds a Masters of Development studies from the University
of Melbourne, Bsc (Econ) Hons in Economics and Accounting
from Queens University, Belfast and is also a Member of the
Chartered Institute of Management Accountants.
DIRECTORS’ PROFILE

1716
INDEPENDENT AUDITORS’ REPORTTO THE SHAREHOLDERS OF J. L. MORISON SON & JONES (CEYLON) PLC
Report on the Financial StatementsWe have audited the accompanying Financial Statements of J. L. Morison Son & Jones (Ceylon) PLC (“Company”), the Consolidated Financial Statements of the Company and its subsidiaries which Comprise the Statements of Financial Position as at 31 March 2013, and the Income Statements, Statements of Comprehensive Income, Statements of Changes in Equity and Cash Flow Statements for the year then ended, and a summary of significant accounting policies and other explanatory notes.
Management’s Responsibility for the Financial StatementsManagement is responsible for the preparation and fair presentation of these Financial Statements in accordance with Sri Lanka Accounting Standards. This responsibility includes: designing, implementing and maintaining internal control relevant to the preparation and fair presentation of Financial Statements that are free from material misstatement, whether due to fraud or error, selecting and applying appropriate accounting policies, and making accounting estimates that are reasonable in the circumstances.
Scope of Audit and Basis of OpinionOur responsibility is to express an opinion on these Financial Statements based on our audit. We conducted our audit in accordance with Sri Lanka Auditing Standards. Those standards require that we plan and perform the audit to obtain reasonable assurance whether the financial statements are free from material misstatement.
An audit includes examining, on a test basis, evidence supporting the amounts and disclosures in the financial statements. An audit also includes assessing the accounting policies used and significant estimates made by management, as well as evaluating the overall financial statement presentation.
We have obtained all the information and explanations which to the best of our knowledge and belief were necessary for the purposes of our audit. We therefore believe that our audit provides a reasonable basis for our opinion.
OpinionIn our opinion, so far as appears from our examination, the Company maintained proper accounting records for the year ended 31 March 2013 and the financial statements give a true and fair view of the financial position of the Company as at 31 March 2013 and its financial performance and cash flows for the year then ended in accordance with Sri Lanka Accounting Standards.
In our opinion, the Consolidated Financial Statements give a true and fair view of the financial position as at 31 March 2013 and its financial performance and cash flows for the year then ended in accordance with Sri Lanka Accounting Standards, of the Company and its Subsidiaries dealt with thereby, so far as concerns of the shareholders of the Company.
Report on Other Legal and Regulatory RequirementsThese financial statements also comply with the requirements of Section 151(2) and 153 (2) to 153 (7) of the Companies Act No.7 of 2007.
22 August, 2013Colombo
J. L. MORISON SON & JONES (CEYLON) PLCAND ITS SUBSIDIARIES
1716
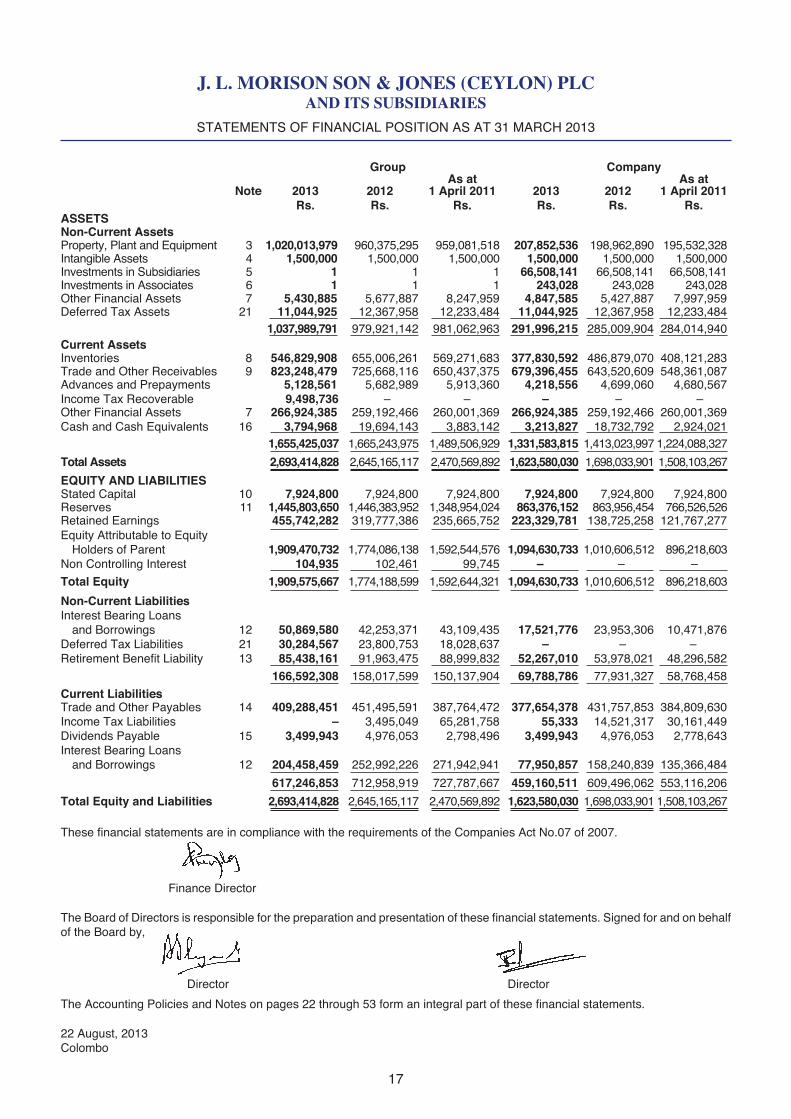
STATEMENTS OF FINANCIAL POSITION AS AT 31 MARCH 2013
Group Company As at As at Note 2013 2012 1 April 2011 2013 2012 1 April 2011 Rs. Rs. Rs. Rs. Rs. Rs.ASSETSNon-Current Assets Property, Plant and Equipment 3 1,020,013,979 960,375,295 959,081,518 207,852,536 198,962,890 195,532,328 Intangible Assets 4 1,500,000 1,500,000 1,500,000 1,500,000 1,500,000 1,500,000Investments in Subsidiaries 5 1 1 1 66,508,141 66,508,141 66,508,141 Investments in Associates 6 1 1 1 243,028 243,028 243,028Other Financial Assets 7 5,430,885 5,677,887 8,247,959 4,847,585 5,427,887 7,997,959 Deferred Tax Assets 21 11,044,925 12,367,958 12,233,484 11,044,925 12,367,958 12,233,484 1,037,989,791 979,921,142 981,062,963 291,996,215 285,009,904 284,014,940 Current AssetsInventories 8 546,829,908 655,006,261 569,271,683 377,830,592 486,879,070 408,121,283 Trade and Other Receivables 9 823,248,479 725,668,116 650,437,375 679,396,455 643,520,609 548,361,087 Advances and Prepayments 5,128,561 5,682,989 5,913,360 4,218,556 4,699,060 4,680,567Income Tax Recoverable 9,498,736 – – – – –Other Financial Assets 7 266,924,385 259,192,466 260,001,369 266,924,385 259,192,466 260,001,369 Cash and Cash Equivalents 16 3,794,968 19,694,143 3,883,142 3,213,827 18,732,792 2,924,021 1,655,425,037 1,665,243,975 1,489,506,929 1,331,583,815 1,413,023,997 1,224,088,327 Total Assets 2,693,414,828 2,645,165,117 2,470,569,892 1,623,580,030 1,698,033,901 1,508,103,267 EQUITY AND LIABILITIES Stated Capital 10 7,924,800 7,924,800 7,924,800 7,924,800 7,924,800 7,924,800 Reserves 11 1,445,803,650 1,446,383,952 1,348,954,024 863,376,152 863,956,454 766,526,526 Retained Earnings 455,742,282 319,777,386 235,665,752 223,329,781 138,725,258 121,767,277 Equity Attributable to Equity Holders of Parent 1,909,470,732 1,774,086,138 1,592,544,576 1,094,630,733 1,010,606,512 896,218,603Non Controlling Interest 104,935 102,461 99,745 – – – Total Equity 1,909,575,667 1,774,188,599 1,592,644,321 1,094,630,733 1,010,606,512 896,218,603 Non-Current Liabilities Interest Bearing Loans and Borrowings 12 50,869,580 42,253,371 43,109,435 17,521,776 23,953,306 10,471,876 Deferred Tax Liabilities 21 30,284,567 23,800,753 18,028,637 – – –Retirement Benefit Liability 13 85,438,161 91,963,475 88,999,832 52,267,010 53,978,021 48,296,582 166,592,308 158,017,599 150,137,904 69,788,786 77,931,327 58,768,458 Current LiabilitiesTrade and Other Payables 14 409,288,451 451,495,591 387,764,472 377,654,378 431,757,853 384,809,630 Income Tax Liabilities – 3,495,049 65,281,758 55,333 14,521,317 30,161,449Dividends Payable 15 3,499,943 4,976,053 2,798,496 3,499,943 4,976,053 2,778,643 Interest Bearing Loans and Borrowings 12 204,458,459 252,992,226 271,942,941 77,950,857 158,240,839 135,366,484 617,246,853 712,958,919 727,787,667 459,160,511 609,496,062 553,116,206 Total Equity and Liabilities 2,693,414,828 2,645,165,117 2,470,569,892 1,623,580,030 1,698,033,901 1,508,103,267
These financial statements are in compliance with the requirements of the Companies Act No.07 of 2007.
Finance Director
The Board of Directors is responsible for the preparation and presentation of these financial statements. Signed for and on behalf of the Board by,
Director Director
The Accounting Policies and Notes on pages 22 through 53 form an integral part of these financial statements.
22 August, 2013Colombo
J. L. MORISON SON & JONES (CEYLON) PLCAND ITS SUBSIDIARIES
1918
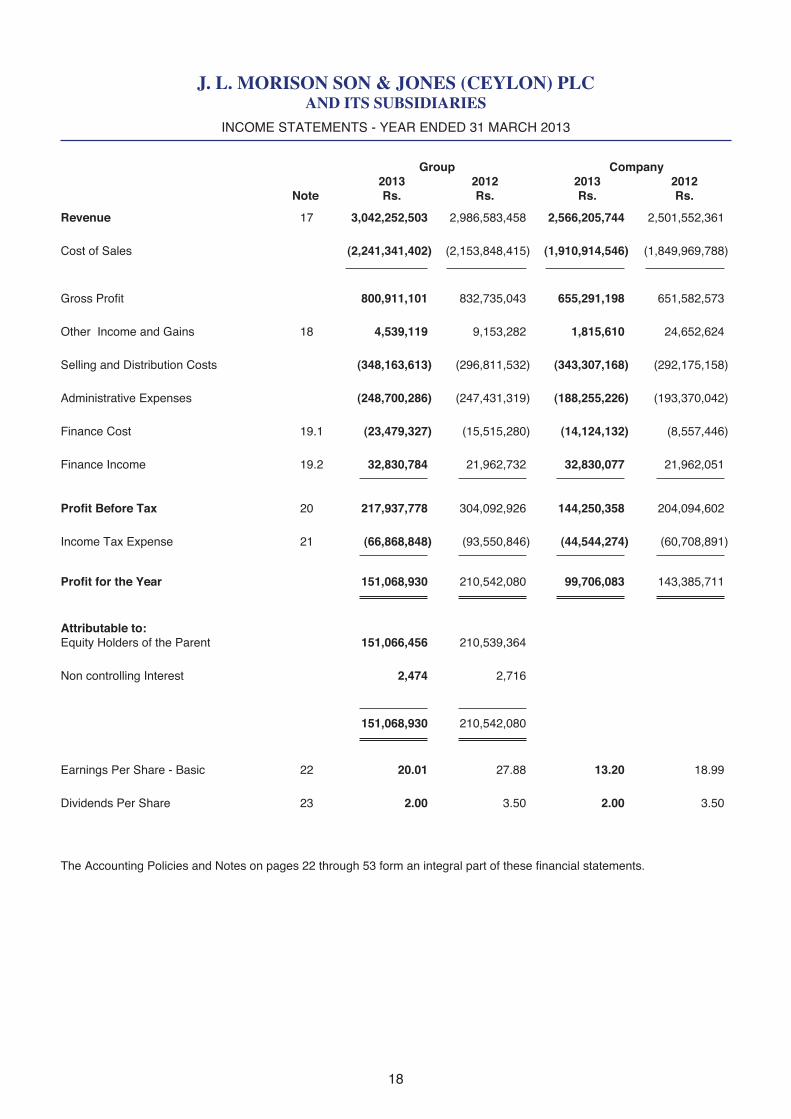
INCOME STATEMENTS - YEAR ENDED 31 MARCH 2013
Group Company 2013 2012 2013 2012 Note Rs. Rs. Rs. Rs.
Revenue 17 3,042,252,503 2,986,583,458 2,566,205,744 2,501,552,361
Cost of Sales (2,241,341,402) (2,153,848,415) (1,910,914,546) (1,849,969,788)
Gross Profit 800,911,101 832,735,043 655,291,198 651,582,573
Other Income and Gains 18 4,539,119 9,153,282 1,815,610 24,652,624
Selling and Distribution Costs (348,163,613) (296,811,532) (343,307,168) (292,175,158)
Administrative Expenses (248,700,286) (247,431,319) (188,255,226) (193,370,042)
Finance Cost 19.1 (23,479,327) (15,515,280) (14,124,132) (8,557,446)
Finance Income 19.2 32,830,784 21,962,732 32,830,077 21,962,051
Profit Before Tax 20 217,937,778 304,092,926 144,250,358 204,094,602
Income Tax Expense 21 (66,868,848) (93,550,846) (44,544,274) (60,708,891)
Profit for the Year 151,068,930 210,542,080 99,706,083 143,385,711
Attributable to:Equity Holders of the Parent 151,066,456 210,539,364
Non controlling Interest 2,474 2,716
151,068,930 210,542,080
Earnings Per Share - Basic 22 20.01 27.88 13.20 18.99
Dividends Per Share 23 2.00 3.50 2.00 3.50
The Accounting Policies and Notes on pages 22 through 53 form an integral part of these financial statements.
J. L. MORISON SON & JONES (CEYLON) PLCAND ITS SUBSIDIARIES
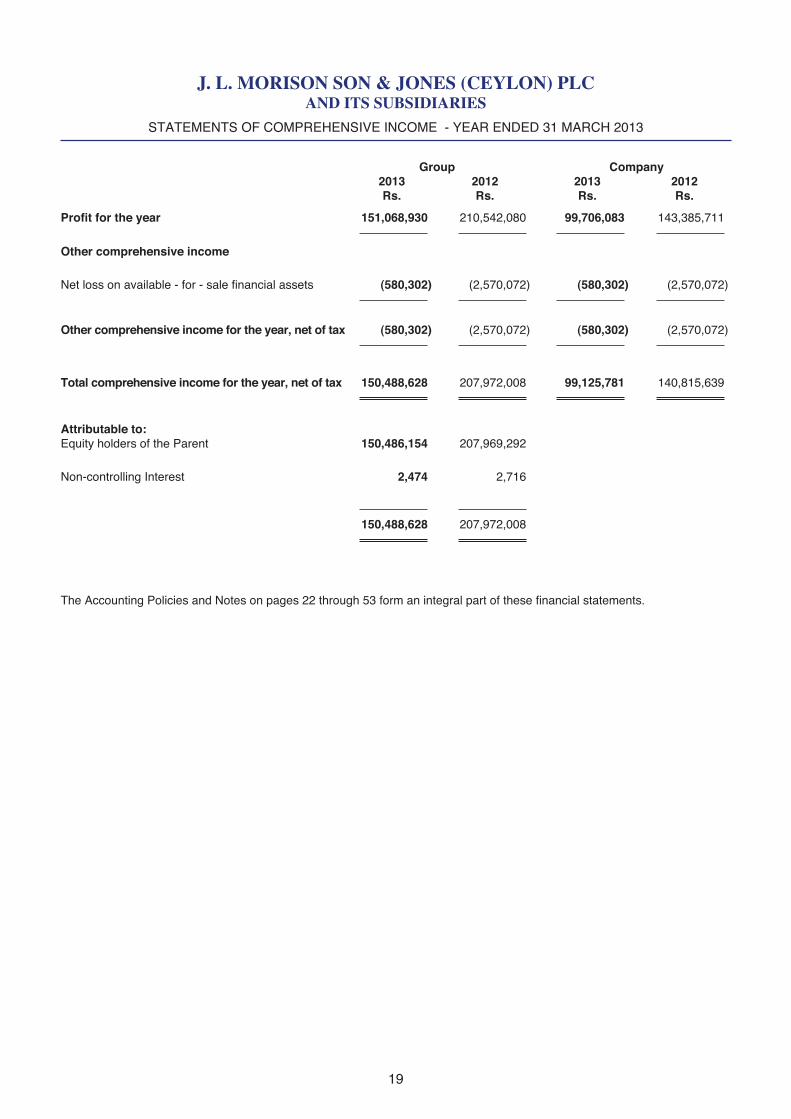
1918
Group Company 2013 2012 2013 2012 Rs. Rs. Rs. Rs.
Profit for the year 151,068,930 210,542,080 99,706,083 143,385,711
Other comprehensive income
Net loss on available - for - sale financial assets (580,302) (2,570,072) (580,302) (2,570,072)
Other comprehensive income for the year, net of tax (580,302) (2,570,072) (580,302) (2,570,072)
Total comprehensive income for the year, net of tax 150,488,628 207,972,008 99,125,781 140,815,639
Attributable to:Equity holders of the Parent 150,486,154 207,969,292
Non-controlling Interest 2,474 2,716
150,488,628 207,972,008
The Accounting Policies and Notes on pages 22 through 53 form an integral part of these financial statements.
STATEMENTS OF COMPREHENSIVE INCOME - YEAR ENDED 31 MARCH 2013
J. L. MORISON SON & JONES (CEYLON) PLCAND ITS SUBSIDIARIES
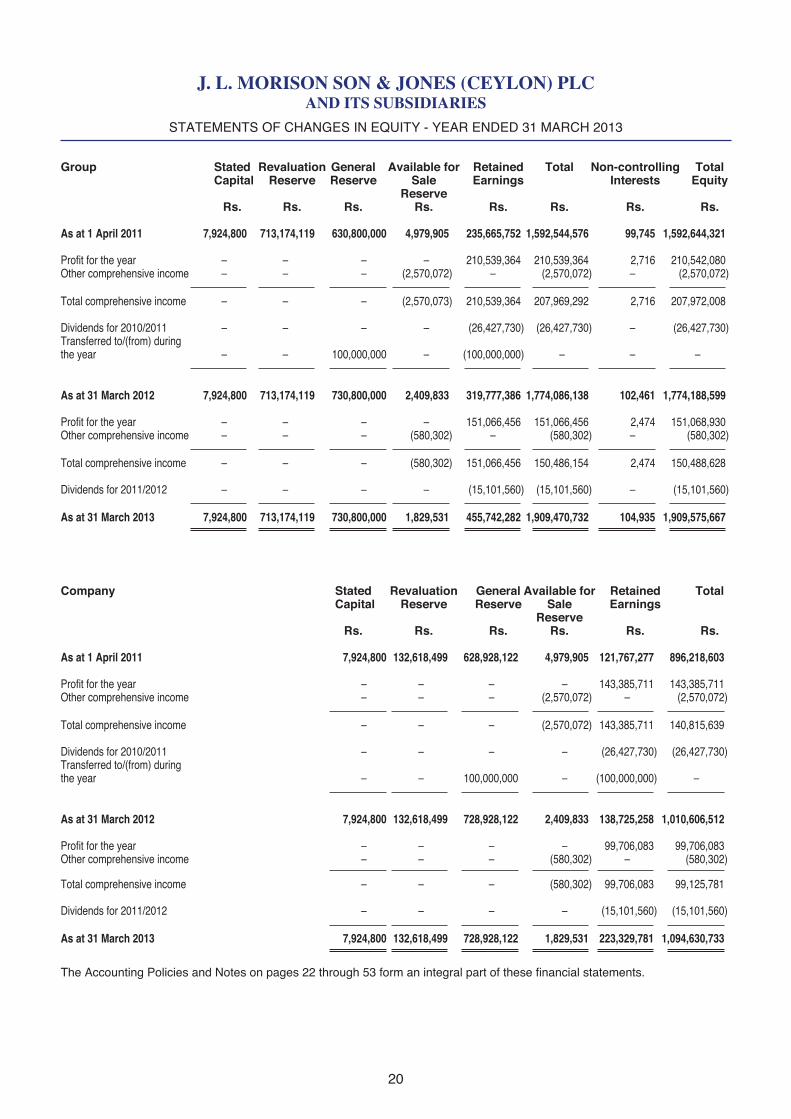
2120
Group Stated Revaluation General Available for Retained Total Non-controlling Total Capital Reserve Reserve Sale Earnings Interests Equity Reserve Rs. Rs. Rs. Rs. Rs. Rs. Rs. Rs.
As at 1 April 2011 7,924,800 713,174,119 630,800,000 4,979,905 235,665,752 1,592,544,576 99,745 1,592,644,321
Profit for the year – – – – 210,539,364 210,539,364 2,716 210,542,080Other comprehensive income – – – (2,570,072) – (2,570,072) – (2,570,072) Total comprehensive income – – – (2,570,073) 210,539,364 207,969,292 2,716 207,972,008
Dividends for 2010/2011 – – – – (26,427,730) (26,427,730) – (26,427,730)Transferred to/(from) duringthe year – – 100,000,000 – (100,000,000) – – –
As at 31 March 2012 7,924,800 713,174,119 730,800,000 2,409,833 319,777,386 1,774,086,138 102,461 1,774,188,599
Profit for the year – – – – 151,066,456 151,066,456 2,474 151,068,930Other comprehensive income – – – (580,302) – (580,302) – (580,302) Total comprehensive income – – – (580,302) 151,066,456 150,486,154 2,474 150,488,628
Dividends for 2011/2012 – – – – (15,101,560) (15,101,560) – (15,101,560) As at 31 March 2013 7,924,800 713,174,119 730,800,000 1,829,531 455,742,282 1,909,470,732 104,935 1,909,575,667
Company Stated Revaluation General Available for Retained Total Capital Reserve Reserve Sale Earnings Reserve Rs. Rs. Rs. Rs. Rs. Rs.
As at 1 April 2011 7,924,800 132,618,499 628,928,122 4,979,905 121,767,277 896,218,603
Profit for the year – – – – 143,385,711 143,385,711Other comprehensive income – – – (2,570,072) – (2,570,072) Total comprehensive income – – – (2,570,072) 143,385,711 140,815,639
Dividends for 2010/2011 – – – – (26,427,730) (26,427,730)Transferred to/(from) duringthe year – – 100,000,000 – (100,000,000) –
As at 31 March 2012 7,924,800 132,618,499 728,928,122 2,409,833 138,725,258 1,010,606,512
Profit for the year – – – – 99,706,083 99,706,083Other comprehensive income – – – (580,302) – (580,302) Total comprehensive income – – – (580,302) 99,706,083 99,125,781
Dividends for 2011/2012 – – – – (15,101,560) (15,101,560) As at 31 March 2013 7,924,800 132,618,499 728,928,122 1,829,531 223,329,781 1,094,630,733
The Accounting Policies and Notes on pages 22 through 53 form an integral part of these financial statements.
STATEMENTS OF CHANGES IN EQUITY - YEAR ENDED 31 MARCH 2013

J. L. MORISON SON & JONES (CEYLON) PLCAND ITS SUBSIDIARIES
2120
CASH FLOW STATEMENTS - YEAR ENDED 31 MARCH 2013
Group Company 2013 2012 2013 2012 Cash Flows from Operating Activities Note Rs. Rs. Rs. Rs.Profit before Income Tax Expense 217,937,778 304,092,926 144,250,358 204,094,602 Adjustments for Dividend Income 18 (382,775) (383,666) (382,775) (17,383,666) Depreciation 3 36,380,299 33,127,937 26,766,606 23,986,590 (Profit)/Loss on Sales of Property, Plant & Equipment (2,597,302) (6,201,696) (672,302) (5,151,696) Interest Income 19.2 (32,830,784) (21,962,732) (32,830,077) (21,962,051) Finance Costs 19.1 23,479,327 15,515,280 14,124,132 8,557,446 Fall in Value of Investments – – – – Provision for Defined Benefit Plans - Gratuity 13 (57,550) 11,235,123 47,659 10,103,400 Operating Profit before Working Capital Changes 241,928,992 335,423,172 151,303,601 202,244,625
(Increase)/ Decrease in Inventories 108,176,353 (85,734,578) 109,048,478 (78,757,787) Increase in Trade and Other Receivables (97,580,363) (75,230,741) (35,875,846) (95,159,522) (Increase)/ Decrease in advances and Prepayments 554,428 230,371 480,504 (18,493) Increase/(Decrease) in Trade and Other Payables (42,207,140) 63,731,119 (54,103,475) 62,248,223 Cash Generated from Operations 210,872,270 238,419,343 170,853,262 90,557,046
Finance Costs Paid (23,479,327) (15,515,280) (14,124,132) (8,557,446) Defined Benefit Plan Costs Paid 13 (6,467,764) (8,271,480) (1,758,670) (4,421,961) Income Tax Paid (72,055,783) (149,699,915) (57,687,224) (74,783,497) Net Cash Flows from Operating Activities 108,869,396 64,932,668 97,283,236 2,794,142
Cash Flows used in Investing Activities Acquisition of Property, Plant & Equipment 3 (94,155,365) (35,981,713) (33,792,635) (28,977,152) Proceeds from Sale of Property, Plant & Equipment 3,397,789 7,761,696 1,472,790 6,711,696 Dividends Received 382,775 383,666 382,775 383,666 Net Cash Flows From/(Used in) Investing Activities (90,374,801) (27,836,351) (31,937,070) (21,881,790)
Cash Flows From/(Used in) Financing Activities Proceeds From Interest Bearing Loans and Borrowings 35,000,000 25,061,175 – 25,061,175 Repayment of Interest Bearing Loans and Borrowings (55,142,594) (59,538,716) (69,701,736) (9,654,618) Principal Payments under Finance Lease Liabilities (6,257,776) (6,585,681) (3,659,318) (4,378,359) Dividends Paid (16,577,670) (24,250,173) (16,577,670) (24,230,320) Interest Received 24,765,565 22,771,635 25,098,158 22,770,954 Net Cash flows From/(Used in) Financing Activities (18,212,475) (42,541,760) (64,840,566) 9,568,832
Net Decrease in Cash and Cash Equivalents 282,120 (5,445,443) 505,600 (9,518,816)
Cash & Cash Equivalents at the beginning of the year 16 (41,422,396) (35,976,953) (36,920,521) (27,401,705) Cash and Cash Equivalents at the end of the year 16 (41,140,276) (41,422,396) (36,414,921) (36,920,521)
The Accounting Policies and Notes on pages 22 through 53 form an integral part of these financial statements.
J. L. MORISON SON & JONES (CEYLON) PLCAND ITS SUBSIDIARIES
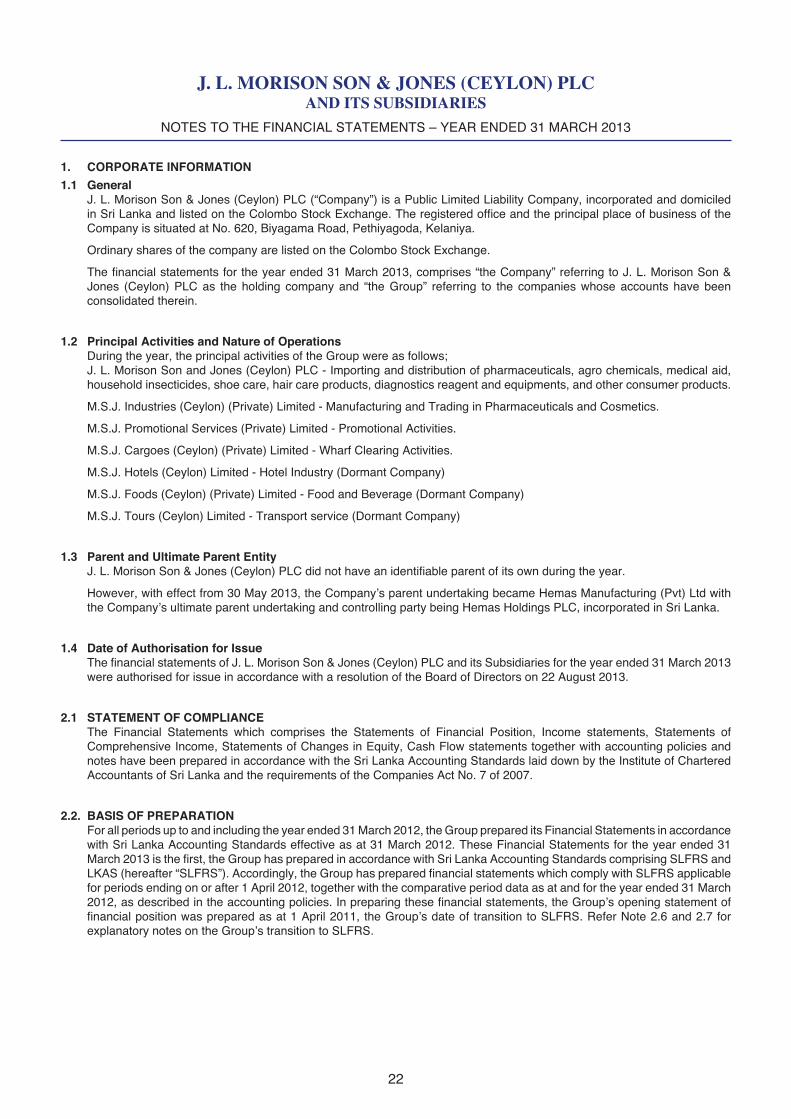
2322
1. CORPORATE INFORMATION1.1 General J. L. Morison Son & Jones (Ceylon) PLC (“Company”) is a Public Limited Liability Company, incorporated and domiciled
in Sri Lanka and listed on the Colombo Stock Exchange. The registered office and the principal place of business of the Company is situated at No. 620, Biyagama Road, Pethiyagoda, Kelaniya.
Ordinary shares of the company are listed on the Colombo Stock Exchange.
The financial statements for the year ended 31 March 2013, comprises “the Company” referring to J. L. Morison Son & Jones (Ceylon) PLC as the holding company and “the Group” referring to the companies whose accounts have been consolidated therein.
1.2 Principal Activities and Nature of Operations During the year, the principal activities of the Group were as follows; J. L. Morison Son and Jones (Ceylon) PLC - Importing and distribution of pharmaceuticals, agro chemicals, medical aid,
household insecticides, shoe care, hair care products, diagnostics reagent and equipments, and other consumer products.
M.S.J. Industries (Ceylon) (Private) Limited - Manufacturing and Trading in Pharmaceuticals and Cosmetics.
M.S.J. Promotional Services (Private) Limited - Promotional Activities.
M.S.J. Cargoes (Ceylon) (Private) Limited - Wharf Clearing Activities.
M.S.J. Hotels (Ceylon) Limited - Hotel Industry (Dormant Company)
M.S.J. Foods (Ceylon) (Private) Limited - Food and Beverage (Dormant Company)
M.S.J. Tours (Ceylon) Limited - Transport service (Dormant Company)
1.3 Parent and Ultimate Parent Entity J. L. Morison Son & Jones (Ceylon) PLC did not have an identifiable parent of its own during the year.
However, with effect from 30 May 2013, the Company’s parent undertaking became Hemas Manufacturing (Pvt) Ltd with the Company’s ultimate parent undertaking and controlling party being Hemas Holdings PLC, incorporated in Sri Lanka.
1.4 Date of Authorisation for Issue The financial statements of J. L. Morison Son & Jones (Ceylon) PLC and its Subsidiaries for the year ended 31 March 2013
were authorised for issue in accordance with a resolution of the Board of Directors on 22 August 2013.
2.1 STATEMENT OF COMPLIANCE The Financial Statements which comprises the Statements of Financial Position, Income statements, Statements of
Comprehensive Income, Statements of Changes in Equity, Cash Flow statements together with accounting policies and notes have been prepared in accordance with the Sri Lanka Accounting Standards laid down by the Institute of Chartered Accountants of Sri Lanka and the requirements of the Companies Act No. 7 of 2007.
2.2. BASIS OF PREPARATION For all periods up to and including the year ended 31 March 2012, the Group prepared its Financial Statements in accordance
with Sri Lanka Accounting Standards effective as at 31 March 2012. These Financial Statements for the year ended 31 March 2013 is the first, the Group has prepared in accordance with Sri Lanka Accounting Standards comprising SLFRS and LKAS (hereafter “SLFRS”). Accordingly, the Group has prepared financial statements which comply with SLFRS applicable for periods ending on or after 1 April 2012, together with the comparative period data as at and for the year ended 31 March 2012, as described in the accounting policies. In preparing these financial statements, the Group’s opening statement of financial position was prepared as at 1 April 2011, the Group’s date of transition to SLFRS. Refer Note 2.6 and 2.7 for explanatory notes on the Group’s transition to SLFRS.
NOTES TO THE FINANCIAL STATEMENTS – YEAR ENDED 31 MARCH 2013
J. L. MORISON SON & JONES (CEYLON) PLCAND ITS SUBSIDIARIES
2322
NOTES TO THE FINANCIAL STATEMENTS – YEAR ENDED 31 MARCH 2013 (Contd.)
2.3 SUMMARY OF SIGNIFICANT ACCOUNTING POLICIES2.3.1 Basis of Consolidation The consolidated financial statements comprise the financial statements of J. L. Morison Son & Jones (Ceylon) PLC and
its Subsidiaries, M.S.J. Industries (Ceylon) (Private) Limited, M.S.J. Cargoes (Ceylon) (Private) Limited, M.S.J. Foods (Ceylon) (Private) Limited, M.S.J. Tours (Ceylon) Limited, M.S.J. Promotional Services (Ceylon) (Private) Limited and M.S.J. Hotels (Ceylon) Limited, for the year ended 31 March 2013, which are incorporated in Sri Lanka.
The financial statements of the subsidiaries are prepared for the same reporting period as the parent company, using consistent accounting policies. All intra-group balances, transactions, unrealised gains and losses resulting from intra-group transactions and dividends are eliminated in full.
The financial statements of Compak Morison (Lanka) Limited, have been excluded from consolidation from the year 1998 under Section 146 (2) B (ii) of the Companies Act. No 17 of 1982 and under the Section 153 (6) (B) of the Companies Act No.7 of 2007.
As per the letter given by Messrs. Julius & Creasy, on February 11, 1998, the movable and immovable properties of Compak Morison (Lanka) Limited, which were under mortgage to the National Development Bank (NDB) were handed over to the NDB in exercise of the rights of parate execution, NDB having advertised the property for sale in the public auction brought it in, at the auction towards the claim of NDB.
Subsidiaries Subsidiaries are those enterprises controlled by the parent. Control exists when the parent holds more than 50% of the
voting rights or otherwise has a controlling interest.
Subsidiaries are fully consolidated from the date of acquisition or incorporation, being the date on which the Group obtains control, and continue to be consolidated until the date that such control ceases.
The financial statements of the subsidiaries are prepared for the same reporting period as the parent Company, which is 12 months ending 31 March, using consistent accounting policies.
Accounting for Investments in Associate Company In the consolidated financial statements, Investments in Associate Companies are accounted for on the equity basis of
accounting where the value of the investment is increased or decreased to recognise the group’s share of profit or loss of such Company after the date of acquisition of the investment.
In the consolidated financial statements, Investments in Associate Company are carried forward at the value adjusted to reflect the group’s share of the fair value of net assets of the associate, net of any dividends declared by such Associate.
2.3.2 Foreign Currency Translation The Financial Statements are presented in Sri Lankan Rupees, which is the Company’s functional and presentation
currency. Transactions in foreign currencies are initially recorded at the functional currency rate ruling at the date of the transaction. Monetary assets and liabilities denominated in foreign currencies are retranslated at the functional currency rate of exchange ruling at the reporting date. All differences are taken to the income statement. Non monetary items that are measured in terms of historical cost in a foreign currency are translated using the exchange rates as at the dates of the initial transactions. Non monetary items measured at fair value in a foreign currency are translated using the exchange rates at the date when the fair value was determined.
2.3.3 Taxation a) Current Income Tax Current income tax assets and liabilities for the current period are measured at the amount expected to be recovered
from or paid to the taxation authorities. The tax rates and tax laws used to compute the amount are those that are enacted or substantively enacted, at the reporting date in the countries where the Group operates and generates taxable income.
Current income tax relating to items recognized directly in Other Comprehensive Income are also recognized in Other Comprehensive Income and not in the Income Statement. Management periodically evaluates positions taken in the tax returns with respect to situations in which applicable tax regulations are subject to interpretation and establishes provisions where appropriate.
J. L. MORISON SON & JONES (CEYLON) PLCAND ITS SUBSIDIARIES
2524
NOTES TO THE FINANCIAL STATEMENTS – YEAR ENDED 31 MARCH 2013 (Contd.)
b) Deferred Tax Deferred tax is provided using the liability method on temporary differences at the reporting date between the tax
bases of assets and liabilities and their carrying amounts for financial reporting purposes. Deferred tax liabilities are recognised for all taxable temporary differences, except:
• Where the deferred tax liability arises from the initial recognition of goodwill or of an asset or liability in a transaction that is not a business combination and, at the time of the transaction, affects neither the accounting profit nor taxable profit or loss.
• In respect of taxable temporary differences associated with investments in subsidiaries, associates and interests in joint ventures, where the timing of the reversal of the temporary differences can be controlled and it is probable that the temporary differences will not reverse in the foreseeable future.
Deferred tax assets are recognised for all deductible temporary differences, carry forward of unused tax credits and unused tax losses, to the extent that it is probable that taxable profit will be available against which the deductible temporary differences, and the carry forward of unused tax credits and unused tax losses can be utilised, except:
• Where the deferred tax asset relating to the deductible temporary difference arises from the initial recognition of an asset or liability in a transaction that is not a business combination and, at the time of the transaction, affects neither the accounting profit nor taxable profit or loss.
• In respect of deductible temporary differences associated with investments in subsidiaries, associates and interests in joint ventures, deferred tax assets are recognised only to the extent that it is probable that the temporary differences will reverse in the foreseeable future and taxable profit will be available against which the temporary differences can be utilised.
The carrying amount of deferred tax assets is reviewed at each reporting date and reduced to the extent that it is no longer probable that sufficient taxable profit will be available to allow all or part of the deferred tax asset to be utilised. Unrecognised deferred tax assets are reassessed at each reporting date and are recognised to the extent that it has become probable that future taxable profits will allow the deferred tax asset to be recovered. Deferred tax assets and liabilities are measured at the tax rates that are expected to apply in the year when the asset is realised or the liability is settled, based on tax rates (and tax laws) that have been enacted or substantively enacted at the reporting date.
Deferred tax relating to items recognised outside profit or loss is recognised outside profit or loss. Deferred tax items are recognised in correlation to the underlying transaction either in other comprehensive income or directly in equity. Deferred tax assets and deferred tax liabilities are offset if a legally enforceable right exists to set off current tax assets against current income tax liabilities and the deferred taxes relate to the same taxable entity and the same taxation authority.
c) Sales Tax Revenues, expenses and assets are recognised net of the amount of sales tax, except:
• Where the sales tax incurred on a purchase of assets or services is not recoverable from the taxation authority, in which case the sales tax is recognised as part of the cost of acquisition of the asset or as part of the expense item as applicable
• Receivables and payables are stated with the amount of sales tax included. The net amount of sales tax recoverable from, or payable to, the taxation authority is included as part of receivables or payables in the statement of financial position.
2.3.4. Property, Plant and Equipment
Basis of measurement Property, plant and equipment are measured at cost less accumulated depreciation and accumulated impairment losses, if
any. Such cost includes the cost of replacing parts of the property, plant and equipment and borrowing costs for long-term construction projects if the recognition criteria are met. When significant parts of property, plant and equipment are required to be replaced at intervals, the Group recognises such parts as individual assets with specific useful lives and depreciates them accordingly. Likewise, when a major inspection is performed, its cost is recognised in the carrying amount of the plant and equipment as a replacement if the recognition criteria are satisfied. All other repair and maintenance costs are recognised in the profit or loss as incurred. (if applicable) The present value of the expected cost for the decommissioning of the asset after its use, is included in the cost of the respective asset if the recognition criteria for a provision are met.
Land and buildings are subsequently measured at fair value, less accumulated depreciation on buildings, and impairment losses recognised at the date of revaluation. Valuations are performed with sufficient frequency to ensure that the fair value of a revalued asset does not differ materially from its carrying amount.
J. L. MORISON SON & JONES (CEYLON) PLCAND ITS SUBSIDIARIES
2524
Depreciation is calculated on a straight-line basis over the useful life of assets or components. The residual values, useful lives and methods of depreciation of property, plant and equipment are reviewed at each financial year end and adjusted prospectively, if appropriate.
A revaluation surplus is recognised in other comprehensive income and credited to the revaluation surplus in equity. However, to the extent that it reverses a revaluation deficit of the same asset previously recognised in the income statement, in which case the increase is recognised in the income statement. A revaluation deficit is recognised in the income statement, except to the extent that it offsets an existing surplus on the same asset recognised in the asset revaluation reserve. Upon disposal, any revaluation reserve relating to the particular asset being sold is transferred to retained earnings.
An item of property, plant and equipment is derecognised upon disposal or when no future economic benefits are expected from its use or disposal. Any gain or loss arising on derecognition of the asset (calculated as the difference between the net disposal proceeds and the carrying amount of the asset) is included in the income statement when the asset is derecognised.
Depreciation Depreciation is calculated by using a straight-line method on the cost of all property, plant and equipment, other than
freehold land, in order to write off such amounts over the estimated useful economic life of such assets. The estimated useful life of assets; Freehold Buildings 40 Years
Plant and Machinery 13.33 Years
Furniture and Fittings 10 Years
Motor Vehicles 5 Years
Office Equipment 5 Years
2.3.5 Leases The determination of whether an arrangement is, or contains, a lease is based on the substance of the arrangement at
the inception date, whether fulfilment of the arrangement is dependent on the use of a specific asset or assets or the arrangement conveys a right to use the asset, even if that right is not explicitly specified in an arrangement.
For arrangements entered into prior to 1 April 2011, the date of inception is deemed to be 1 April 2011 in accordance with the SLFRS 1.
Group as a lessee Finance leases which transfer to the Group substantially all the risks and benefits incidental to ownership of the leased item,
are capitalised at the commencement of the lease at the fair value of the leased property or, if lower, at the present value of the minimum lease payments. Lease payments are apportioned between finance charges and reduction of the lease liability so as to achieve a constant rate of interest on the remaining balance of the liability. Finance charges are recognised in finance costs in the income statement.
A leased asset is depreciated over the useful life of the asset. However, if there is no reasonable certainty that the Group will obtain ownership by the end of the lease term, the asset is depreciated over the shorter of the estimated useful life of the asset and the lease term.
Operating lease payments are recognised as an operating expense in the income statement on a straight-line basis over the lease term.
2.3.6 Borrowing Costs Borrowing costs directly attributable to the acquisition, construction or production of an asset that necessarily takes a
substantial period of time to get ready for its intended use or sale are capitalised as part of the cost of the respective assets. All other borrowing costs are expensed in the period they occur. Borrowing costs consist of interest and other costs that an entity incurs in connection with the borrowing of funds.
2.3.7 Intangible Assets Intangible assets acquired separately are measured on initial recognition at cost. Following initial recognition, intangible
assets are carried at cost less any accumulated amortisation and any accumulated impairment losses. Internally generated intangible assets, excluding capitalised development costs, are not capitalised and expenditure is reflected in the income statement in the year in which the expenditure is incurred.
The useful lives of intangible assets are assessed to be either finite or indefinite.
Intangible assets with finite lives are amortised over the useful economic life and assessed for impairment whenever there is an indication that the intangible asset may be impaired. The amortisation period and the amortisation method for an intangible asset with a finite useful life is reviewed at least at each financial year end. Changes in the expected useful life
NOTES TO THE FINANCIAL STATEMENTS – YEAR ENDED 31 MARCH 2013 (Contd.)
J. L. MORISON SON & JONES (CEYLON) PLCAND ITS SUBSIDIARIES
2726
or the expected pattern of consumption of future economic benefits embodied in the asset is accounted for by changing the amortisation period or method, as appropriate, and treated as changes in accounting estimates. The amortisation expense on intangible assets with finite lives is recognised in the income statement in the expense category consistent with the function of the intangible asset.
Intangible assets with indefinite useful lives are tested for impairment annually either individually or at the cash generating unit level. Such intangibles are not amortised. The useful life of an intangible asset with an indefinite life is reviewed annually to determine whether indefinite life assessment continues to be supportable. If not, the change in the useful life assessment from indefinite to finite is made on a prospective basis.
2.3.8 Financial Instruments – Initial Recognition and Subsequent Measurement i) Financial Assets Initial recognition and measurement Financial assets within the scope of LKAS 39 are classified as financial assets at fair value through profit or loss,
loans and receivables, held-to-maturity investments, available-for-sale financial assets, or as derivatives designated as hedging instruments in an effective hedge, as appropriate. The Group determines the classification of its financial assets at initial recognition.
All financial assets are recognised initially at fair value plus transaction costs, except in the case of financial assets recorded at fair value through profit or loss.
Purchases or sales of financial assets that require delivery of assets within a time frame established by regulation or convention in the market place (regular way trades) are recognised on the trade date, i.e., the date that the Group commits to purchase or sell the asset.
The Group’s financial assets include cash and short-term deposits, loans and receivables and available for sale financial instruments.
Subsequent measurement The subsequent measurement of financial assets depends on their classification as described below:
a) Loans and receivables Loans and receivables are non-derivative financial assets with fixed or determinable payments that are not quoted in an
active market. After initial measurement, such financial assets are subsequently measured at amortised cost using the effective interest rate (EIR) method, less impairment. Amortised cost is calculated by taking into account any discount or premium on acquisition and fees or costs that are an integral part of the EIR. The EIR amortisation is included in finance income in the income statement. The losses arising from impairment are recognised in the income statement.
b) Available-for-sale financial instruments Available-for-sale financial instruments include equity investments. Equity investments classified as available-for-sale
are those that are neither classified as held for trading nor designated at fair value through profit or loss.
Quoted available-for-sale financial investments are subsequently measured at fair value with unrealised gains or losses recognised as other comprehensive income in the available-for-sale reserve until the investment is derecognised, at which time the cumulative gain or loss is recognised in other operating income, or the investment is determined to be impaired, when the cumulative loss is reclassified from the available-for sale reserve to the income statement in finance costs.
The Group evaluates whether the ability and intention to sell its available-for-sale financial assets in the near term is still appropriate. When, in rare circumstances, the Group is unable to trade these financial assets due to inactive markets and management’s intention to do so significantly changes in the foreseeable future, the Group may elect to reclassify these financial assets. Reclassification to loans and receivables is permitted when the financial assets meet the definition of loans and receivables and the Group has the intent and ability to hold these assets for the foreseeable future or until maturity. Reclassification to the held-to-maturity category is permitted only when the entity has the ability and intention to hold the financial asset accordingly.
Derecognition A financial asset or a part of a financial asset or part of a group of similar financial assets is derecognised when:
• The rights to receive cash flows from the asset have expired
• The Group has transferred its rights to receive cash flows from the asset or has assumed an obligation to pay the received cash flows in full without material delay to a third party under a ‘pass-through’ arrangement; and either
(a) The Group has transferred substantially all the risks and rewards of the asset, or
NOTES TO THE FINANCIAL STATEMENTS – YEAR ENDED 31 MARCH 2013 (Contd.)
J. L. MORISON SON & JONES (CEYLON) PLCAND ITS SUBSIDIARIES
2726
NOTES TO THE FINANCIAL STATEMENTS – YEAR ENDED 31 MARCH 2013 (Contd.)
(b) The Group has neither transferred nor retained substantially all the risks and rewards of the asset, but has transferred control of the asset.
When the Group has transferred its rights to receive cash flows from an asset or has entered into a pass-through arrangement, it evaluates if and to what extent it has retained the risks and rewards of ownership. When it has neither transferred nor retained substantially all of the risks and rewards of the asset, nor transferred control of the asset, the asset is recognised to the extent of the Group’s continuing involvement in the asset. In that case, the Group also recognises an associated liability. The transferred asset and the associated liability are measured on a basis that reflects the rights and obligations that the Group has retained.
Continuing involvement that takes the form of a guarantee over the transferred asset is measured at the lower of the original carrying amount of the asset and the maximum amount of consideration that the Group could be required to repay.
ii) Impairment of Financial Assets The Group assesses, at each reporting date, whether there is any objective evidence that a financial asset or a group of
financial assets is impaired. A financial asset or a group of financial assets is deemed to be impaired if, and only if, there is objective evidence of impairment as a result of one or more events that has occurred after the initial recognition of the asset (an incurred ‘loss event’) and that loss event has an impact on the estimated future cash flows of the financial asset or the group of financial assets that can be reliably estimated.
Financial assets carried at amortised cost For financial assets carried at amortised cost, the Group first assesses whether objective evidence of impairment exists
individually for financial assets that are individually significant, or collectively for financial assets that are not individually significant. If the Group determines that no objective evidence of impairment exists for an individually assessed financial asset, whether significant or not, it includes the asset in a group of financial assets with similar credit risk characteristics and collectively assesses them for impairment. Assets that are individually assessed for impairment and for which an impairment loss is, or continues to be, recognised are not included in a collective assessment of impairment.
If there is objective evidence that an impairment loss has been incurred, the amount of the loss is measured as the difference between the asset’s carrying amount and the present value of estimated future cash flows (excluding future expected credit losses that have not yet been incurred).
Available-for-sale financial investments For available-for-sale financial investments, the Group assesses at each reporting date whether there is objective
evidence that an investment or a group of investments is impaired. In the case of equity investments classified as available-for-sale, objective evidence would include a significant or prolonged decline in the fair value of the investment below its cost. ‘Significant’ is evaluated against the original cost of the investment and ‘prolonged’ against the period in which the fair value has been below its original cost. When there is evidence of impairment, the cumulative loss – measured as the difference between the acquisition cost and the current fair value, less any impairment loss on that investment previously recognised in the income statement – is removed from other comprehensive income and recognised in the income statement. Impairment losses on equity investments are not reversed through the income statement;
Increases in their fair value after impairment are recognised directly in other comprehensive income.
iii) Financial Liabilities Initial recognition and measurement Financial liabilities within the scope of LKAS 39 are classified as financial liabilities at fair value through profit or loss,
loans and borrowings, or as derivatives designated as hedging instruments in an effective hedge, as appropriate. The Group determines the classification of its financial liabilities at initial recognition. All financial liabilities are recognised initially at fair value plus, in the case of loans and borrowings, directly attributable transaction costs.
The Group’s financial liabilities include trade and other payables, bank overdrafts and loans and borrowings.
Subsequent measurement The measurement of financial liabilities depends on their classification as described below:
Loans and borrowings After initial recognition, interest bearing loans and borrowings are subsequently measured at amortised cost using the
EIR method. Gains and losses are recognised in the income statement when the liabilities are derecognised as well as through the EIR amortisation process.
Amortised cost is calculated by taking into account any discount or premium on acquisition and fees or costs that are an integral part of the EIR. The EIR amortisation is included in finance costs in the income statement.
J. L. MORISON SON & JONES (CEYLON) PLCAND ITS SUBSIDIARIES
2928
NOTES TO THE FINANCIAL STATEMENTS – YEAR ENDED 31 MARCH 2013 (Contd.)
Derecognition A financial liability is derecognised when the obligation under the liability is discharged or cancelled or expires. When
an existing financial liability is replaced by another from the same lender on substantially different terms or the terms of an existing liability are substantially modified, such an exchange or modification is treated as the derecognition of the original liability and the recognition of a new liability. The difference in the respective carrying amounts is recognised in the income statement.
iv) Offsetting of financial instruments Financial assets and financial liabilities are offset and the net amount reported in the consolidated statement of financial
position if, and only if:
• There is a currently enforceable legal right to offset the recognised amounts and
• There is an intention to settle on a net basis, or to realise the assets and settle the liabilities simultaneously
v) Fair value of financial instruments The fair value of financial instruments that are traded in active markets at each reporting date is determined by reference
to quoted market prices or dealer price quotations (bid price for long positions and ask price for short positions), without any deduction for transaction costs.
For financial instruments that do not have a quoted market price in an active market and whose fair value cannot be reliability measured are carried at cost.
2.3.9 Inventories Inventories are valued at the lower of cost and net realisable value except commodity broker – traders. Costs incurred in
bringing each product to its present location and conditions are accounted for as follows:
Raw materials - Purchase cost on a first in, first out basis
Finished goods and work in progress- Cost of direct materials and labour and a proportion of manufacturing overheads based on normal operating capacity but excluding borrowing costs.
Net realisable value is the estimated selling price in the ordinary course of business, less estimated costs of completion and the estimated costs necessary to make the sale.
2.3.10 Cash and Cash Equivalents Cash and cash equivalents are defined as cash in hand, demand deposits and short term highly liquid investments, readily
convertible to known amounts of cash and subject to insignificant risk of changes in value.
For the purpose of the statement cash flows, cash and cash equivalents consist of cash and short-term deposits as defined above, net of outstanding bank overdrafts.
2.3.11 Provisions Provisions are recognized when the Group has a present obligation (legal or constructive) as a result of a past event,
where it is probable that an outflow of resources embodying economic benefits will be required to settle the obligation and a reliable estimate can be made of the amount of the obligation. When the group expects some or all of a provision to be reimbursed, the reimbursement is recognised as a separate assets but only when the reimbursement is virtually certain. The expense relating to any provision is presented in the income statement net of any reimbursement. If the effect of the time value of money is material, provisions are determined by discounting the expected future cash flows at a pre-tax rate that reflects current market assessments of the time value of money and, where appropriate, the risks specific to the liability. Where discounting is used, the increase in the provision due to the passage of time is recognized as a finance expense.
J. L. MORISON SON & JONES (CEYLON) PLCAND ITS SUBSIDIARIES
2928
2.3.12 Retirement Benefit Obligations a) Defined Contribution Plans – Employees’ Provident Fund & Employees’ Trust Fund Employees are eligible for Employees’ Provident Fund Contributions and Employees’ Trust Fund Contributions in line
with the respective statutes and regulations in Sri Lanka. The Company contributes 12 % and 3% of gross emoluments of employees to Employees’ Provident Fund and Employees’ Trust Fund respectively.
b) Defined Benefit Plan – Gratuity A defined benefit plan is a post-employment benefit plan other than a defined contribution plan. The defined benefit is
calculated by independent actuaries. The present value of the defined benefit obligation is determined by discounting the estimated future cash outflows using interest rates that are denominated in the currency in which the benefits will be paid, and that have terms to maturity approximating to the terms of the related liability.
The present value of the defined benefit obligations depends on a number of factors that are determined on an actuarial basis using a number of assumptions. Key assumptions used in determining the defined retirement benefit obligations are given in Note 13. Any changes in these assumptions will impact the carrying amount of defined benefit obligations.
The gratuity liability is not funded.
2.3.13 Impairment of Non- Financial Assets The Group assesses at each reporting date whether there is an indication that an asset may be impaired. If any such
indication exists, or when annual impairment testing for an asset is required, the Group makes an estimate of the asset’s recoverable amount. An asset’s recoverable amount is the higher of an asset’s or cash-generating unit’s fair value less costs to sell and its value in use and is determined for an individual asset or cash-generating unit, unless the asset or cash-generating unit does not generate cash inflows that are largely independent of those from other assets or cash-generating units. Where the carrying amount of an asset exceeds its recoverable amount, the asset is considered impaired and is written down to its recoverable amount. In assessing value in use, the estimated future cash flows are discounted to their present value using a pre-tax discount rate that reflects current market assessments of the time value of money and the risks specific to the asset. In determining fair value less costs to sell, an appropriate valuation model is used.
Impairment losses of continuing operations are recognised in the income statement in those expense categories consistent with the function of the impaired asset, except for property previously revalued where the revaluation was taken to equity. In this case the impairment is also recognised in equity up to the amount of any previous revaluation.
An assessment is made at each reporting date as to whether there is any indication that previously recognised impairment losses may no longer exist or may have decreased. If such indication exists, the Group makes an estimate of recoverable amount. A previously recognised impairment loss is reversed only if there has been a change in the estimates used to determine the asset’s recoverable amount since the last impairment loss was recognised. If that is the case the carrying amount of the asset is increased to its recoverable amount. That increased amount cannot ‘’exceed’’ the carrying amount that would have been determined, net of depreciation, had no impairment loss been recognised for the asset in prior years. Such reversal is recognised in the income statement unless the asset is carried at revalued amount, in which case the reversal is treated as a revaluation increase.
The following criteria are also applied in assessing impairment of specific assets:
Intangible Assets Intangible assets with indefinite useful lives are tested for impairment annually either individually or at the cash generating
unit level, as appropriate.
2.3.14 Income Statement Revenue Recognition Revenue is recognised to the extent that it is probable that the economic benefits will flow to the Group and the revenue
can be reliably measured, regardless of when the payment is being made. Revenue is measured at the fair value of the consideration received or receivable, taking into account contractually defined terms of payment and excluding taxes or duty. The Group assesses its revenue arrangements against specific criteria in order to determine if it is acting as principal or agent. The following specific recognition criteria must also be met before revenue is recognised:
a) Sale of Goods Revenue from the sale of goods is recognised when the significant risk and rewards of ownership of the goods have
passed to buyer with the Company retaining neither continuing managerial involvement to the degree usually associated with ownership, nor an effective control over the goods sold.
NOTES TO THE FINANCIAL STATEMENTS – YEAR ENDED 31 MARCH 2013 (Contd.)
J. L. MORISON SON & JONES (CEYLON) PLCAND ITS SUBSIDIARIES
3130
b) Rendering of Services Revenue from rendering of services is recognised in the accounting period in which the services are rendered or
performed.
c) Interest Income For all financial instruments measured at amortised cost and interest bearing financial assets classified as available
for sale, interest income or expense is recorded using the effective interest rate (EIR), which is the rate that exactly discounts the estimated future cash payments or receipts through the expected life of the financial instrument or a shorter period, where appropriate, to the net carrying amount of the financial asset or liability. Interest income is included in finance income in the income statement.
d) Dividends Dividend income is recognized when the shareholder’s right to receive payment is established’.
e) Rental Income Rental income is recognized on an accrual basis.
f) Gains and Losses Net gains and losses of a revenue nature on the disposal of Property, Plant & Equipment and other non current assets
including investments are accounted for in the income statement, after deducting from proceeds on disposal, the carrying amount of the assets and related selling expenses. On the disposal of revalued Property, Plant and Equipment, the amount remaining in the Revaluation Reserve, relating to that particular asset is transferred directly to Retained Earnings.
Gains and losses arising from activities incidental to the main revenue generating activities and those arising from a group of similar transactions which are not material, are aggregated, reported and presented on a net basis.
g) Other Income Other income is recognized on an accrual basis.
2.3.15 Segment Reporting An operating segment is a component of the Group that engages in business activities from which it may earn revenues and
incur expenses, including revenues and expenses that relate to transactions with any of the Group’s other components. All operating segments’ operating results are reviewed regularly by the senior management to make decisions about resources to be allocated to the segment and assess its performance, and for which discrete financial information is available.
Segment results that are reported to the senior management and Board of Directors include items directly attributable to a segment as well as those that can be allocated on a reasonable basis.
Segment capital expenditure is the total cost incurred during the period to acquire Property, Plant and Equipment.
2.4 SIGNIFICANT ACCOUNTING JUDGMENTS, ESTIMATES & ASSUMPTIONS The preparation of the financial statements of the group require the management to make judgments, estimates and
assumptions, which may affect the amounts of income, expenditure, assets, liabilities and the disclosure of contingent liabilities, at the end of the reporting period. In the process of applying the group’s accounting policies, the key assumptions made relating to the future and the sources of estimation at the reporting date together with the related judgments that have a significant risk of causing a material adjustment to the carrying amounts of assets and liabilities within the next financial year are discussed below.
a) Deferred Tax Assets Deferred tax assets are recognised to the extent that it is probable that taxable profit will be available against which the
losses can be utilised. Significant management judgment is required to determine the amount of deferred tax assets that can be recognised, based upon the likely timing and level of future taxable profits together with future tax planning strategies.
b) Defined Benefit Plans The cost of the retirement benefit plan of employees is determined using an actuarial valuation. The actuarial valuation is
based on assumptions concerning the rate of interest, rate of salary increase, special premium, retirement age and going concern of the Company. Due to the long term nature of the plan, such estimates are subject to significant uncertainty. Details of the key assumptions used in the estimates are contained in Note 13.
NOTES TO THE FINANCIAL STATEMENTS – YEAR ENDED 31 MARCH 2013 (Contd.)
J. L. MORISON SON & JONES (CEYLON) PLCAND ITS SUBSIDIARIES
3130
c) Impairment of non-financial assets An impairment exists when the carrying value of an asset or cash generating unit exceeds its recoverable amount, which
is the higher of its fair value less costs to sell and its value in use (VIU). The fair value less costs to sell calculation is based on available data from an active market, in an arm’s length transaction, of similar assets or observable market prices less incremental costs for disposing of the asset. The value in use calculation is based on a discounted cash flow model.
d) Taxes The Group is subject to income tax and other taxes including VAT. Significant judgment was required to determine the
total provision for current, deferred and other taxes pending the issue of tax guidelines on the treatment of the adoption of SLFRS/LKAS in the Financial Statements and the taxable profit for the purpose of imposition of taxes. Uncertainties exist, with respect to the interpretation of the applicability of tax laws, at the time of the preparation of these financial statements.
Uncertainties also exist with respect to the interpretation of complex tax regulations and the amount and timing of future taxable income. Given the wide range of business relationships and the long-term nature and complexity of existing contractual agreements, differences arising between the actual results and the assumptions made, or future changes to such assumptions, could necessitate future adjustments to tax income and expense already recorded. Where the final tax outcome of such matters is different from the amounts that were initially recorded, such differences will impact the income and deferred tax amounts in the period in which the determination is made.
2.5 STANDARDS ISSUED BUT NOT YET EFFECTIVE The following SLFRS have been issued by the Institute of Chartered Accountants of Sri Lanka that have an effective date
in the future and have not been applied in preparing these financial statements. Those SLFRS will have an effect on the accounting policies currently adopted by the Group and may have an impact on the future financial statements.
(i) SLFRS 9-Financial Instruments: Classification and Measurement SLFRS 9, as issued reflects the first phase of work on replacement of LKAS 39 and applies to classification and
measurement of financial assets and liabilities.
This standard will be effective for the financial periods beginning on or after 01 January 2015.
(ii) SLFRS 13-Fair Value Measurement SLFRS 13 establishes a single source of guidance under SLFRS for all fair value measurements. SLFRS 13 provides
guidance on all fair value measurements under SLFRS.
This standard will be effective for the financial periods beginning on or after 01 January 2014.
In addition to the above, following standards were also issued and will be effective from 01 January 2014.
SLFRS 10 – Consolidated Financial Statements
SLFRS 11 – Joint Arrangements
SLFRS 12 – Disclosure of Interests in Other Entities
2.6 First-time adoption of SLFRS These financial statements, for the year ended 31 March 2013, are the first set of financial statements the Group has
prepared in accordance with SLFRS/LKAS. For periods up to and including the year ended 31 March 2012, the Group prepared its financial statements in accordance with Sri Lanka Accounting Standards (SLAS) which were effective up to 31 March 2012.
Accordingly, the Group has prepared financial statements which comply with SLFRS/LKAS applicable for periods ending 31 March 2013, together with the comparative period data as at and for the year ended 31 March 2012, as described in the accounting policies. In preparing these financial statements, the Group’s opening statement of financial position was prepared as at 1 April 2011, the Group’s date of transition to SLFRS/LKAS. Note 2.7 explains the principal adjustments made by the Group in restating its SLAS statement of financial position as at 1 April 2011, and it’s previously published SLAS financial statements as at and for the year ended 31 March 2012.
NOTES TO THE FINANCIAL STATEMENTS – YEAR ENDED 31 MARCH 2013 (Contd.)
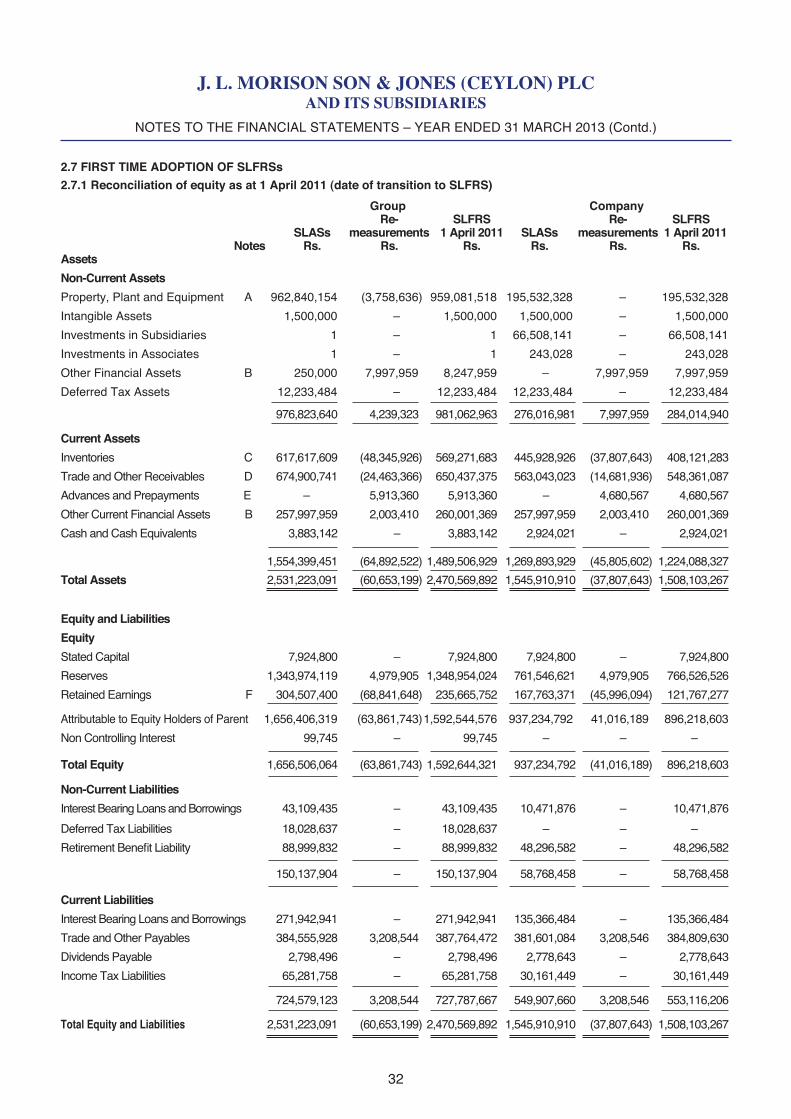
J. L. MORISON SON & JONES (CEYLON) PLCAND ITS SUBSIDIARIES
3332
NOTES TO THE FINANCIAL STATEMENTS – YEAR ENDED 31 MARCH 2013 (Contd.)
2.7 FIRST TIME ADOPTION OF SLFRSs2.7.1 Reconciliation of equity as at 1 April 2011 (date of transition to SLFRS)
Group Company Re- SLFRS Re- SLFRS SLASs measurements 1 April 2011 SLASs measurements 1 April 2011 Notes Rs. Rs. Rs. Rs. Rs. Rs.Assets
Non-Current Assets
Property, Plant and Equipment A 962,840,154 (3,758,636) 959,081,518 195,532,328 – 195,532,328
Intangible Assets 1,500,000 – 1,500,000 1,500,000 – 1,500,000
Investments in Subsidiaries 1 – 1 66,508,141 – 66,508,141
Investments in Associates 1 – 1 243,028 – 243,028
Other Financial Assets B 250,000 7,997,959 8,247,959 – 7,997,959 7,997,959
Deferred Tax Assets 12,233,484 – 12,233,484 12,233,484 – 12,233,484 976,823,640 4,239,323 981,062,963 276,016,981 7,997,959 284,014,940
Current Assets
Inventories C 617,617,609 (48,345,926) 569,271,683 445,928,926 (37,807,643) 408,121,283
Trade and Other Receivables D 674,900,741 (24,463,366) 650,437,375 563,043,023 (14,681,936) 548,361,087
Advances and Prepayments E – 5,913,360 5,913,360 – 4,680,567 4,680,567
Other Current Financial Assets B 257,997,959 2,003,410 260,001,369 257,997,959 2,003,410 260,001,369
Cash and Cash Equivalents 3,883,142 – 3,883,142 2,924,021 – 2,924,021 1,554,399,451 (64,892,522) 1,489,506,929 1,269,893,929 (45,805,602) 1,224,088,327 Total Assets 2,531,223,091 (60,653,199) 2,470,569,892 1,545,910,910 (37,807,643) 1,508,103,267
Equity and Liabilities
Equity
Stated Capital 7,924,800 – 7,924,800 7,924,800 – 7,924,800
Reserves 1,343,974,119 4,979,905 1,348,954,024 761,546,621 4,979,905 766,526,526
Retained Earnings F 304,507,400 (68,841,648) 235,665,752 167,763,371 (45,996,094) 121,767,277
Attributable to Equity Holders of Parent 1,656,406,319 (63,861,743) 1,592,544,576 937,234,792 41,016,189 896,218,603
Non Controlling Interest 99,745 – 99,745 – – – Total Equity 1,656,506,064 (63,861,743) 1,592,644,321 937,234,792 (41,016,189) 896,218,603 Non-Current Liabilities
Interest Bearing Loans and Borrowings 43,109,435 – 43,109,435 10,471,876 – 10,471,876
Deferred Tax Liabilities 18,028,637 – 18,028,637 – – –
Retirement Benefit Liability 88,999,832 – 88,999,832 48,296,582 – 48,296,582 150,137,904 – 150,137,904 58,768,458 – 58,768,458 Current Liabilities
Interest Bearing Loans and Borrowings 271,942,941 – 271,942,941 135,366,484 – 135,366,484
Trade and Other Payables 384,555,928 3,208,544 387,764,472 381,601,084 3,208,546 384,809,630
Dividends Payable 2,798,496 – 2,798,496 2,778,643 – 2,778,643
Income Tax Liabilities 65,281,758 – 65,281,758 30,161,449 – 30,161,449 724,579,123 3,208,544 727,787,667 549,907,660 3,208,546 553,116,206 Total Equity and Liabilities 2,531,223,091 (60,653,199) 2,470,569,892 1,545,910,910 (37,807,643) 1,508,103,267

J. L. MORISON SON & JONES (CEYLON) PLCAND ITS SUBSIDIARIES
3332
NOTES TO THE FINANCIAL STATEMENTS – YEAR ENDED 31 MARCH 2013 (Contd.)
2.7 FIRST TIME ADOPTION OF SLFRSs (Contd…)2.7.2 Reconciliation of equity as at 31 March 2012
Group Company Re- SLFRS Re- SLFRS SLASs measurements 31 Mrach 2012 SLASs measurements 31 Mrach 2012 Notes Rs. Rs. Rs. Rs. Rs. Rs.Assets
Non-Current Assets
Property, Plant and Equipment A 963,985,736 (3,610,441) 960,375,295 198,962,890 – 198,962,890
Intangible Assets 1,500,000 – 1,500,000 1,500,000 – 1,500,000
Investments in Subsidiaries 1 – 1 66,508,141 – 66,508,141
Investments in Associates 1 – 1 243,028 – 243,028
Other Financial Assets B 250,000 5,427,887 5,677,887 – 5,427,887 5,427,887
Deferred Tax Assets 12,367,958 – 12,367,958 12,367,958 – 12,367,958 978,103,696 1,817,446 979,921,142 279,582,017 5,427,887 285,009,904 Current Assets
Inventories C 712,935,143 (57,928,882) 655,006,261 530,923,723 (44,044,653) 486,879,070
Trade and Other Receivables D 749,092,210 (23,424,094) 725,668,116 657,412,135 (13,891,526) 643,520,609
Advances and Prepayments E – 5,682,989 5,682,989 – 4,699,060 4,699,060
Other Current Financial Assets B 255,427,887 3,764,579 259,192,466 255,427,887 3,764,579 259,192,466
Cash and Cash Equivalents 19,694,143 – 19,694,143 18,732,792 – 18,732,792 1,737,149,383 (71,905,408) 1,665,243,975 1,462,496,537 (49,472,540) 1,413,023,997 Total assets 2,715,253,079 (70,087,962) 2,645,165,117 1,742,078,554 (44,044,653) 1,698,033,901 Equity and Liabilities
Equity
Stated Capital 7,924,800 – 7,924,800 7,924,800 – 7,924,800
Reserves 1,443,974,119 2,409,833 1,446,383,952 861,546,622 2,409,832 863,956,454
Retained Earnings F 396,495,273 (76,717,887) 319,777,386 189,399,838 (50,674,580) 138,725,258 Attributable to Equity Holders of Parent 1,848,394,192 (74,308,054) 1,774,086,138 1,051,871,260 (48,264,748) 1,010,606,512
Non Controlling Interest 102,461 – 102,461 – – – Total Equity 1,848,496,653 (74,308,054) 1,774,188,599 1,058,871,260 (48,264,748) 1,010,606,512 Non-current Liabilities
Interest Bearing Loans and Borrowings 42,253,371 – 42,253,371 23,953,306 – 23,953,306
Deferred Tax Liabilities 23,800,753 – 23,800,753 – – –
Retirement Benefit Liability 91,963,475 – 91,963,475 53,978,021 – 53,978,021 158,017,599 – 158,017,599 77,931,327 – 77,931,327 Current Liabilities
Interest Bearing Loans and Borrowings 252,992,226 – 252,992,226 158,240,839 – 158,240,839
Trade and Other Payables 447,275,499 4,220,092 451,495,591 427,537,759 4,220,094 431,757,853
Dividends Payable 4,976,053 – 4,976,053 4,976,053 – 4,976,053
Income Tax Liabilities 3,495,049 – 3,495,049 14,521,317 – 14,521,317 708,738,827 4,220,092 712,958,919 605,275,968 4,220,094 609,496,062 Total Equity and Liabilities 2,715,253,079 (70,087,962) 2,645,165,117 1,742,078,554 (44,044,653) 1,698,033,901
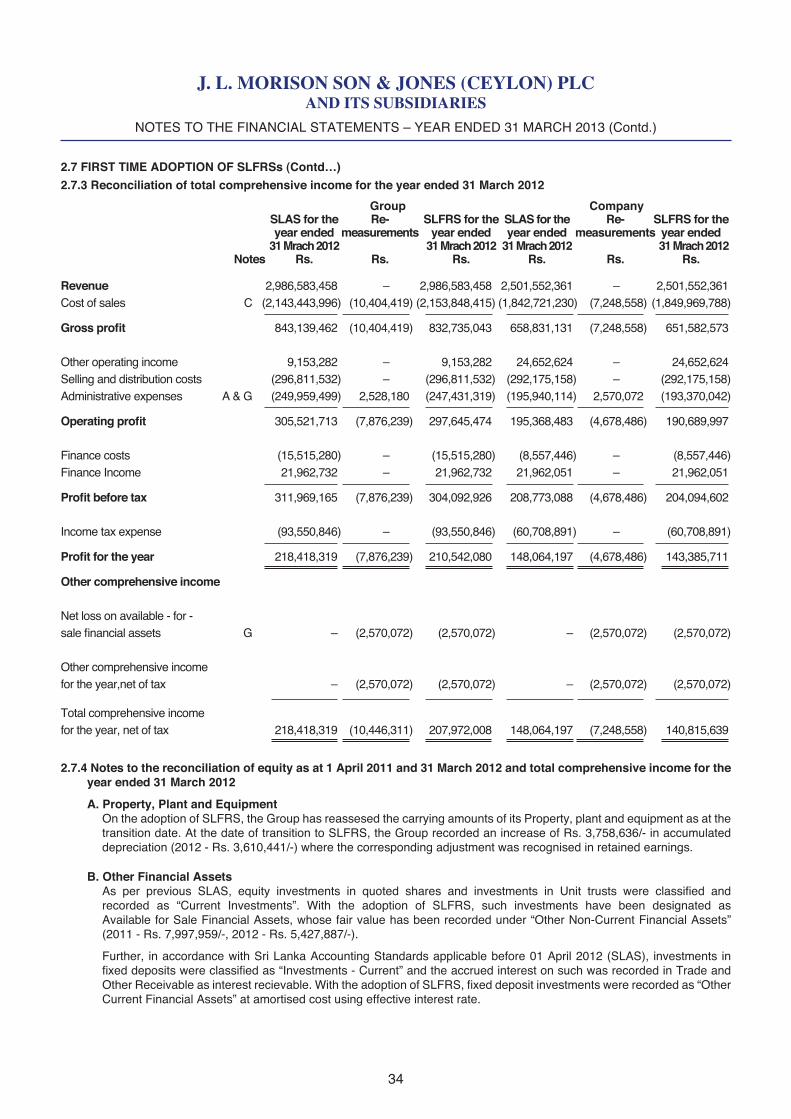
J. L. MORISON SON & JONES (CEYLON) PLCAND ITS SUBSIDIARIES
3534
NOTES TO THE FINANCIAL STATEMENTS – YEAR ENDED 31 MARCH 2013 (Contd.)
2.7 FIRST TIME ADOPTION OF SLFRSs (Contd…)2.7.3 Reconciliation of total comprehensive income for the year ended 31 March 2012
Group Company SLAS for the Re- SLFRS for the SLAS for the Re- SLFRS for the year ended measurements year ended year ended measurements year ended 31 Mrach 2012 31 Mrach 2012 31 Mrach 2012 31 Mrach 2012 Notes Rs. Rs. Rs. Rs. Rs. Rs.
Revenue 2,986,583,458 – 2,986,583,458 2,501,552,361 – 2,501,552,361 Cost of sales C (2,143,443,996) (10,404,419) (2,153,848,415) (1,842,721,230) (7,248,558) (1,849,969,788) Gross profit 843,139,462 (10,404,419) 832,735,043 658,831,131 (7,248,558) 651,582,573 Other operating income 9,153,282 – 9,153,282 24,652,624 – 24,652,624 Selling and distribution costs (296,811,532) – (296,811,532) (292,175,158) – (292,175,158)Administrative expenses A & G (249,959,499) 2,528,180 (247,431,319) (195,940,114) 2,570,072 (193,370,042) Operating profit 305,521,713 (7,876,239) 297,645,474 195,368,483 (4,678,486) 190,689,997 Finance costs (15,515,280) – (15,515,280) (8,557,446) – (8,557,446)Finance Income 21,962,732 – 21,962,732 21,962,051 – 21,962,051 Profit before tax 311,969,165 (7,876,239) 304,092,926 208,773,088 (4,678,486) 204,094,602 Income tax expense (93,550,846) – (93,550,846) (60,708,891) – (60,708,891) Profit for the year 218,418,319 (7,876,239) 210,542,080 148,064,197 (4,678,486) 143,385,711 Other comprehensive income
Net loss on available - for -sale financial assets G – (2,570,072) (2,570,072) – (2,570,072) (2,570,072) Other comprehensive incomefor the year,net of tax – (2,570,072) (2,570,072) – (2,570,072) (2,570,072) Total comprehensive incomefor the year, net of tax 218,418,319 (10,446,311) 207,972,008 148,064,197 (7,248,558) 140,815,639
2.7.4 Notes to the reconciliation of equity as at 1 April 2011 and 31 March 2012 and total comprehensive income for the year ended 31 March 2012
A. Property, Plant and Equipment On the adoption of SLFRS, the Group has reassesed the carrying amounts of its Property, plant and equipment as at the
transition date. At the date of transition to SLFRS, the Group recorded an increase of Rs. 3,758,636/- in accumulated depreciation (2012 - Rs. 3,610,441/-) where the corresponding adjustment was recognised in retained earnings.
B. Other Financial Assets As per previous SLAS, equity investments in quoted shares and investments in Unit trusts were classified and
recorded as “Current Investments”. With the adoption of SLFRS, such investments have been designated as Available for Sale Financial Assets, whose fair value has been recorded under “Other Non-Current Financial Assets” (2011 - Rs. 7,997,959/-, 2012 - Rs. 5,427,887/-).
Further, in accordance with Sri Lanka Accounting Standards applicable before 01 April 2012 (SLAS), investments in fixed deposits were classified as “Investments - Current” and the accrued interest on such was recorded in Trade and Other Receivable as interest recievable. With the adoption of SLFRS, fixed deposit investments were recorded as “Other Current Financial Assets” at amortised cost using effective interest rate.
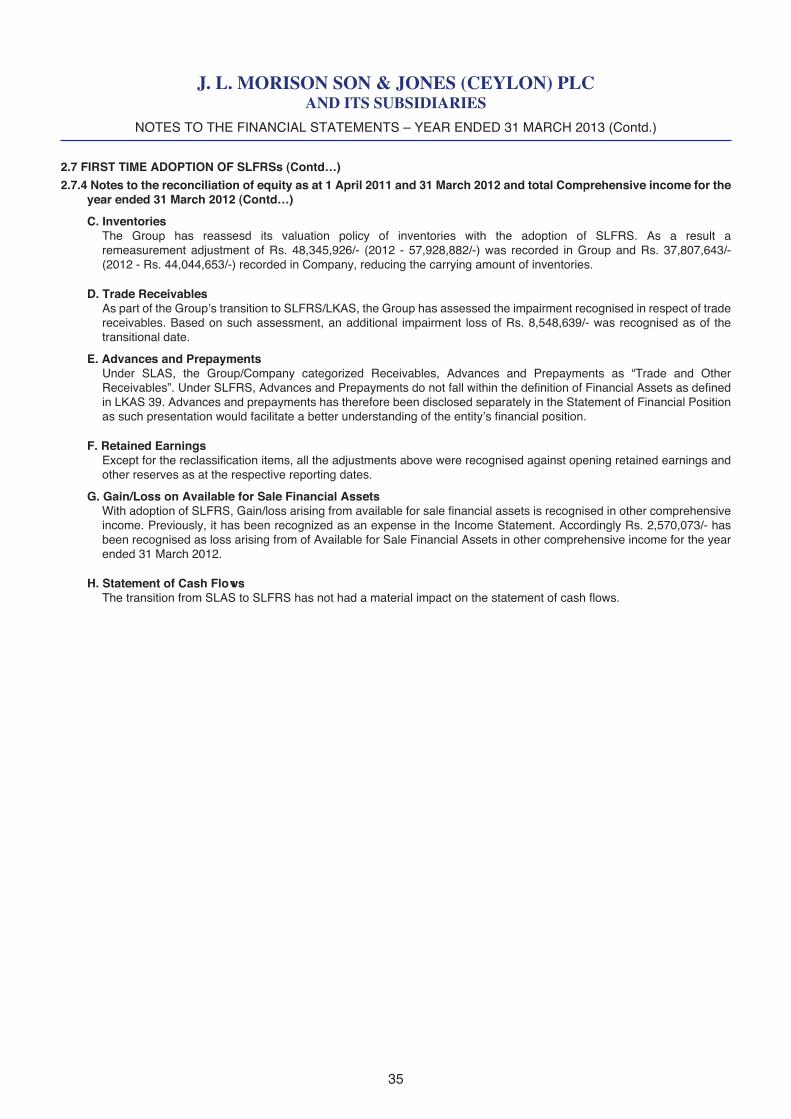
J. L. MORISON SON & JONES (CEYLON) PLCAND ITS SUBSIDIARIES
3534
NOTES TO THE FINANCIAL STATEMENTS – YEAR ENDED 31 MARCH 2013 (Contd.)
2.7 FIRST TIME ADOPTION OF SLFRSs (Contd…)2.7.4 Notes to the reconciliation of equity as at 1 April 2011 and 31 March 2012 and total Comprehensive income for the
year ended 31 March 2012 (Contd…)
C. Inventories The Group has reassesd its valuation policy of inventories with the adoption of SLFRS. As a result a
remeasurement adjustment of Rs. 48,345,926/- (2012 - 57,928,882/-) was recorded in Group and Rs. 37,807,643/- (2012 - Rs. 44,044,653/-) recorded in Company, reducing the carrying amount of inventories.
D. Trade Receivables As part of the Group’s transition to SLFRS/LKAS, the Group has assessed the impairment recognised in respect of trade
receivables. Based on such assessment, an additional impairment loss of Rs. 8,548,639/- was recognised as of the transitional date.
E. Advances and Prepayments Under SLAS, the Group/Company categorized Receivables, Advances and Prepayments as “Trade and Other
Receivables”. Under SLFRS, Advances and Prepayments do not fall within the definition of Financial Assets as defined in LKAS 39. Advances and prepayments has therefore been disclosed separately in the Statement of Financial Position as such presentation would facilitate a better understanding of the entity’s financial position.
F. Retained Earnings Except for the reclassification items, all the adjustments above were recognised against opening retained earnings and
other reserves as at the respective reporting dates.
G. Gain/Loss on Available for Sale Financial Assets With adoption of SLFRS, Gain/loss arising from available for sale financial assets is recognised in other comprehensive
income. Previously, it has been recognized as an expense in the Income Statement. Accordingly Rs. 2,570,073/- has been recognised as loss arising from of Available for Sale Financial Assets in other comprehensive income for the year ended 31 March 2012.
H. Statement of Cash Flows The transition from SLAS to SLFRS has not had a material impact on the statement of cash flows.
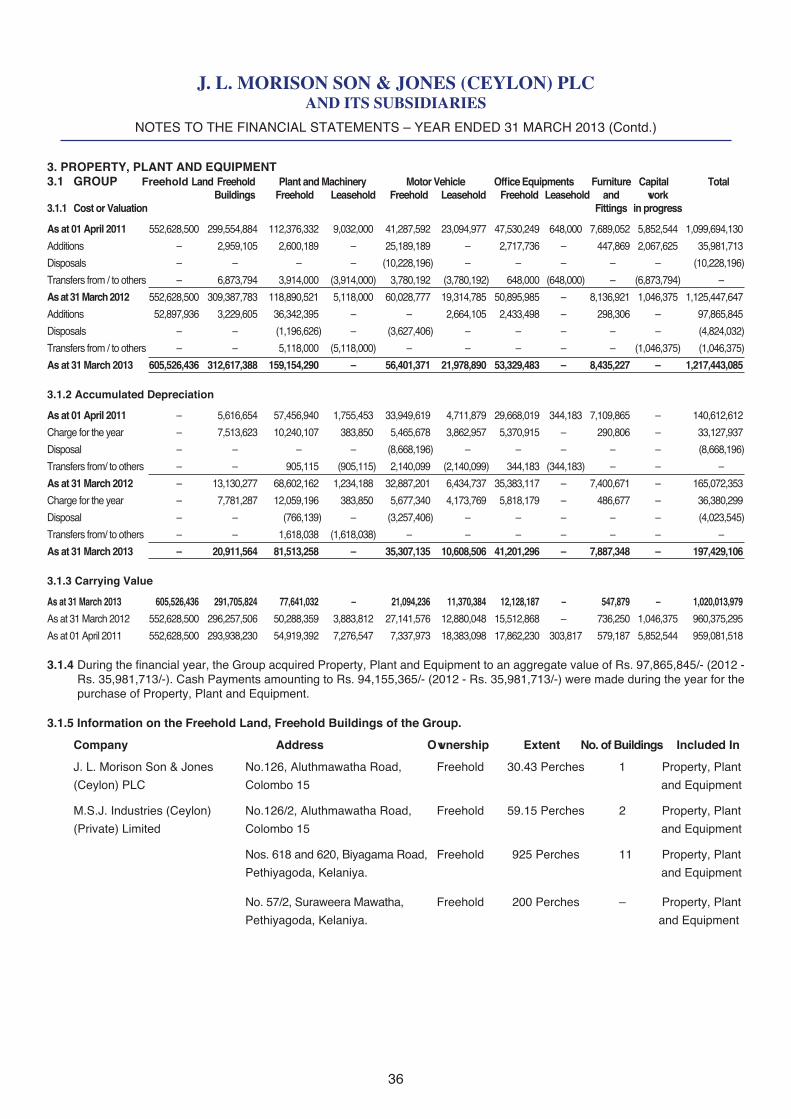
J. L. MORISON SON & JONES (CEYLON) PLCAND ITS SUBSIDIARIES
3736
NOTES TO THE FINANCIAL STATEMENTS – YEAR ENDED 31 MARCH 2013 (Contd.)
3. PROPERTY, PLANT AND EQUIPMENT3.1 GROUP Freehold Land Freehold Plant and Machinery Motor Vehicle Office Equipments Furniture Capital Total Buildings Freehold Leasehold Freehold Leasehold Freehold Leasehold and work 3.1.1 Cost or Valuation Fittings in progress
As at 01 April 2011 552,628,500 299,554,884 112,376,332 9,032,000 41,287,592 23,094,977 47,530,249 648,000 7,689,052 5,852,544 1,099,694,130
Additions – 2,959,105 2,600,189 – 25,189,189 – 2,717,736 – 447,869 2,067,625 35,981,713
Disposals – – – – (10,228,196) – – – – – (10,228,196)
Transfers from / to others – 6,873,794 3,914,000 (3,914,000) 3,780,192 (3,780,192) 648,000 (648,000) – (6,873,794) –
As at 31 March 2012 552,628,500 309,387,783 118,890,521 5,118,000 60,028,777 19,314,785 50,895,985 – 8,136,921 1,046,375 1,125,447,647
Additions 52,897,936 3,229,605 36,342,395 – – 2,664,105 2,433,498 – 298,306 – 97,865,845
Disposals – – (1,196,626) – (3,627,406) – – – – – (4,824,032)
Transfers from / to others – – 5,118,000 (5,118,000) – – – – – (1,046,375) (1,046,375)
As at 31 March 2013 605,526,436 312,617,388 159,154,290 – 56,401,371 21,978,890 53,329,483 – 8,435,227 – 1,217,443,085
3.1.2 Accumulated Depreciation
As at 01 April 2011 – 5,616,654 57,456,940 1,755,453 33,949,619 4,711,879 29,668,019 344,183 7,109,865 – 140,612,612
Charge for the year – 7,513,623 10,240,107 383,850 5,465,678 3,862,957 5,370,915 – 290,806 – 33,127,937
Disposal – – – – (8,668,196) – – – – – (8,668,196)
Transfers from/ to others – – 905,115 (905,115) 2,140,099 (2,140,099) 344,183 (344,183) – – –
As at 31 March 2012 – 13,130,277 68,602,162 1,234,188 32,887,201 6,434,737 35,383,117 – 7,400,671 – 165,072,353
Charge for the year – 7,781,287 12,059,196 383,850 5,677,340 4,173,769 5,818,179 – 486,677 – 36,380,299
Disposal – – (766,139) – (3,257,406) – – – – – (4,023,545)
Transfers from/ to others – – 1,618,038 (1,618,038) – – – – – – –
As at 31 March 2013 – 20,911,564 81,513,258 – 35,307,135 10,608,506 41,201,296 – 7,887,348 – 197,429,106
3.1.3 Carrying Value
As at 31 March 2013 605,526,436 291,705,824 77,641,032 – 21,094,236 11,370,384 12,128,187 – 547,879 – 1,020,013,979
As at 31 March 2012 552,628,500 296,257,506 50,288,359 3,883,812 27,141,576 12,880,048 15,512,868 – 736,250 1,046,375 960,375,295
As at 01 April 2011 552,628,500 293,938,230 54,919,392 7,276,547 7,337,973 18,383,098 17,862,230 303,817 579,187 5,852,544 959,081,518
3.1.4 During the financial year, the Group acquired Property, Plant and Equipment to an aggregate value of Rs. 97,865,845/- (2012 - Rs. 35,981,713/-). Cash Payments amounting to Rs. 94,155,365/- (2012 - Rs. 35,981,713/-) were made during the year for the purchase of Property, Plant and Equipment.
3.1.5 Information on the Freehold Land, Freehold Buildings of the Group.
Company Address Ownership Extent No. of Buildings Included In
J. L. Morison Son & Jones No.126, Aluthmawatha Road, Freehold 30.43 Perches 1 Property, Plant
(Ceylon) PLC Colombo 15 and Equipment
M.S.J. Industries (Ceylon) No.126/2, Aluthmawatha Road, Freehold 59.15 Perches 2 Property, Plant
(Private) Limited Colombo 15 and Equipment
Nos. 618 and 620, Biyagama Road, Freehold 925 Perches 11 Property, Plant
Pethiyagoda, Kelaniya. and Equipment
No. 57/2, Suraweera Mawatha, Freehold 200 Perches – Property, Plant
Pethiyagoda, Kelaniya. and Equipment
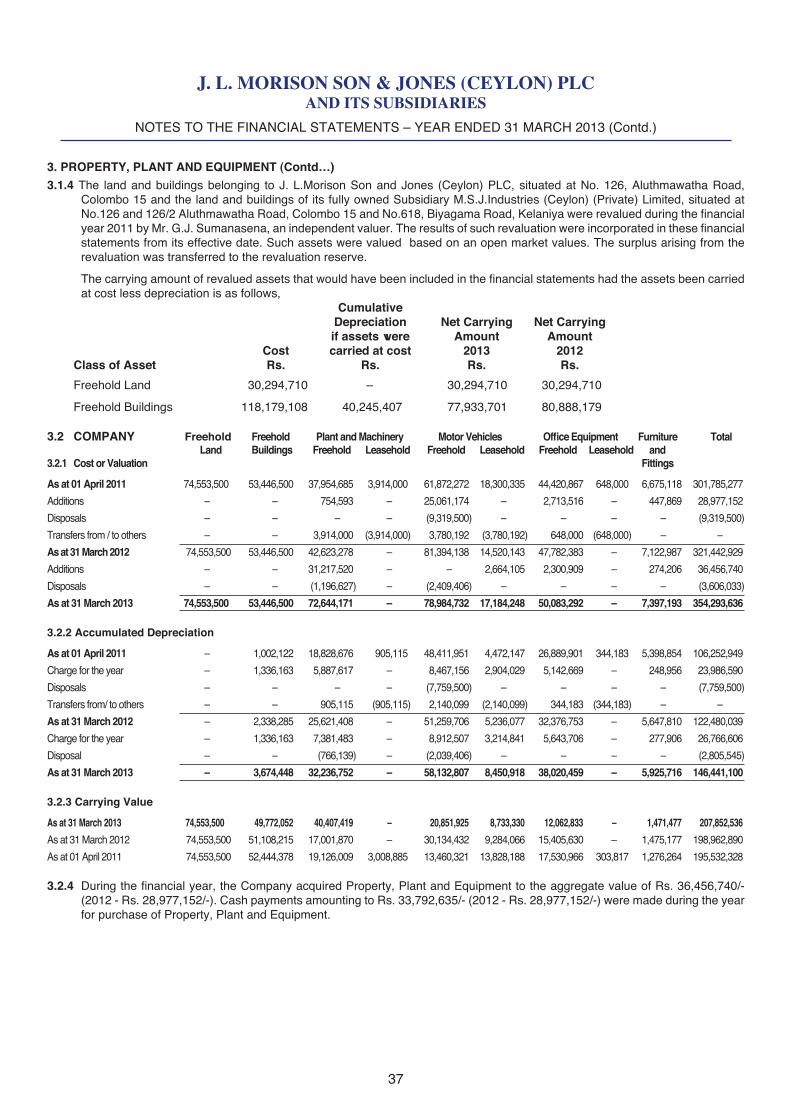
J. L. MORISON SON & JONES (CEYLON) PLCAND ITS SUBSIDIARIES
3736
3. PROPERTY, PLANT AND EQUIPMENT (Contd…)3.1.4 The land and buildings belonging to J. L.Morison Son and Jones (Ceylon) PLC, situated at No. 126, Aluthmawatha Road,
Colombo 15 and the land and buildings of its fully owned Subsidiary M.S.J.Industries (Ceylon) (Private) Limited, situated at No.126 and 126/2 Aluthmawatha Road, Colombo 15 and No.618, Biyagama Road, Kelaniya were revalued during the financial year 2011 by Mr. G.J. Sumanasena, an independent valuer. The results of such revaluation were incorporated in these financial statements from its effective date. Such assets were valued based on an open market values. The surplus arising from the revaluation was transferred to the revaluation reserve.
The carrying amount of revalued assets that would have been included in the financial statements had the assets been carried at cost less depreciation is as follows,
Cumulative Depreciation Net Carrying Net Carrying if assets were Amount Amount Cost carried at cost 2013 2012 Class of Asset Rs. Rs. Rs. Rs.
Freehold Land 30,294,710 – 30,294,710 30,294,710
Freehold Buildings 118,179,108 40,245,407 77,933,701 80,888,179
3.2 COMPANY Freehold Freehold Plant and Machinery Motor Vehicles Office Equipment Furniture Total Land Buildings Freehold Leasehold Freehold Leasehold Freehold Leasehold and 3.2.1 Cost or Valuation Fittings
As at 01 April 2011 74,553,500 53,446,500 37,954,685 3,914,000 61,872,272 18,300,335 44,420,867 648,000 6,675,118 301,785,277
Additions – – 754,593 – 25,061,174 – 2,713,516 – 447,869 28,977,152
Disposals – – – – (9,319,500) – – – – (9,319,500)
Transfers from / to others – – 3,914,000 (3,914,000) 3,780,192 (3,780,192) 648,000 (648,000) – –
As at 31 March 2012 74,553,500 53,446,500 42,623,278 – 81,394,138 14,520,143 47,782,383 – 7,122,987 321,442,929
Additions – – 31,217,520 – – 2,664,105 2,300,909 – 274,206 36,456,740
Disposals – – (1,196,627) – (2,409,406) – – – – (3,606,033)
As at 31 March 2013 74,553,500 53,446,500 72,644,171 – 78,984,732 17,184,248 50,083,292 – 7,397,193 354,293,636
3.2.2 Accumulated Depreciation
As at 01 April 2011 – 1,002,122 18,828,676 905,115 48,411,951 4,472,147 26,889,901 344,183 5,398,854 106,252,949
Charge for the year – 1,336,163 5,887,617 – 8,467,156 2,904,029 5,142,669 – 248,956 23,986,590
Disposals – – – – (7,759,500) – – – – (7,759,500)
Transfers from/ to others – – 905,115 (905,115) 2,140,099 (2,140,099) 344,183 (344,183) – –
As at 31 March 2012 – 2,338,285 25,621,408 – 51,259,706 5,236,077 32,376,753 – 5,647,810 122,480,039
Charge for the year – 1,336,163 7,381,483 – 8,912,507 3,214,841 5,643,706 – 277,906 26,766,606
Disposal – – (766,139) – (2,039,406) – – – – (2,805,545)
As at 31 March 2013 – 3,674,448 32,236,752 – 58,132,807 8,450,918 38,020,459 – 5,925,716 146,441,100
3.2.3 Carrying Value
As at 31 March 2013 74,553,500 49,772,052 40,407,419 – 20,851,925 8,733,330 12,062,833 – 1,471,477 207,852,536
As at 31 March 2012 74,553,500 51,108,215 17,001,870 – 30,134,432 9,284,066 15,405,630 – 1,475,177 198,962,890
As at 01 April 2011 74,553,500 52,444,378 19,126,009 3,008,885 13,460,321 13,828,188 17,530,966 303,817 1,276,264 195,532,328
3.2.4 During the financial year, the Company acquired Property, Plant and Equipment to the aggregate value of Rs. 36,456,740/- (2012 - Rs. 28,977,152/-). Cash payments amounting to Rs. 33,792,635/- (2012 - Rs. 28,977,152/-) were made during the year for purchase of Property, Plant and Equipment.
NOTES TO THE FINANCIAL STATEMENTS – YEAR ENDED 31 MARCH 2013 (Contd.)
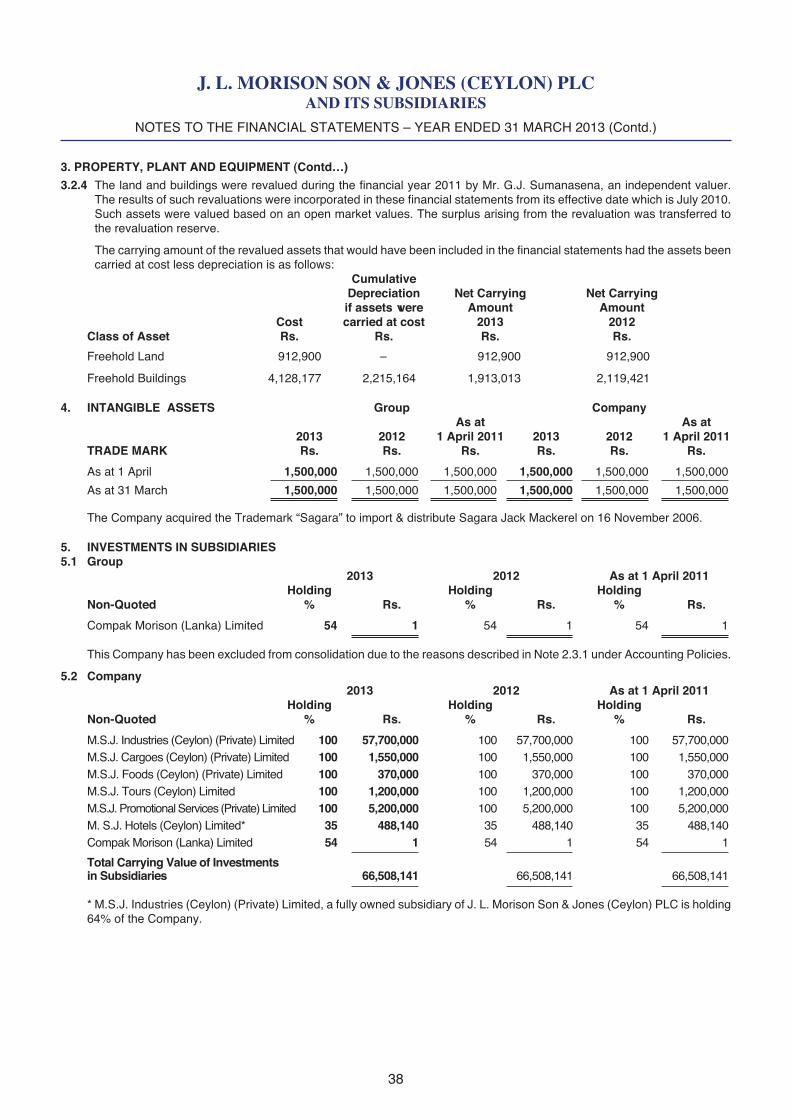
J. L. MORISON SON & JONES (CEYLON) PLCAND ITS SUBSIDIARIES
3938
3. PROPERTY, PLANT AND EQUIPMENT (Contd…)3.2.4 The land and buildings were revalued during the financial year 2011 by Mr. G.J. Sumanasena, an independent valuer.
The results of such revaluations were incorporated in these financial statements from its effective date which is July 2010. Such assets were valued based on an open market values. The surplus arising from the revaluation was transferred to the revaluation reserve.
The carrying amount of the revalued assets that would have been included in the financial statements had the assets been carried at cost less depreciation is as follows:
Cumulative Depreciation Net Carrying Net Carrying if assets were Amount Amount Cost carried at cost 2013 2012 Class of Asset Rs. Rs. Rs. Rs.
Freehold Land 912,900 – 912,900 912,900
Freehold Buildings 4,128,177 2,215,164 1,913,013 2,119,421
4. INTANGIBLE ASSETS Group Company As at As at 2013 2012 1 April 2011 2013 2012 1 April 2011 TRADE MARK Rs. Rs. Rs. Rs. Rs. Rs.
As at 1 April 1,500,000 1,500,000 1,500,000 1,500,000 1,500,000 1,500,000 As at 31 March 1,500,000 1,500,000 1,500,000 1,500,000 1,500,000 1,500,000
The Company acquired the Trademark “Sagara” to import & distribute Sagara Jack Mackerel on 16 November 2006.
5. INVESTMENTS IN SUBSIDIARIES5.1 Group 2013 2012 As at 1 April 2011 Holding Holding Holding Non-Quoted % Rs. % Rs. % Rs.
Compak Morison (Lanka) Limited 54 1 54 1 54 1
This Company has been excluded from consolidation due to the reasons described in Note 2.3.1 under Accounting Policies.
5.2 Company 2013 2012 As at 1 April 2011 Holding Holding Holding Non-Quoted % Rs. % Rs. % Rs.
M.S.J. Industries (Ceylon) (Private) Limited 100 57,700,000 100 57,700,000 100 57,700,000 M.S.J. Cargoes (Ceylon) (Private) Limited 100 1,550,000 100 1,550,000 100 1,550,000 M.S.J. Foods (Ceylon) (Private) Limited 100 370,000 100 370,000 100 370,000 M.S.J. Tours (Ceylon) Limited 100 1,200,000 100 1,200,000 100 1,200,000 M.S.J. Promotional Services (Private) Limited 100 5,200,000 100 5,200,000 100 5,200,000 M. S.J. Hotels (Ceylon) Limited* 35 488,140 35 488,140 35 488,140 Compak Morison (Lanka) Limited 54 1 54 1 54 1 Total Carrying Value of Investments in Subsidiaries 66,508,141 66,508,141 66,508,141
* M.S.J. Industries (Ceylon) (Private) Limited, a fully owned subsidiary of J. L. Morison Son & Jones (Ceylon) PLC is holding 64% of the Company.
NOTES TO THE FINANCIAL STATEMENTS – YEAR ENDED 31 MARCH 2013 (Contd.)
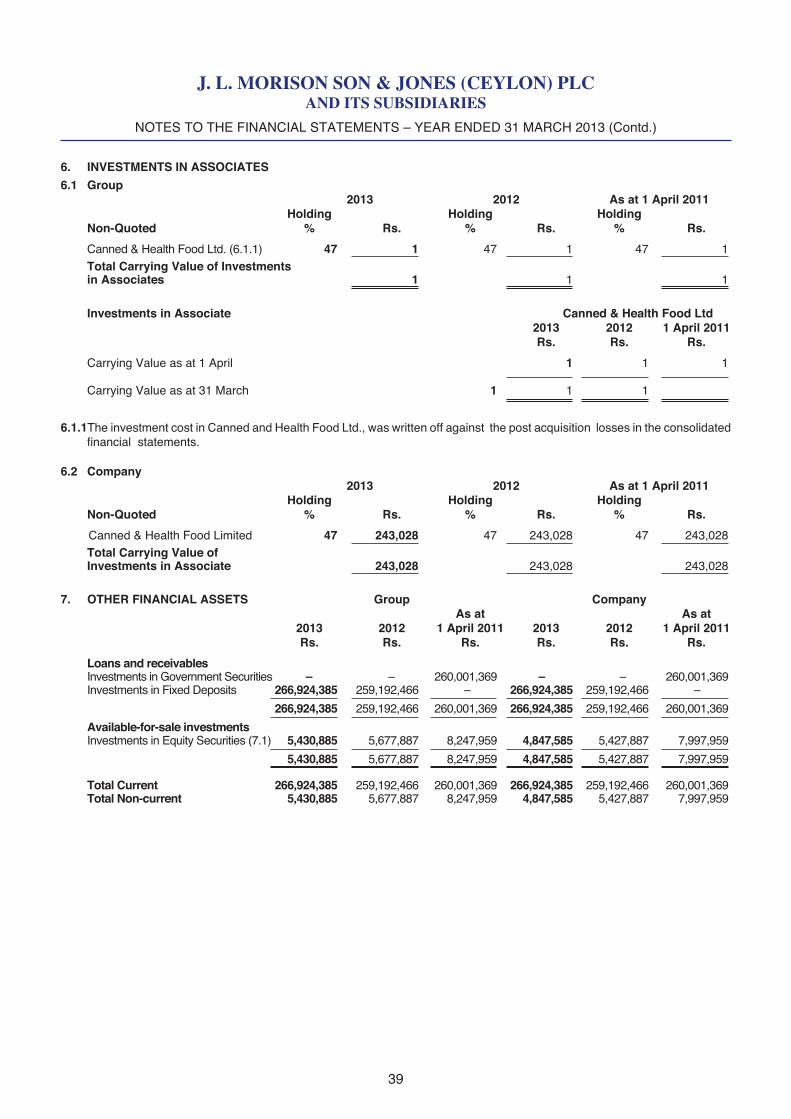
J. L. MORISON SON & JONES (CEYLON) PLCAND ITS SUBSIDIARIES
3938
NOTES TO THE FINANCIAL STATEMENTS – YEAR ENDED 31 MARCH 2013 (Contd.)
6. INVESTMENTS IN ASSOCIATES6.1 Group 2013 2012 As at 1 April 2011 Holding Holding Holding Non-Quoted % Rs. % Rs. % Rs.
Canned & Health Food Ltd. (6.1.1) 47 1 47 1 47 1 Total Carrying Value of Investments in Associates 1 1 1
Investments in Associate Canned & Health Food Ltd 2013 2012 1 April 2011
Rs. Rs. Rs.
Carrying Value as at 1 April 1 1 1 Carrying Value as at 31 March 1 1 1
6.1.1The investment cost in Canned and Health Food Ltd., was written off against the post acquisition losses in the consolidated financial statements.
6.2 Company 2013 2012 As at 1 April 2011 Holding Holding Holding Non-Quoted % Rs. % Rs. % Rs.
Canned & Health Food Limited 47 243,028 47 243,028 47 243,028 Total Carrying Value of Investments in Associate 243,028 243,028 243,028
7. OTHER FINANCIAL ASSETS Group Company As at As at 2013 2012 1 April 2011 2013 2012 1 April 2011 Rs. Rs. Rs. Rs. Rs. Rs.
Loans and receivables Investments in Government Securities – – 260,001,369 – – 260,001,369 Investments in Fixed Deposits 266,924,385 259,192,466 – 266,924,385 259,192,466 – 266,924,385 259,192,466 260,001,369 266,924,385 259,192,466 260,001,369 Available-for-sale investments Investments in Equity Securities (7.1) 5,430,885 5,677,887 8,247,959 4,847,585 5,427,887 7,997,959 5,430,885 5,677,887 8,247,959 4,847,585 5,427,887 7,997,959
Total Current 266,924,385 259,192,466 260,001,369 266,924,385 259,192,466 260,001,369 Total Non-current 5,430,885 5,677,887 8,247,959 4,847,585 5,427,887 7,997,959
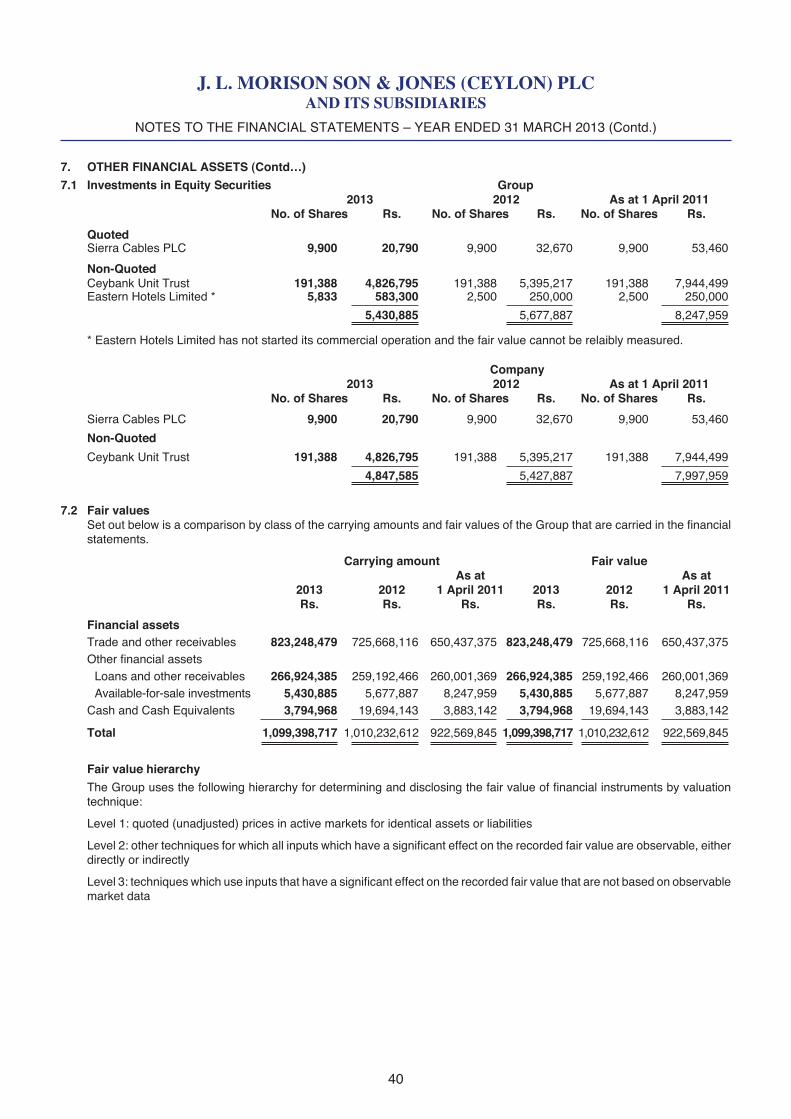
J. L. MORISON SON & JONES (CEYLON) PLCAND ITS SUBSIDIARIES
4140
NOTES TO THE FINANCIAL STATEMENTS – YEAR ENDED 31 MARCH 2013 (Contd.)
7. OTHER FINANCIAL ASSETS (Contd…)7.1 Investments in Equity Securities Group 2013 2012 As at 1 April 2011 No. of Shares Rs. No. of Shares Rs. No. of Shares Rs.
Quoted Sierra Cables PLC 9,900 20,790 9,900 32,670 9,900 53,460
Non-Quoted Ceybank Unit Trust 191,388 4,826,795 191,388 5,395,217 191,388 7,944,499 Eastern Hotels Limited * 5,833 583,300 2,500 250,000 2,500 250,000 5,430,885 5,677,887 8,247,959
* Eastern Hotels Limited has not started its commercial operation and the fair value cannot be relaibly measured.
Company 2013 2012 As at 1 April 2011 No. of Shares Rs. No. of Shares Rs. No. of Shares Rs.
Sierra Cables PLC 9,900 20,790 9,900 32,670 9,900 53,460
Non-Quoted
Ceybank Unit Trust 191,388 4,826,795 191,388 5,395,217 191,388 7,944,499 4,847,585 5,427,887 7,997,959
7.2 Fair values Set out below is a comparison by class of the carrying amounts and fair values of the Group that are carried in the financial
statements.
Carrying amount Fair value As at As at 2013 2012 1 April 2011 2013 2012 1 April 2011 Rs. Rs. Rs. Rs. Rs. Rs.
Financial assets Trade and other receivables 823,248,479 725,668,116 650,437,375 823,248,479 725,668,116 650,437,375 Other financial assets Loans and other receivables 266,924,385 259,192,466 260,001,369 266,924,385 259,192,466 260,001,369 Available-for-sale investments 5,430,885 5,677,887 8,247,959 5,430,885 5,677,887 8,247,959 Cash and Cash Equivalents 3,794,968 19,694,143 3,883,142 3,794,968 19,694,143 3,883,142 Total 1,099,398,717 1,010,232,612 922,569,845 1,099,398,717 1,010,232,612 922,569,845
Fair value hierarchy The Group uses the following hierarchy for determining and disclosing the fair value of financial instruments by valuation
technique:
Level 1: quoted (unadjusted) prices in active markets for identical assets or liabilities
Level 2: other techniques for which all inputs which have a significant effect on the recorded fair value are observable, either directly or indirectly
Level 3: techniques which use inputs that have a significant effect on the recorded fair value that are not based on observable market data
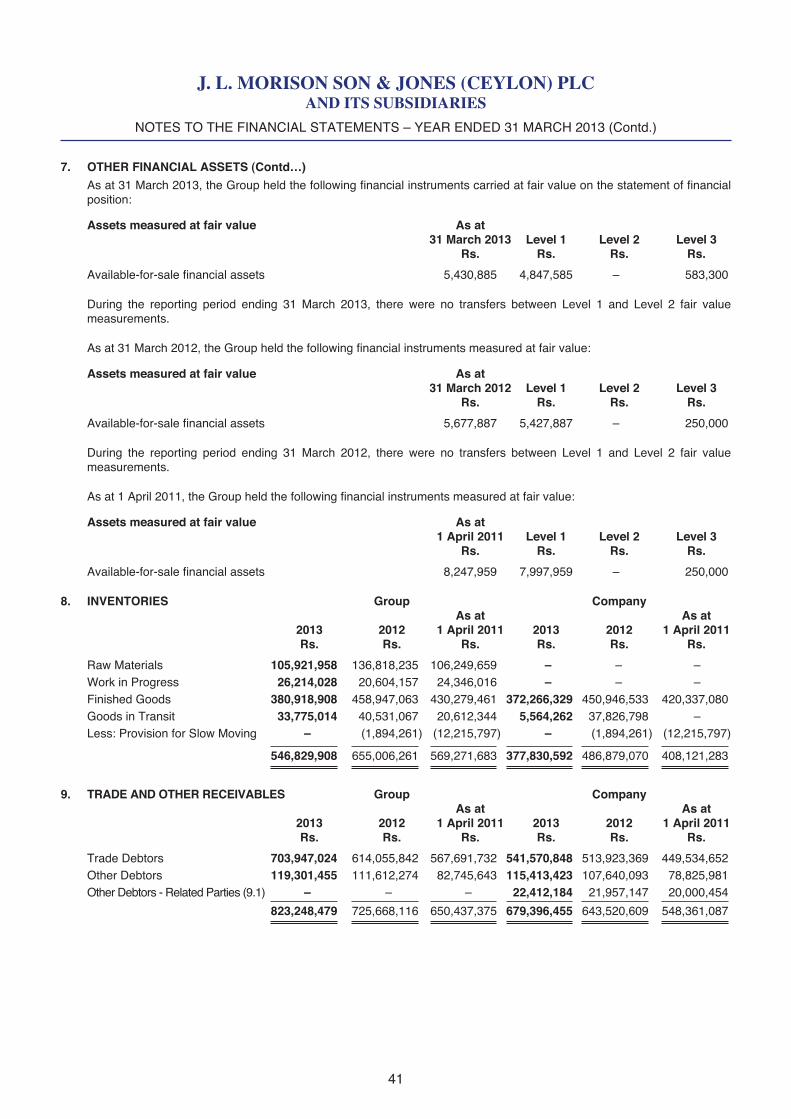
J. L. MORISON SON & JONES (CEYLON) PLCAND ITS SUBSIDIARIES
4140
7. OTHER FINANCIAL ASSETS (Contd…) As at 31 March 2013, the Group held the following financial instruments carried at fair value on the statement of financial
position:
Assets measured at fair value As at 31 March 2013 Level 1 Level 2 Level 3 Rs. Rs. Rs. Rs.
Available-for-sale financial assets 5,430,885 4,847,585 – 583,300
During the reporting period ending 31 March 2013, there were no transfers between Level 1 and Level 2 fair value measurements.
As at 31 March 2012, the Group held the following financial instruments measured at fair value:
Assets measured at fair value As at 31 March 2012 Level 1 Level 2 Level 3 Rs. Rs. Rs. Rs.
Available-for-sale financial assets 5,677,887 5,427,887 – 250,000
During the reporting period ending 31 March 2012, there were no transfers between Level 1 and Level 2 fair value measurements.
As at 1 April 2011, the Group held the following financial instruments measured at fair value:
Assets measured at fair value As at 1 April 2011 Level 1 Level 2 Level 3 Rs. Rs. Rs. Rs.
Available-for-sale financial assets 8,247,959 7,997,959 – 250,000
8. INVENTORIES Group Company As at As at 2013 2012 1 April 2011 2013 2012 1 April 2011 Rs. Rs. Rs. Rs. Rs. Rs.
Raw Materials 105,921,958 136,818,235 106,249,659 – – – Work in Progress 26,214,028 20,604,157 24,346,016 – – – Finished Goods 380,918,908 458,947,063 430,279,461 372,266,329 450,946,533 420,337,080 Goods in Transit 33,775,014 40,531,067 20,612,344 5,564,262 37,826,798 – Less: Provision for Slow Moving – (1,894,261) (12,215,797) – (1,894,261) (12,215,797) 546,829,908 655,006,261 569,271,683 377,830,592 486,879,070 408,121,283
9. TRADE AND OTHER RECEIVABLES Group Company As at As at 2013 2012 1 April 2011 2013 2012 1 April 2011 Rs. Rs. Rs. Rs. Rs. Rs.
Trade Debtors 703,947,024 614,055,842 567,691,732 541,570,848 513,923,369 449,534,652 Other Debtors 119,301,455 111,612,274 82,745,643 115,413,423 107,640,093 78,825,981 Other Debtors - Related Parties (9.1) – – – 22,412,184 21,957,147 20,000,454 823,248,479 725,668,116 650,437,375 679,396,455 643,520,609 548,361,087
NOTES TO THE FINANCIAL STATEMENTS – YEAR ENDED 31 MARCH 2013 (Contd.)
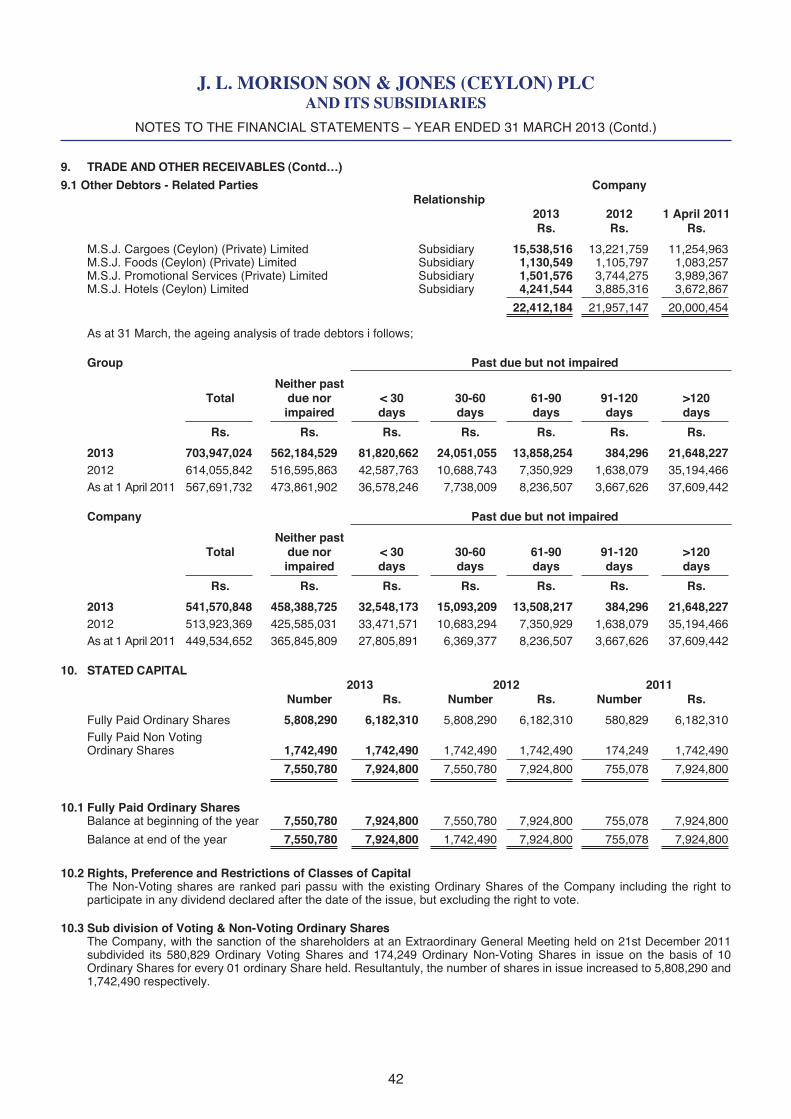
J. L. MORISON SON & JONES (CEYLON) PLCAND ITS SUBSIDIARIES
4342
9. TRADE AND OTHER RECEIVABLES (Contd…)9.1 Other Debtors - Related Parties Company Relationship 2013 2012 1 April 2011 Rs. Rs. Rs.
M.S.J. Cargoes (Ceylon) (Private) Limited Subsidiary 15,538,516 13,221,759 11,254,963 M.S.J. Foods (Ceylon) (Private) Limited Subsidiary 1,130,549 1,105,797 1,083,257 M.S.J. Promotional Services (Private) Limited Subsidiary 1,501,576 3,744,275 3,989,367 M.S.J. Hotels (Ceylon) Limited Subsidiary 4,241,544 3,885,316 3,672,867 22,412,184 21,957,147 20,000,454
As at 31 March, the ageing analysis of trade debtors i follows;
Group Past due but not impaired Neither past Total due nor < 30 30-60 61-90 91-120 >120 impaired days days days days days Rs. Rs. Rs. Rs. Rs. Rs. Rs.
2013 703,947,024 562,184,529 81,820,662 24,051,055 13,858,254 384,296 21,648,227 2012 614,055,842 516,595,863 42,587,763 10,688,743 7,350,929 1,638,079 35,194,466 As at 1 April 2011 567,691,732 473,861,902 36,578,246 7,738,009 8,236,507 3,667,626 37,609,442
Company Past due but not impaired Neither past Total due nor < 30 30-60 61-90 91-120 >120 impaired days days days days days Rs. Rs. Rs. Rs. Rs. Rs. Rs.
2013 541,570,848 458,388,725 32,548,173 15,093,209 13,508,217 384,296 21,648,227 2012 513,923,369 425,585,031 33,471,571 10,683,294 7,350,929 1,638,079 35,194,466 As at 1 April 2011 449,534,652 365,845,809 27,805,891 6,369,377 8,236,507 3,667,626 37,609,442
10. STATED CAPITAL 2013 2012 2011 Number Rs. Number Rs. Number Rs.
Fully Paid Ordinary Shares 5,808,290 6,182,310 5,808,290 6,182,310 580,829 6,182,310 Fully Paid Non Voting Ordinary Shares 1,742,490 1,742,490 1,742,490 1,742,490 174,249 1,742,490 7,550,780 7,924,800 7,550,780 7,924,800 755,078 7,924,800
10.1 Fully Paid Ordinary Shares Balance at beginning of the year 7,550,780 7,924,800 7,550,780 7,924,800 755,078 7,924,800 Balance at end of the year 7,550,780 7,924,800 1,742,490 7,924,800 755,078 7,924,800
10.2 Rights, Preference and Restrictions of Classes of Capital The Non-Voting shares are ranked pari passu with the existing Ordinary Shares of the Company including the right to
participate in any dividend declared after the date of the issue, but excluding the right to vote.
10.3 Sub division of Voting & Non-Voting Ordinary Shares The Company, with the sanction of the shareholders at an Extraordinary General Meeting held on 21st December 2011
subdivided its 580,829 Ordinary Voting Shares and 174,249 Ordinary Non-Voting Shares in issue on the basis of 10 Ordinary Shares for every 01 ordinary Share held. Resultantuly, the number of shares in issue increased to 5,808,290 and 1,742,490 respectively.
NOTES TO THE FINANCIAL STATEMENTS – YEAR ENDED 31 MARCH 2013 (Contd.)
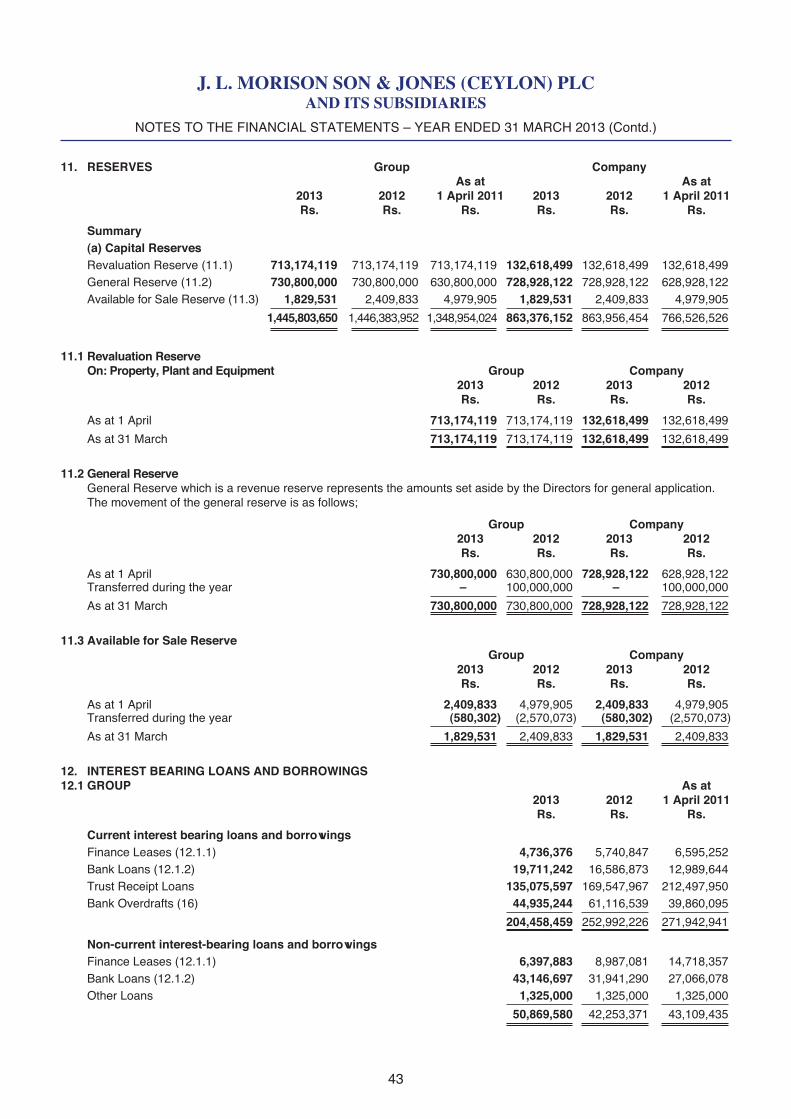
J. L. MORISON SON & JONES (CEYLON) PLCAND ITS SUBSIDIARIES
4342
NOTES TO THE FINANCIAL STATEMENTS – YEAR ENDED 31 MARCH 2013 (Contd.)
11. RESERVES Group Company As at As at 2013 2012 1 April 2011 2013 2012 1 April 2011 Rs. Rs. Rs. Rs. Rs. Rs.
Summary (a) Capital Reserves Revaluation Reserve (11.1) 713,174,119 713,174,119 713,174,119 132,618,499 132,618,499 132,618,499 General Reserve (11.2) 730,800,000 730,800,000 630,800,000 728,928,122 728,928,122 628,928,122 Available for Sale Reserve (11.3) 1,829,531 2,409,833 4,979,905 1,829,531 2,409,833 4,979,905 1,445,803,650 1,446,383,952 1,348,954,024 863,376,152 863,956,454 766,526,526
11.1 Revaluation Reserve On: Property, Plant and Equipment Group Company 2013 2012 2013 2012 Rs. Rs. Rs. Rs.
As at 1 April 713,174,119 713,174,119 132,618,499 132,618,499 As at 31 March 713,174,119 713,174,119 132,618,499 132,618,499
11.2 General Reserve General Reserve which is a revenue reserve represents the amounts set aside by the Directors for general application. The movement of the general reserve is as follows;
Group Company 2013 2012 2013 2012 Rs. Rs. Rs. Rs.
As at 1 April 730,800,000 630,800,000 728,928,122 628,928,122 Transferred during the year – 100,000,000 – 100,000,000 As at 31 March 730,800,000 730,800,000 728,928,122 728,928,122
11.3 Available for Sale Reserve Group Company 2013 2012 2013 2012 Rs. Rs. Rs. Rs.
As at 1 April 2,409,833 4,979,905 2,409,833 4,979,905 Transferred during the year (580,302) (2,570,073) (580,302) (2,570,073) As at 31 March 1,829,531 2,409,833 1,829,531 2,409,833
12. INTEREST BEARING LOANS AND BORROWINGS12.1 GROUP As at 2013 2012 1 April 2011 Rs. Rs. Rs.
Current interest bearing loans and borrowings Finance Leases (12.1.1) 4,736,376 5,740,847 6,595,252 Bank Loans (12.1.2) 19,711,242 16,586,873 12,989,644 Trust Receipt Loans 135,075,597 169,547,967 212,497,950 Bank Overdrafts (16) 44,935,244 61,116,539 39,860,095 204,458,459 252,992,226 271,942,941 Non-current interest-bearing loans and borrowings Finance Leases (12.1.1) 6,397,883 8,987,081 14,718,357 Bank Loans (12.1.2) 43,146,697 31,941,290 27,066,078 Other Loans 1,325,000 1,325,000 1,325,000 50,869,580 42,253,371 43,109,435
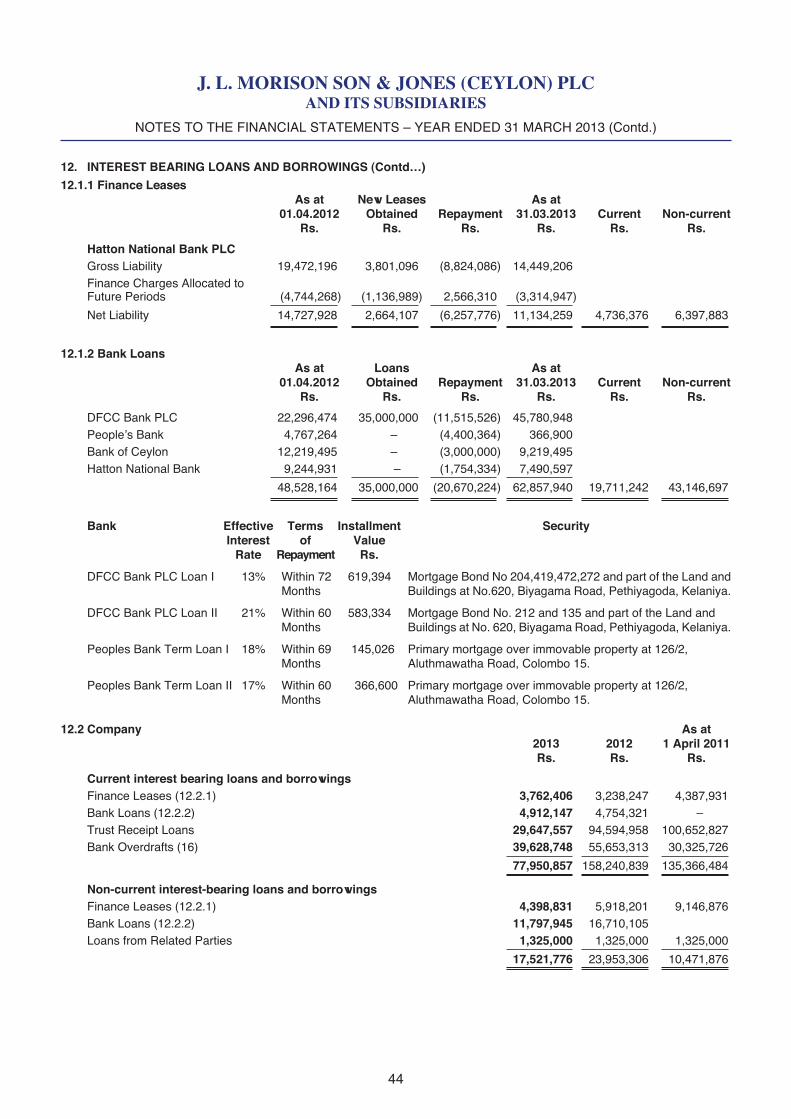
J. L. MORISON SON & JONES (CEYLON) PLCAND ITS SUBSIDIARIES
4544
NOTES TO THE FINANCIAL STATEMENTS – YEAR ENDED 31 MARCH 2013 (Contd.)
12. INTEREST BEARING LOANS AND BORROWINGS (Contd…)12.1.1 Finance Leases As at New Leases As at 01.04.2012 Obtained Repayment 31.03.2013 Current Non-current Rs. Rs. Rs. Rs. Rs. Rs.
Hatton National Bank PLC Gross Liability 19,472,196 3,801,096 (8,824,086) 14,449,206 Finance Charges Allocated to Future Periods (4,744,268) (1,136,989) 2,566,310 (3,314,947) Net Liability 14,727,928 2,664,107 (6,257,776) 11,134,259 4,736,376 6,397,883
12.1.2 Bank Loans As at Loans As at 01.04.2012 Obtained Repayment 31.03.2013 Current Non-current Rs. Rs. Rs. Rs. Rs. Rs.
DFCC Bank PLC 22,296,474 35,000,000 (11,515,526) 45,780,948 People’s Bank 4,767,264 – (4,400,364) 366,900 Bank of Ceylon 12,219,495 – (3,000,000) 9,219,495 Hatton National Bank 9,244,931 – (1,754,334) 7,490,597 48,528,164 35,000,000 (20,670,224) 62,857,940 19,711,242 43,146,697
Bank Effective Terms Installment Security Interest of Value Rate Repayment Rs.
DFCC Bank PLC Loan I 13% Within 72 619,394 Mortgage Bond No 204,419,472,272 and part of the Land and Months Buildings at No.620, Biyagama Road, Pethiyagoda, Kelaniya.
DFCC Bank PLC Loan II 21% Within 60 583,334 Mortgage Bond No. 212 and 135 and part of the Land and Months Buildings at No. 620, Biyagama Road, Pethiyagoda, Kelaniya.
Peoples Bank Term Loan I 18% Within 69 145,026 Primary mortgage over immovable property at 126/2, Months Aluthmawatha Road, Colombo 15.
Peoples Bank Term Loan II 17% Within 60 366,600 Primary mortgage over immovable property at 126/2, Months Aluthmawatha Road, Colombo 15.
12.2 Company As at 2013 2012 1 April 2011 Rs. Rs. Rs.
Current interest bearing loans and borrowings Finance Leases (12.2.1) 3,762,406 3,238,247 4,387,931 Bank Loans (12.2.2) 4,912,147 4,754,321 – Trust Receipt Loans 29,647,557 94,594,958 100,652,827 Bank Overdrafts (16) 39,628,748 55,653,313 30,325,726 77,950,857 158,240,839 135,366,484 Non-current interest-bearing loans and borrowings Finance Leases (12.2.1) 4,398,831 5,918,201 9,146,876 Bank Loans (12.2.2) 11,797,945 16,710,105 Loans from Related Parties 1,325,000 1,325,000 1,325,000 17,521,776 23,953,306 10,471,876
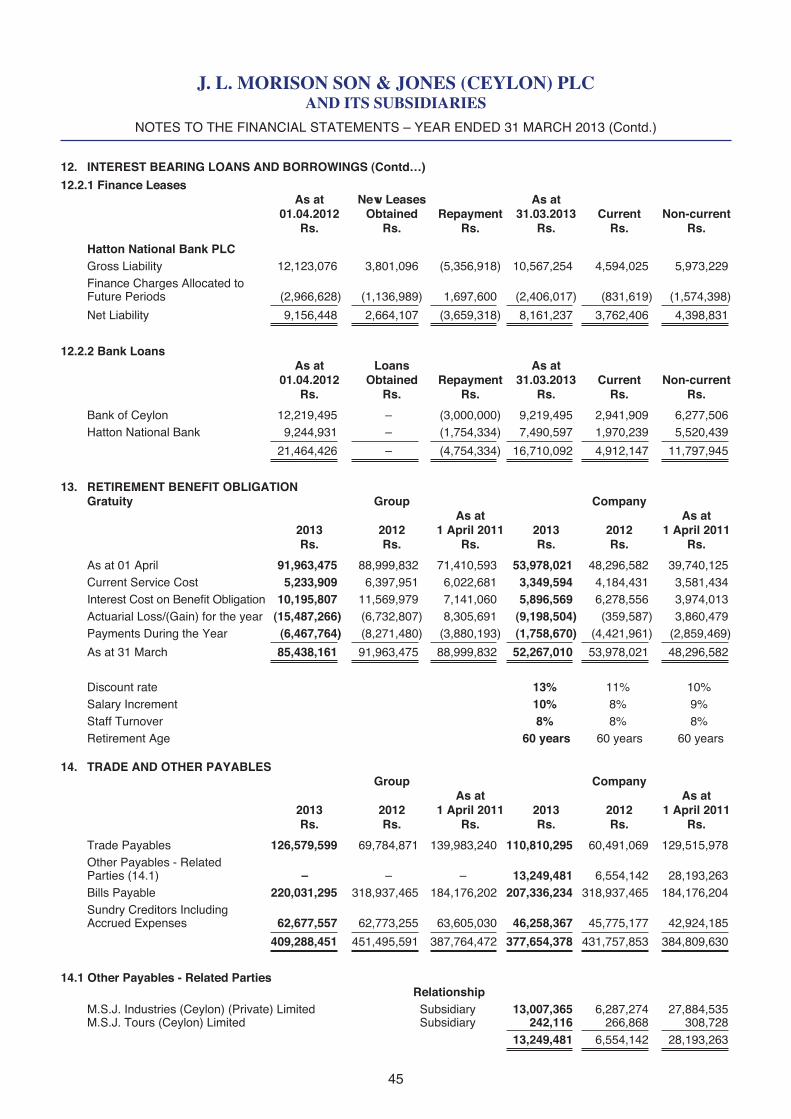
J. L. MORISON SON & JONES (CEYLON) PLCAND ITS SUBSIDIARIES
4544
12. INTEREST BEARING LOANS AND BORROWINGS (Contd…)12.2.1 Finance Leases As at New Leases As at 01.04.2012 Obtained Repayment 31.03.2013 Current Non-current Rs. Rs. Rs. Rs. Rs. Rs.
Hatton National Bank PLC Gross Liability 12,123,076 3,801,096 (5,356,918) 10,567,254 4,594,025 5,973,229 Finance Charges Allocated to Future Periods (2,966,628) (1,136,989) 1,697,600 (2,406,017) (831,619) (1,574,398) Net Liability 9,156,448 2,664,107 (3,659,318) 8,161,237 3,762,406 4,398,831
12.2.2 Bank Loans As at Loans As at 01.04.2012 Obtained Repayment 31.03.2013 Current Non-current Rs. Rs. Rs. Rs. Rs. Rs.
Bank of Ceylon 12,219,495 – (3,000,000) 9,219,495 2,941,909 6,277,506 Hatton National Bank 9,244,931 – (1,754,334) 7,490,597 1,970,239 5,520,439 21,464,426 – (4,754,334) 16,710,092 4,912,147 11,797,945
13. RETIREMENT BENEFIT OBLIGATION Gratuity Group Company As at As at 2013 2012 1 April 2011 2013 2012 1 April 2011 Rs. Rs. Rs. Rs. Rs. Rs.
As at 01 April 91,963,475 88,999,832 71,410,593 53,978,021 48,296,582 39,740,125 Current Service Cost 5,233,909 6,397,951 6,022,681 3,349,594 4,184,431 3,581,434 Interest Cost on Benefit Obligation 10,195,807 11,569,979 7,141,060 5,896,569 6,278,556 3,974,013 Actuarial Loss/(Gain) for the year (15,487,266) (6,732,807) 8,305,691 (9,198,504) (359,587) 3,860,479 Payments During the Year (6,467,764) (8,271,480) (3,880,193) (1,758,670) (4,421,961) (2,859,469) As at 31 March 85,438,161 91,963,475 88,999,832 52,267,010 53,978,021 48,296,582
Discount rate 13% 11% 10% Salary Increment 10% 8% 9% Staff Turnover 8% 8% 8% Retirement Age 60 years 60 years 60 years
14. TRADE AND OTHER PAYABLES Group Company As at As at 2013 2012 1 April 2011 2013 2012 1 April 2011 Rs. Rs. Rs. Rs. Rs. Rs.
Trade Payables 126,579,599 69,784,871 139,983,240 110,810,295 60,491,069 129,515,978 Other Payables - Related Parties (14.1) – – – 13,249,481 6,554,142 28,193,263 Bills Payable 220,031,295 318,937,465 184,176,202 207,336,234 318,937,465 184,176,204 Sundry Creditors Including Accrued Expenses 62,677,557 62,773,255 63,605,030 46,258,367 45,775,177 42,924,185 409,288,451 451,495,591 387,764,472 377,654,378 431,757,853 384,809,630
14.1 Other Payables - Related Parties Relationship M.S.J. Industries (Ceylon) (Private) Limited Subsidiary 13,007,365 6,287,274 27,884,535
M.S.J. Tours (Ceylon) Limited Subsidiary 242,116 266,868 308,728 13,249,481 6,554,142 28,193,263
NOTES TO THE FINANCIAL STATEMENTS – YEAR ENDED 31 MARCH 2013 (Contd.)
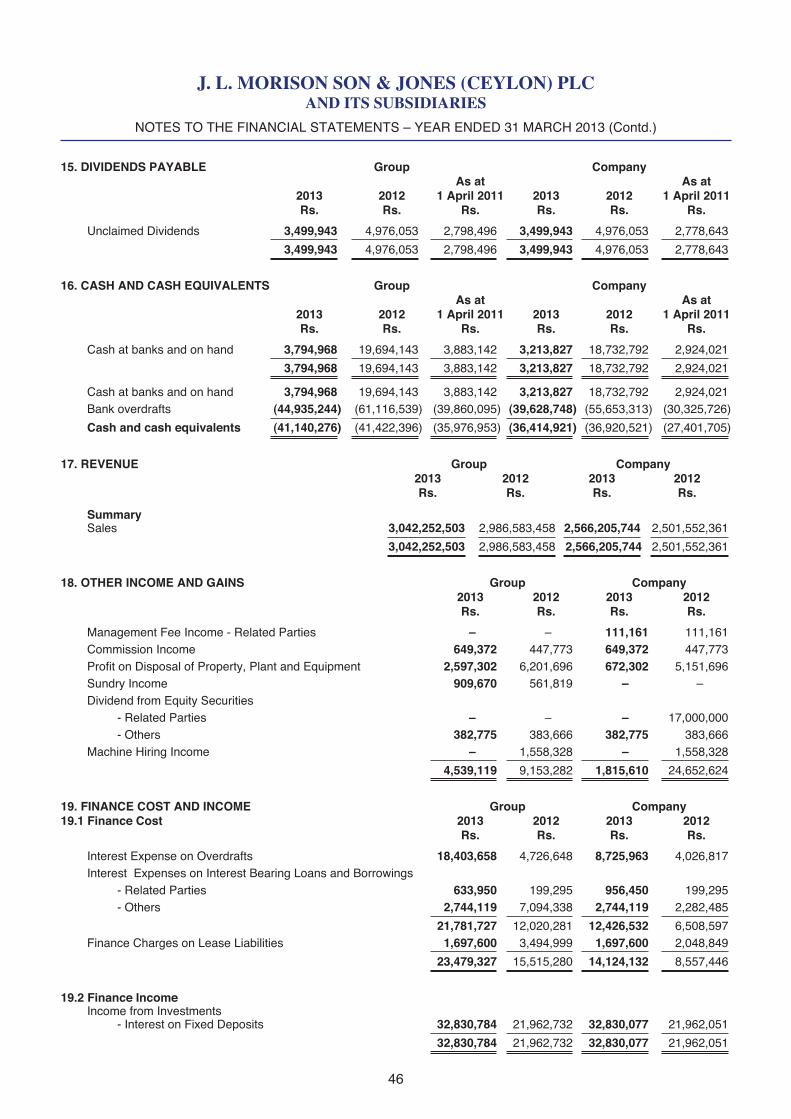
J. L. MORISON SON & JONES (CEYLON) PLCAND ITS SUBSIDIARIES
4746
15. DIVIDENDS PAYABLE Group Company As at As at 2013 2012 1 April 2011 2013 2012 1 April 2011 Rs. Rs. Rs. Rs. Rs. Rs.
Unclaimed Dividends 3,499,943 4,976,053 2,798,496 3,499,943 4,976,053 2,778,643 3,499,943 4,976,053 2,798,496 3,499,943 4,976,053 2,778,643
16. CASH AND CASH EQUIVALENTS Group Company As at As at 2013 2012 1 April 2011 2013 2012 1 April 2011 Rs. Rs. Rs. Rs. Rs. Rs.
Cash at banks and on hand 3,794,968 19,694,143 3,883,142 3,213,827 18,732,792 2,924,021 3,794,968 19,694,143 3,883,142 3,213,827 18,732,792 2,924,021 Cash at banks and on hand 3,794,968 19,694,143 3,883,142 3,213,827 18,732,792 2,924,021 Bank overdrafts (44,935,244) (61,116,539) (39,860,095) (39,628,748) (55,653,313) (30,325,726) Cash and cash equivalents (41,140,276) (41,422,396) (35,976,953) (36,414,921) (36,920,521) (27,401,705)
17. REVENUE Group Company 2013 2012 2013 2012 Rs. Rs. Rs. Rs.
Summary Sales 3,042,252,503 2,986,583,458 2,566,205,744 2,501,552,361 3,042,252,503 2,986,583,458 2,566,205,744 2,501,552,361
18. OTHER INCOME AND GAINS Group Company 2013 2012 2013 2012 Rs. Rs. Rs. Rs.
Management Fee Income - Related Parties – – 111,161 111,161 Commission Income 649,372 447,773 649,372 447,773 Profit on Disposal of Property, Plant and Equipment 2,597,302 6,201,696 672,302 5,151,696 Sundry Income 909,670 561,819 – – Dividend from Equity Securities - Related Parties – – – 17,000,000 - Others 382,775 383,666 382,775 383,666 Machine Hiring Income – 1,558,328 – 1,558,328 4,539,119 9,153,282 1,815,610 24,652,624
19. FINANCE COST AND INCOME Group Company19.1 Finance Cost 2013 2012 2013 2012 Rs. Rs. Rs. Rs.
Interest Expense on Overdrafts 18,403,658 4,726,648 8,725,963 4,026,817 Interest Expenses on Interest Bearing Loans and Borrowings - Related Parties 633,950 199,295 956,450 199,295 - Others 2,744,119 7,094,338 2,744,119 2,282,485 21,781,727 12,020,281 12,426,532 6,508,597 Finance Charges on Lease Liabilities 1,697,600 3,494,999 1,697,600 2,048,849 23,479,327 15,515,280 14,124,132 8,557,446
19.2 Finance Income Income from Investments - Interest on Fixed Deposits 32,830,784 21,962,732 32,830,077 21,962,051 32,830,784 21,962,732 32,830,077 21,962,051
NOTES TO THE FINANCIAL STATEMENTS – YEAR ENDED 31 MARCH 2013 (Contd.)

J. L. MORISON SON & JONES (CEYLON) PLCAND ITS SUBSIDIARIES
4746
20. PROFIT BEFORE TAX Group Company Stated after Charging /Crediting 2013 2012 2013 2012 Rs. Rs. Rs. Rs.
Included in Cost of Sales Employees Benefits including the following - Defined Contribution Plan Costs - EPF and ETF 7,552,605 7,638,672 – – - Salaries 66,604,920 61,888,906 – – - Bonus 5,840,276 4,896,883 – – Depreciation 11,506,688 11,103,885 – – Trust Receipt Loan Interest 28,903,770 15,613,283 12,936,530 7,468,733
Included in Administrative Expenses Employees Benefits including the following - Defined Benefit Plan Costs -Gratuity (57,550) 11,235,123 47,659 10,103,400 - Defined Contribution Plan Costs - EPF and ETF 7,093,599 6,473,734 5,461,274 4,886,939 - Salaries 100,077,914 77,684,455 55,248,994 48,566,936 - Bonus 7,477,033 6,028,000 4,485,761 3,963,465 Depreciation 20,614,128 18,691,168 19,271,956 17,270,345 Audit Fees 1,930,000 1,674,000 966,000 840,000
Included in Selling and Distribution Costs Depreciation 7,494,650 6,716,245 7,494,650 6,716,245 Transport Costs 106,011,093 98,454,860 98,700,320 92,271,642 Advertising Costs 52,994,956 22,844,966 52,973,956 22,721,782
21. INCOME TAX EXPENSE The major components of income tax expense for the years ended 31 March are as follows : Group Company Income Statement 2013 2012 2013 2012 Current Income Tax Rs. Rs. Rs. Rs.
Current Income Tax charge (21.1) 59,062,002 88,888,797 43,221,242 59,133,111 Dividend Tax – 1,700,000 – 1,700,000 Under/(Over) Provision of current taxes in respect of prior years – (2,675,592) – 10,254 59,062,002 87,913,205 43,221,242 60,843,365 Deferred Income Tax Deferred Taxation Charge/(Reversal) (21.2) 7,806,846 5,637,641 1,323,033 (134,474) 66,868,848 93,550,846 44,544,274 60,708,891
NOTES TO THE FINANCIAL STATEMENTS – YEAR ENDED 31 MARCH 2013 (Contd.)
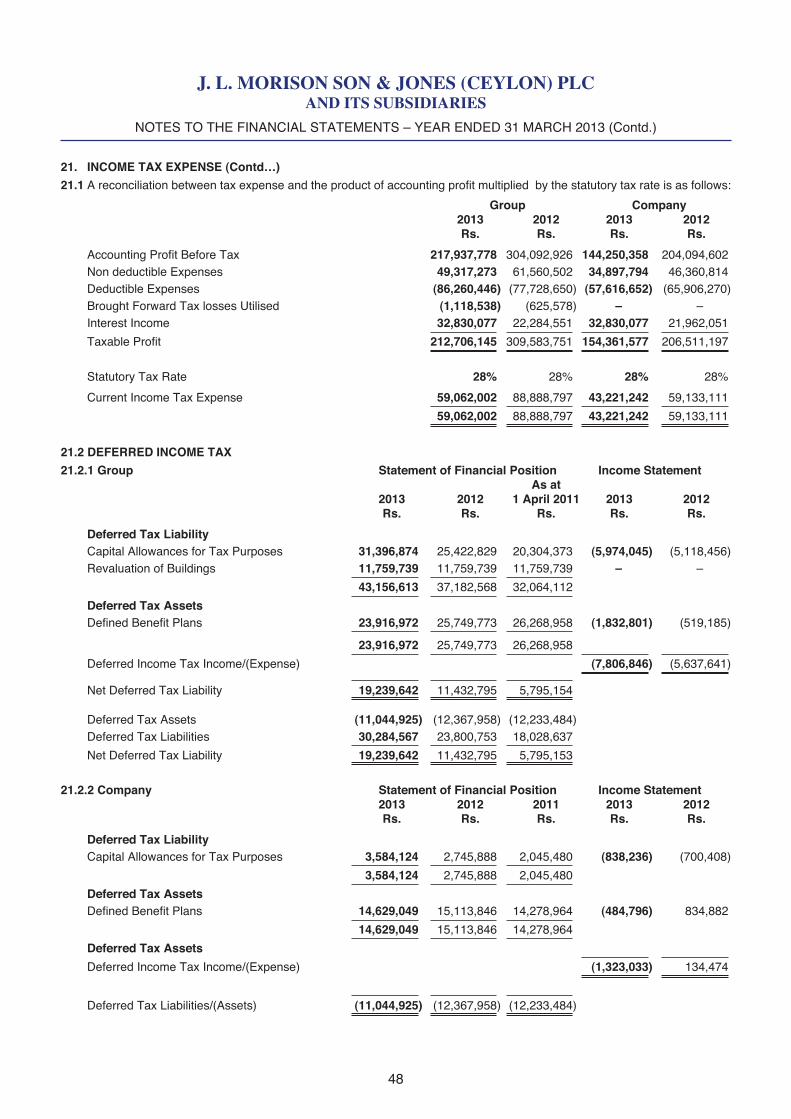
J. L. MORISON SON & JONES (CEYLON) PLCAND ITS SUBSIDIARIES
4948
21. INCOME TAX EXPENSE (Contd…)21.1 A reconciliation between tax expense and the product of accounting profit multiplied by the statutory tax rate is as follows:
Group Company 2013 2012 2013 2012 Rs. Rs. Rs. Rs.
Accounting Profit Before Tax 217,937,778 304,092,926 144,250,358 204,094,602 Non deductible Expenses 49,317,273 61,560,502 34,897,794 46,360,814 Deductible Expenses (86,260,446) (77,728,650) (57,616,652) (65,906,270) Brought Forward Tax losses Utilised (1,118,538) (625,578) – – Interest Income 32,830,077 22,284,551 32,830,077 21,962,051 Taxable Profit 212,706,145 309,583,751 154,361,577 206,511,197
Statutory Tax Rate 28% 28% 28% 28%
Current Income Tax Expense 59,062,002 88,888,797 43,221,242 59,133,111 59,062,002 88,888,797 43,221,242 59,133,111
21.2 DEFERRED INCOME TAX 21.2.1 Group Statement of Financial Position Income Statement As at 2013 2012 1 April 2011 2013 2012 Rs. Rs. Rs. Rs. Rs.
Deferred Tax Liability Capital Allowances for Tax Purposes 31,396,874 25,422,829 20,304,373 (5,974,045) (5,118,456) Revaluation of Buildings 11,759,739 11,759,739 11,759,739 – – 43,156,613 37,182,568 32,064,112 Deferred Tax Assets Defined Benefit Plans 23,916,972 25,749,773 26,268,958 (1,832,801) (519,185) 23,916,972 25,749,773 26,268,958 Deferred Income Tax Income/(Expense) (7,806,846) (5,637,641) Net Deferred Tax Liability 19,239,642 11,432,795 5,795,154
Deferred Tax Assets (11,044,925) (12,367,958) (12,233,484) Deferred Tax Liabilities 30,284,567 23,800,753 18,028,637 Net Deferred Tax Liability 19,239,642 11,432,795 5,795,153
21.2.2 Company Statement of Financial Position Income Statement 2013 2012 2011 2013 2012 Rs. Rs. Rs. Rs. Rs.
Deferred Tax Liability Capital Allowances for Tax Purposes 3,584,124 2,745,888 2,045,480 (838,236) (700,408) 3,584,124 2,745,888 2,045,480 Deferred Tax Assets Defined Benefit Plans 14,629,049 15,113,846 14,278,964 (484,796) 834,882 14,629,049 15,113,846 14,278,964 Deferred Tax Assets Deferred Income Tax Income/(Expense) (1,323,033) 134,474 Deferred Tax Liabilities/(Assets) (11,044,925) (12,367,958) (12,233,484)
NOTES TO THE FINANCIAL STATEMENTS – YEAR ENDED 31 MARCH 2013 (Contd.)
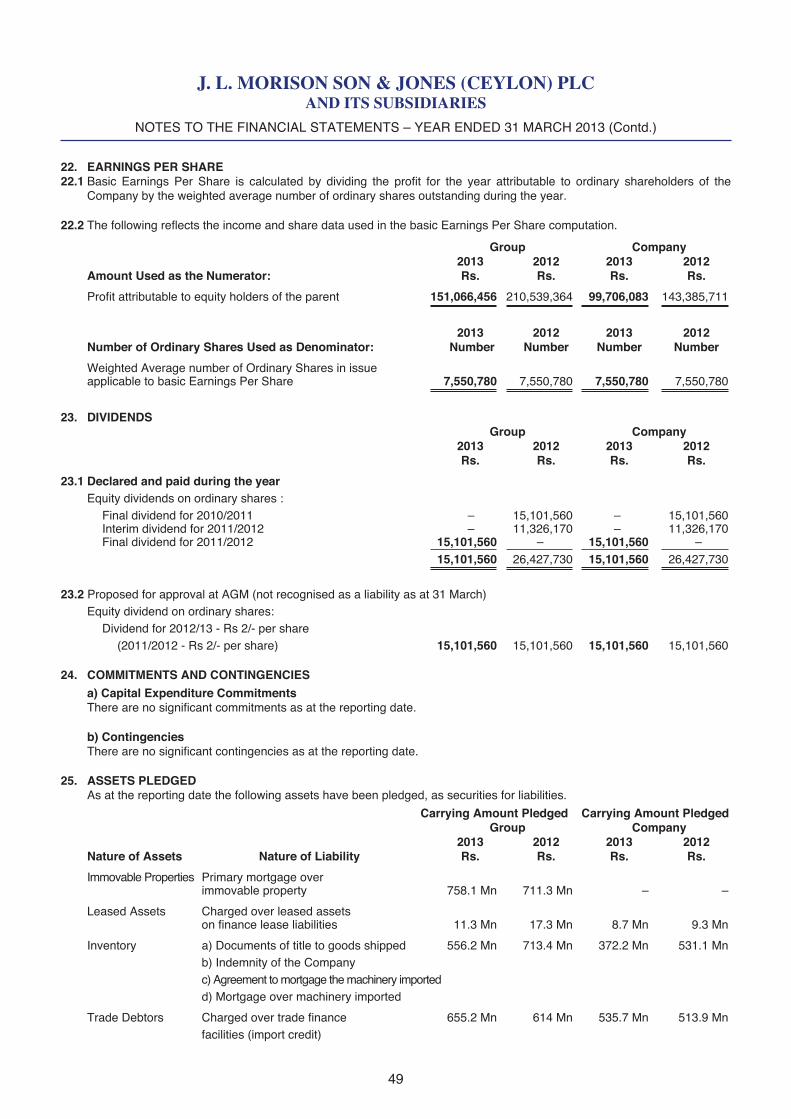
J. L. MORISON SON & JONES (CEYLON) PLCAND ITS SUBSIDIARIES
4948
22. EARNINGS PER SHARE 22.1 Basic Earnings Per Share is calculated by dividing the profit for the year attributable to ordinary shareholders of the
Company by the weighted average number of ordinary shares outstanding during the year.
22.2 The following reflects the income and share data used in the basic Earnings Per Share computation.
Group Company 2013 2012 2013 2012 Amount Used as the Numerator: Rs. Rs. Rs. Rs.
Profit attributable to equity holders of the parent 151,066,456 210,539,364 99,706,083 143,385,711
2013 2012 2013 2012 Number of Ordinary Shares Used as Denominator: Number Number Number Number
Weighted Average number of Ordinary Shares in issue applicable to basic Earnings Per Share 7,550,780 7,550,780 7,550,780 7,550,780
23. DIVIDENDS Group Company 2013 2012 2013 2012 Rs. Rs. Rs. Rs.
23.1 Declared and paid during the year Equity dividends on ordinary shares : Final dividend for 2010/2011 – 15,101,560 – 15,101,560 Interim dividend for 2011/2012 – 11,326,170 – 11,326,170 Final dividend for 2011/2012 15,101,560 – 15,101,560 – 15,101,560 26,427,730 15,101,560 26,427,730
23.2 Proposed for approval at AGM (not recognised as a liability as at 31 March) Equity dividend on ordinary shares: Dividend for 2012/13 - Rs 2/- per share (2011/2012 - Rs 2/- per share) 15,101,560 15,101,560 15,101,560 15,101,560
24. COMMITMENTS AND CONTINGENCIES a) Capital Expenditure Commitments There are no significant commitments as at the reporting date.
b) Contingencies There are no significant contingencies as at the reporting date.
25. ASSETS PLEDGED As at the reporting date the following assets have been pledged, as securities for liabilities.
Carrying Amount Pledged Carrying Amount Pledged Group Company 2013 2012 2013 2012 Nature of Assets Nature of Liability Rs. Rs. Rs. Rs.
Immovable Properties Primary mortgage over immovable property 758.1 Mn 711.3 Mn – –
Leased Assets Charged over leased assets on finance lease liabilities 11.3 Mn 17.3 Mn 8.7 Mn 9.3 Mn
Inventory a) Documents of title to goods shipped 556.2 Mn 713.4 Mn 372.2 Mn 531.1 Mn b) Indemnity of the Company c) Agreement to mortgage the machinery imported d) Mortgage over machinery imported
Trade Debtors Charged over trade finance 655.2 Mn 614 Mn 535.7 Mn 513.9 Mn facilities (import credit)
NOTES TO THE FINANCIAL STATEMENTS – YEAR ENDED 31 MARCH 2013 (Contd.)
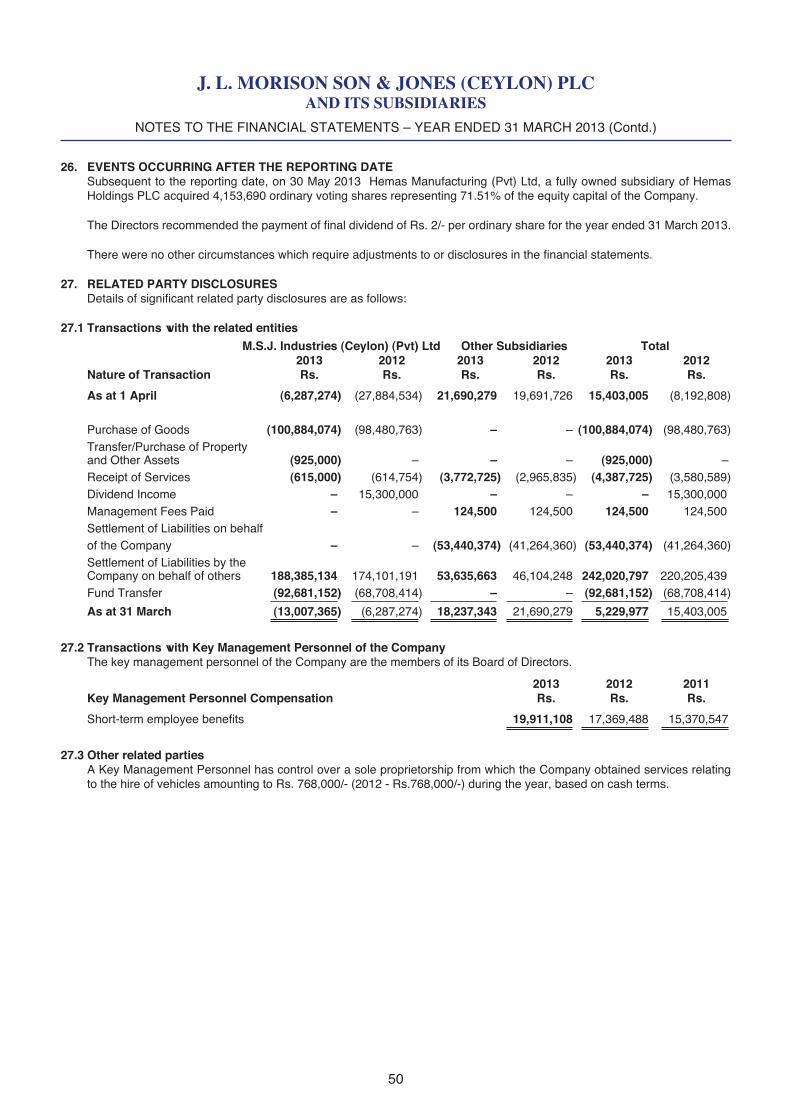
J. L. MORISON SON & JONES (CEYLON) PLCAND ITS SUBSIDIARIES
5150
26. EVENTS OCCURRING AFTER THE REPORTING DATE Subsequent to the reporting date, on 30 May 2013 Hemas Manufacturing (Pvt) Ltd, a fully owned subsidiary of Hemas
Holdings PLC acquired 4,153,690 ordinary voting shares representing 71.51% of the equity capital of the Company.
The Directors recommended the payment of final dividend of Rs. 2/- per ordinary share for the year ended 31 March 2013.
There were no other circumstances which require adjustments to or disclosures in the financial statements.
27. RELATED PARTY DISCLOSURES Details of significant related party disclosures are as follows:
27.1 Transactions with the related entities M.S.J. Industries (Ceylon) (Pvt) Ltd Other Subsidiaries Total 2013 2012 2013 2012 2013 2012 Nature of Transaction Rs. Rs. Rs. Rs. Rs. Rs.
As at 1 April (6,287,274) (27,884,534) 21,690,279 19,691,726 15,403,005 (8,192,808) Purchase of Goods (100,884,074) (98,480,763) – – (100,884,074) (98,480,763) Transfer/Purchase of Property and Other Assets (925,000) – – – (925,000) – Receipt of Services (615,000) (614,754) (3,772,725) (2,965,835) (4,387,725) (3,580,589) Dividend Income – 15,300,000 – – – 15,300,000 Management Fees Paid – – 124,500 124,500 124,500 124,500 Settlement of Liabilities on behalf of the Company – – (53,440,374) (41,264,360) (53,440,374) (41,264,360) Settlement of Liabilities by the Company on behalf of others 188,385,134 174,101,191 53,635,663 46,104,248 242,020,797 220,205,439 Fund Transfer (92,681,152) (68,708,414) – – (92,681,152) (68,708,414) As at 31 March (13,007,365) (6,287,274) 18,237,343 21,690,279 5,229,977 15,403,005
27.2 Transactions with Key Management Personnel of the Company The key management personnel of the Company are the members of its Board of Directors.
2013 2012 2011 Key Management Personnel Compensation Rs. Rs. Rs.
Short-term employee benefits 19,911,108 17,369,488 15,370,547
27.3 Other related parties A Key Management Personnel has control over a sole proprietorship from which the Company obtained services relating
to the hire of vehicles amounting to Rs. 768,000/- (2012 - Rs.768,000/-) during the year, based on cash terms.
NOTES TO THE FINANCIAL STATEMENTS – YEAR ENDED 31 MARCH 2013 (Contd.)
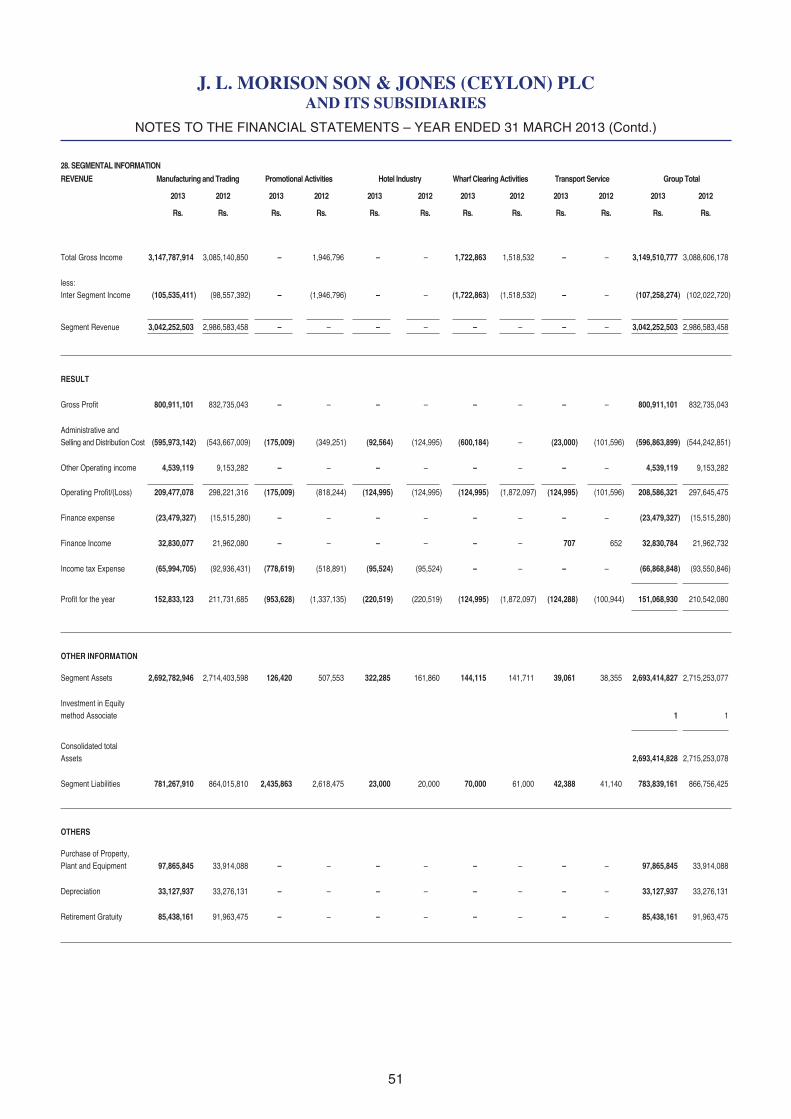
J. L. MORISON SON & JONES (CEYLON) PLCAND ITS SUBSIDIARIES
5150
NOTES TO THE FINANCIAL STATEMENTS – YEAR ENDED 31 MARCH 2013 (Contd.)
28. SEGMENTAL INFORMATION
REVENUE Manufacturing and Trading Promotional Activities Hotel Industry Wharf Clearing Activities Transport Service Group Total
2013 2012 2013 2012 2013 2012 2013 2012 2013 2012 2013 2012
Rs. Rs. Rs. Rs. Rs. Rs. Rs. Rs. Rs. Rs. Rs. Rs.
Total Gross Income 3,147,787,914 3,085,140,850 – 1,946,796 – – 1,722,863 1,518,532 – – 3,149,510,777 3,088,606,178
less: Inter Segment Income (105,535,411) (98,557,392) – (1,946,796) – – (1,722,863) (1,518,532) – – (107,258,274) (102,022,720)
Segment Revenue 3,042,252,503 2,986,583,458 – – – – – – – – 3,042,252,503 2,986,583,458
RESULT
Gross Profit 800,911,101 832,735,043 – – – – – – – – 800,911,101 832,735,043
Administrative and Selling and Distribution Cost (595,973,142) (543,667,009) (175,009) (349,251) (92,564) (124,995) (600,184) – (23,000) (101,596) (596,863,899) (544,242,851)
Other Operating income 4,539,119 9,153,282 – – – – – – – – 4,539,119 9,153,282
Operating Profit/(Loss) 209,477,078 298,221,316 (175,009) (818,244) (124,995) (124,995) (124,995) (1,872,097) (124,995) (101,596) 208,586,321 297,645,475
Finance expense (23,479,327) (15,515,280) – – – – – – – – (23,479,327) (15,515,280)
Finance Income 32,830,077 21,962,080 – – – – – – 707 652 32,830,784 21,962,732
Income tax Expense (65,994,705) (92,936,431) (778,619) (518,891) (95,524) (95,524) – – – – (66,868,848) (93,550,846)
Profit for the year 152,833,123 211,731,685 (953,628) (1,337,135) (220,519) (220,519) (124,995) (1,872,097) (124,288) (100,944) 151,068,930 210,542,080
OTHER INFORMATION
Segment Assets 2,692,782,946 2,714,403,598 126,420 507,553 322,285 161,860 144,115 141,711 39,061 38,355 2,693,414,827 2,715,253,077
Investment in Equitymethod Associate 1 1
Consolidated totalAssets 2,693,414,828 2,715,253,078
Segment Liabilities 781,267,910 864,015,810 2,435,863 2,618,475 23,000 20,000 70,000 61,000 42,388 41,140 783,839,161 866,756,425
OTHERS
Purchase of Property,Plant and Equipment 97,865,845 33,914,088 – – – – – – – – 97,865,845 33,914,088
Depreciation 33,127,937 33,276,131 – – – – – – – – 33,127,937 33,276,131
Retirement Gratuity 85,438,161 91,963,475 – – – – – – – – 85,438,161 91,963,475
J. L. MORISON SON & JONES (CEYLON) PLCAND ITS SUBSIDIARIES
5352
NOTES TO THE FINANCIAL STATEMENTS – YEAR ENDED 31 MARCH 2013 (Contd.)
29. FINANCIAL RISK MANAGEMENT OBJECTIVES AND POLICIES The Group’s principal financial liabilities, comprise loans and borrowings and trade and other payables. The main purpose
of these financial liabilities is to finance the Group’s operations and to provide guarantees to support its operations. The Group has loans and other receivables, trade and other receivables, and cash and short-term deposits that arrive directly from its operations. The Group also holds available-for-sale investments and enters into derivative transactions.
The Group is exposed to market risk, credit risk and liquidity risk
“The Group’s senior management oversees the management of these risks. The senior management is supported by the Board of Directors (BOD) that advises on financial risks and the appropriate financial risk governance framework for the Group. BOD provides assurance to the Group’s senior management that the Group’s financial risk-taking activities are governed by appropriate policies and procedures and that financial risks are identified, measured and managed in accordance with group policies and group risk appetite. It is the Group’s policy that all derivative activities for risk management purposes are required to be approved by Board of Directors of J. L. Morrison Son & Jones (Ceylon) PLC.”
The Board of Directors reviews and agrees policies for managing each of these risks which are summarized below.
Market risk Market risk is the risk that the fair value of future cash flows of a financial instrument will fluctuate because of changes in
market prices. Market prices comprise four types of risk: interest rate risk, currency risk, commodity price risk and other price risk, such as equity price risk. Financial instruments affected by market risk include loans and borrowings, deposits and available-for-sale investments.
The overall risk management program focuses on the unpredictability of financial markets and seeks to minimize potential adverse effects on the entity’s financial performance.
Interest rate risk Interest rate risk is the risk that the fair value or future cash flows of a financial instrument will fluctuate because of changes
in market interest rates. The Group’s exposure to the risk of changes in market interest rates relates primarily to the Group’s long-term debt obligations with floating interest rates.
The Group manages its interest rate risk by having a balanced portfolio of fixed and variable rate loans and borrowings. The Group’s policy is to maintain an appropriate balance between fixed and variable rate borrowings.
Foreign currency risk Foreign currency risk is the risk that the fair value or future cash flows of a financial instrument will fluctuate because of
changes in foreign exchange rates. The Group’s exposure to the risk of changes in foreign exchange rates relates primarily to the import of raw materials, finished goods and packing materials.
The major part of the foreign transactions is dealt with US Dollars and Euros.
Commodity price risk The Group is affected by the volatility of certain commodities. Its operating activities require the ongoing purchase of certain
raw materials and finished goods and therefore require a continuous supply of these raw materials and finished goods. Due to the significantly increased volatility of the price of the underlying, the Group’s Board of Directors has developed and enacted a risk management strategy regarding commodity price risk and its mitigation.
Equity price risk The Group’s quoted and unquoted equity securities are susceptible to market price risk arising from uncertainties about
future values of the investment securities. The Group’s Board of Directors reviews and approves all equity investment decisions.
At the reporting date, the exposure to listed and unlisted equity securities at fair value was Rs. 4,847,585/-.
Credit risk Credit risk is the risk that counterparty will not meet its obligations under a financial instrument or customer contract, leading
to a financial loss. The Group is exposed to credit risk from its operating activities (primarily for trade receivables) and from its financing activities, including deposits with banks, foreign exchange transactions and other financial instruments.
Trade receivables Customer credit risk is managed by each company subject to the Group’s established policy, procedures and control
relating to customer credit risk management. Credit quality of the customer is assessed based on the credit risk evaluation model and individual credit limits are defined in accordance with this assessment.
Outstanding customer receivables are regularly monitored.
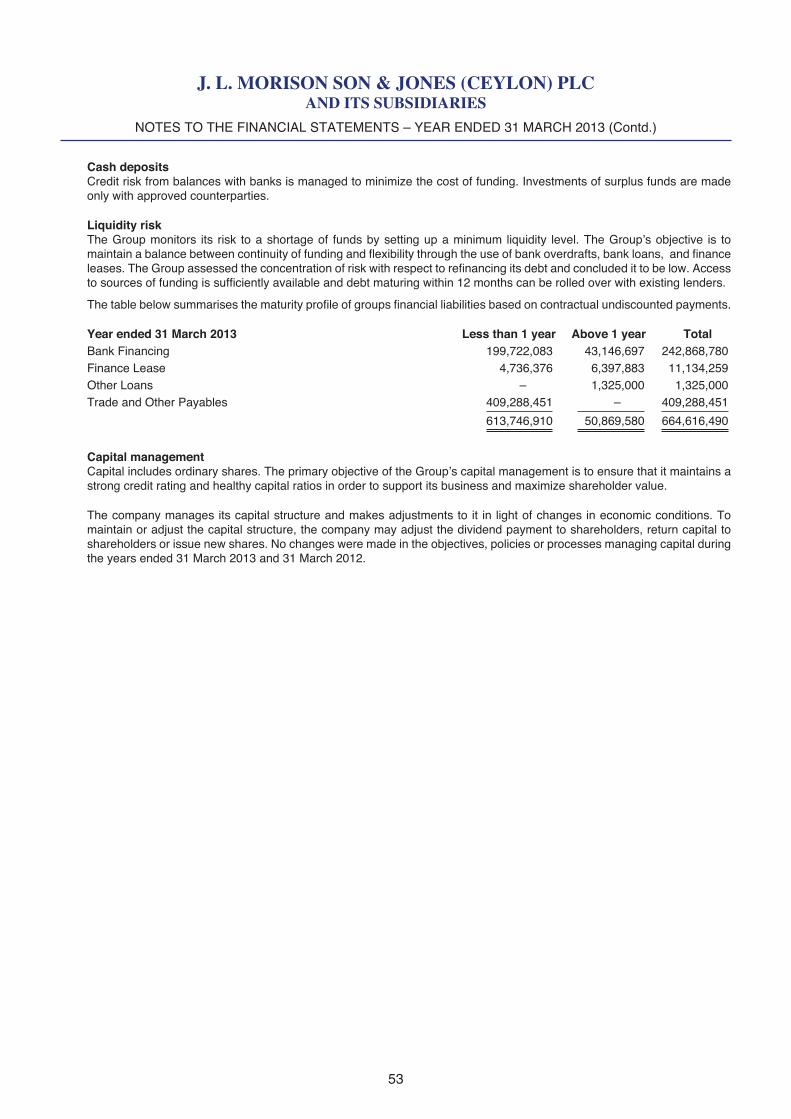
J. L. MORISON SON & JONES (CEYLON) PLCAND ITS SUBSIDIARIES
5352
Cash deposits Credit risk from balances with banks is managed to minimize the cost of funding. Investments of surplus funds are made
only with approved counterparties.
Liquidity risk The Group monitors its risk to a shortage of funds by setting up a minimum liquidity level. The Group’s objective is to
maintain a balance between continuity of funding and flexibility through the use of bank overdrafts, bank loans, and finance leases. The Group assessed the concentration of risk with respect to refinancing its debt and concluded it to be low. Access to sources of funding is sufficiently available and debt maturing within 12 months can be rolled over with existing lenders.
The table below summarises the maturity profile of groups financial liabilities based on contractual undiscounted payments.
Year ended 31 March 2013 Less than 1 year Above 1 year Total Bank Financing 199,722,083 43,146,697 242,868,780 Finance Lease 4,736,376 6,397,883 11,134,259 Other Loans – 1,325,000 1,325,000 Trade and Other Payables 409,288,451 – 409,288,451 613,746,910 50,869,580 664,616,490
Capital management Capital includes ordinary shares. The primary objective of the Group’s capital management is to ensure that it maintains a
strong credit rating and healthy capital ratios in order to support its business and maximize shareholder value.
The company manages its capital structure and makes adjustments to it in light of changes in economic conditions. To maintain or adjust the capital structure, the company may adjust the dividend payment to shareholders, return capital to shareholders or issue new shares. No changes were made in the objectives, policies or processes managing capital during the years ended 31 March 2013 and 31 March 2012.
NOTES TO THE FINANCIAL STATEMENTS – YEAR ENDED 31 MARCH 2013 (Contd.)
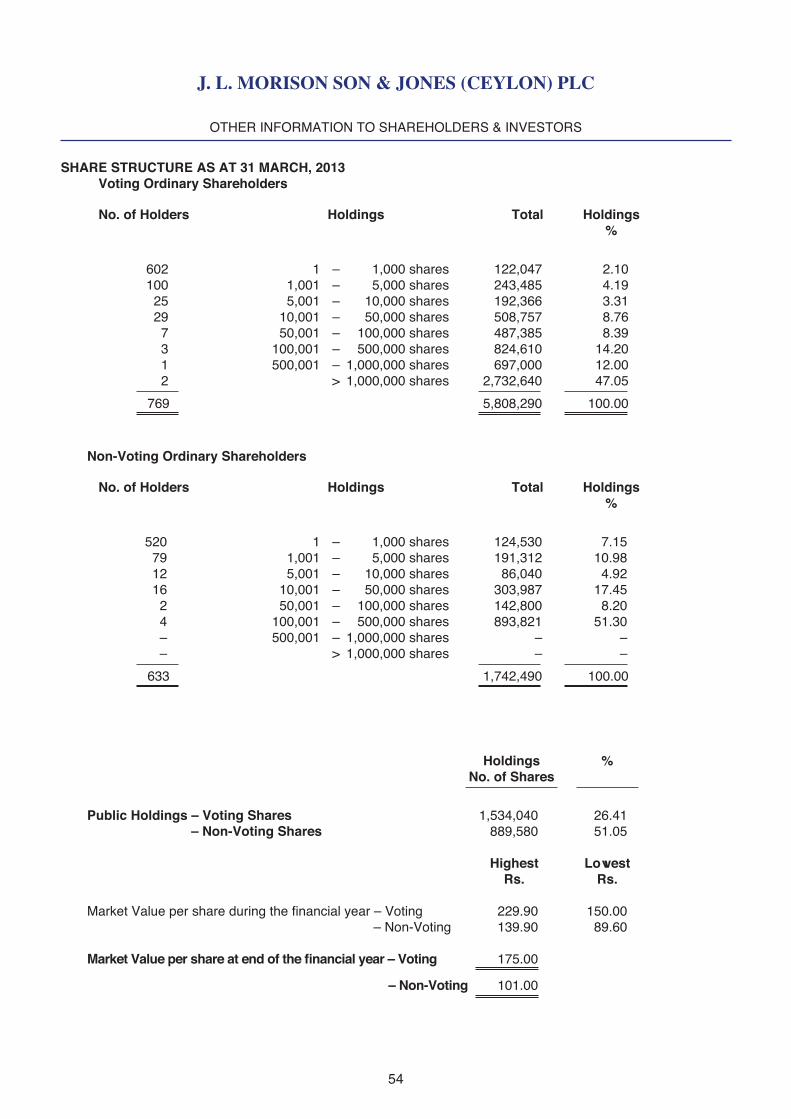
J. L. MORISON SON & JONES (CEYLON) PLC
5554
OTHER INFORMATION TO SHAREHOLDERS & INVESTORS
SHARE STRUCTURE AS AT 31 MARCH, 2013 Voting Ordinary Shareholders
No. of Holders Holdings Total Holdings %
602 1 – 1,000 shares 122,047 2.10 100 1,001 – 5,000 shares 243,485 4.19 25 5,001 – 10,000 shares 192,366 3.31 29 10,001 – 50,000 shares 508,757 8.76 7 50,001 – 100,000 shares 487,385 8.39 3 100,001 – 500,000 shares 824,610 14.20 1 500,001 – 1,000,000 shares 697,000 12.00 2 > 1,000,000 shares 2,732,640 47.05 769 5,808,290 100.00
Non-Voting Ordinary Shareholders
No. of Holders Holdings Total Holdings %
520 1 – 1,000 shares 124,530 7.15 79 1,001 – 5,000 shares 191,312 10.98 12 5,001 – 10,000 shares 86,040 4.92 16 10,001 – 50,000 shares 303,987 17.45 2 50,001 – 100,000 shares 142,800 8.20 4 100,001 – 500,000 shares 893,821 51.30 – 500,001 – 1,000,000 shares – – – > 1,000,000 shares – – 633 1,742,490 100.00
Holdings % No. of Shares
Public Holdings – Voting Shares 1,534,040 26.41 – Non-Voting Shares 889,580 51.05
Highest Lowest Rs. Rs.
Market Value per share during the financial year – Voting 229.90 150.00 – Non-Voting 139.90 89.60
Market Value per share at end of the financial year – Voting 175.00 – Non-Voting 101.00
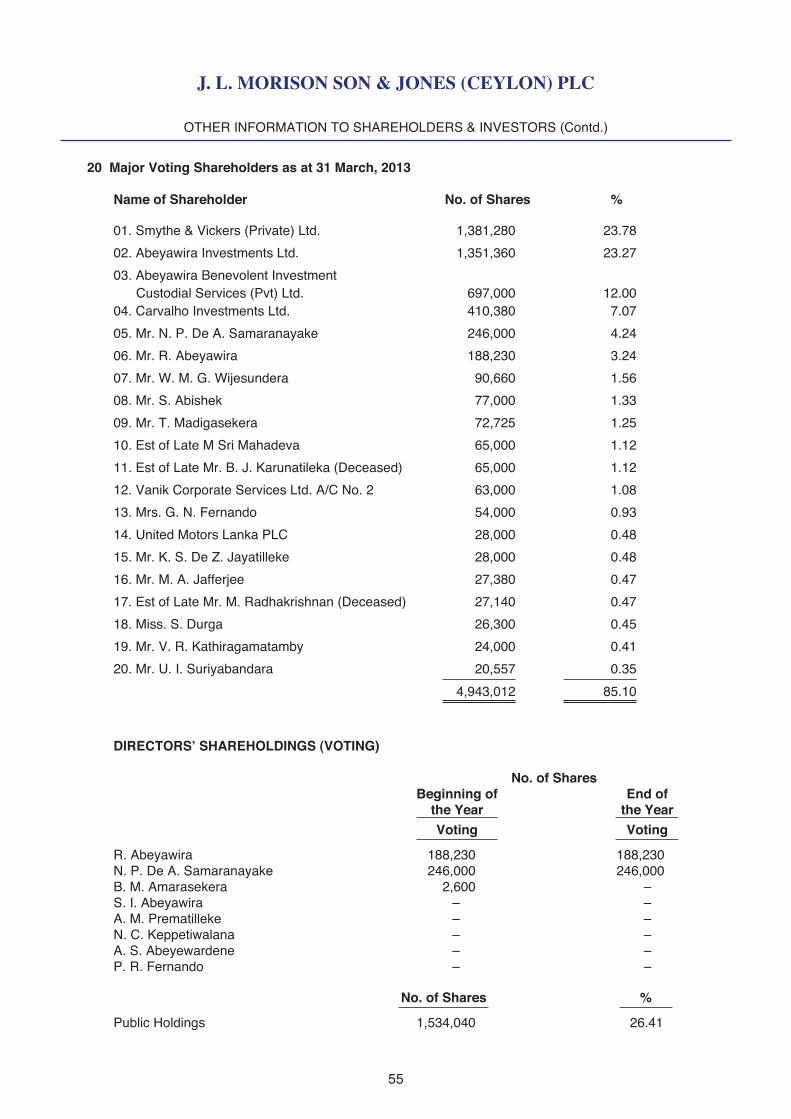
J. L. MORISON SON & JONES (CEYLON) PLC
5554
20 Major Voting Shareholders as at 31 March, 2013 Name of Shareholder No. of Shares %
01. Smythe & Vickers (Private) Ltd. 1,381,280 23.78
02. Abeyawira Investments Ltd. 1,351,360 23.27
03. Abeyawira Benevolent Investment Custodial Services (Pvt) Ltd. 697,000 12.00 04. Carvalho Investments Ltd. 410,380 7.07
05. Mr. N. P. De A. Samaranayake 246,000 4.24
06. Mr. R. Abeyawira 188,230 3.24
07. Mr. W. M. G. Wijesundera 90,660 1.56
08. Mr. S. Abishek 77,000 1.33
09. Mr. T. Madigasekera 72,725 1.25
10. Est of Late M Sri Mahadeva 65,000 1.12
11. Est of Late Mr. B. J. Karunatileka (Deceased) 65,000 1.12
12. Vanik Corporate Services Ltd. A/C No. 2 63,000 1.08
13. Mrs. G. N. Fernando 54,000 0.93
14. United Motors Lanka PLC 28,000 0.48
15. Mr. K. S. De Z. Jayatilleke 28,000 0.48
16. Mr. M. A. Jafferjee 27,380 0.47
17. Est of Late Mr. M. Radhakrishnan (Deceased) 27,140 0.47
18. Miss. S. Durga 26,300 0.45
19. Mr. V. R. Kathiragamatamby 24,000 0.41
20. Mr. U. I. Suriyabandara 20,557 0.35 4,943,012 85.10
DIRECTORS’ SHAREHOLDINGS (VOTING)
No. of Shares Beginning of End of the Year the Year Voting Voting R. Abeyawira 188,230 188,230 N. P. De A. Samaranayake 246,000 246,000 B. M. Amarasekera 2,600 – S. I. Abeyawira – – A. M. Prematilleke – – N. C. Keppetiwalana – – A. S. Abeyewardene – – P. R. Fernando – –
No. of Shares % Public Holdings 1,534,040 26.41
OTHER INFORMATION TO SHAREHOLDERS & INVESTORS (Contd.)
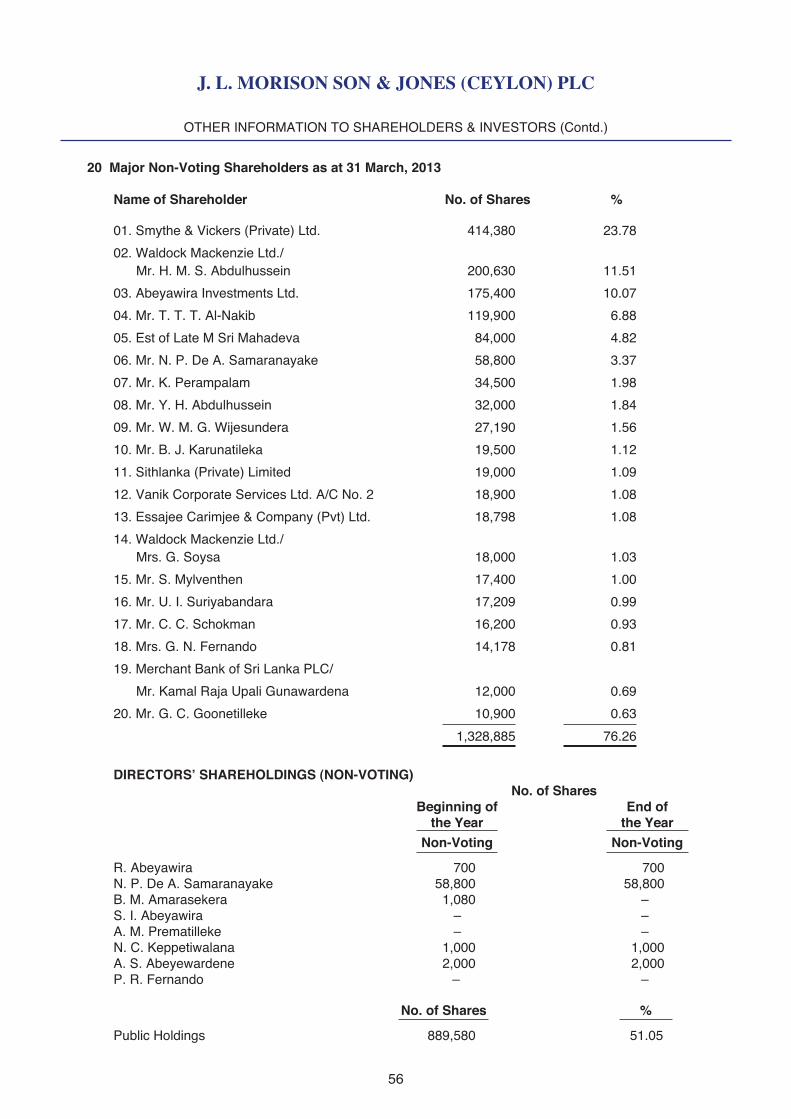
J. L. MORISON SON & JONES (CEYLON) PLC
5756
OTHER INFORMATION TO SHAREHOLDERS & INVESTORS (Contd.)
20 Major Non-Voting Shareholders as at 31 March, 2013 Name of Shareholder No. of Shares %
01. Smythe & Vickers (Private) Ltd. 414,380 23.78
02. Waldock Mackenzie Ltd./ Mr. H. M. S. Abdulhussein 200,630 11.51
03. Abeyawira Investments Ltd. 175,400 10.07
04. Mr. T. T. T. Al-Nakib 119,900 6.88
05. Est of Late M Sri Mahadeva 84,000 4.82
06. Mr. N. P. De A. Samaranayake 58,800 3.37
07. Mr. K. Perampalam 34,500 1.98
08. Mr. Y. H. Abdulhussein 32,000 1.84
09. Mr. W. M. G. Wijesundera 27,190 1.56
10. Mr. B. J. Karunatileka 19,500 1.12
11. Sithlanka (Private) Limited 19,000 1.09
12. Vanik Corporate Services Ltd. A/C No. 2 18,900 1.08
13. Essajee Carimjee & Company (Pvt) Ltd. 18,798 1.08
14. Waldock Mackenzie Ltd./ Mrs. G. Soysa 18,000 1.03
15. Mr. S. Mylventhen 17,400 1.00
16. Mr. U. I. Suriyabandara 17,209 0.99
17. Mr. C. C. Schokman 16,200 0.93
18. Mrs. G. N. Fernando 14,178 0.81
19. Merchant Bank of Sri Lanka PLC/
Mr. Kamal Raja Upali Gunawardena 12,000 0.69
20. Mr. G. C. Goonetilleke 10,900 0.63 1,328,885 76.26 DIRECTORS’ SHAREHOLDINGS (NON-VOTING) No. of Shares Beginning of End of the Year the Year Non-Voting Non-Voting R. Abeyawira 700 700 N. P. De A. Samaranayake 58,800 58,800 B. M. Amarasekera 1,080 – S. I. Abeyawira – – A. M. Prematilleke – – N. C. Keppetiwalana 1,000 1,000 A. S. Abeyewardene 2,000 2,000 P. R. Fernando – –
No. of Shares % Public Holdings 889,580 51.05
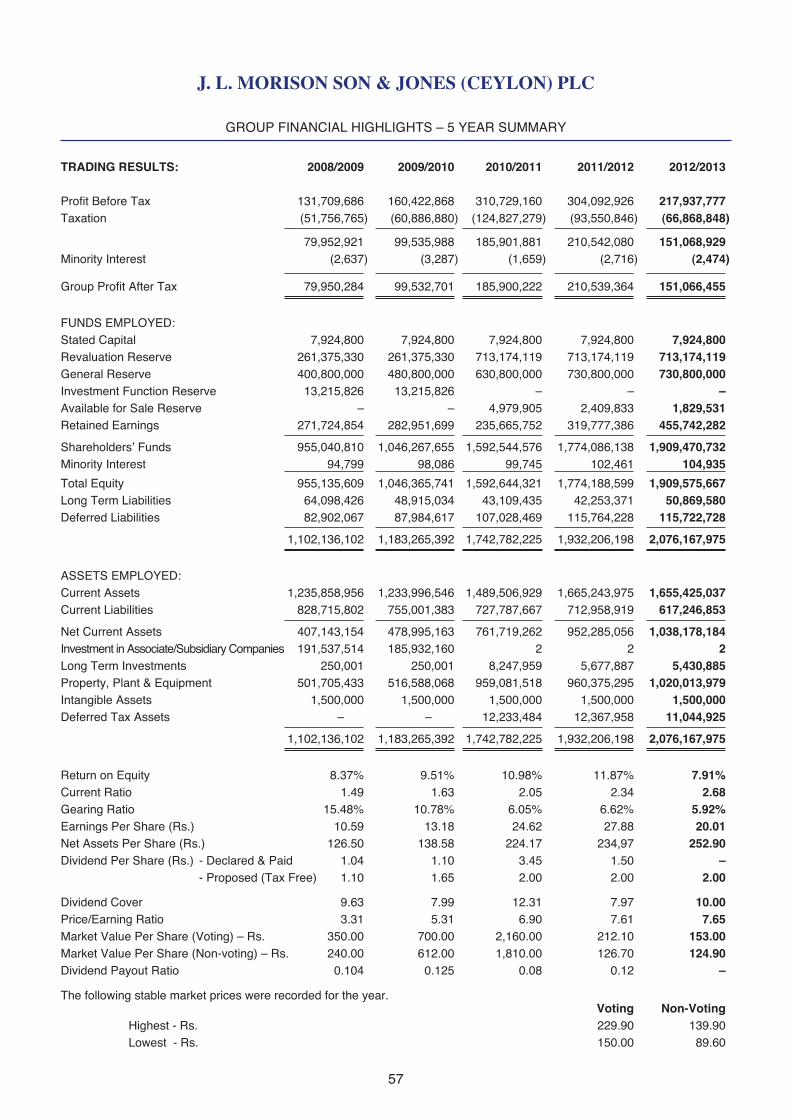
J. L. MORISON SON & JONES (CEYLON) PLC
5756
GROUP FINANCIAL HIGHLIGHTS – 5 YEAR SUMMARY
TRADING RESULTS: 2008/2009 2009/2010 2010/2011 2011/2012 2012/2013
Profit Before Tax 131,709,686 160,422,868 310,729,160 304,092,926 217,937,777 Taxation (51,756,765) (60,886,880) (124,827,279) (93,550,846) (66,868,848) 79,952,921 99,535,988 185,901,881 210,542,080 151,068,929Minority Interest (2,637) (3,287) (1,659) (2,716) (2,474) Group Profit After Tax 79,950,284 99,532,701 185,900,222 210,539,364 151,066,455
FUNDS EMPLOYED:Stated Capital 7,924,800 7,924,800 7,924,800 7,924,800 7,924,800Revaluation Reserve 261,375,330 261,375,330 713,174,119 713,174,119 713,174,119General Reserve 400,800,000 480,800,000 630,800,000 730,800,000 730,800,000Investment Function Reserve 13,215,826 13,215,826 – – –Available for Sale Reserve – – 4,979,905 2,409,833 1,829,531Retained Earnings 271,724,854 282,951,699 235,665,752 319,777,386 455,742,282 Shareholders’ Funds 955,040,810 1,046,267,655 1,592,544,576 1,774,086,138 1,909,470,732Minority Interest 94,799 98,086 99,745 102,461 104,935 Total Equity 955,135,609 1,046,365,741 1,592,644,321 1,774,188,599 1,909,575,667Long Term Liabilities 64,098,426 48,915,034 43,109,435 42,253,371 50,869,580Deferred Liabilities 82,902,067 87,984,617 107,028,469 115,764,228 115,722,728 1,102,136,102 1,183,265,392 1,742,782,225 1,932,206,198 2,076,167,975
ASSETS EMPLOYED:Current Assets 1,235,858,956 1,233,996,546 1,489,506,929 1,665,243,975 1,655,425,037Current Liabilities 828,715,802 755,001,383 727,787,667 712,958,919 617,246,853 Net Current Assets 407,143,154 478,995,163 761,719,262 952,285,056 1,038,178,184Investment in Associate/Subsidiary Companies 191,537,514 185,932,160 2 2 2Long Term Investments 250,001 250,001 8,247,959 5,677,887 5,430,885Property, Plant & Equipment 501,705,433 516,588,068 959,081,518 960,375,295 1,020,013,979Intangible Assets 1,500,000 1,500,000 1,500,000 1,500,000 1,500,000Deferred Tax Assets – – 12,233,484 12,367,958 11,044,925 1,102,136,102 1,183,265,392 1,742,782,225 1,932,206,198 2,076,167,975
Return on Equity 8.37% 9.51% 10.98% 11.87% 7.91%Current Ratio 1.49 1.63 2.05 2.34 2.68Gearing Ratio 15.48% 10.78% 6.05% 6.62% 5.92%Earnings Per Share (Rs.) 10.59 13.18 24.62 27.88 20.01Net Assets Per Share (Rs.) 126.50 138.58 224.17 234,97 252.90Dividend Per Share (Rs.) - Declared & Paid 1.04 1.10 3.45 1.50 – - Proposed (Tax Free) 1.10 1.65 2.00 2.00 2.00
Dividend Cover 9.63 7.99 12.31 7.97 10.00Price/Earning Ratio 3.31 5.31 6.90 7.61 7.65Market Value Per Share (Voting) – Rs. 350.00 700.00 2,160.00 212.10 153.00Market Value Per Share (Non-voting) – Rs. 240.00 612.00 1,810.00 126.70 124.90Dividend Payout Ratio 0.104 0.125 0.08 0.12 –
The following stable market prices were recorded for the year. Voting Non-Voting Highest - Rs. 229.90 139.90 Lowest - Rs. 150.00 89.60
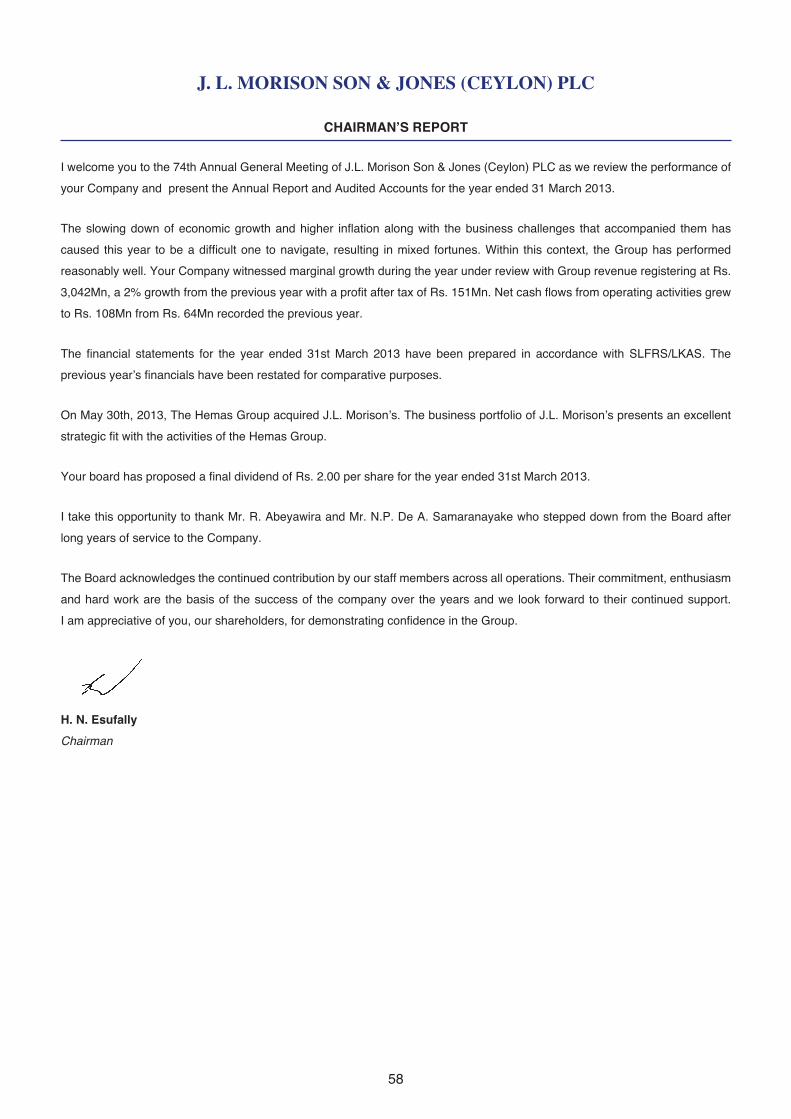
J. L. MORISON SON & JONES (CEYLON) PLC
5958
CHAIRMAN’S REPORT
I welcome you to the 74th Annual General Meeting of J.L. Morison Son & Jones (Ceylon) PLC as we review the performance of
your Company and present the Annual Report and Audited Accounts for the year ended 31 March 2013.
The slowing down of economic growth and higher inflation along with the business challenges that accompanied them has
caused this year to be a difficult one to navigate, resulting in mixed fortunes. Within this context, the Group has performed
reasonably well. Your Company witnessed marginal growth during the year under review with Group revenue registering at Rs.
3,042Mn, a 2% growth from the previous year with a profit after tax of Rs. 151Mn. Net cash flows from operating activities grew
to Rs. 108Mn from Rs. 64Mn recorded the previous year.
The financial statements for the year ended 31st March 2013 have been prepared in accordance with SLFRS/LKAS. The
previous year’s financials have been restated for comparative purposes.
On May 30th, 2013, The Hemas Group acquired J.L. Morison’s. The business portfolio of J.L. Morison’s presents an excellent
strategic fit with the activities of the Hemas Group.
Your board has proposed a final dividend of Rs. 2.00 per share for the year ended 31st March 2013.
I take this opportunity to thank Mr. R. Abeyawira and Mr. N.P. De A. Samaranayake who stepped down from the Board after
long years of service to the Company.
The Board acknowledges the continued contribution by our staff members across all operations. Their commitment, enthusiasm
and hard work are the basis of the success of the company over the years and we look forward to their continued support.
I am appreciative of you, our shareholders, for demonstrating confidence in the Group.
H. N. Esufally
Chairman
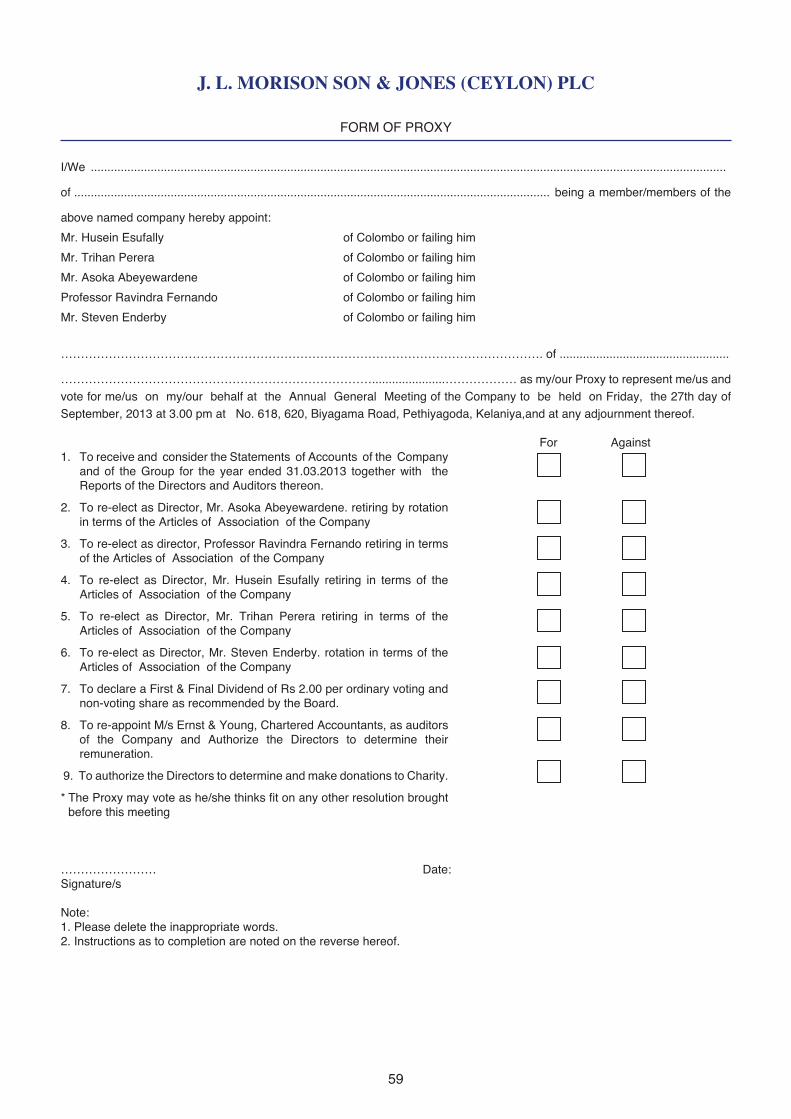
J. L. MORISON SON & JONES (CEYLON) PLC
5958
FORM OF PROXY
I/We ...............................................................................................................................................................................................
of ............................................................................................................................................... being a member/members of the
above named company hereby appoint:
Mr. Husein Esufally of Colombo or failing him
Mr. Trihan Perera of Colombo or failing him
Mr. Asoka Abeyewardene of Colombo or failing him
Professor Ravindra Fernando of Colombo or failing him
Mr. Steven Enderby of Colombo or failing him
…………………………………………………………………………………………………………. of ...................................................
……………………………………………………………………......................……………… as my/our Proxy to represent me/us and vote for me/us on my/our behalf at the Annual General Meeting of the Company to be held on Friday, the 27th day of September, 2013 at 3.00 pm at No. 618, 620, Biyagama Road, Pethiyagoda, Kelaniya,and at any adjournment thereof. For Against1. To receive and consider the Statements of Accounts of the Company
and of the Group for the year ended 31.03.2013 together with the Reports of the Directors and Auditors thereon.
2. To re-elect as Director, Mr. Asoka Abeyewardene. retiring by rotation in terms of the Articles of Association of the Company
3. To re-elect as director, Professor Ravindra Fernando retiring in terms of the Articles of Association of the Company
4. To re-elect as Director, Mr. Husein Esufally retiring in terms of the Articles of Association of the Company
5. To re-elect as Director, Mr. Trihan Perera retiring in terms of the Articles of Association of the Company
6. To re-elect as Director, Mr. Steven Enderby. rotation in terms of the Articles of Association of the Company
7. To declare a First & Final Dividend of Rs 2.00 per ordinary voting and non-voting share as recommended by the Board.
8. To re-appoint M/s Ernst & Young, Chartered Accountants, as auditors of the Company and Authorize the Directors to determine their remuneration.
9. To authorize the Directors to determine and make donations to Charity.
* The Proxy may vote as he/she thinks fit on any other resolution brought before this meeting
…………………… Date:Signature/s
Note:1. Please delete the inappropriate words.2. Instructions as to completion are noted on the reverse hereof.
J. L. MORISON SON & JONES (CEYLON) PLC
6060
INSTRUCTIONS AS TO COMPLETION OF FORM OF PROXY
1. Kindly perfect the Form of Proxy after filling in legibly your full name and address and by signing in the space provided. Please fill in the date of signature.
2. A member entitled to attend and vote at the meeting is entitled to appoint a proxy to attend and vote instead of him/her.
3. In the case of Corporate Members, the Form of Proxy must be completed under the Common Seal, which should be affixed and attested in the manner prescribed by the Articles of Association /Statutes.
4. If the Form of Proxy is signed by an Attorney, the relevant Power of Attorney should also accompany the completed Form of Proxy.
5. The completed Form of Proxy, addressed to the Secretaries should be deposited at Hemas House, No. 75, Braybrooke Place. Colombo 2 not less than Forty Eight (48) hours before the time appointed for the Meeting.

Printed byAitken Spence Printing & Packaging (Pvt) Ltd.