Embed Size (px)
Citation preview
Pacific Science (2002), vol. 56, no. 1:65-81© 2002 by University of Hawai'i Press.All rights reserved
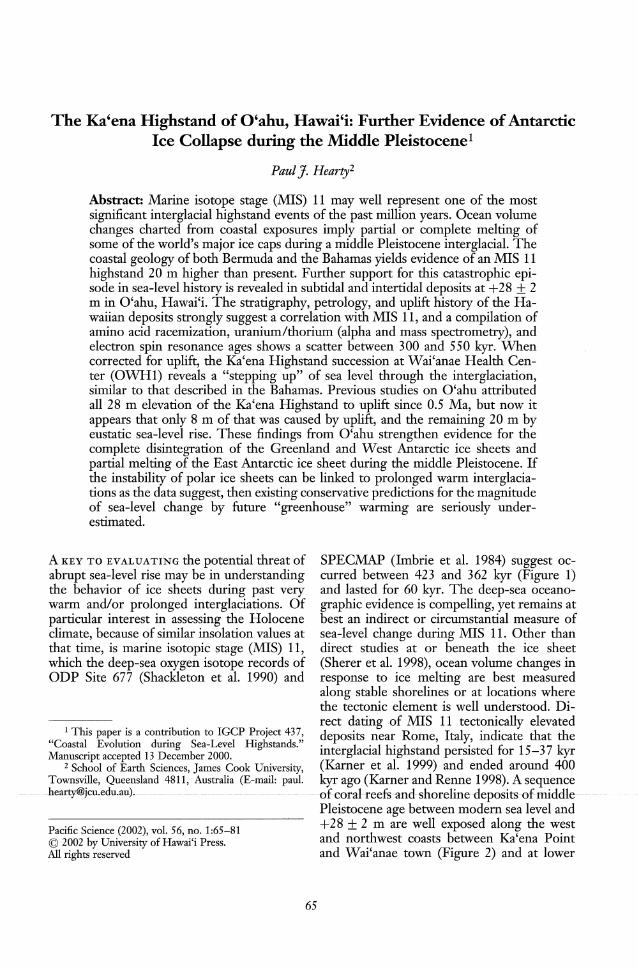
A KEY TO EVALUATING the potential threat ofabrupt sea-level rise may be in understandingthe behavior of ice sheets during past verywarm and/or prolonged interglaciations. Ofparticular interest in assessing the Holoceneclimate, because of similar insolation values atthat time, is marine isotopic stage (MIS) 11,which the deep-sea oxygen isotope records ofODP Site 677 (Shackleton et al. 1990) and
The Ka'ena Highstand of O'ahu, Hawai'i: Further Evidence ofAntarcticIce Collapse during the Middle Pleistocene1
PaulJ. Hearty2
Abstract: Marine isotope stage (MIS) 11 may well represent one of the mostsignificant interglacial highstand events of the past million years. Ocean volumechanges charted from coastal exposures imply partial or complete melting ofsome of the world's major ice caps during a middle Pleistocene interglacial. Thecoastal geology of both Bermuda and the Bahamas yields evidence of an MIS 11highstand 20 m higher than present. Further support for this catastrophic episode in sea-level history is revealed in subtidal and intertidal deposits at +28 ± 2m in O'ahu, Hawai'i. The stratigraphy, petrology, and uplift history of the Hawaiian deposits strongly suggest a correlation with MIS 11, and a compilation ofamino acid racemization, uranium/thorium (alpha and mass spectrometry), andelectron spin resonance ages shows a scatter between 300 and 550 kyr. Whencorrected for uplift, the Ka'ena Highstand succession at Wai'anae Health Center (OWHl) reveals a "stepping up" of sea level through the interglaciation,similar to that described in the Bahamas. Previous studies on O'ahu attributedall 28 m elevation of the Ka'ena Highstand to uplift since 0.5 Ma, but now itappears that only 8 m of that was caused by uplift, and the remaining 20 m byeustatic sea-level rise. These findings from O'ahu strengthen evidence for thecomplete disintegration of the Greenland and West Antarctic ice sheets andpartial melting of the East Antarctic ice sheet during the middle Pleistocene. Ifthe instability of polar ice sheets can be linked to prolonged warm interglaciations as the data suggest, then existing conservative predictions for the magnitudeof sea-level change by future "greenhouse" warming are seriously underestimated.
SPECMAP (Imbrie et al. 1984) suggest occurred between 423 and 362 kyr (Figure 1)and lasted for 60 kyr. The deep-sea oceanographic evidence is compelling, yet remains atbest an indirect or circumstantial measure ofsea-level change during MIS 11. Other thandirect studies at or beneath the ice sheet(Sherer et al. 1998), ocean volume changes inresponse to ice melting are best measuredalong stable shorelines or at locations wherethe tectonic element is well understood. Direct dating of MIS 11 tectonically elevated
1 This paper is a contribution to IGCP Project 437, deposits near Rome, Italy, indicate that the"Coastal Evolution during Sea-Level Highstands." interglacial highstand persisted for 15-37 kyrManuscript accepted 13 December 2000.
2 School of Earth Sciences, James Cook University, (Karner et al. 1999) and ended around 400Townsville, Queensland 4811, Australia (E-mail: paul. kyr ago (Karner and Renne 1998). A sequence
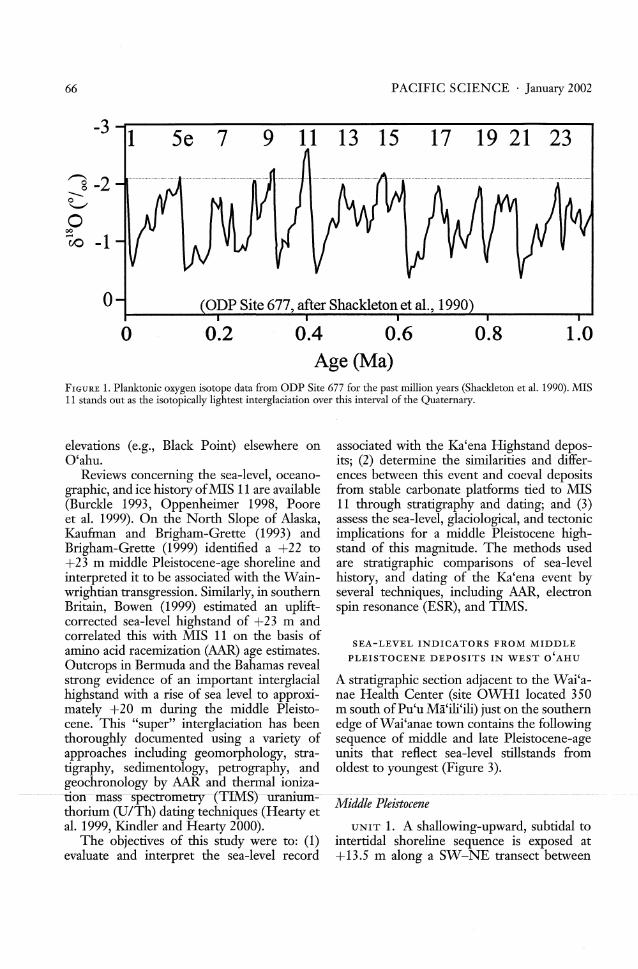
-heaI'[email protected]).----- - - -- -- ------ ---of-eoral-reefsand-shoreline-deposits-of-middle--Pleistocene age between modern sea level and+28 ± 2 m are well exposed along the westand northwest coasts between Ka'ena Pointand Wai'anae town (Figure 2) and at lower
65
66 PACIFIC SCIENCE· January 2002
-3 ------------------------,1 5e 7 9 11 13 15 17 19 21 23
ODP Site 677, after Shackleton et aI., 1990
r-e> 2o --Vo
00
'io -1
oo 0.2 0.4 0.6
Age (Ma)0.8 1.0
FIGURE 1. Planktonic oxygen isotope data from ODP Site 677 for the past million years (Shackleton et al. 1990). MIS11 stands out as the isotopically lightest interglaciation over this interval of the Quaternary.
elevations (e.g., Black Point) elsewhere onO'ahu.
Reviews concerning the sea-level, oceanographic, and ice history ofMIS 11 are available(Burckle 1993, Oppenheimer 1998, Pooreet al. 1999). On the North Slope of Alaska,Kau&nan and Brigham-Grette (1993) andBrigham-Grette (1999) identified a +22 to+23 m middle Pleistocene-age shoreline andinterpreted it to be associated with the Wainwrightian transgression. Similarly, in southernBritain, Bowen (1999) estimated an upliftcorrected sea-level highstand of +23 m andcorrelated this with MIS lIon the basis ofamino acid racemization (AAR) age estimates.Outcrops in Bermuda and the Bahamas revealstrong evidence of an important interglacialhighstand with a rise of sea level to approximately +20 m during the middle Pleistocene. This "super" interglaciation has beenthoroughly documented using a variety ofapproaches including geomorphology, stratigraphy, sedimentology, petrography, andgeochronology by AAR and thermal ioniza-
------rlon-mass spectfOl'lletry -efIMS) uraniumthorium (U/Th) dating techniques (Hearty etal. 1999, Kindler and Hearty 2000).
The objectives of this study were to: (1)evaluate and interpret the sea-level record
associated with the Ka'ena Highstand deposits; (2) determine the similarities and differences between this event and coeval depositsfrom stable carbonate platforms tied to MIS11 through stratigraphy and dating; and (3)assess the sea-level, glaciological, and tectonicimplications for a middle Pleistocene highstand of this magnitude. The methods usedare stratigraphic comparisons of sea-levelhistory, and dating of the Ka'ena event byseveral techniques, including AAR, electronspin resonance (ESR), and TIMS.
SEA-LEVEL INDICATORS FROM MIDDLE
PLEISTOCENE DEPOSITS IN WEST O'AHU
A stratigraphic section adjacent to the Wai'anae Health Center (site OWHI located 350m south ofPu'u Ma'ili'ili) just on the southernedge ofWai'anae town contains the followingsequence of middle and late Pleistocene-ageunits that reflect sea-level stillstands fromoldest to youngest (Figure 3).
Middle Pleistocene
UNIT 1. A shallowing-upward, subtidal tointertidal shoreline sequence is exposed at+13.5 m along a SW-NE transect between
The K'aena Highstand of O'ahu, Hawai'i . Hearty
Kahuku Point.10 miles
10 kilometers
SectionOEAl
MakuaValley(OMUl)
Waianae HealthCenter (OWHl)
Kahe PointState Park
(OBEl)
DIAMOND HEAD
Black Point
FIGURE 2. Location map of study sites on O'ahu in the Hawaiian Islands.
AKAPUUHUD
67
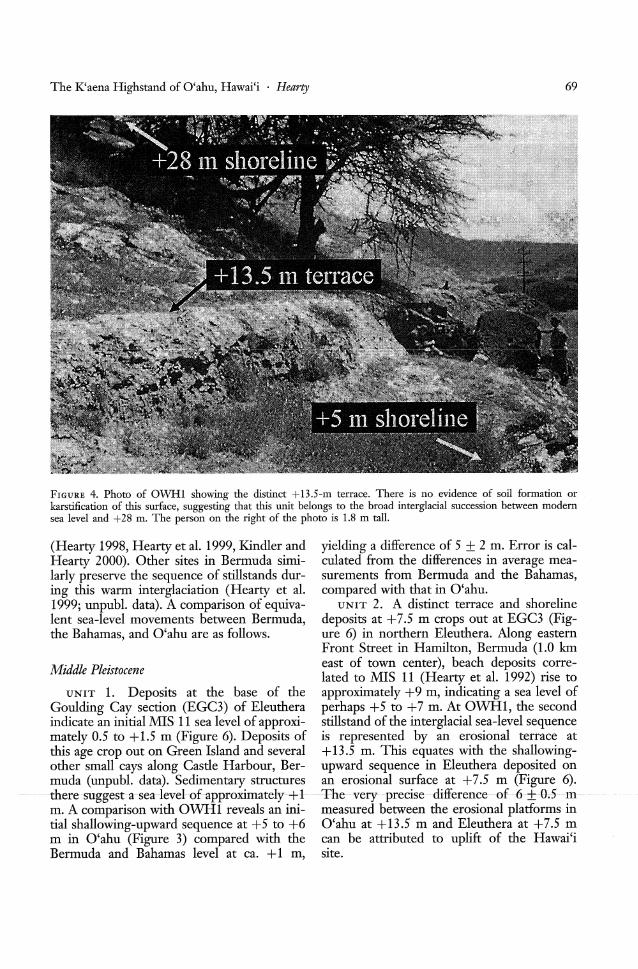
Pu'u Ma'ili'ili and the mouth of Ma'ili'ili sea level was greater than +13.5 m. There isStream (directly toward the southeast parking no evidence that soil formation or karst prolot of the Wai'anae Health Center). Paleosea cesses acted on this surface, suggesting that itlevel is interpreted from the sub- to intertidal does not represent a prolonged period of seafacies transition at approximately +5 to +6 m level regression (i.e., glacial lowstand), butin outcrops along the coastline at the mouth rather a stillstand of perhaps a few thousandof Ma'ili'ili Stream. Unit 1 is moderately to years, followed by erosion in a shallow marinestrongly cemented, presumably in a vadose environment.environment. The coarse, well-sorted carbo- UNIT 3. Calcareous deposits covered bynate sand is pervasively recrystallized in this red alluvium are exposed up to approximatelyunit. +28 m in the upper, east parking lot at the
UNIT 2. The upper surface of Unit 1 is Health Center. A reefal unit at +26.5 m~- -truncatecl-by--marme-bi0er0si0n,presumably---e0ntams-in-sim-eefal-heads-f:Platygyra--sp.,
in a shallow shoreline environment forming a Pocillopora sp., and Porites sp.) and suggests avery flat terrace surface (Unit 2) at +13.5 m minimum relative sea level of +28 to +30 m.(Figure 4). The terrace closely approximates The reef terrace at +28 m falls off sharplymean low water level, indicating that relative seaward in a detrital reef debris apron. Con-
68 PACIFIC SCIENCE· January 2002
KAH:EC=B:E~A7'c~H~;;;;";~~::£c;,';;om;;;;p,;ess;;;e~g;~o~r~;;;Qn;tl!l~'sc~"eY~~S.L.
10.471
30
10
SectionOWHl
/1-...:-.-.....,...~25
1-----'--.......15
----------.... 5
WAIANAEHEALTHCENTER
40
...... I0.78 +0.10(2)......
LEGEND~ Stratigraphic unitst2.!2J described in text[Q]ZJ Whole·rock A/I ratio
KAENA eolianitePOINT upto+50m
(2 kin SE) beach
I0.85 +0.08(2)beach
conglomerate
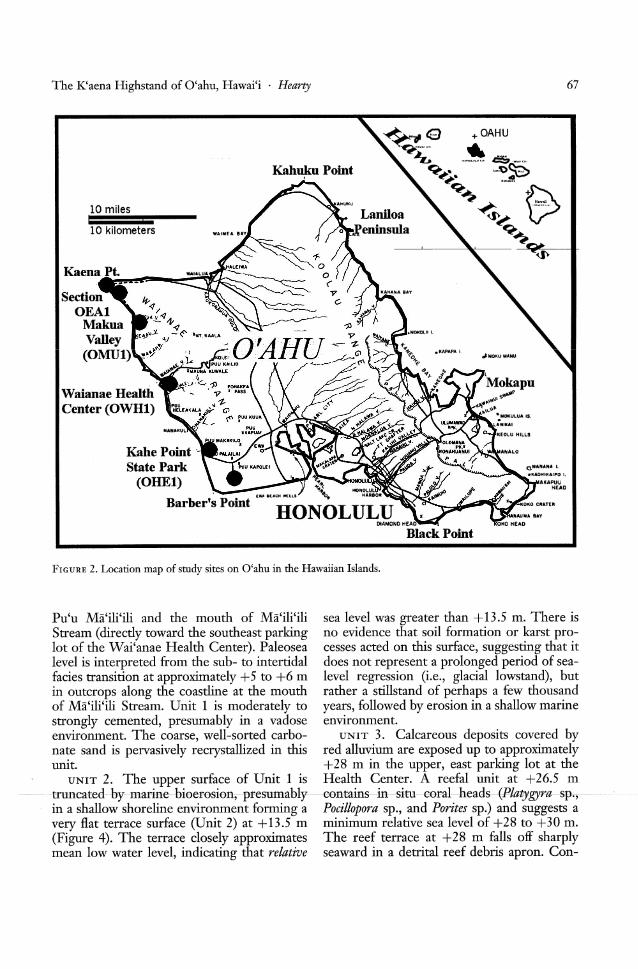
FIGURE 3. Stratigraphic sections ofWai'anae Health Center (OWHl) and Ka'ena Point (OEAI) sections. The latter islocated 2 Ian southeast of Ka'ena Point.
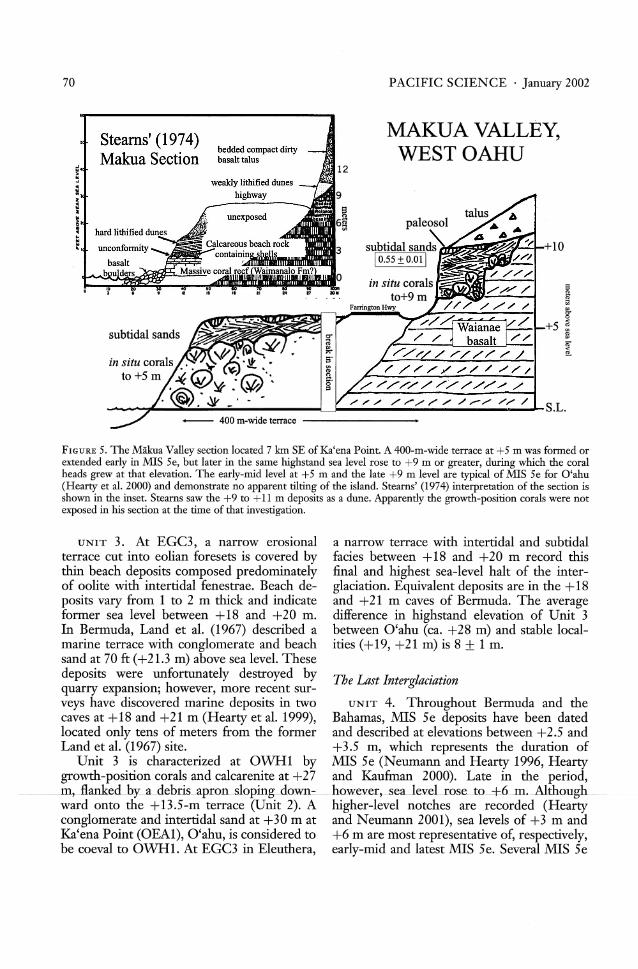
A section at Kahe Point Beach Park (Muhsand Szabo 1994), located 10.5 km south ofWai'anae, exposes two in situ reef levels likethat of Miikua Valley, indicating sea-levelstillstands at +5.5 and +9 m (Hearty et al.2000). A marine conglomerate rises to + 12 mat Kahe. V-series ages from the section atKahe Point correlate with MIS 5e (Eastonand Ku 1981, Muhs and Szabo 1994). Numerous studies (e.g., Sherman et al. 1993,Muhs and Szabo 1994) on MIS 5e sitesaround O'ahu have established similar elevations at. +5 and +9 m for the highstandevents, indicating the absence of tectonic tilting on the island.
The most complete section correlated withMIS 11 lies to the north of Goulding Cay(EGC3), Eleuthera, Bahamas (Figure 6)
glomerate, reef, beach, and eolianite depositsare also present in outcrops at and above + 30m at several locations at, and just to thesoutheast of Ka'ena Point (Figure 2).
Late Pleistocene
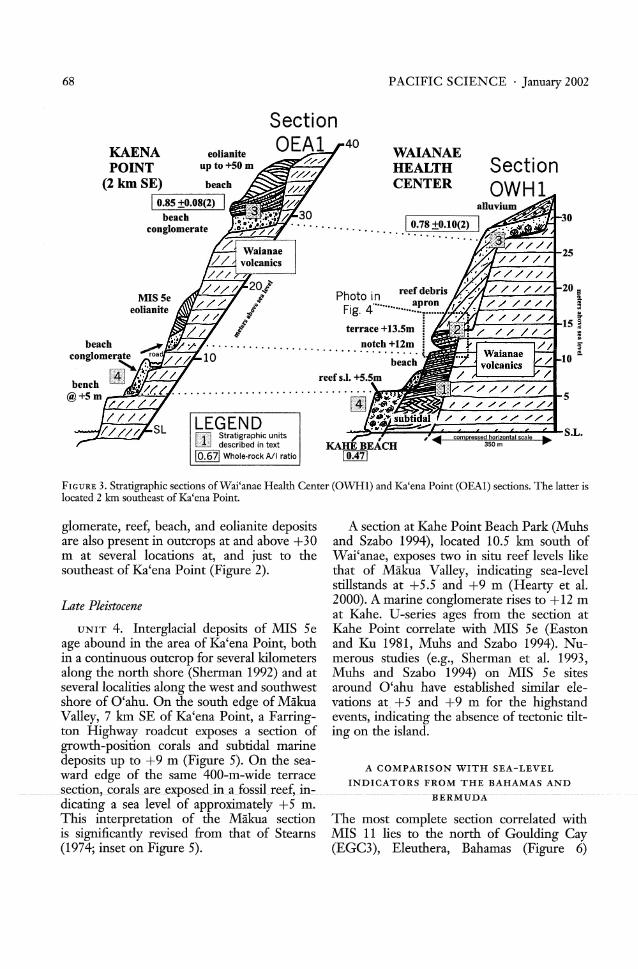
UNIT 4. Interglacial deposits of MIS 5eage abound in the area of Ka'ena Point, bothin a continuous outcrop for several kilometersalong the north shore (Sherman 1992) and atseveral localities along the west and southwestshore of O'ahu. On the south edge of MiikuaValley, 7 km SE of Ka'ena Point, a Farrington Highway roadcut exposes a section ofgrowth-position corals and subtidal marinedeposits up to +9 m (Figure 5). On the sea-
A COMPARISON WITH SEA-LEVELward edge of the same 400-m-wide terrace
INDICATORS FROM THE BAHAMAS AND._se~riQn,_Cj)I'als_aI'e_exp_Qs_e_d_in_a_fQssiLreef,in-__ ....---- ----------lfEIfMUD-K--.------------
dicating a sea level of approximately +5 m.This interpretation of the Miikua sectionis significandy revised from that of Steams(1974; inset on Figure 5).
The K'aena Highstand of O'ahu, Hawai'i . Hearty 69
Middle Pleistocene
(Hearty 1998, Hearty et al. 1999, Kindler andHearty 2000). Other sites in Bermuda similarly preserve the sequence of stillstands during this warm interglaciation (Hearty et al.1999; unpubl. data). A comparison of equivalent sea-level movements between Bermuda,the Bahamas, and O'ahu are as follows.
FIGURE 4. Photo of OWHI showing the distinct +13.5-m terrace. There is no evidence of soil formation orkarstification of this surface, suggesting that this unit belongs to the broad interglacial succession between modemsea level and +28 m. The person on the right of the photo is 1.8 m tall.
yielding a difference of 5 ± 2 m. Error is calculated from the differences in average measurements from Bermuda and the Bahamas,compared with that in O'ahu.
UNIT 2. A distinct terrace and shorelinedeposits at +7.5 m crops out at EGC3 (Figure 6) in northern Eleuthera. Along easternFront Street in Hamilton, Bermuda (1.0 kmeast of town center), beach deposits correlated to MIS 11 (Hearty et al. 1992) rise to
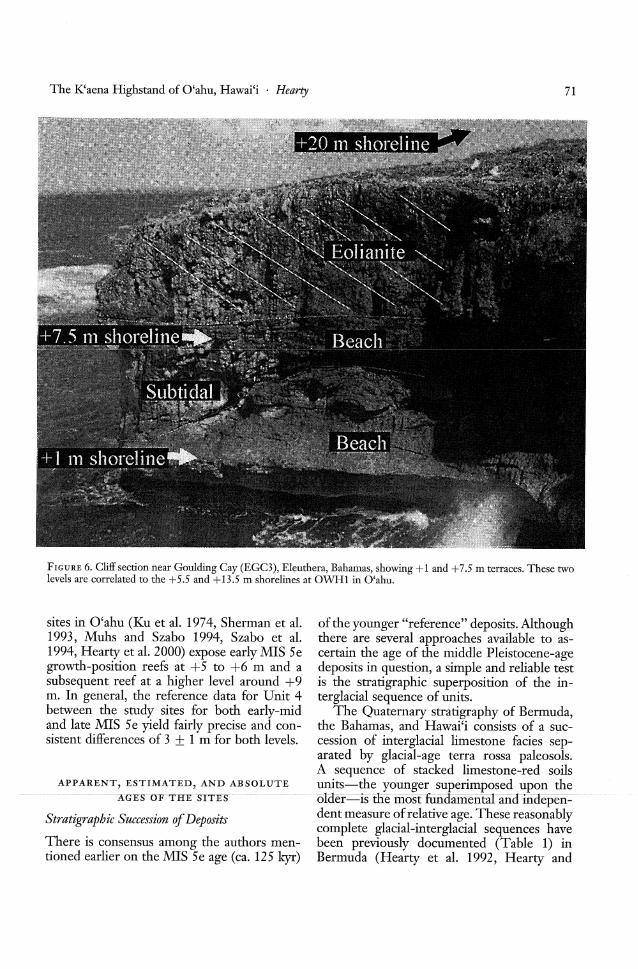
UNIT 1. Deposits at the base of the approximately +9 m, indicating a sea level ofGoulding Cay section (EGC3) of Eleuthera perhaps +5 to +7 m. At OWHl, the secondindicate an initial MIS 11 sea level of approxi- stillstand of the interglacial sea-level sequencemately 0.5 to +1.5 m (Figure 6). Deposits of is represented by an erosional terrace atthis age crop out on Green Island and several +13.5 m. This equates with the shallowingother small cays along Castle Harbour, Ber- upward sequence in Eleuthera deposited onmuda (unpubl. data). Sedimentary structures an erosional surface at +7.5 m (Figure 6).
- -there -suggest-a-sea-level-of-approximately--H---'Fhe-very -precise-differenee-of--6-±-8,"S--mm. A comparison with OWHI reveals an ini- measured between the erosional platforms intial shallowing-upward sequence at +5 to +6 O'ahu at +13.5 m and Eleuthera at +7.5 mm in O'ahu (Figure 3) compared with the can be attributed to uplift of the Hawai'iBermuda and Bahamas level at ca. +1 m, site.
70 PACIFIC SCIENCE· January 2002
MAKUA VALLEY,WEST OAHU
subtidal sandsM~~~~liLq-+1010.55 ± 0.011
12
o
3
9
~, 6~
unexposed
bedded compact dirtybasalt talus
weakly lithified dunes
bighway
.."
/// /,/'/// /,..-/ // /_____+ ......:a....;............. LJo ...;... .......... S.L.
subtidal sands
Steams' (1974)Makua Section
FIGURE 5. The Malam Valley section located 7 ian SE of Ka'ena Point. A 400-m-wide terrace at +5 m was formed orextended early in MIS 5e, but later in the same highstand sea level rose to +9 m or greater, during which the coralheads grew at that elevation. The early-mid level at +5 m and the late +9 m level are typical of MIS 5e for O'ahu(Hearty et al. 2000) and demonstrate no apparent tilting of the island. Steams' (1974) interpretation of the section isshown in the inset. Stearns saw the +9 to +11 m deposits as a dune. Apparently the growtiI-position corals were notexposed in his section at the time of that investigation.
a narrow terrace with intertidal and subtidalfacies between + 18 and +20 m record thisfinal and highest sea-level halt of the interglaciation. Equivalent deposits are in the +18and +21 m caves of Bermuda. The averagedifference in highstand elevation of Unit 3between O'ahu (ca. +28 m) and stable localities (+19, +21 m) is 8 ± 1 m.
UNIT 3. At EGC3, a narrow erosionalterrace cut into eolian foresets is covered bythin beach deposits composed predominatelyof oolite with intertidal fenestrae. Beach deposits vary from 1 to 2 m thick and indicateformer sea level between +18 and +20 m.In Bermuda, Landet al. (1967) described amarine terrace with conglomerate and beachsand at 70 ft (+21.3 m) above sea level. Thesedeposits were unfortunately destroyed by The Last Interglaciationquarry expansion; however, more recent sur-veys have discovered marine deposits in two UNIT 4. Throughout Bermuda and thecaves at +18 and +21 m (Hearty et al. 1999), Bahamas, MIS 5e deposits have been datedlocated only tens of meters from the former and described at elevations between +2.5 andLand et al. (1967) site. + 3.5 m, which represents the duration of
Unit 3 is characterized at OWHI by MIS 5e (Neumann and Hearty 1996, Heartygrowth-position corals and calcarenite at +27 and Kaufman 2000). Late in the period,
_______m,jlanked_b¥_a_debris_aproll-sloping_do:wn~_how:ey:er,-sea-JeY:eLrose-to-~6-m.-Although- ...ward onto the +13.5-m terrace (Unit 2). A higher-level notches are recorded (Heartyconglomerate and intertidal sand at +30 m at and Neumann 2001), sea levels of +3 m andKa'ena Point (OEAl), O'ahu, is considered to +6 m are most representative of, respectively,be coeval to OWHI. At EGC3 in Eleuthera, early-mid and latest MIS 5e. Several MIS 5e
The K'aena Highstand of O'ahu, Hawai'i . Hearty 71
Stratigraphic Succession ofDeposits
There is consensus among the authors mentioned earlier on the MIS 5e age (ca. 125 kyr)
sites in O'ahu (Ku et al. 1974, Sherman et al.1993, Muhs and Szabo 1994, Szabo et al.1994, Hearty et al. 2000) expose early MIS 5egrowth-position reefs at +5 to +6 m and asubsequent reef at a higher level around +9m. In general, the reference data for Unit 4between the study sites for both early-midand late MIS 5e yield fairly precise and consistent differences of 3 ± 1 m for both levels.
FIGURE 6. Cliff section near Goulding Cay (EGC3), Eleuthera, Bahamas, showing +1 and +7.5 m terraces. These twolevels are correlated to the +5.5 and +13.5 m shorelines at OWHI in O'ahu.
of the younger "reference" deposits. Althoughthere are several approaches available to ascertain the age of the middle Pleistocene-agedeposits in question, a simple and reliable testis the stratigraphic superposition of the interglacial sequence of units.
The Quaternary stratigraphy of Bermuda,the Bahamas, and Hawai'i consists of a succession of interglacial limestone facies separated by glacial-age terra rossa paleosols.A sequence of stacked limestone-red soils
APPARENT, ESTIMATED, AND ABSOLUTE units-the younger superimposed upon the- -----------lfGES-UF THE SITES----------- --- --oloer-=istlie most fillioamental anirinoepen--
dent measure ofrelative age. These reasonablycomplete glacial-interglacial sequences havebeen previously documented (Table 1) inBermuda (Hearty et al. 1992, Hearty and
72 PACIFIC SCIENCE· January 2002
TABLE 1
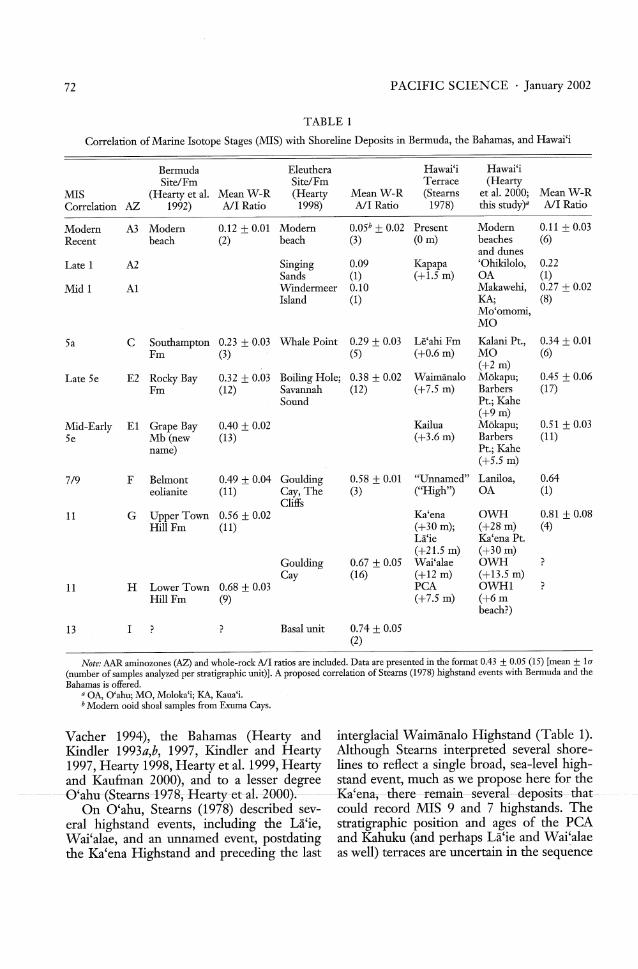
Correlation of Marine Isotope Stages (MIS) with Shoreline Deposits in Bermuda, the Bahamas, and Hawai'i
Bermuda Eleuthera Hawai'i Hawai'iSite/Fm Site/Fm Terrace (Hearty
MIS (Hearty et aI. MeanW-R (Hearty Mean W-R (Steams et al. 2000; MeanW-RCorrelation AZ 1992) NI Ratio 1998) NI Ratio 1978) this study)" NI Ratio
Modern A3 Modern 0.12 ± 0.01 Modern 0.05b ± 0.02 Present Modem 0.11 ± 0.03Recent beach (2) beach (3) (0 m) beaches (6)
and dunesLate 1 A2 Singing 0.09 Kapapa 'Ohikilolo, 0.22
Sands (1) (+1.5 m) OA (1)Mid 1 Al Windermeer 0.10 Makawehi, 0.27 ± 0.02
Island (1) KA; (8)Mo'omomi,MO
5a C Southampton 0.23 ± 0.D3 Whale Point 0.29 ± 0.03 Le'ahi Fm Kalani Pt., 0.34 ± 0.01Fm (3) (5) (+0.6 m) MO (6)
(+2 m)Late 5e E2 Rocky Bay 0.32 ± 0.03 Boiling Hole; 0.38 ± 0.02 Waimanalo Mokapu; 0.45 ± 0.06
Fm (12) Savannah (12) (+7.5 m) Barbers (17)Sound Pt.; Kahe
(+9 m)Mid-Early El Grape Bay 0.40 ± 0.02 Kailua Mokapu; 0.51 ± 0.035e Mb (new (13) (+3.6 m) Barbers (11)
name) Pt.; Kahe(+5.5 m)
7/9 F Belmont 0.49 ± 0.04 Goulding 0.58 ± 0.01 "Unnamed" Laniloa, 0.64eolianite (11) Cay, The (3) ("High") OA (1)
Cliffs11 G Upper Town 0.56 ± 0.02 Ka'ena OWH 0.81 ± 0.08
HillFm (11) (+30 m); (+28 m) (4)La'ie Ka'ena Pt.(+21.5 m) (+30 m)
Goulding 0.67 ± 0.05 Wai'alae OWHCay (16) (+12 m) (+13.5 m)
11 H Lower Town 0.68 ± 0.03 PCA OWHIHillFm (9) (+7.5 m) (+6m
beach?)
13 I Basal unit 0.74 ± 0.05(2)
Note: AAR aminozones (AZ) and whole-rock All ratios are included. Data are presented in the format 0.43 ± 0.05 (15) [mean ± Icr(number of samples analyzed per stratigraphic unit)]. A proposed correlation of Steams (1978) highstand events with Bermuda and theBahamas is offered.
a OA, O'ahu; MO, Moloka'i; KA, Kaua'i.b Modem ooid shoal samples from Exuma Cays.
Vacher 1994), the Bahamas (Hearty and interglacial Waimanalo Highstand (Table 1).Kindler 1993a,b, 1997, Kindler and Hearty Although Stearns interpreted several shore1997, Hearty 1998, Hearty et al. 1999, Hearty lines to reflect a single broad, sea-level highand Kaufman 2000), and to a lesser degree stand event, much as we propose here for the·e'ahu-EStearns-1918,-Hearty-et-aL-2000)~~---·-Kaiena,-there--remain-several-dep0sits-that-
On O'ahu, Stearns (1978) described sev- could record MIS 9 and 7 highstands. Theeral highstand events, including the La'ie, stratigraphic position and ages of the peAWai'alae, and an unnamed event, postdating and Kahuku (and perhaps La'ie and Wai'alaethe Ka'ena Highstand and preceding the last as well) terraces are uncertain in the sequence
The K'aena Highstand of O'ahu, Hawai'i . Hearty 73
on the ambient temperature of the reactionmedium, plus interaction with sediment andwater. Thus, sites at lower latitudes andwarmer temperatures are expected to yieldincrementally higher ratios.
O'ahu is situated in the Tropics at around21.5° N. Most of the Bahamas' data are fromhigher latitudes (28 to 22° N). Bermuda lieswell north of the Tropics and near the limitof reef growth at 32.3° N. Historical temperature records from the Hawaiian Islandsgenerally yield higher (25°C) mean annualtemperatures (MATs) than Bermuda (20°C)or the Bahamas (22-24°C), and significantintraisland MAT differences are also evidentin Hawai'i.
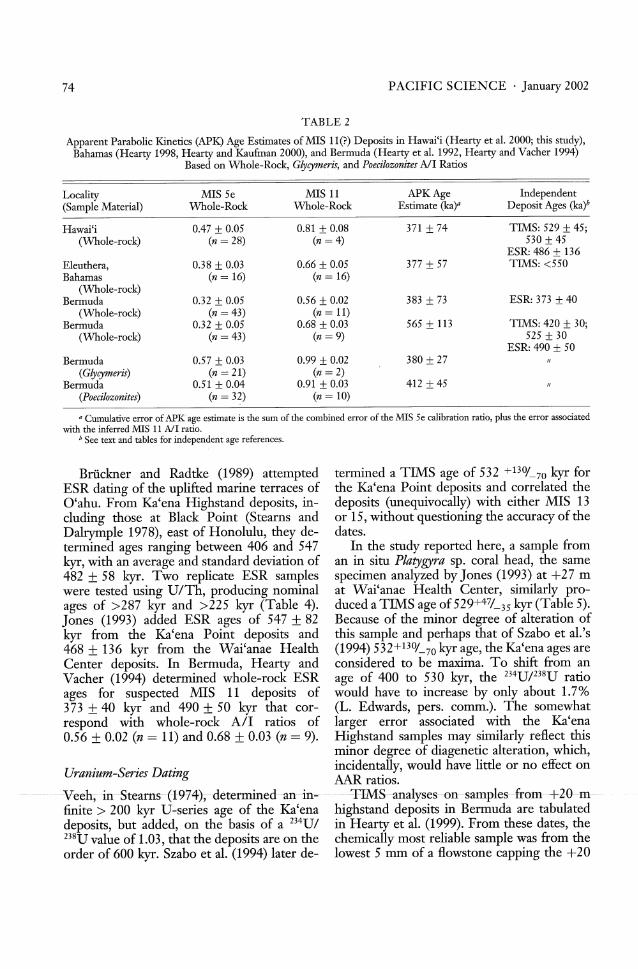
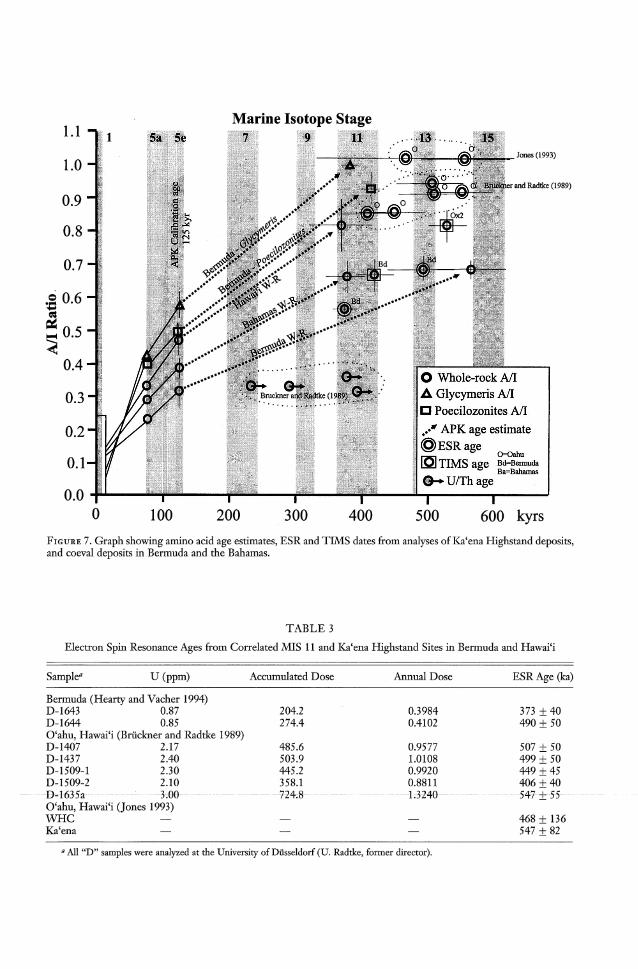
Table 2 is a comparison of correlated MIS5e and 11 whole-rock All ratios from thethree study areas. A thorough investigation ofwhole-rock aminostratigraphy of the Hawaiian Islands is available in Hearty et al. (2000).Age estimates based on whole-rock ratios using a model of apparent parabolic kinetics(APK) (Mitterer and Kriausakul 1989) rangefrom 370 to 565 kyr (Table 2; Figure 7).
Mean All ratios from Unit 3 at +27 m atWai'anae Health Center and +30 m fromKa'ena Point are 0.78 ± 0.10 (n = 2) and0.85 ± 0.08 (n = 2), respectively. Absoluteage calibration, which allows age estimates onthe basis of the APK model, is provided by a0.47 ± 0.05 (n = 28) mean All ratio, equivalent to MIS 5e, 125 kyr on O'ahu (Hearty etal. 2000). APK predicts ages of 340 ± 85 kyrand 408 ± 76 kyr (Table 2) for Wai'anae andKa'ena Point deposits, respectively, averaging374 ± 114 kyr.
(Stearns 1978: table 4) and could also represent interglaciations equal to or younger thanMIS 13. Indeed, Stearns' (1978:21) description of the PCA as a "beach sandstone ... inLualualei Valley" at +7.5 m closely matchesthe characteristics of Unit 1 at nearby OWHl,and the study reported here indicates a similarsea level at +5.5 m. Given this succession ofinterglacial-glacial couplets, I interpret thatthe stratigraphically youngest shoreline unitwas deposited during the present interglaciation (MIS 1), that the preceding one correlates with the last interglaciation (MIS 5,which exposes emergent subtidal depositsunlike MIS 3, 5a, or 5c), and that an unnamedunit, the Wai'alae, and the La'ie may accountfor MIS 7 and/or 9. If this interpretation iscorrect, the interglacial succession is complete back to the Ka'ena sequence, whichmust then equal or exceed MIS 11.
Aminostratigraphy of 0 'ahu Depori~
Whole-rock aminostratigraphy has been usedto unravel Quaternary stratigraphic questionsin Bermuda (Hearty et al. 1992), the Bahamas(Hearty and Kau&nan 2000), the HawaiianIslands (Hearty et al. 2000), and South Australia (Murray-Wallace et al. 2001). In thestudy reported here, aminostratigraphy is anindependent means of confirming the stratigraphic sequence and estimating the ages ofthe deposits. The underlying theory and various applications of the AAR method aresummarized in Rutter and Blackwell (1995).The AAR method is based on the racemization of amino acids preserved in biominerals (Hare and Mitterer 1967). Throughtime, L-amino acids racemize (or, more spe- E"e- n S,ht'n Re"onan e (ES'R) Datt'n
~I <.,0 r J c gcifically in the case of the amino acid iso-leucine, epimerize) to their D-isomer form. In the 1980s, because of analytical limitationsThe ratio of D/L (D-alloisoleucine/L-iso- of the UITh method, ESR was attempted onleucine, or All) amino acids measures the corals from uplifted terraces because of itseXtent of epimerization. In the epimerization longer effective age range (Radtke and Griinreaction of isoleucine, the All ratio is initially 1988). However, with the advent of TIMSzero (0.011 with laboratory preparation) in methods (Edwards et al. 1987), the daJing
-trUly modern -organisms -and-Increases to an-range of-me -U7Th-meilioaeffectively--oou----equilibrium All ratio of about 1.3 with time bled to nearly 600 kyr. In regard to theafter death of an organism. Ka'ena Highstand deposits, it appears that
Like many chemical reactions, the kinetic the two methods yield comparable resultsrate of racemization/epimerization depends (Tables 3 and 4).
74 PACIFIC SCIENCE· January 2002
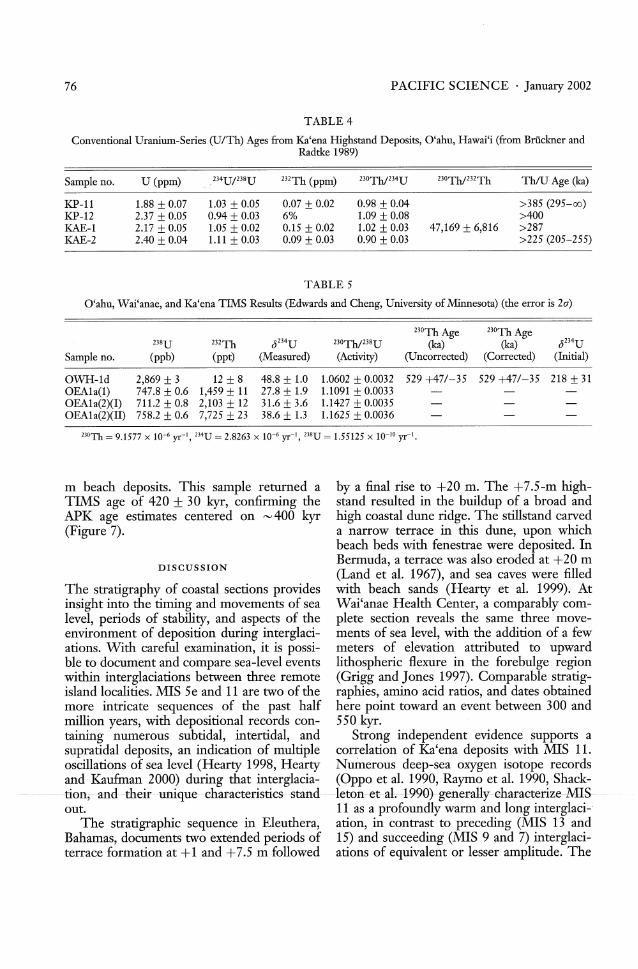
Bruckner and Radtke (1989) attemptedESR dating of the uplifted marine terraces ofG'ahu. From Ka'ena Highstand deposits, including those at Black Point (Stearns andDalrymple 1978), east of Honolulu, they determined ages ranging between 406 and 547kyr, with an average and standard deviation of482 ± 58 kyr. Two replicate ESR sampleswere tested using U/Th, producing nominalages of >287 kyr and >225 kyr (Table 4).Jones (1993) added ESR ages of 547 ± 82kyr from the Ka'ena Point deposits and468 ± 136 kyr from the Wai'anae HealthCenter deposits. In Bermuda, Hearty andVacher (1994) determined whole-rock ESRages for suspected MIS 11 deposits of373 ± 40 kyr and 490 ± 50 kyr that correspond with whole-rock All ratios of0.56 ± 0.02 (n = 11) and 0.68 ± 0.03 (n = 9).
TABLE 2
Apparent Parabolic Kinetics (API<) Age Estimates of MIS 11(?) Deposits in Hawai'i (Hearty et aJ. 2000; this study),Bahamas (Hearty 1998, Hearty and Kaufman 2000), and Bermuda (Hearty et aJ. 1992, Hearty and Vacher 1994)
Based on Whole-Rock, Glycymeris, and Poecilozonites All Ratios
Locality MIS 5e MIS 11 APKAge Independent(Sample Material) Whole-Rock Whole-Rock Estimate (kaY' Deposit Ages (ka)b
Hawai'i 0.47 ± 0.05 0.81 ± 0.08 371 ± 74 TIMS: 529 ± 45;(Whole-rock) (n = 28) (n = 4) 530 ± 45
ESR: 486 ± 136Eleuthera, 0.38 ± 0.03 0.66 ± 0.05 377 ± 57 TIMS: <550Bahamas (n = 16) (n = 16)
(Whole-rock)Bermuda 0.32 ± 0.05 0.56 ± 0.02 383 ± 73 ESR: 373 ± 40
(Whole-rock) (n = 43) (n = 11)Bermuda 0.32 ± 0.05 0.68 ± 0.03 565 ± 113 TIMS: 420 ± 30;
(Whole-rock) (n = 43) (n = 9) 525 ± 30ESR: 490 ± 50
Bermuda 0.57 ± 0.03 0.99 ± 0.02 380 ± 27(Glycymeris) (n = 21) (n = 2)
Bermuda 0.51 ± 0.04 0.91 ± 0.03 412 ± 45(Poecilozonites) (n = 32) (n = 10)
Q Cumulative error of APKage estimate is the sum of the combined error of the MIS 5e calibration ratio, plus the error associatedwith the inferred MIS 11 All ratio.
b See text and tables for independent age references.
termined a TIMS age of 532 +130/_70 kyr forthe Ka'ena Point deposits and correlated thedeposits (unequivocally) with either MIS 13or 15, without questioning the accuracy of thedates.
In the study reported here, a sample froman in situ Platygyra sp. coral head, the samespecimen analyzed by Jones (1993) at +27 mat Wai'anae Health Center, similarly produced a TIMS age of 529+47/_ 35 kyr (Table 5).Because of the minor degree of alteration ofthis sample and perhaps that of Szabo et al.'s(1994) 532+130/_70 kyr age, the Ka'ena ages areconsidered to be maxima. To shift from anage of 400 to 530 kyr, the 234U/238U ratiowould have to increase by only about 1.7%(L. Edwards, pers. comm.). The somewhatlarger error associated with the Ka'enaHighstand samples may similarly reflect thisminor degree of diagenetic alteration, which,
U: . S' D t' incidentally, would have little or no effect onranzum- enes a mg AAR ratios.
---Veeh;-in-Stearns-0994-);--determined--an-in= --..q:IM-S-analyses- on-samples-from--+~0-m-finite> 200 kyr U-series age of the Ka'ena highstand deposits in Bermuda are tabulateddeposits, but added, on the basis of a 234U/ in Hearty et al. (1999). From these dates, the238U value of 1.03, that the deposits are on the chemically most reliable sample was from theorder of 600 kyr. Szabo et al. (1994) later de- lowest 5 mm of a flowstone capping the +20
Marine Isotope Stage
o Whole-rock AJIA Glycymeris AllC Poecilozonites AJI
•••• APK age estimate@ESRage
o-oahu~ TIMS age BcFBermuda
BIFBahamaso-U/Thage
1.1 1
1.0~
0.9
0.8
0.7
~ 0.6=~~ 0.5
0.4
0.3
0.2
0.1
0.00 100 200 300 400 500
Jones (1993)
and Radtke (1989)
600 kyrs
FIGURE 7. Graph showing amino acid age estimates, ESR and TIMS dates from analyses of Ka'ena Highstand deposits,and coeval deposits in Bermuda and the Bahamas.
TABLE 3
Electron Spin Resonance Ages from Correlated MIS 11 and Ka'ena Highstand Sites in Bermuda and Hawai'i
Sample" U (ppm) Accumulated Dose Annual Dose ESRAge (ka)
373 ± 40490 ± 50
507 ± 50499 ± 50449 ± 45406 ± 40
- -- -547-±-5S- _.-
468 ± 136547 ± 82
0.39840.4102
0.95771.01080.99200.8811
--- -----lcH40--
204.2274.4
485.6503.9445.2358.1
-- --- --724"8- --- ---
Bermuda (Hearty and Vacher 1994)D-1643 0.87D-1644 0.85O'ahu, Hawai'i (Bruckner and Radtke 1989)D-I407 2.17D-1437 2.40D-1509-1 2.30D-1509-2 2.10-B~1635a -- --HlO-O'ahu, Hawai'i (Jones 1993)WHCKa'ena
a All "D" samples were analyzed at the University of Dusseldorf (U. Radtke, former director).
76
TABLE 4
PACIFIC SCIENCE· January 2002
DISCUSSION
m beach deposits. This sample returned aTIMS age of 420 ± 30 kyr, confirming theAPK age estimates centered on ,...., 400 kyr(Figure 7).
Conventional Uranium-Series (U/Th) Ages from Ka'ena Highstand Deposits, O'ahu, Hawai'i (from Briickner andRadtke 1989)
Sample no. U (ppm) .234U/238U 232Th (ppm) 2JOTh/234U 2JOTh/2J2Th ThIU Age (ka)
KP-ll 1.88 ± 0.07 1.03 ± 0.05 0.07 ± 0.02 0.98 ± 0.04 >385 (295-00)KP-12 2.37 ± 0.05 0.94 ± 0.03 6% 1.09 ± 0.08 >400KAE-l 2.17 ± 0.05 1.05 ± 0.02 0.15 ± 0.02 1.02 ± 0.03 47,169 ± 6,816 >287KAE-2 2.40 ± 0.04 1.11 ± 0.03 0.09 ± 0.03 0.90 ± 0.03 >225 (205-255)
TABLE 5
O'ahu, Wai'anae, and Ka'ena TIMS Results (Edwards and Cheng, University of Minnesota) (the error is 20')
0 234U230ThAge 2JOThAge
O234U2J8U 232Th 2JOTh/238U (ka) (ka)Sample no. (ppb) (ppt) (Measured) (Activity) (Uncorrected) (Corrected) (Initial)
OWH-ld 2,869 ± 3 12 ± 8 48.8 ± 1.0 1.0602 ± 0.0032 529 +47/-35 529 +47/-35 218 ± 31OEAla(l) 747.8 ± 0.6 1,459 ± 11 27.8 ± 1.9 1.1091 ± 0.0033OEAla(2)(I) 711.2 ± 0.8 2,103 ± 12 31.6 ± 3.6 1.1427 ± 0.0035OEAla(2)(II) 758.2 ± 0.6 7,725 ± 23 38.6 ± 1.3 1.1625 ± 0.0036
BOTh = 9.1577 x 10⁻⁶ yr-I, 2J4U = 2.8263 X 10⁻⁶ yr-I, "'U = 1.55125 X 10⁻¹⁰ yr-I.
by a final rise to +20 m. The +7.5-m highstand resulted in the buildup of a broad andhigh coastal dune ridge. The stillstand carveda narrow terrace in this dune, upon whichbeach beds with fenestrae were deposited. InBermuda, a terrace was also eroded at +20 m(Land et al. 1967), and sea caves were filled
The stratigraphy of coastal sections provides with beach sands (Hearty et al. 1999). Atinsight into the timing and movements of sea Wai'anae Health Center, a comparably comlevel, periods of stability, and aspects of the plete section reveals the same three moveenvironment of deposition during interglaci- ments of sea level, with the addition of a fewations. With careful examination, it is possi- meters of elevation attributed to upwardble to document and compare sea-level events lithospheric flexure in the forebulge regionwithin interglaciations between three remote (Grigg and Jones 1997). Comparable stratigisland localities. MIS 5e and 11 are two of the raphies, amino acid ratios, and dates obtainedmore intricate sequences of the past half here point toward an event between 300 andmillion years, with depositional records con- 550 kyr.taining numerous subtidal, intertidal, and Strong independent evidence supports asupratidal deposits, an indication of multiple cori'elation of Ka'ena deposits with MIS 11.oscillations of sea level (Hearty 1998, Hearty Numerous deep-sea oxygen isotope recordsand Kaufman 2000) during that interglacia- (Oppo et al. 1990, Raymo et al. 1990, Shack-
. tion, and-their-unique -eharaeteristies--stancl--Iet0n-et-al~I-99Q)-genemlly-ehal'aetel'ize-MISout. 11 as a profoundly warm and long interglaci-
The stratigraphic sequence in Eleuthera, ation, in contrast to preceding (MIS 13 andBahamas, documents two extended periods of 15) and succeeding (MIS 9 and 7) interglaciterrace formation at + 1 and + 7.5 m followed ations of equivalent or lesser amplitude. The
The K'aena Highstand of O'ahu, Hawai'i . Hearty
TABLE 6
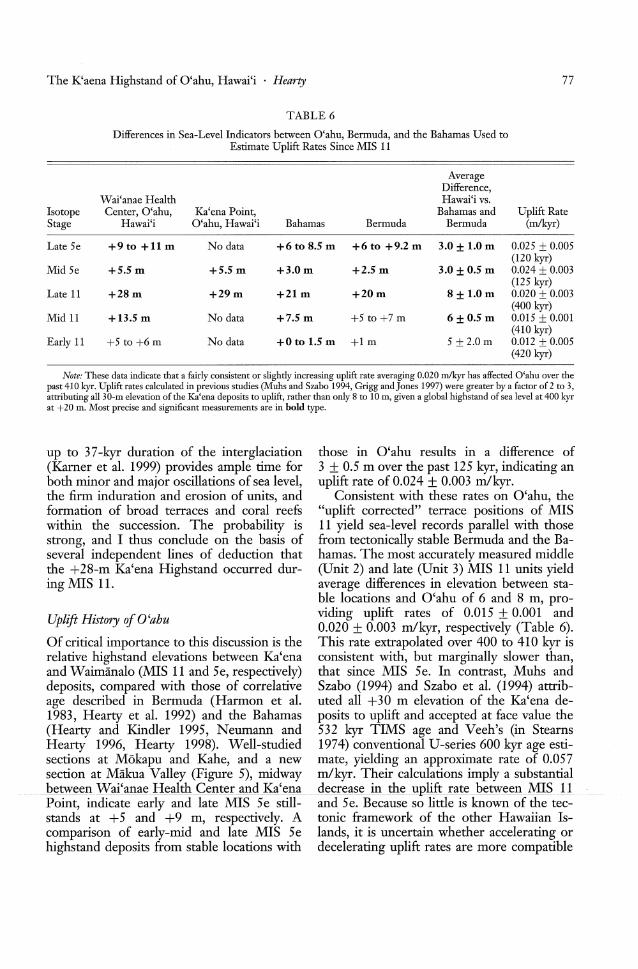
Differences in Sea-Level Indicators between O'ahu, Bermuda, and the Bahamas Used toEstimate Uplift Rates Since MIS 11
77
Uplift History ofO'ahu
up to 37-kyr duration of the interglaciation(Karner et al. 1999) provides ample time forboth minor and major oscillations of sea level,the firm induration and erosion of units, andformation of broad terraces and coral reefswithin the succession. The probability isstrong, and I thus conclude on the basis ofseveral independent lines of deduction thatthe +28-m Ka'ena Highstand occurred during MIS 11.
AverageDifference,
Wai'anae Health Hawai'i vs.Isotope Center,O'ahu, Ka'ena Point, Bahamas and Uplift RateStage Hawai'i O'ahu, Hawai'i Bahamas Bermuda Bermuda (m/kyr)
Late 5e +9to +11 m No data +6 to 8.5 m +6 to +9.2 m 3.0 ± LOrn 0.025 ± 0.005(120 kyr)
Mid 5e +5.5 m +5.5m +3.0m +2.5 m 3.0 ± 0.5 m 0.024 ± 0.003(125 kyr)
Late 11 +28m +29m +21 m +20m 8 ± 1.0 m 0.020 ± 0.003(400 kyr)
Mid 11 +13.5m No data +7.5m +5 to +7 m 6 ± 0.5 m 0.015 ± 0.001(410 kyr)
Early 11 +5 to +6 m No data +0 to 1.5 m +lm 5 ± 2.0 m 0.012 ± 0.005(420 kyr)
Note: These data indicate that a fairly consistent or slightly increasing uplift rate averaging 0.020 mIkyr has affected O'ahu over thepast 410 kyr. Uplift rates calculated in previous studies (Moos and Szabo 1994, Grigg and Jones 1997) were greater by a factor of2 to 3,attributing all 30-m elevation of the Ka'ena deposits to uplift, rather than only 8 to 10 m, given a global highstand of sea level at 400 kyrat +20 m. Most precise and significant measurements are in bold type.
those in O'ahu results in a difference of3 ± 0.5 m over the past 125 kyr, indicating anuplift rate of 0.024 ± 0.003 mlkyr.
Consistent with these rates on O'ahu, the"uplift corrected" terrace positions of MIS11 yield sea-level records parallel with thosefrom tectonically stable Bermuda and the Bahamas. The most accurately measured middle(Unit 2) and late (Unit 3) MIS 11 units yieldaverage differences in elevation between stable locations and O'ahu of 6 and 8 m, providing uplift rates of 0.015 ± 0.001 and0.020 ± 0.003 mlkyr, respectively (Table 6).
Of critical importance to this discussion is the This rate extrapolated over 400 to 410 kyr isrelative highstand elevations between Ka'ena consistent with, but marginally slower than,and Waimanalo (MIS 11 and 5e, respectively) that since MIS 5e. In contrast, Muhs anddeposits, compared with those of correlative Szabo (1994) and Szabo et al. (1994) attribage described in Bermuda (Harmon et al. uted all +30 m elevation of the Ka'ena de1983, Hearty et al. 1992) and the Bahamas posits to uplift and accepted at face value the(Hearty and Kindler 1995, Neumann and 532 kyr TIMS age and Veeh's (in StearnsHearty 1996, Hearty 1998). Well-studied 1974) conventional U-series 600 kyr age estisections at Mokapu and Kahe, and a new mate, yielding an approximate rate of 0.057section at Makua Valley (Figure 5), midway mlkyr. Their calculations imply a substantialbetweenWai'ana~_Health_C~nter andJ~i~na__d~gease in__1TIeJ!plift rate betw~1LMISJl
Point, indicate early and late MIS 5e still- and 5e. Because so little is known of the tecstands at +5 and +9 m, respectively. A tonic framework of the other Hawaiian Iscomparison of early-mid and late MIS 5e lands, it is uncertain whether accelerating orhighstand deposits from stable locations with decelerating uplift rates are more compatible
78
with the movement of the islands over theflexural forebulge area.
Implications for Ice-Melting History
The progressive "stepping up" of sea levelthrough the interglaciation appears to becharacteristic of MIS 11, as interpreted fromthe geology of Bermuda, the Bahamas, andnow deposits associated with the Ka'enaHighstand in O'ahu. This progressive rise ofsea level is chronologically documented in thePonte Galeria area near Rome, Italy, with4°Ar/39Ar dates of 434 ± 8 kyr, 427 ± 5 kyr,and 406 ± 3 kyr from the base of the MIS 11sequence to the top (Karner and Renne1998), respectively. The section at PonteGaleria documents approximately 40 m ofsediment accumulation over this interval ofapproximately 30 kyr.
Some explanation of the initial rise of sealevel is provided by the record of ice-rafteddebris (IRD) from ODP Site 982 from theNorth Atlantic (Stanton-Frazee et al. 1999).Core material from the MIS 12-11 transition(Termination V) shows the highest volumeof IRD, followed by 23 kyr (early in the period) with no IRD deposition, implying no iceberg discharge and thus that much of theGreenland ice sheet (GIS) must have meltedearly in MIS 11. This initial rise of sea levelof 5 to 7 m caused by the melting GIS mayhave had a deleterious effect on the marinebased West Antarctic ice sheet (WAIS),which in turn, upon complete disintegration,would have contributed another 5 to 6 m tosea level. The loss of the stabilizing effect ofthe W AIS on shared ice basins (Radok et al.1987) in East Antarctica would cause thedrawdown of those shared basins and in sodoing, generate an additional 8 to 10m of sealevel. These three melting and collapse eventswould thus account for the net 20 ± 3 m riseof sea level toward the end of MIS 11.
CONCLUSIONS
The middle Pleistocene stratigraphy from theWai'anae Health Center section in westernO'ahu yields a parallel sea-level history whencompared with that from Bermuda and the
PACIFIC SCIENCE· January 2002
Bahamas with levels at (uplifted O'ahu in parentheses): +1 (+5-6), +7.5 (+13.5), +20(+28) m. This progressive stepping up of sealevel may have occurred over a period of upto 37 kyr (Karner et al. 1999).
The superposition of stratigraphic unitstogether with several dating approaches including AAR, ESR, V-series, and TIMS suggests that the age of the deposits is between350 and 550 kyr, and deep-sea isotope records (Oppo et al. 1990, Raymo et al. 1990)appear to confirm that MIS 11 was thelongest and perhaps one of the warmer interglaciations of the past 0.5 myr. Because thepreceding (MIS 13 and 15) and succeeding(MIS 9 and 7) interglaciations show relativelyreduced sea level elevation (e.g., Hearty 1998,Hearty and Kaufman 2000), it is reasonableto conclude that the Ka'ena Highstand occurred during MIS 11. The duration and apparent warmth of this middle Pleistoceneinterglaciation may provide a direct explanation for the great reduction in polar icevolume.
On the basis of comparisons with Bermuda and the Bahamas, an uplift rate of0.024 ± 0.003 m/kyr is calculated since MIS5e for O'ahu. If one accepts that 20 m of the+28 m of the MIS 11 Ka'ena Highstand sealevel is attributable to eustatic causes, the remaining 8 m can be explained by tectonicmotion over the past 400 kyr at a rate of0.020 ± 0.003 m/kyr, in accordance with ourestimate of MIS 5e uplift rates.
The sea-level changes recorded in MIS 11highstand deposits in Bermuda, the Bahamas,the Hawaiian Islands, and elsewhere reflectthe melting history of ice sheets. The association of longer or warmer interglaciationswith the partial or complete melting or collapse of some of the world's major ice sheetsmay be coincidental, but because of the potential significance of this uncertain factor, itshould be given due consideration in the formulation of global warming scenarios.
ACKNOWLEDGMENTS
I am grateful to L. Edwards and Hai Cheng(University of Minnesota) for their TIMSanalyses of fossil materials from Hawai'i,
The K'aena Highstand of O'ahu, Hawai'i . Hearty 79
Literature Cited
Bermuda, and the Bahamas. S. Olson and P.Kindler contributed greatly to field studiesand the development of these concepts.Whole-rock AAR samples were analyzed under a collaborative agreement with the AminoAcid Laboratory of Northern Arizona University (D. Kaufman, director).
plications for eustatic sea-level fluctuationover the past 250,000 years. Palaeogeogr.Palaeoclimatol. Palaeoecol. 44:41-70.
Hearty, P. J. 1998. The geology of EleutheraIsland, Bahamas: A Rosetta Stone of Quaternary stratigraphy and sea-level history.Quat. Sci. Rev. 17:333-355.
Hearty, P. ]., and D. S. Kaufman. 2000.Whole-rock aminostratigraphy and Quaternary sea-level history of the Bahamas.
Bowen, D. Q. 1999. +23 m Stage 11 sea-level Quat. Res. (N.Y.) 54:163-173.in southern Britain. Pages 15-17 in R. Z. Hearty, P. J., and P. Kindler. 1993a. NewPoore, L. Burkle, and W. E. McNulty, perspectives on Bahamian geology: Saneds. Marine oxygen isotope stage 11 and Salvador Island, Bahamas. J. Coast. Res.associated terrestrial records. U.S. De- 9:577-594.partment of the Interior. U. S. Geological ---. 1993b. An illustrated stratigraphy ofSurvey Open File Report 99-312. the Bahama Islands: In search of a com-
Brigham-Grette, J. 1999. Marine isotope mon origin. Bahamas J. Sci. 1:28-45.stage 11 high sea level record from North- ---. 1995. Sea-level highstand chronol-west Alaska. Pages 19-21 in R. Z. Poore, L. ogy from stable carbonate platforms (Ber-Burkle, and W. E. McNulty, eds. Marine muda and the Bahamas). J. Coast. Res.oxygen isotope stage 11 and associated ter- 11:675-689.restrial records. U.S. Department of the ---. 1997. The stratigraphy and surficialInterior. U. S. Geological Survey Open geology of New Providence and surround-File Report 99-312. ing islands, Bahamas. J. Coast. Res.
Bruckner, H., and U. Radtke. 1989. Fossile 13:798-812.strande und korallenbiinke auf Oahu, Hearty, P. ]., and A. C. Neumann. 2001.Hawaii. Essener Geogr. Arb. 17:291-308. Rapid sea-level and climate change at the
Burckle, L. H. 1993. Late Quaternary inter- close of the last interglaciation (MIS 5e):glacial stages warmer than present. Quat. Evidence from the Bahama Islands. Quat.Sci. Rev. 12:825-831. Sci. Rev. (in press).
Easton, W. H., and T. L. Ku. 1981. 230ThI Hearty, P.]., and H. L. Vacher. 1994. Qua-234U dates of Pleistocene deposits on ternary stratigraphy of Bermuda: A high-O'ahu. Bull. Mar. Sci. 31:552-557. resolution pre-Sangamonian rock record.
Edwards, R. L., J. H. Chen, and G. J. Was- Quat. Sci. Rev. 13:685-697.serburg. 1987. 238U-234U-230Th-232Th Hearty, P.]., H. L. Vacher, and R. M. Mit-systematics and the precise measurement terer. 1992. Aminostratigraphy and ages ofof time over the past 500,000 years. Earth Pleistocene limestones of Bermuda. Geol.Planet. Sci. Lett. 81:175-192. Soc. Am. Bull. 104:471-480.
Grigg, R. W., and A. T. Jones. 1997. Uplift Hearty, P.]., P. Kindler, H. Cheng, and R. L.caused by lithospheric flexure in the Ha- Edwards. 1999. Evidence for a +20 mwaiian Archipelago as revealed by elevated middle Pleistocene sea-level highstandcoral deposits. Mar. Geol. 141:11-25. (Bermuda and Bahamas) and partial col-
Hare, P. E., and R. M. Mitterer. 1967. Non- lapse of Antarctic ice. Geology (Boulder)protein amino acids in fossil shells. Carne- 27:375-378.gie Inst. Wash. Year Book 65:236-364. Hearty, P. ]., D. S. Kaufman, S. L. Olson,
- - -Harmon,-R-S~R·Nt-Mtfterer,-:N~Knausalrul~ -- -- ancl-FL F:- James. LOOO~-Srrat1graphy anaL. S. Land, H. P. Schwarcz, P. Garrett, G. whole-rock amino acid geochronology ofJ. Larson, H. L. Vacher, and M. Rowe. key Holocene and Last Interglacial carbo-1983. U-series and amino acid race- nate deposits in the Hawaiian Islands. Pac.mization geochronology of Bermuda: Im- Sci. 54:423-442.
80
Imbrie,]., and Others (9 authors). 1984. Theorbital theory of Pleistocene climate: Support from a revised chronology of themarine J 180 record. Pages 269-305 in A.L. Berger, ]. Imbrie, ].Hays, G. Kukla,and B. Saltzman, eds. Milankovitch andClimate, Part 1. D. Reidel PublishingCompany, Dordrecht.
Jones, A. T. 1993. Review of the chronologyof marine terraces in the Hawaiian Archipelago. Quat. Sci. Rev. 12:811-823.
Karner, D. B., and P. R Renne. 1998. 4°Ar/39Ar geochronology of Roman VolcanicProvince tephra in the Tiber River valley:Age calibration of Middle Pleistocene sealevel changes. Geol. Soc. Am. Bull.110:740-747.
Karner, D. B., F. Marra, and P. R Renne.1999. 40Ar/39Ar dating of glacial termination V and duration of the Stage 11 highstand. Pages 35-40 in R Z. Poore, L.Burkle, and W. E. McNulty, eds. Marineoxygen isotope stage 11 and associatedterrestrial records. U.S. Department of theInterior. 0. S. Geological Survey OpenFile Report 99-312.
Kaufman, D. S., and ]. Brigham-Grette.1993. Aminostratigraphic correlations andpaleotemperature implications, PliocenePleistocene high sea level deposits, northwestern Alaska. Quat. Sci. Rev. 12:21-33.
Kindler, P., and P.]. Hearty. 1997. Geologyof the Bahamas: Architecture of BahamianIslands. In H. L. Vacher and T. Quinn, eds.The geology and hydrogeology of carbonate islands. Dev. Sedimentol. 54:141160.
---.2000. Elevated marine terraces fromEleuthera (Bahamas) and Bermuda: Sedimentological, petrographic, and geochronological evidence for important deglationevents during the middle Pleistocene.Glob. Planet. Change 24:41-58.
Ku, T. L., M. A. Kimmel, W. H. Easton, andT. ]. O'Neill. 1974. Eustatic sea level120,000 years ago on O'ahu, Hawai'i.Scieiice(Washillgtoii~·· IT.C.)183:959=%2:
Land, L. S., F. T. Mackenzie, and S. ].Gould. 1967. The Pleistocene history ofBermuda. Geol. Soc. Am. Bull. 78:9931006.
PACIFIC SCIENCE· January 2002
Mitterer, R M., and N. Kriausakul. 1989.Calculation of amino acid racemizationages based on apparent parabolic kinetics.Quat. Sci. Rev. 8:353-357.
Muhs, D. R, and B. ]. Szabo. 1994. Newuranium-series ages of the WaimanaloLimestone, O'ahu, Hawai'i: Implicationsfor sea level during the last interglacialperiod. Mar. Geol. 118:315-326.
Murray-Wallace, c., B. P. Brooke, ]. H.Cann, A. P. Belperio, and R P. Bourman.2001. Whole-rock aminostratigraphy ofthe Coorong Coastal Plain, South Australia: Towards a 1 million year record of sealevel highstands. ]. Geol. Soc. (Lond.)158:111-124.
Neumann, A. c., and P. ]. Hearty. 1996.Rapid sea-level changes at the close of thelast interglacial (substage 5e) recorded inBahamian Island geology. Geology (Boulder) 24:775-778.
Oppenheimer, M. 1998. Global warming andthe stability of the West Antarctic IceSheet. Nature (Lond.) 393:325-332.
Oppo, D. W., R G. Fairbanks, and A. L.Gordon. 1990. Late Pleistocene SouthernOcean J 13 C variability. Paleoceanography5:43-54.
Poore, R Z., L. Burkle, and W. E. McNulty,eds. 1999. Marine oxygen isotope stage 11and associated terrestrial records. U.S.Department of the Interior. 0. S. Geological Survey Open File Report 99-312.
Radok, U., D.]enssen, and B. McInnes. 1987.On the surging potential of polar icestreams. US. Department of Energy Report DOE/ER/60197-H1. 62 p.
Radtke, 0., and R Griin. 1988. ESR datingof corals. Quat. Sci. Rev. 7:465-470.
Raymo, M. E., W. F. Ruddiman, N. ].Shackleton, and D. W. Oppo. 1990. Evolution of Atlantic-Pacific J 13 C gradientsover the last 2.5 m.y. Earth Planet. Sci.Lett. 97:353-368.
Rutter, N. W., and B. Blackwell. 1995.Amino acid racemization dating. PageslZ5=T67 inN:W: Rutter ana-N: R. CattO;eds. Dating methods for Quaternary deposits. Geological Association of Canada,Newfoundland.
Shackleton, N. ]., A. Berger, and W. R Pelt-
The K'aena Highstand of O'ahu, Hawai'i . Hearty
ier. 1990. An alternative astronomical calibration of the lower Pleistocene timescalebased on ODP Site 677. Trans. R. Soc.Edinb. Earth Sci. 81:251-261.
Sherer, R. P., A. Aldahan, W. Tulaczyk, G.Possnert, H. Englehardt, and B. Ramb.1998. Pleistocene collapse of the WestAntarctic Ice Sheet. Science (Washington,D.C.) 281:82-85.
Sherman, C. E. 1992. Depositional, diagenetic, and sea-level history of late Pleistocene carbonates, O'ahu, Hawai'i. M.S.thesis, University of Hawai'i at Manoa,Honolulu.
Sherman, C. E., C. R. Glenn, A. T. Jones, W.C. Burnett, and H. P. Schwarcz. 1993.New evidence for two highstands of thesea during the last interglacial, oxygenisotope substage 5e. Geology (Boulder)21:1079-1082.
Stanton-Frazee, c., D. A. Warnke, K. Venz,and D. A. Hodell. 1999. The stage 11problem as seen at ODP Site 982. Page 75in R. Z. Poore, L. Burkle, and W. E.
81
McNulty, eds. Marine oxygen isotopestage 11 and associated terrestrial records.U.S. Department of the Interior. U. S.Geological Survey Open File Report 99312.
Stearns, H. T. 1974. Submerged shorelinesand shelves in the Hawaiian Islands and arevision of some of the eustatic emergedshorelines. Geol. Soc. Am. Bull. 85:795804.
---. 1978. Quaternary shorelines in theHawaiian Islands. Bernice P. Bishop Mus.Bull. 237:1-57.
Stearns, H. T., and C. B. Dalrymple. 1978.The K-Ar age of the Black Point dikeon O'ahu, Hawai'i, and its relation to theYarmouth Interglaciation. Occas. Pap.Bernice Pauahi Bishop Mus. 24:307-313.
Szabo, B.]., K. R. Ludwig, D. R. Muhs, andK. R. Simmons. 1994. Thorium-230 agesof corals and duration of the last interglacial sea-level high stand on O'ahu,Hawai'i. Science (Washington, D.C.)266:93-96.