Embed Size (px)
Citation preview
JA Solar Corporate Presentation June 2012
Protect the one Earth we all share, for this and future generations.

This presentation contains forward-looking statements. These statements relate to future
events or to future financial performance and involve known and unknown risks, uncertainties,
and other factors that may cause our actual results, levels of activity, performance, or
achievements to be materially different from any future results, levels of activity, performance,
or achievements expressed or implied by these forward-looking statements. In some cases,
you can identify forward-looking statements by the use of words such as “may,” “could,”
“expect,” “intend,” “plan,” “seek,” “anticipate,” “believe,” “estimate,” “predict,” “potential,”
or “continue” or the negative of these terms or other comparable terminology. You should not
place undue reliance on forward-looking statements because they involve known and
unknown risks, uncertainties and other factors that are, in some cases, beyond our control
and that could materially affect actual results, levels of activity, performance, or achievements.
Any forward-looking statement you see or hear during this presentation reflects our current
views with respect to future events and is subject to the risks, uncertainties, and assumptions
relating to our operations, results of operations, growth strategy, and liquidity. We assume no
obligation to publicly update or revise these forward-looking statements for any reason,
whether as a result of new information, future events, or otherwise.
Forward-looking Statements
2

Introduction to JA Solar

Shanghai, China
May 2005 / February 2007
World’s leading solar cell and module manufacturer
Shipment: 1.69 GW
World class quality, conversion efficiency, and cost
structure
2.8 GW Solar Cell; 1.2 GW Solar Module;
1.0 GW Solar Wafer
19.5% high-efficiency mono, 18.8% standard mono
18.5% high-efficiency multi, 17.3% standard multi
Nasdaq: JASO
~12,000
World Leader in Solar Cell Technology, Capacity & Shipment Headquarters
2011 Shipments
Ticker Symbol
Date Est’d / IPO
Attributes
Annual Capacity
Conversion
Efficiency
Employees
Business
4
Introduction to JA Solar
POLYSILICON SILICON WAFER CELL MODULE SYSTEM
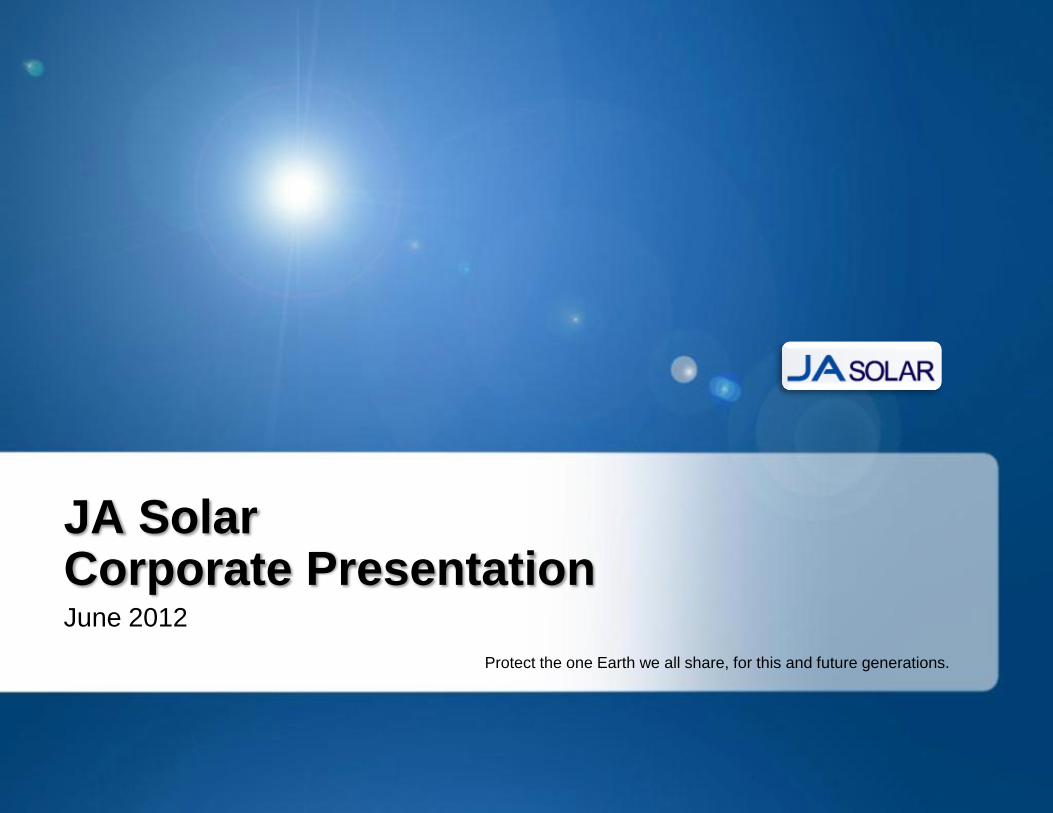
Introduction to JA Solar
Selectively Optimized Vertical Integration Model
with the benefits of integrated manufacturing processes
5
Solar Wafers Solar Cells PV Modules EPC
• Low-cost, high-quality
production
• Leading the industry in
high-efficiency wafer
research
• One of the world’s
largest manufacturers
• Recognized for top
tech at low cost
• High-performance
mono- and multi-
crystalline solar cells
• High-quality product
with high-quality BOM
• Additional channel for
product distribution
• Working with leading
brands on OEM
modules
• Partnering with top-tier
developers in China
• Cooperation with
global leading IPPs on
utility scale projects
1GW Capacity in 2011
2.8GW capacity in 2011
1.2GW capacity in 2011
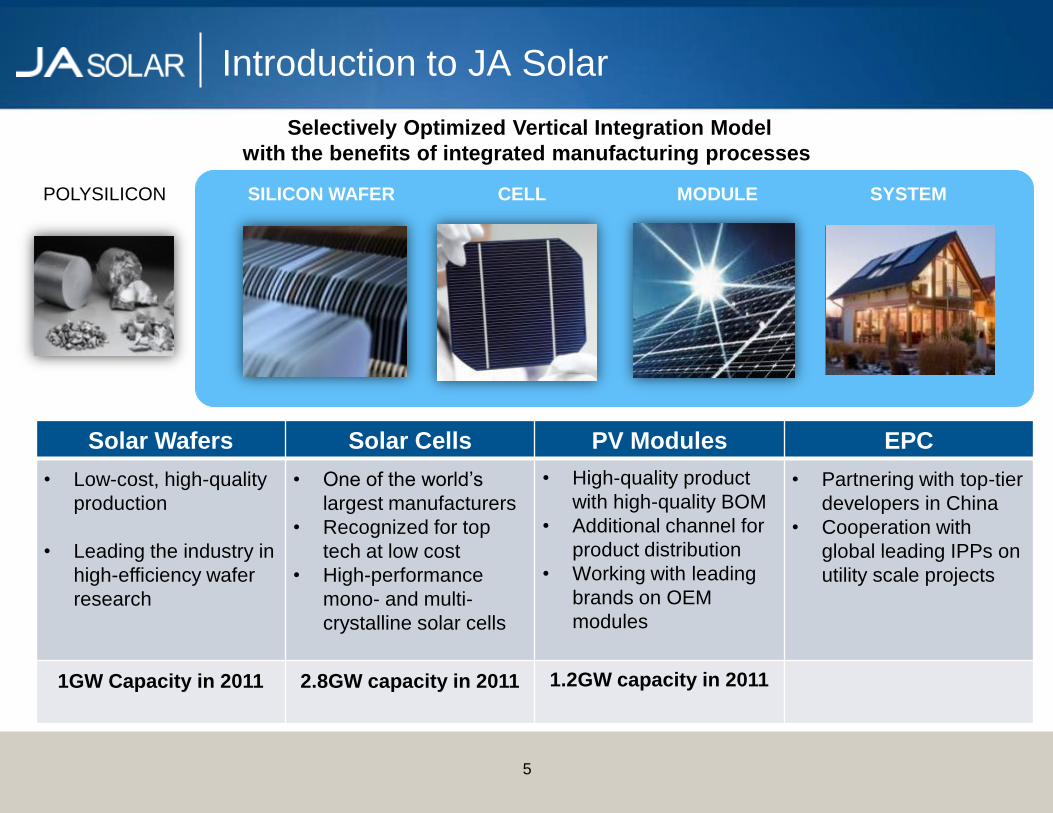
Substantial Shipment & Market Share Growth
(MW)
Over 4.0 GW in cumulative PV product shipment since 2006
-
200
400
600
800
1,000
1,200
1,400
1,600
1,800
2,000
2006 2007 2008 2009 2010 2011 2012E
26 132
277
509 1,246 1,210
1,800~2,000
217
485
Cell Module
1,463
1,695
6

JA Solar ranked #2 in c-Si products production in the year of 2011 according to Photon International.
Top solar cell supplier with substantial market share – Scale, Quality, Technology, and Cost Structure leadership
7
2011 Top 12 Solar Cell Manufacturers in the World
One of World’s Top Solar Supplier
790
800
815
873
922
940
1010
1100
1550
1604
1700
2219.6
0 500 1000 1500 2000 2500
Q-Cells
Neo Solar
Hanwha SolarOne
Gintech
Sunpower
Hareon Solar
Canadian Solar
Motech
Trina Solar
Yingli Green
JA Solar
Suntech
Source: Photon International
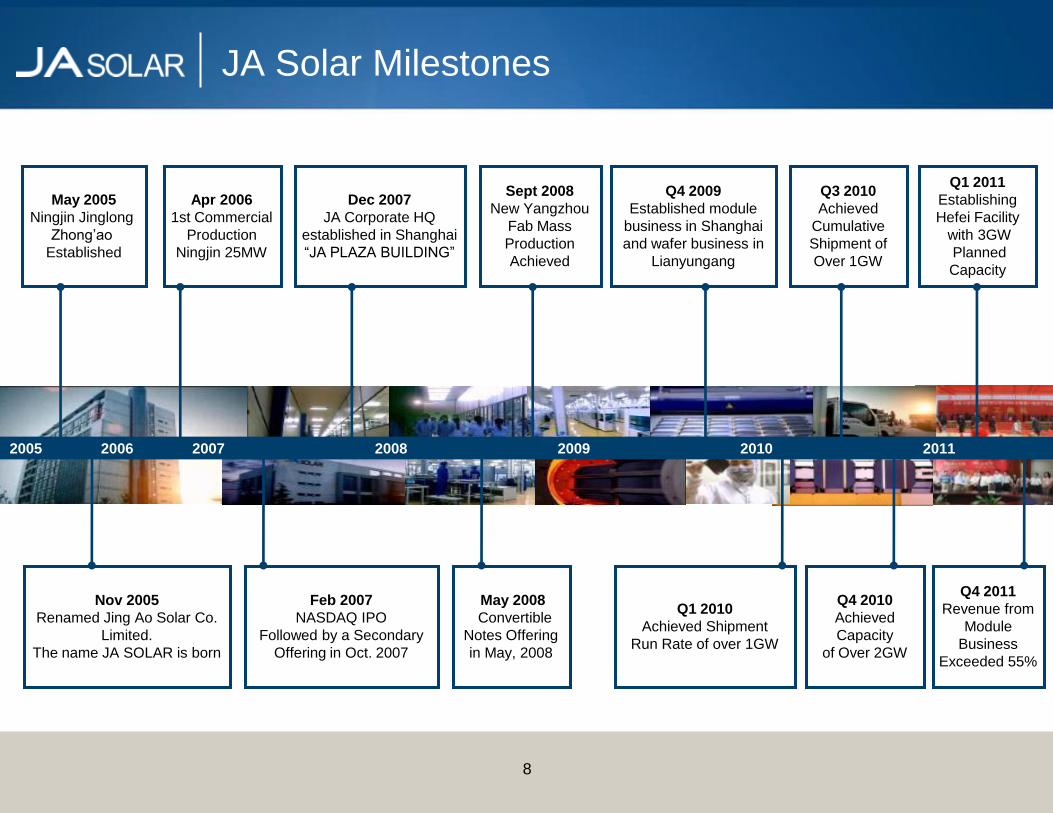
JA Solar Milestones
8
May 2005
Ningjin Jinglong
Zhong’ao
Established
Apr 2006
1st Commercial
Production
Ningjin 25MW
Dec 2007
JA Corporate HQ
established in Shanghai
“JA PLAZA BUILDING”
Sept 2008
New Yangzhou
Fab Mass
Production
Achieved
Q4 2009
Established module
business in Shanghai
and wafer business in
Lianyungang
Feb 2007
NASDAQ IPO
Followed by a Secondary
Offering in Oct. 2007
Nov 2005
Renamed Jing Ao Solar Co.
Limited.
The name JA SOLAR is born
Q1 2010
Achieved Shipment
Run Rate of over 1GW
Q3 2010
Achieved
Cumulative
Shipment of
Over 1GW
Q4 2010
Achieved
Capacity
of Over 2GW
Q1 2011
Establishing
Hefei Facility
with 3GW
Planned
Capacity
Q4 2011
Revenue from
Module
Business
Exceeded 55%
May 2008
Convertible
Notes Offering
in May, 2008
2005 2006 2007 2008 2009 2010 2011

9
Experienced Management Team
Former General Manager and Executive
VP of Lumeta, Inc.
Applied Materials: 20 years of leadership
roles in solar and semiconductor business
units
Min Cao
Chief Financial Officer
Baofang Jin
Executive Chairman
Dr. Peng Fang
Chief Executive Officer
Jian Xie
Chief Operating Officer
Vice President of IR &
BD
15 year semiconductor wafer
manufacturing experience.
National People's Congress, vice-chairman
of the Chinese People's Political
Consultative Conference of Ningjin County.
The Board Director of UCGEC and was the
chairman of the IEEE Electron Devices
Society.
Various technology and management
positions at Applied Materials and AMD in
the U.S.
Mr. Xie has served in such capacities as
the Company’s director of corporate
finance, director of investor relations,
assistant to the chief executive officer,
secretary of the board of directors and
vice president of Sales.
More than 20 years of management
experience in various Fortune 500
companies including IBM and Ashland Inc.
Held senior positions in professional firms
including Capgemini and BDO
Chairman of the
board of directors
and Chief Executive
Officer of Jinglong
Group, China’s
largest mono-
crystalline wafer
manufacturer.
Board Director and
Chief Executive Officer
of JA Solar.
Former president of
Huahong NEC. Winner
of the Shanghai
Magnolia Prize.
Board Director
and Chief
Operating
Officer of JA
Solar.
Board Director and
Chief Technology
Officer of JA Solar.
VP, Strategic
Development
Yong Liu
Chief Technology Officer
Bill Chen
VP, Strategic Development
Jonathan Pickering
President Americas
More than 15 years of operation
management experience at semiconductor
wafer and solar cell manufacturing facilities.
Former director of SMIC, responsible for
running three 12-inch wafer foundry fabs,
which were the most advanced wafer fabs
in China.
Vice president of
Jinglong
Group, and
managing director
of JL Capital
Mr. Cao has worked in the solar industry
since 2006, having previously spent over
a decade in the financial services sector.
CFO of JA Solar.
Vice President of
Company &
President of JA
Americas
Alden Lee
President Europe
Former sales director of SCHOTT
Solar
Former manager of Samsung
Former manager of Procter & Gamble
President of
Europe Region
Customer Base

2010
JA Solar’s Modules Markets
Continuous and strong growth in module shipment
Substantial Geographic & Customer Diversification
61%
2%
15%
23%
Europ Oceania North America Asia
2011
MW
0
50
100
150
200
250
300
350
400
450
500
270 278
342 356 349 319 324
218 226
2 32
76
107 102
82 121
180 140
Cell Shipment Module Shipment
Europe

12
Substantial Geographic & Customer Diversification
Working with leading project developers, EPC companies and global OEMs. Customers include Solar-Fabrik,
MEMC/SunEdison, JABIL, Moser Baer, LANCO, CPI, China Guodian, and leading European Tier-1 solar OEMs.
We have close relationships with customers in Germany, Italy, France, Korea, Japan, India, and the US.
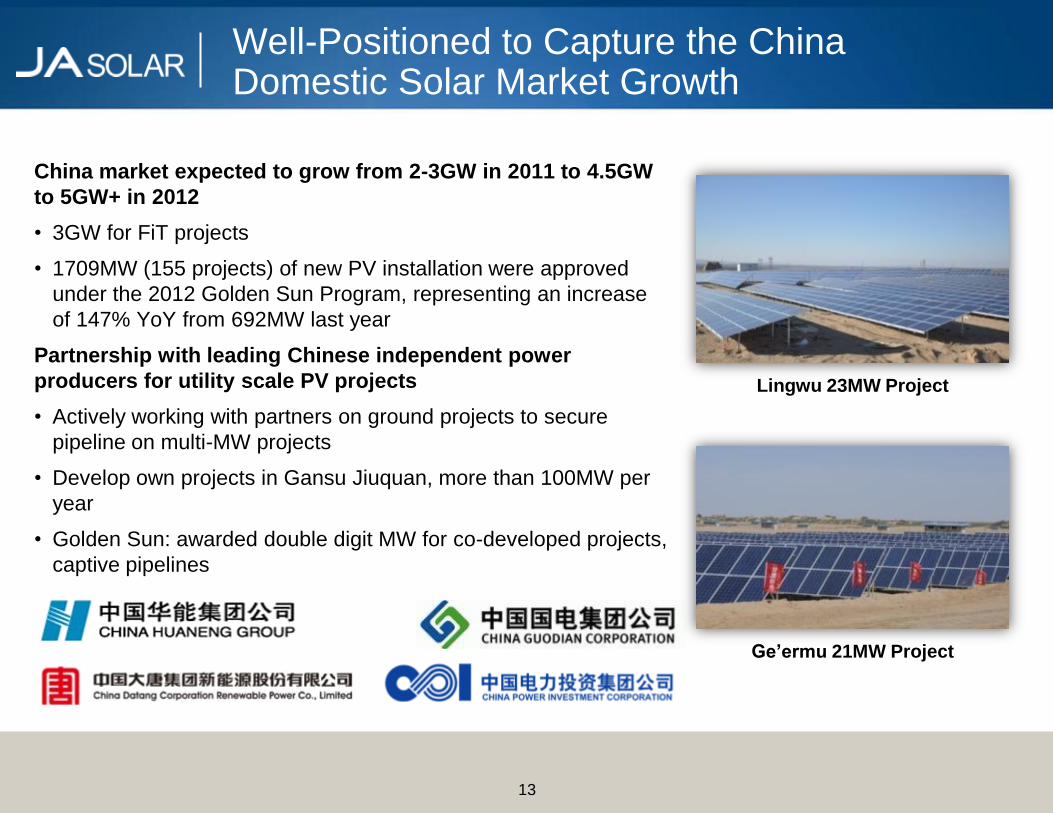
Well-Positioned to Capture the China Domestic Solar Market Growth
China market expected to grow from 2-3GW in 2011 to 4.5GW
to 5GW+ in 2012
• 3GW for FiT projects
• 1709MW (155 projects) of new PV installation were approved
under the 2012 Golden Sun Program, representing an increase
of 147% YoY from 692MW last year
Partnership with leading Chinese independent power
producers for utility scale PV projects
• Actively working with partners on ground projects to secure
pipeline on multi-MW projects
• Develop own projects in Gansu Jiuquan, more than 100MW per
year
• Golden Sun: awarded double digit MW for co-developed projects,
captive pipelines
13
Lingwu 23MW Project
Ge’ermu 21MW Project
Global Solar Market
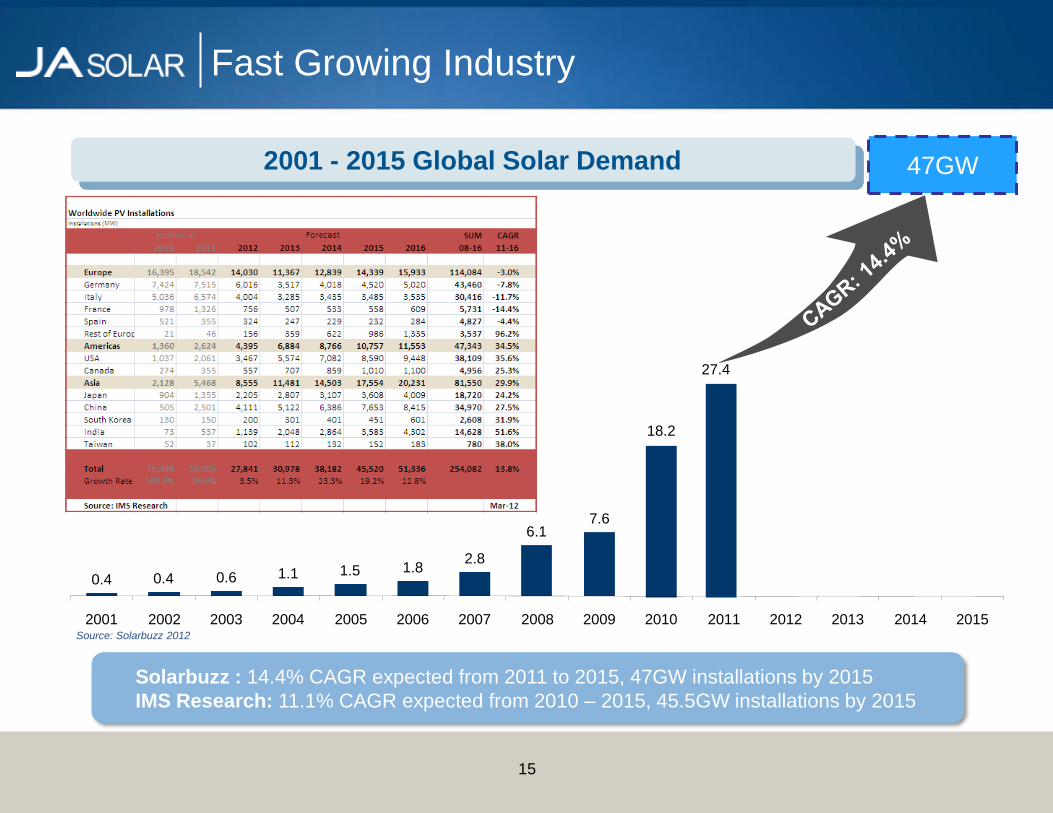
Source: Solarbuzz 2012
15
2001 - 2015 Global Solar Demand
Fast Growing Industry
0.4 0.4 0.6 1.1 1.5 1.8 2.8
6.1 7.6
18.2
2001 2002 2003 2004 2005 2006 2007 2008 2009 2010 2011 2012 2013 2014 2015
27.4
47GW
Solarbuzz : 14.4% CAGR expected from 2011 to 2015, 47GW installations by 2015
IMS Research: 11.1% CAGR expected from 2010 – 2015, 45.5GW installations by 2015
0
5
10
15
20
25
30
35
IMS Solarbuzz Average IMS Solarbuzz Average
others
India
USA
Japan
China
other Europe
Italy
Germany
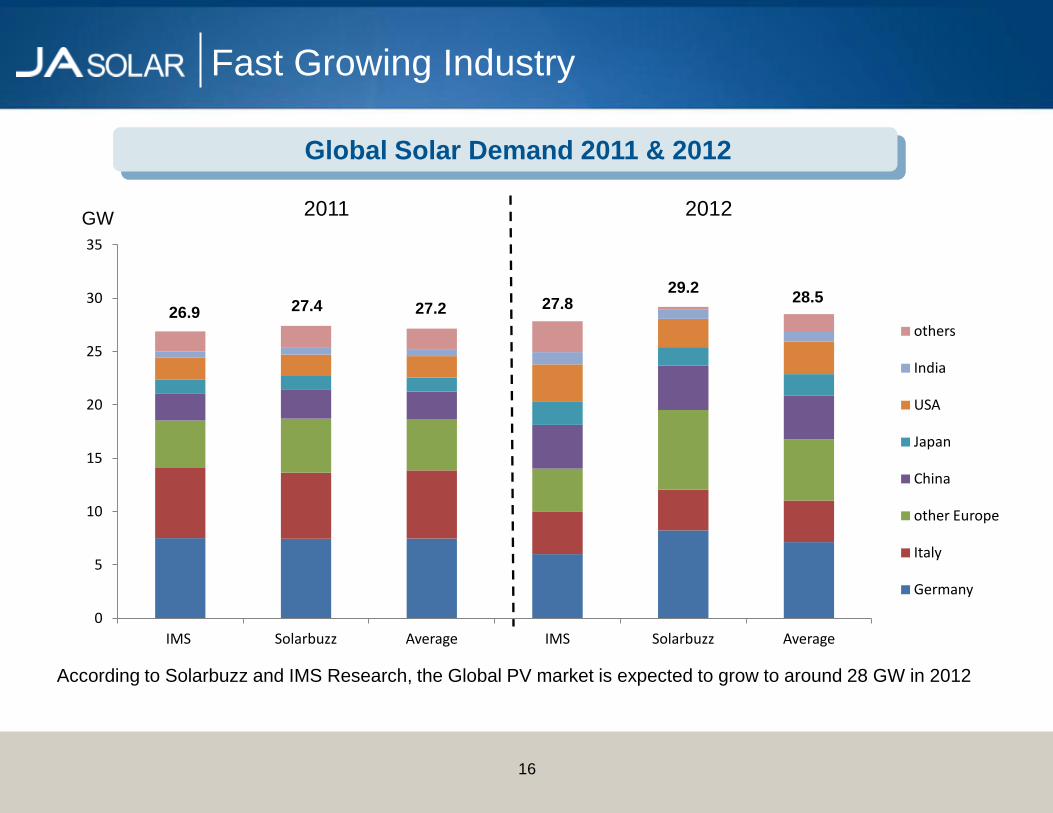
16
Global Solar Demand 2011 & 2012
Fast Growing Industry
According to Solarbuzz and IMS Research, the Global PV market is expected to grow to around 28 GW in 2012
26.9 27.4 28.5
27.2 27.8
2011 2012
29.2
GW
Manufacturing and Technology

Ningjin, Hebei province
1200MW capacity
Ningjin Cell Facility
Lianyungang, Jiangsu province
500MW capacity
Lianyungang Wafer Facility
Fengxian , Shanghai
1200MW capacity
Shanghai Module Facility
18
Yangzhou, Jiangsu province
1600MW capacity
State-of-the-art PV R&D Center
Yangzhou Cell Facility
Large Scale Operations
Hefei, Anhui province
3GW capacity planned by
2015
Hefei Solar Products Facility
Yanjiao, Hebei province
500MW capacity
Yanjiao Wafer Facility
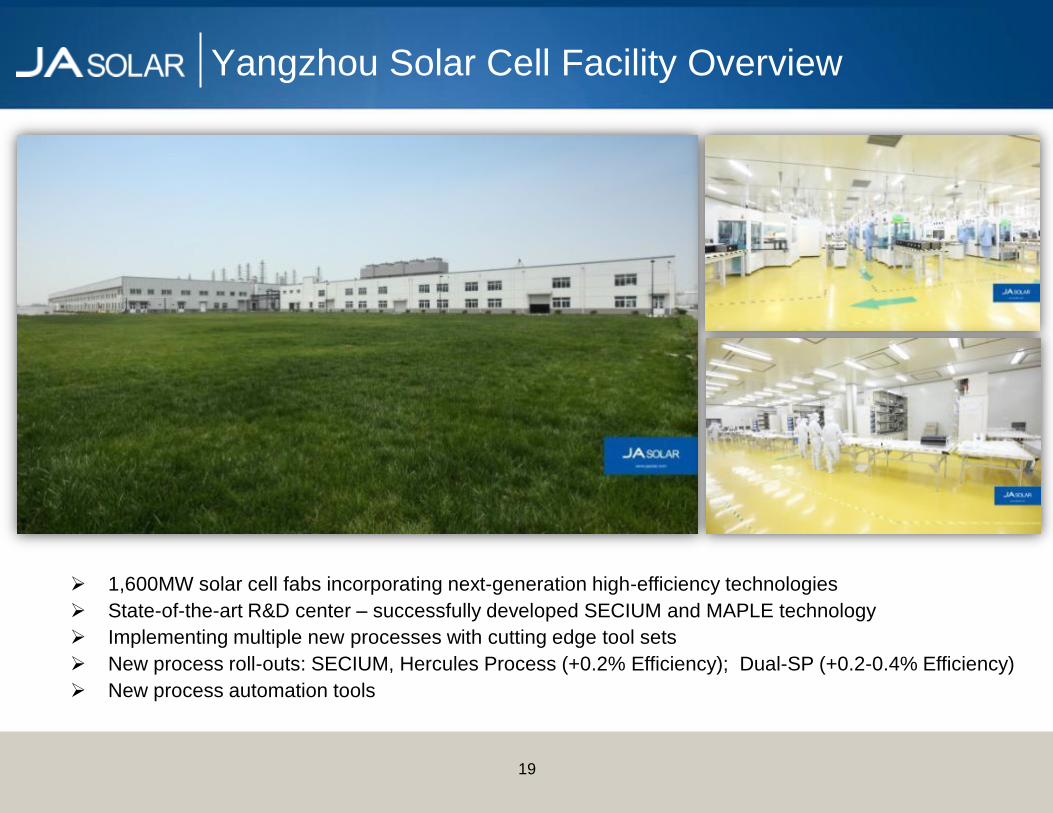
1,600MW solar cell fabs incorporating next-generation high-efficiency technologies
State-of-the-art R&D center – successfully developed SECIUM and MAPLE technology
Implementing multiple new processes with cutting edge tool sets
New process roll-outs: SECIUM, Hercules Process (+0.2% Efficiency); Dual-SP (+0.2-0.4% Efficiency)
New process automation tools
19
Yangzhou Solar Cell Facility Overview

The world’s largest solar product manufacturing site with planned 3 GW solar products capacity;
500MW module production has commenced operation in February 2012
State-of-the-art facility utilizing newest automated equipment & technology
Vertical integration model – potential upstream and downstream partnerships with leading
international solar companies
Advanced R&D development – technology leadership and clear roadmap to achieve 20%+
conversion efficiency
Hefei Planned 3GW Solar Products Facility
20

1200MW module capacity by the end of 2011
World-class quality system
High quality materials
Module reliability lab partnering with TÜV and Intertek
OEM manufacturing for leading global OEMs with demonstrated quality control and assurance
21
Fengxian(Shanghai) Module Facility Overview
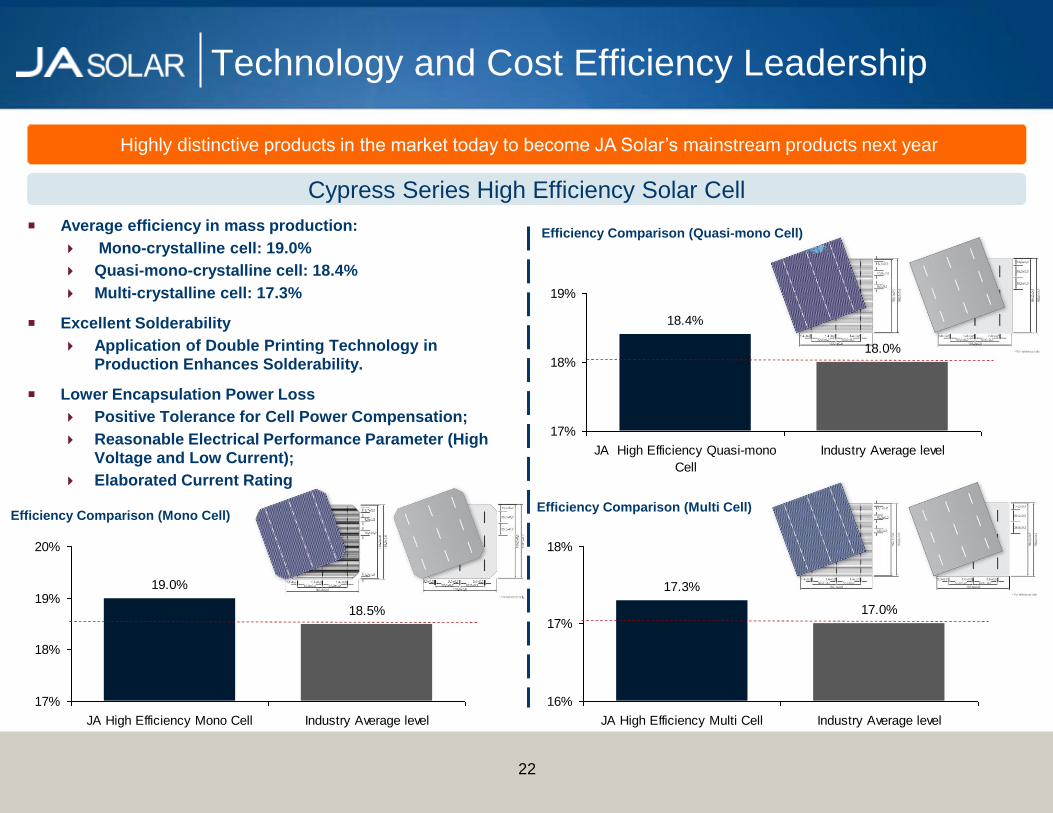
18.4%
18.0%
17%
18%
19%
JA High Efficiency Quasi-mono
Cell
Industry Average level
19.0%
18.5%
17%
18%
19%
20%
JA High Efficiency Mono Cell Industry Average level
17.3%
17.0%
16%
17%
18%
JA High Efficiency Multi Cell Industry Average level
22
Average efficiency in mass production:
Mono-crystalline cell: 19.0%
Quasi-mono-crystalline cell: 18.4%
Multi-crystalline cell: 17.3%
Excellent Solderability
Application of Double Printing Technology in Production Enhances Solderability.
Lower Encapsulation Power Loss
Positive Tolerance for Cell Power Compensation;
Reasonable Electrical Performance Parameter (High Voltage and Low Current);
Elaborated Current Rating
Cypress Series High Efficiency Solar Cell
Highly distinctive products in the market today to become JA Solar’s mainstream products next year
Technology and Cost Efficiency Leadership
Efficiency Comparison (Mono Cell)
Efficiency Comparison (Quasi-mono Cell)
Efficiency Comparison (Multi Cell)
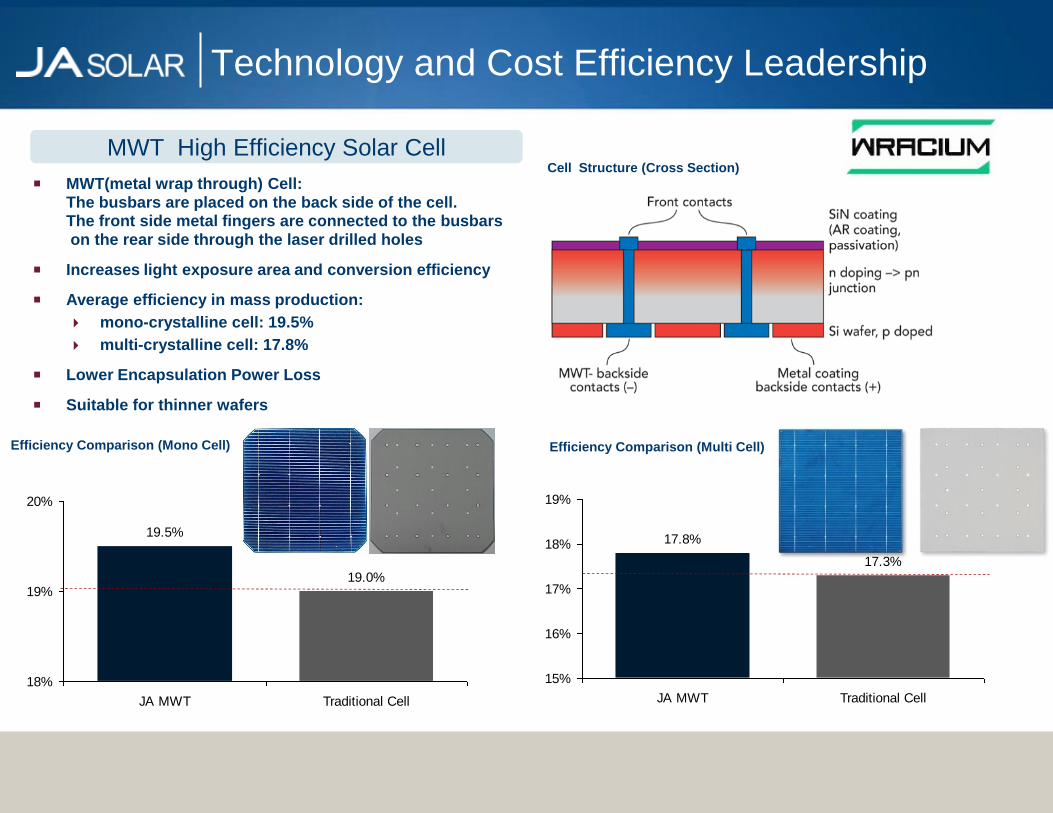
17.3%
17.8%
15%
16%
17%
18%
19%
JA MWT Traditional Cell
MWT High Efficiency Solar Cell
MWT(metal wrap through) Cell: The busbars are placed on the back side of the cell. The front side metal fingers are connected to the busbars on the rear side through the laser drilled holes
Increases light exposure area and conversion efficiency
Average efficiency in mass production:
mono-crystalline cell: 19.5%
multi-crystalline cell: 17.8%
Lower Encapsulation Power Loss
Suitable for thinner wafers
Efficiency Comparison (Mono Cell)
Technology and Cost Efficiency Leadership
19.0%
19.5%
18%
19%
20%
JA MWT Traditional Cell
Efficiency Comparison (Multi Cell)
Cell Structure (Cross Section)
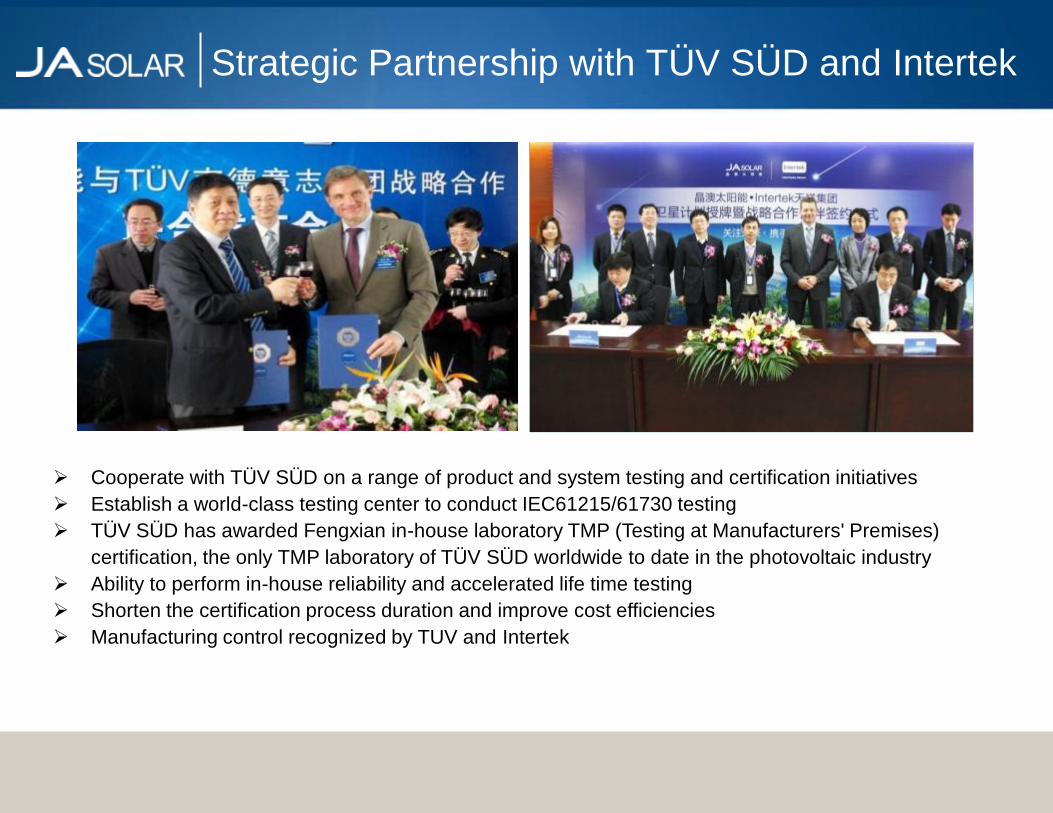
Strategic Partnership with TÜV SÜD and Intertek
Cooperate with TÜV SÜD on a range of product and system testing and certification initiatives
Establish a world-class testing center to conduct IEC61215/61730 testing
TÜV SÜD has awarded Fengxian in-house laboratory TMP (Testing at Manufacturers' Premises)
certification, the only TMP laboratory of TÜV SÜD worldwide to date in the photovoltaic industry
Ability to perform in-house reliability and accelerated life time testing
Shorten the certification process duration and improve cost efficiencies
Manufacturing control recognized by TUV and Intertek

Quality Reliability Assurance
Custom Quality
Management
RMA Return Material
Approval
CS Customer
Support
OQA Outgoing Quality
Assurance
Quality Control Center
SQM Supplier Quality
Management
IQC Incoming
Quality
Control
2nd
Source
IPQC In-Process
Quality Control
QA/Certification
QA Quality
System
DCC Document
Control
Product
Certification
Quality/Reliability
Lab
Reliability
Lab
FA Failure
Analysis
OQC Outgoing
Quality Control
25
World Class QA System Leveraging Semiconductor Experience
QA: Quality system control and ISO
quality system maintenance,
internal and external customer
audit
DCC: Document Control & EC Control
2nd Source: 2nd Source Guide, Overall
Management of the
Responsible Supplier(s)
IQC: Incoming Material
Inspection & Quality
Control
OQC: Shipping Inspection
IPQC: In-process Quality Control
CS: 1. Customer Complaint Handling
2. Coordinate various functions to
provide containment, corrective and
preventive actions to customer
3. Customer various functions to drive
quality improve activities to achieve
customer quality expectation
4. Contact windows with customer on
quality
RMA: Return Material Repair Center
RL: Reliability Analysis
FA: Failure Analysis &
Calibration
Management & MSA

Financial Performance

Shipment and Revenue
Revenue (US$ mn)
Shipment (MW)
177 231
272 311
418 463 451
401 445
398 366
2009Q3 2009Q4 2010Q1 2010Q2 2010Q3 2010Q4 2011Q1 2011Q2 2011Q3 2011Q4 2012Q1
193 238
279 351
541 584 556
413 388 309
254
2009Q3 2009Q4 2010Q1 2010Q2 2010Q3 2010Q4 2011Q1 2011Q2 2011Q3 2011Q4 2012Q1

Source: 2012Q1 Company Earning Releases
Stable and Sustainable Financial Condition
60% 61% 63% 72% 73% 76% 77% 82% 85% 90%
0%
20%
40%
60%
80%
100%
JASO HSOL TSL JKS SOL YGE CSIQ STP CSUN LDK
Debt to Asset Ratio
147% 156% 168% 251% 265% 313% 337%
445% 560%
882%
0%
200%
400%
600%
800%
1000%
JASO HSOL TSL JKS SOL YGE CSIQ STP CSUN LDK
Debt to Equity Ratio
496 466 388 380 366 343 318
249
161 80
-
100
200
300
400
500
600
YGE SOL STP TSL JASO CSIQ LDK JKS HSOL CSUN
Shipment (Wafer, Cell, Module)
The lowest debt ratio among China peers
Peer A Peer B Peer C Peer D Peer E Peer F Peer G Peer H Peer I
Peer A Peer B Peer C Peer D Peer E Peer F Peer G Peer H Peer I
Peer A Peer B Peer C Peer D Peer E Peer F Peer G Peer H Peer I
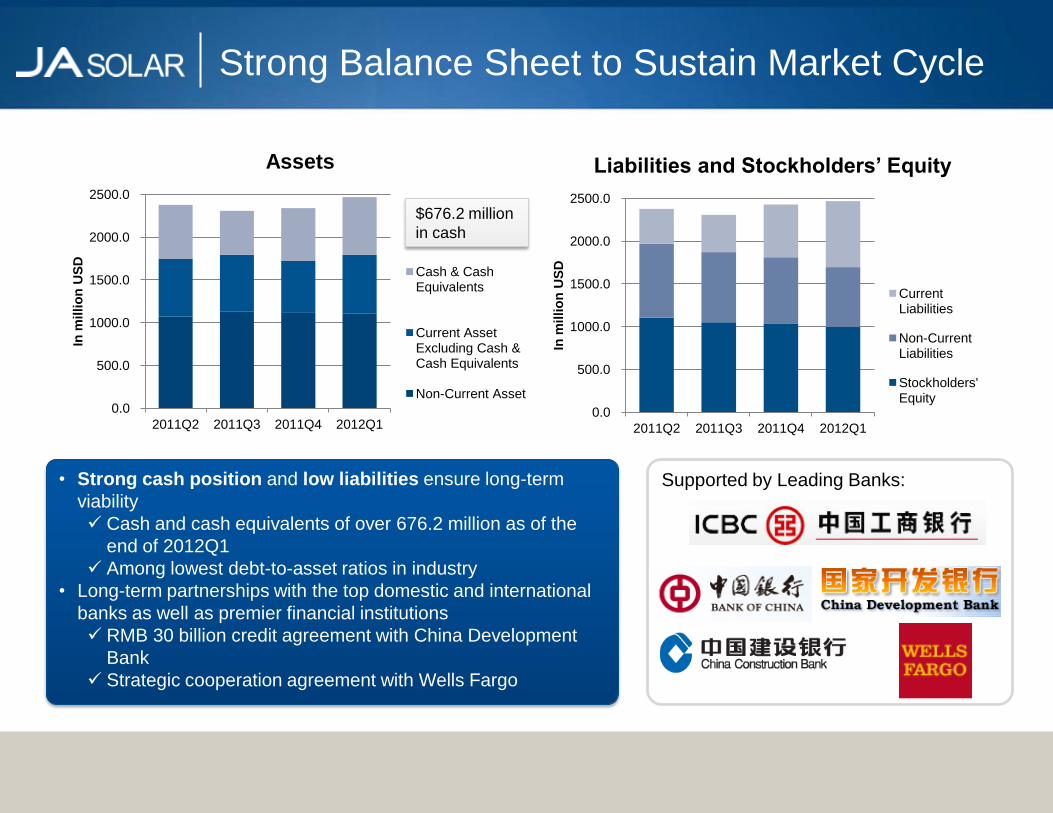
Strong Balance Sheet to Sustain Market Cycle
• Strong cash position and low liabilities ensure long-term
viability
Cash and cash equivalents of over 676.2 million as of the
end of 2012Q1
Among lowest debt-to-asset ratios in industry
• Long-term partnerships with the top domestic and international
banks as well as premier financial institutions
RMB 30 billion credit agreement with China Development
Bank
Strategic cooperation agreement with Wells Fargo
Supported by Leading Banks:
0.0
500.0
1000.0
1500.0
2000.0
2500.0
2011Q2 2011Q3 2011Q4 2012Q1
In m
illio
n U
SD
Liabilities and Stockholders’ Equity
Current Liabilities
Non-Current Liabilities
Stockholders' Equity
0.0
500.0
1000.0
1500.0
2000.0
2500.0
2011Q2 2011Q3 2011Q4 2012Q1
In m
illio
n U
SD
Assets
Cash & Cash Equivalents
Current Asset Excluding Cash & Cash Equivalents
Non-Current Asset
$676.2 million
in cash

Industry Leader with Stable Financial Position – Financial Times Deutschland
Financial Times Deutschland:
“Während die wenigsten Unternehmen im vergangenen Jahr eine hohe relative Marktperformance vorweisen konnten, verfügte jedoch zumindest die Hälfte über eine stabile Finanzkraft. Deutsche Vertreter dieser Gruppe sind Branchenprimus Solarworld sowie Aleo Solar, Payom Solar und die Solarfabrik. Aus den USA gehören First Solar und aus China Trina und JA Solar dazu.“
English translation:
“In the recent years, of the companies that performed relatively well, only few of them have a stable financial position. German representatives of this group are industry
leader SolarWorld, Aleo Solar, Payom Solar, and Solarfabrik. Other industry leaders with stable financial position are First Solar from the United States and Trina and JA Solar from China.”
- Die Solarbranche kann es noch schaffen, April 13, 2012. Financial Time Deutschland

Investment Thesis Summary
Growing customer base and geographic diversification
Strong management team with proven execution
Technology and cost leadership
Strong balance sheet for future growth
Clear R&D Roadmap to increase efficiency >20%
31

Thank you!