Embed Size (px)
Citation preview

The debate about which similarity measure one shoulduse for the normalization in the case of Author Co-citationAnalysis (ACA) is further complicated when one distin-guishes between the symmetrical co-citation—or, moregenerally, co-occurrence—matrix and the underlyingasymmetrical citation—occurrence—matrix. In the Webenvironment, the approach of retrieving original citationdata is often not feasible. In that case, one should use theJaccard index, but preferentially after adding the numberof total citations (i.e., occurrences) on the main diagonal.Unlike Salton’s cosine and the Pearson correlation, theJaccard index abstracts from the shape of the distribu-tions and focuses only on the intersection and the sum ofthe two sets. Since the correlations in the co-occurrencematrix may be spurious, this property of the Jaccard indexcan be considered as an advantage in this case.
Introduction
Ahlgren, Jarneving, and Rousseau (2003) argued thatone should consider using Salton’s cosine instead of thePearson correlation coefficient as a similarity measure inauthor co-citation analysis, and showed the effects of thischange on the basis of a dataset provided in Table 7 (p. 555)of their article. This led to discussions in previous issues ofthis journal about the pros and cons of using the Pearsoncorrelation or other measures (Ahlgren, Jarneving, &Rousseau, 2004; Bensman, 2004; Leydesdorff, 2005; White,2003, 2004). Leydesdorff and Vaughan (2006) used the samedataset to show why one should use the (asymmetrical)citation instead of the (symmetrical) co-citation matrix asthe basis for the normalization. They argued that not only thevalue but also the sign of the correlation may changebetween two cited authors when using the Pearson correlationin the symmetrical versus the asymmetrical case. For exam-ple in the dataset under study, Ahlgren et al. (2003, p. 556)
found a correlation of r � �0.74 between “Schubert” and“Van Raan” while Leydesdorff and Vaughan (p. 1620)reported that r � �0.131 (p � .05) using the underlyingcitation matrix.
One can download a set of documents in which the authorsunder investigation are potentially (co-)cited in the libraryenvironment, but this approach of retrieving original citationdata and then using Pearson’s r or Salton’s cosine to con-struct a similarity matrix often is not feasible in the Webenvironment. In this environment, the researcher may haveonly the index available and searches the database with aBoolean AND to construct a co-citation or, more generally,a co-occurrence matrix without first generating an occur-rence matrix. Should one in such cases also normalize usingthe cosine or the Pearson correlation coefficient or, perhaps,use still another measure?
I argue that in this case, one may prefer to use the Jaccardindex (Jaccard, 1901). The Jaccard index was elaborated byTanimoto (1957) for the nonbinary case. Thus, one can distin-guish between using the Jaccard index for the normalizationof the binary citation matrix and the Tanimoto index in thecase of the nonbinary co-citation matrix. The results willbe compared using Salton’s cosine (Salton & McGill, 1983),the Pearson correlation, and the probabilistic activity index(Zitt, Bassecoulard, & Okubo, 2000) in the case of both thesymmetrical co-citation and the asymmetrical citation matrix.
The argument is illustrated with an analysis using thesame data as in Ahlgren et al. (2003). This dataset (providedin Table 1) is extremely structured: It contains exclusivelypositive correlations within both groups and negative corre-lations between the two groups. The two groups are thuscompletely separated in terms of the Pearson correlationcoefficients; however, there are relations between individualauthors in the two groups. An optimal representation shouldreflect both this complete separation in terms of correlationsat the level of the set and the weak overlap generated byindividual relations (Leydesdorff, 2005, 2007; Waltman &van Eck, 2007). (A visualization of the co-citation matrix
JOURNAL OF THE AMERICAN SOCIETY FOR INFORMATION SCIENCE AND TECHNOLOGY, 59(1):77–85, 2008
On the Normalization and Visualization of Author Co-Citation Data: Salton’s Cosine versus the Jaccard Index
Loet LeydesdorffAmsterdam School of Communications Research (ASCoR), Kloveniersburgwal 48, 1012 CX Amsterdam, The Netherlands. E-mail: [email protected], http://www.leydesdorff.net
Received January 21, 2007; revised April 17, 2007; accepted April 17, 2007
© 2007 Wiley Periodicals, Inc. • Published online 26 October 2007 in Wiley InterScience (www.interscience.wiley.com). DOI: 10.1002/asi.20732

TAB
LE
1.
Aut
hor
co-c
itatio
n m
atri
x of
24
info
rmat
ion
scie
ntis
ts (
Tabl
e 7
of A
hlgr
en e
t al.,
200
3, a
t p. 5
55; m
ain
diag
onal
val
ues
adde
d).
Bra
un50
2919
198
135
97
72
00
00
00
00
0Sc
hube
rt29
6030
1810
205
55
142
10
00
00
00
0G
lanz
el19
3053
1610
229
149
115
30
00
00
00
0M
oed
1918
1655
1120
517
1412
64
00
00
00
00
Ned
erho
f8
1010
1131
128
137
44
20
00
00
00
0N
arin
1320
2220
1264
1120
2120
119
00
11
00
11
Tijs
sen
55
95
811
2213
105
61
01
21
00
01
Van
Raa
n9
514
1713
2013
5013
1211
60
12
10
00
1L
eyde
sdor
ff7
59
147
2110
1346
1814
91
01
10
00
2Pr
ice
714
1112
420
512
1854
109
11
11
00
20
Cal
lon
22
56
411
612
1410
264
00
11
00
01
Cro
nin
01
34
29
16
99
424
10
00
00
01
Coo
per
00
00
00
00
11
01
3014
511
58
62
Van
rijs
berg
en0
00
00
01
10
10
014
307
155
135
3C
roft
00
00
01
22
11
10
57
189
67
86
Rob
erts
on0
00
00
11
11
11
111
159
367
1211
10B
lair
00
00
00
00
00
00
55
67
189
42
Har
man
00
00
00
00
00
00
813
712
931
95
Bel
kin
00
00
01
00
02
00
65
811
49
369
Spin
k0
00
00
11
12
01
12
36
102
59
21Fi
del
00
00
00
00
01
00
01
28
25
911
Mar
chio
nini
00
00
00
00
00
01
00
15
23
107
Kuh
lthau
00
00
00
00
01
01
11
24
01
145
Der
vin
00
00
00
00
02
01
11
24
01
104
118
139
148
142
8918
383
139
132
132
7854
5668
6310
242
7398
71
00
00
118
00
00
139
00
00
148
00
00
142
00
00
890
00
018
30
00
083
00
00
138
00
00
132
10
12
132
00
00
790
11
153
00
11
561
01
168
21
22
638
54
410
32
20
042
53
11
739
1014
1098
117
54
7123
119
665
1124
105
559
1026
1463
65
1420
5165
5563
512,
244

JOURNAL OF THE AMERICAN SOCIETY FOR INFORMATION SCIENCE AND TECHNOLOGY—January 1, 2008 79DOI: 10.1002/asi
before normalization is provided in Figure 13 by Leydesdorff& Vaughan, 2006, p. 1625.)
In summary, two problems have to be distinguished: theproblem of normalization and the type of matrix to benormalized. In principle, one can normalize both symmetri-cal and asymmetrical matrices with the various measures.Ahlgren et al. (2003) provided arguments for using thecosine instead of the Pearson correlation coefficient, particu-larly if one aims at visualization of the structure as in thecase of social network analysis or multidimensional scaling(MDS). Bensman (2004) provided arguments regarding whyone might nevertheless prefer the Pearson correlation coeffi-cient when the purpose of the study is a statistical (e.g., mul-tivariate) analysis. The advantage of the cosine being not astatistic but a similarity measure then disappears. Formally,these two measures are equivalent, with the exception thatPearson normalizes for the arithmetic mean while the cosinedoes not use this mean as a parameter (Jones & Furnas,1987). The cosine normalizes for the geometrical mean. Thequestion remains which normalization one should use whenone has only co-occurrence data available.
The Jaccard Index
In his original article introducing co-citation analysis,Small (1973) suggested the following solution to the nor-malization problem in Footnote 6:
We can also give a more formal definition of co-citation interms of set theory notation. If A is the set of papers whichcites document a and B is the set which cites b, then A�B,that is n(A�B), is the co-citation frequency. The relative co-citation frequency could be defined as n(A�B) � n(A�B).(p. 269)
This proposal for the normalization corresponds with usingthe Jaccard index or its extension (for the nonbinary case) into the Tanimoto index. The index is defined for a pair ofvectors, Xm and Xn, as the size of the intersection divided bythe size of the union of the sample sets, or in numerical terms:
where Xij � XiXj. The value of Smn ranges from 0 to 1(Lipkus, 1999; cf. Salton & McGill, 1983, p. 203f).
In a number of studies (e.g., Egghe & Rousseau, 1990;Glänzel, 2001; Hamers et al., 1989; Leydesdorff & Zaal,1988; Luukkonen, Tijssen, Persson, & Sivertsen, 1993;Michelet, 1988; Wagner & Leydesdorff, 2005), the Jaccardindex and the cosine have systematically been compared forco-occurrence data, but this debate has remained inconclu-sive. Using coauthorship data, for example, Luukkonen et al.(1993) argued that “the Jaccard measure is preferable toSalton’s measure since the latter underestimates the collabo-ration of smaller countries with larger countries; . . .” (p. 23).Wagner and Leydesdorff (2005) argued that “whereas
Smn �Xmn
Xmm � Xnn � Xmn
the Jaccard index focuses on strong links in segments of thedatabase the Salton Index organizes the relations geometri-cally so that they can be visualized as structural patterns ofrelations” (p. 208).
In many cases, one can expect the Jaccard and the cosinemeasures to be monotonic to each other (Schneider & Borlund,2007); however, the cosine metric measures the similaritybetween two vectors (by using the angle between them)whereas the Jaccard index focuses only on the relative sizeof the intersection between the two sets when compared totheir union. Furthermore, one can normalize differently usingthe margin totals in the asymmetrical occurrence or the sym-metrical co-occurrence matrix. Luukkonen et al. (1993, p. 18), for example, summed the co-occurrences in their set(of 30 countries) for obtaining the denominator whileSmall’s (1973) above definition of a relative co-citation fre-quency suggested using the sum of the total number of occurrences as the denominator. White and Griffith (1981, p. 165) also proposed using “total citations” as values for themain diagonal, but these authors decided not to use this nor-malization for empirical reasons.
Table 1 illustrates the two options by providing data forthe set under study and adding the total number of citationsas the main diagonal and the total number of co-citations asmargin totals. For example, using the margin totals for Schubert and Van Raan, respectively, the Tanimoto index is5/(139 � 132 � 5) � 0.019, while the Jaccard index basedon the citations is 5/(60 � 50 � 5) � 0.048. Note that the co-occurrence matrix itself no longer informs us about the num-ber of cited documents. The co-occurrence matrix containsless information than the occurrence matrix.1 However, thetotal number of citations can be added by the researcher onthe main diagonal. One also could consider this value as thesearch result for the co-citation of “Schubert AND Schu-bert,” and so on.
Note that the value added on the main diagonal of the co-citation matrix corresponds to the margin total of the asym-metrical matrix (i.e., the total number of citations). There-fore, a normalization of the symmetrical matrix using thesevalues on the main diagonal precisely corresponds with usingthe Jaccard normalization of the asymmetrical occurrencematrix. Hereafter, I distinguish between the two normaliza-tions in terms of the symmetrical and the asymmetricalmatrix, respectively. In the latter case, I use the values on themain diagonal; in the former, the margin totals.
Recall that the Jaccard index does not take the shape ofthe distributions in account, but only normalizes the inter-section of two sets with reference to the sum of the two sets.
1Two symmetrical matrices can be derived from one asymmetricalmatrix. Borgatti, Everett, and Freeman (2002) formulated this (in the refer-ence guide of UCINet) as follows: “Given an incidence matrix A where therows represent actors and the columns events, then the matrix AA� gives thenumber of events in which actors simultaneously attended. Hence AA�(i,j)is the number of events attended by both actor i and actor j. The matrix A�Agives the number of events simultaneously attended by a pair of actors.Hence A�A(i,j) is the number of actors who attended both event i andevent j” (p. 41).

80 JOURNAL OF THE AMERICAN SOCIETY FOR INFORMATION SCIENCE AND TECHNOLOGY—January 1, 2008DOI: 10.1002/asi
TAB
LE
2.
Spea
rman
cor
rela
tions
am
ong
the
low
er tr
iang
les
of s
imila
rity
mat
rice
s us
ing
diff
eren
t cri
teri
a, a
nd b
oth
asym
met
rica
l cita
tion
and
sym
met
rica
l co-
cita
tion
data
for
24
auth
ors
in b
oth
scie
ntom
etri
cs a
nd in
form
atio
n re
trie
val.
Pear
son
asym
m.
Cos
ine
asym
m.
Jacc
ard
asym
m.
Pear
son
sym
m.
Cos
ine
sym
m.
Tani
mot
o sy
mm
.PA
I sy
mm
.
Spea
rman
’s r
Pear
son
Cor
rela
tion
coef
ficie
nt1.
000
.910
**.9
09**
.828
**.8
18**
.904
**.9
10**
asym
met
rica
lSi
g. (
2-ta
iled)
.000
.000
.000
.000
.000
.000
.000
N27
627
627
627
627
627
627
6C
osin
e C
orre
latio
n co
effic
ient
.910
**1.
000
1.00
0**
.834
**.8
57**
.998
**.9
83**
asym
met
rica
lSi
g. (
2-ta
iled)
.000
.000
.000
.000
.000
.000
.000
N27
627
627
627
627
627
627
6Ja
ccar
d C
orre
latio
n co
effic
ient
.909
**1.
000*
*1.
000
.834
**.8
56**
.998
**.9
83**
asym
met
rica
lSi
g. (
2-ta
iled)
.000
.000
.000
.000
.000
.000
.000
N27
627
627
627
627
627
627
6Pe
arso
n C
orre
latio
n co
effic
ient
.828
**.8
34**
.834
**1.
000
.818
**.8
37**
.823
**sy
mm
etri
cal
Sig.
(2-
taile
d).0
00.0
00.0
00.0
00.0
00.0
00.0
00N
276
276
276
276
276
276
276
Cos
ine
Cor
rela
tion
coef
ficie
nt.8
18**
.857
**.8
56**
.818
**1.
000
.856
**.8
48**
sym
met
rica
lSi
g. (
2-ta
iled)
.000
.000
.000
.000
.000
.000
.000
N27
627
627
627
627
627
627
6Ta
nim
oto
Cor
rela
tion
coef
ficie
nt.9
04**
.998
**.9
98**
.837
**.8
56**
1.00
0.9
84**
sym
met
rica
lSi
g. (
2-ta
iled)
.000
.000
.000
.000
.000
.000
.000
N27
627
627
627
627
627
627
6PA
IC
orre
latio
n co
effic
ient
.910
**.9
83**
.983
**.8
23**
.848
**.9
84**
1.00
0sy
mm
etri
cal
Sig.
(2-
taile
d).0
00.0
00.0
00.0
00.0
00.0
00.0
00N
276
276
276
276
276
276
276
**C
orre
latio
n is
sig
nific
ant a
t the
.01
leve
l (tw
o-ta
iled)
.
In other words, the cell values are independently evaluatedin relation to margin totals and not in relation to other cellsin the respective rows and columns of the matrix. This in-sensitivity to the shape of the distributions can be consid-ered as both an advantage and a disadvantage. In the case of the asymmetrical matrix, the Jaccard index does not exploit the full information contained in the matrix. Thiscan be considered a disadvantage. Both the cosine and thePearson correlation matrix fully exploit this information. Inthe case of the symmetrical matrix, however, one alreadyhas lost the information about the underlying distributionsin the asymmetrical matrix. Import of the margin totalsfrom the asymmetrical matrix as a value on the main diago-nal then adds to the information contained in the symme-trical matrix.
The Jaccard index has this focus on cell values instead ofdistributions in common with the probabilistic activity index(PAI), which is the preferred measure of Zitt et al. (2000). ThePAI is the (traditional) ratio between observed and expectedvalues in a contingency table based on probability calculus:
PAI � pij / (pi * pj)
� nij * �i �j nij � �i nij * �j nij
Like the Jaccard and Tanimoto index, this index can be appliedon the lower triangles of symmetrical co-occurrence matriceswhile the Pearson coefficient and the cosine are based on full
vectors and thus use the information contained in a symmetri-cal matrix twice (Hamers et al., 1989).2
Results
Table 2 provides the Spearman rank-order correlationsamong the lower triangles of the various similarity matricesunder discussion. Spearman’s r is used instead of Pearson’s rbecause objects in proximity matrices are based on dyadicrelationships (Kenny, Kashy, & Cook, 2006); the assump-tion of independence required for parametric significancetests is violated (Schneider & Borlund, 2007).
The perfect rank-order correlation (r � 1.00; p � .01)between the cosine matrix derived from the asymmetricalcitation matrix, and the Jaccard index based on this same
JOURNAL OF THE AMERICAN SOCIETY FOR INFORMATION SCIENCE AND TECHNOLOGY—January 1, 2008 81DOI: 10.1002/asi
2Leydesdorff (2005) discussed the advantages of using informationmeasures for the precise calculation of distances using the same co-occur-rence data. Information theory also is based on probability calculus (cf. VanRijsbergen, 1977). The information measure generates an asymmetrical ma-trix based on a symmetrical co-occurrence matrix because the distance fromA to B can be different from the distance between B and A. The measurethus generates a directed graph while the measures under discussion heregenerate undirected graphs. Directed graphs can be visualized using WaldoTobler’s Flow Mapper, available at http://www.csiss.org/clearinghouse/FlowMapper/
3Pajek is a software package for social network analysis and visualiza-tion which is freely available for academic usage at http://vlado.fmf.uni-lj.si/pub/networks/pajek/
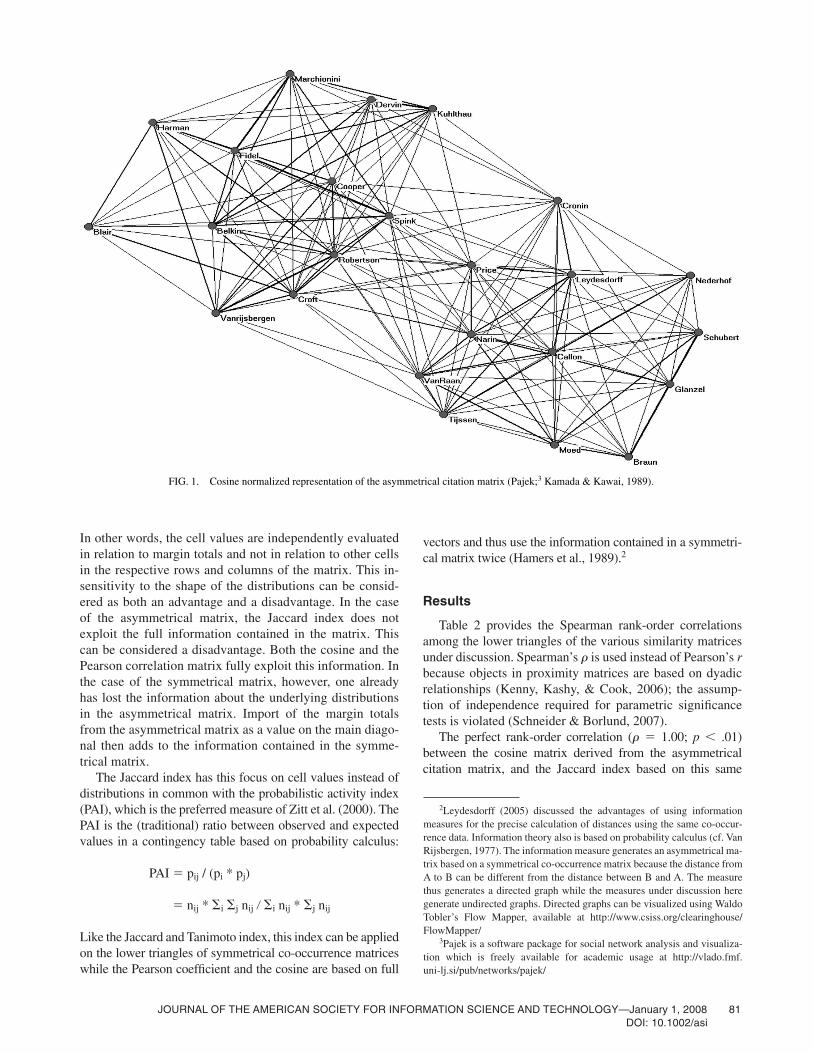
FIG. 1. Cosine normalized representation of the asymmetrical citation matrix (Pajek;3 Kamada & Kawai, 1989).

82 JOURNAL OF THE AMERICAN SOCIETY FOR INFORMATION SCIENCE AND TECHNOLOGY—January 1, 2008DOI: 10.1002/asi
FIG. 3. Relation between the Jaccard index and Salton’s cosine in the case of the asymmetrical citation matrix: [N � (24 * 23)/2 � 276].
FIG. 2. Jaccard-index-based representation of the co-citation matrix using total citations for the normalization (Pajek;3 Kamada & Kawai, 1989)

JOURNAL OF THE AMERICAN SOCIETY FOR INFORMATION SCIENCE AND TECHNOLOGY—January 1, 2008 83DOI: 10.1002/asi
TAB
LE
3.
Spea
rman
cor
rela
tions
am
ong
the
low
er tr
iang
les
of s
imila
rity
mat
rice
s us
ing
diff
eren
t cri
teri
a, a
nd b
oth
asym
met
rica
l cita
tion
and
sym
met
rica
l co-
cita
tion
data
for
the
subg
roup
of
12sc
ient
omet
rici
ans.
Pear
son
asym
m.
Cos
ine
asym
m.
Jacc
ard
asym
m.
Pear
son
sym
m.
Cos
ine
sym
m.
Tani
mot
o sy
mm
.PA
I sy
mm
.
Spea
rman
’s r
Pear
son
asym
met
rica
lC
orre
latio
n co
effic
ient
1.00
0.8
62**
.838
**�
.042
.253
*.7
66**
.912
**Si
g. (
2-ta
iled)
.000
.000
.000
.736
.040
.000
.000
N66
6666
6666
6666
Cos
ine
asym
met
rica
lC
orre
latio
n co
effic
ient
.862
**1.
000
.995
**�
.268
*.1
14.9
66**
.857
**Si
g. (
2-ta
iled)
.000
.000
.000
.029
.360
.000
.000
N66
6666
6666
6666
Jacc
ard
asym
met
rica
lC
orre
latio
n co
effic
ient
.838
**.9
95**
1.00
0�
.273
*.1
09.9
74**
.842
**Si
g. (
2-ta
iled)
.000
.000
.000
.027
.382
.000
.000
N66
6666
6666
6666
Pear
son
sym
met
rica
lC
orre
latio
n co
effic
ient
�.0
42�
.268
*�
.273
*1.
000
.682
**�
.256
*�
.005
Sig.
(2-
taile
d).7
36.0
29.0
27.0
00.0
00.0
38.9
66N
6666
6666
6666
66C
osin
e sy
mm
etri
cal
Cor
rela
tion
coef
ficie
nt.2
53*
.114
.109
.682
**1.
000
.069
.190
Sig.
(2-
taile
d).0
40.3
60.3
82.0
00.0
00.5
82.1
27N
6666
6666
6666
66Ta
nim
oto
sym
met
rica
lC
orre
latio
n co
effic
ient
.766
**.9
66**
.974
**�
.256
*.0
691.
000
.837
**Si
g. (
2-ta
iled)
.000
.000
.000
.038
.582
.000
.000
N66
6666
6666
6666
PAI
sym
met
rica
lC
orre
latio
n co
effic
ient
.912
**.8
57**
.842
**�
.005
.190
.837
**1.
000
Sig.
(2-
taile
d).0
00.0
00.0
00.9
66.1
27.0
00.0
00N
6666
6666
6666
66
*Cor
rela
tion
is s
igni
fican
t at t
he .0
5 le
vel (
two-
taile
d). *
*Cor
rela
tion
is s
igni
fican
t at t
he .0
1 le
vel (
two-
taile
d).

84 JOURNAL OF THE AMERICAN SOCIETY FOR INFORMATION SCIENCE AND TECHNOLOGY—January 1, 2008DOI: 10.1002/asi
matrix, supports the analytical conclusions given earlier aboutthe expected monotonicity between these two measures(Schneider & Borlund, 2007). There are, however, some dif-ferences in the values which matter for the visualization. Figures 1 and 2 provide visualizations using these two matri-ces of similarity coefficients, respectively.
The cosine remains the best measure for the visualiza-tion of the vector space because this measure is defined ingeometrical terms. Although the Spearman correlation ofthe cosine-normalized matrix with the Jaccard index of thissame matrix is unity, Figure 2 does not provide the finestructure within the clusters to the same extent as doesFigure 1. Figure 3 shows that the Jaccard index covers asmaller range than does the cosine (Hamers et al., 1989).The smaller variance (0.08 vs. 0.21 for the cosine-basedmatrix) may further limit the dissolvent capacity of themeasure in visualizations.
In both cases, the analyst can emphasize the separationbetween the two groups by introducing a threshold. In thecase of the Jaccard index, the amount of detail in the relationsbetween the two groups is then lower than that in the case ofthe cosine-normalized matrix. For example, only the two co-citation relations between “Tijssen” and “Croft” pass a0.05 threshold for the Jaccard index because both theseauthors have relatively low values on the main diagonal andtherefore in the denominator of the equation while severalother co-citation relations (e.g., the relative intermediatepositions of “Price” and “Van Raan”) remain visible in thecase of the cosine normalization and a cosine 0.05.
The rank-order correlations of both these lower triangleswith the Tanimoto index of the symmetrical matrix also arenear unity (r � 0.998). All correlations with the probabilis-tic affinity index are slightly lower (r � 0.99). The correla-tions between using the Pearson correlation or the cosine onthe asymmetrical and symmetrical matrices, respectively,are below 0.90. Despite the relatively small differencesamong the lower triangles, the visualizations (not shownhere) are different.
In summary, the cosine-normalized asymmetrical occur-rence matrix provides us with the best visualization of the underlying structure. When one is not able to generate anoccurrence matrix, the Jaccard index using the values of thetotal number of citations on the main diagonal for the nor-malization is the second-best alternative. Table 3 reportsthe results of using the 12 scientometricians as a subset. Theresults confirm that the Jaccard index normalized this wayleads to results very similar (r 0.99; p � 0.01; boldfacedin Table 3) to those of the cosine-normalized occurrence matrix.
Conclusions
Leydesdorff and Vaughan (2006) provided reasons forusing the asymmetrical matrix underlying the co-occurrencematrix as a basis for multivariate analysis (e.g., MDS,clustering, factor analysis). For the purposes of visualiza-tion, the cosine is the preferred measure for the reasons
given by Ahlgren et al. (2003); for other statistical analyses,one may prefer to normalize using the Pearson correlationcoefficient (Bensman, 2004) or Euclidean distances (in thecase of MDS).
If the only option is to generate a co-occurrence matrix,as is often the case in webometric research, the Jaccardindex is the best basis for the normalization because thismeasure does not take the distributions along the respectivevectors into account. Like the Jaccard index, the PAI focusesonly on the strength of the co-occurrence relation. If avail-able, however, the frequencies of the occurrences which areconventionally placed on the main diagonal can be expectedto improve the normalization. In the empirical examples,this Jaccard index was as good a measure as the cosine-normalized citation matrices. Remember that the researchquestion concerned which similarity measure to use whenthe occurrence matrix cannot be retrieved.
Which of the two options for the normalization of theJaccard index will be preferable in a given project dependson the research question and the availability of the data.However, one should be very cautious in using the symmet-rical matrix as input to further statistical analysis because ofthe change of the size and potentially the sign of the correla-tion when multiplying the citation matrix with its trans-posed. Using the Jaccard index with the diagonal value basedon the margin totals of the asymmetrical matrix circumventsthis problem.
Acknowledgment
I am grateful to Liwen Vaughan and three anonymous ref-erees for comments on previous drafts of this article.
References
Ahlgren, P., Jarneving, B., & Rousseau, R. (2003). Requirement for a coci-tation similarity measure, with special reference to Pearson’s correlationcoefficient. Journal of the American Society for Information Science andTechnology, 54(6), 550–560.
Ahlgren, P., Jarneving, B., & Rousseau, R. (2004). Author cocitation andPearson’s r. Journal of the American Society for Information Scienceand Technology, 55(9), 843.
Bensman, S.J. (2004). Pearson’s r and author cocitation analysis: A com-mentary on the controversy. Journal of the American Society for Infor-mation Science and Technology, 55(10), 935–936.
Borgatti, S.P., Everett, M.G., & Freeman, L.C. (2002). UCINet for Windows:Software for Social Network Analysis. Cambridge, MA: Analytic Tech-nologies.
Egghe, L., & Rousseau, R. (1990). Introduction to informetrics. Amsterdam:Elsevier.
Glänzel, W. (2001). National characteristics in international scientific co-authorship relations. Scientometrics, 51, 69–115.
Hamers, L., Hemeryck, Y., Herweyers, G., Janssen, M., Keters, H., &Rousseau, R. (1989). Similarity measures in scientometric research: TheJaccard index versus Salton’s cosine formula. Information Processing &Management, 25(3), 315–318.
Jaccard, P. (1901). Distribution de la flore alpine dans le Bassin des Drouceset dans quelques regions voisines. Bulletin de la Société Vaudoise desSciences Naturelles, 37(140), 241–272.
Jones, W.P., & Furnas, G.W. (1987). Pictures of relevance: A geometricanalysis of similarity measures. Journal of the American Society forInformation Science, 36(6), 420–442.

JOURNAL OF THE AMERICAN SOCIETY FOR INFORMATION SCIENCE AND TECHNOLOGY—January 1, 2008 85DOI: 10.1002/asi
Kamada, T., & Kawai, S. (1989). An algorithm for drawing general undi-rected graphs. Information Processing Letters, 31(1), 7–15.
Kenny, D.A., Kashy, D.A., & Cook, W.L. (2006). Dyadic data analysis.New York: Guilford Press.
Leydesdorff, L. (2005). Similarity measures, author cocitation analysis, andinformation theory. Journal of the American Society for InformationScience and Technology, 56(7), 769–772.
Leydesdorff, L. (2007). Should Co-occurrence Data be Normalized? ARejoinder. Journal of the American Society for Information Science andTechnology.
Leydesdorff, L., & Vaughan, L. (2006). Co-occurrence matrices and theirapplications in information science: Extending ACA to the Web environ-ment. Journal of the American Society for Information Science and Tech-nology, 57(12), 1616–1628.
Leydesdorff, L., & Zaal, R. (1988). Co-words and citations. Relationsbetween document sets and environments. In L. Egghe & R. Rousseau(Eds.), Informetrics 87/88 (pp. 105–119). Amsterdam: Elsevier.
Lipkus, A.H. (1999). A proof of the triangle inequality for the Tanimoto dis-tance. Journal of Mathematical Chemistry, 26(1), 263–265.
Luukkonen, T., Tijssen, R.J.W., Persson, O., & Sivertsen, G. (1993). Themeasurement of international scientific collaboration. Scientometrics,28(1), 15–36.
Michelet, B. (1988). L’Analyse des Associations. Unpublished doctoral dis-sertation, Université Paris VII, Paris.
Salton, G., & McGill, M.J. (1983). Introduction to modern informationretrieval. Auckland, New Zealand: McGraw-Hill.
Schneider, J.W., & Borlund, P. (2007). Matrix comparison: Part 1. Motivation and important issues for measuring the resemblance
between proximity measures and ordination results. Journal of theAmerican Society for Information Science and Technology, 58(11),1586–1595.
Small, H. (1973). Co-citation in the scientific literature: A new measure ofthe relationship between two documents. Journal of the American Soci-ety for Information Science, 24(4), 265–269.
Tanimoto, T.T (1957, November 17). Internal report: IBM Technical ReportSeries.
Van Rijsbergen, C.J. (1977). A theoretical basis for the use of co-occurrencedata in information retrieval. Journal of Documentation, 33(2), 106–119.
Wagner, C.S., & Leydesdorff, L. (2005). Mapping the network of global science: Comparing international co-authorships from 1990 to 2000. International Journal of Technology and Globalization, 1(2),185–208.
Waltman, L., & van Eck, N.J. (2007). Some comments on the questionwhether co-occurrence data should be normalized. Journal of the AmericanSociety for Information Science and Technology, 58(11), 1701–1703.
White, H.D. (2003). Author cocitation analysis and Pearson’s r. Journal ofthe American Society for Information Science and Technology, 54(13),1250–1259.
White, H.D. (2004). Reply to Bensman. Journal of the American Society forInformation Science and Technology, 55, 843–844.
White, H.D., & Griffith, B.C. (1981). Author cocitation: A literature mea-sure of intellectual structure. Journal of the American Society for Infor-mation Science, 32(3), 163–171.
Zitt, M., Bassecoulard, E., & Okubo, Y. (2000). Shadows of the past ininternational cooperation: Collaboration profiles of the top five producersof science. Scientometrics, 47(3), 627–657.