Embed Size (px)
Citation preview

Jack BuckleyCommissionerNational Center for Education Statistics
May 10, 2012

Administered January–March 2011
National sample• 122,000 eighth-graders
Results available for• Nation• 50 states, the District of Columbia, and
the Department of Defense school system
Performance reported as• Average scale scores (0–300 scale)• Achievement levels (Basic, Proficient, Advanced)
Results compared to 20092

Science Content Areas
30% Physical science
30% Life science
40% Earth and space sciences
3
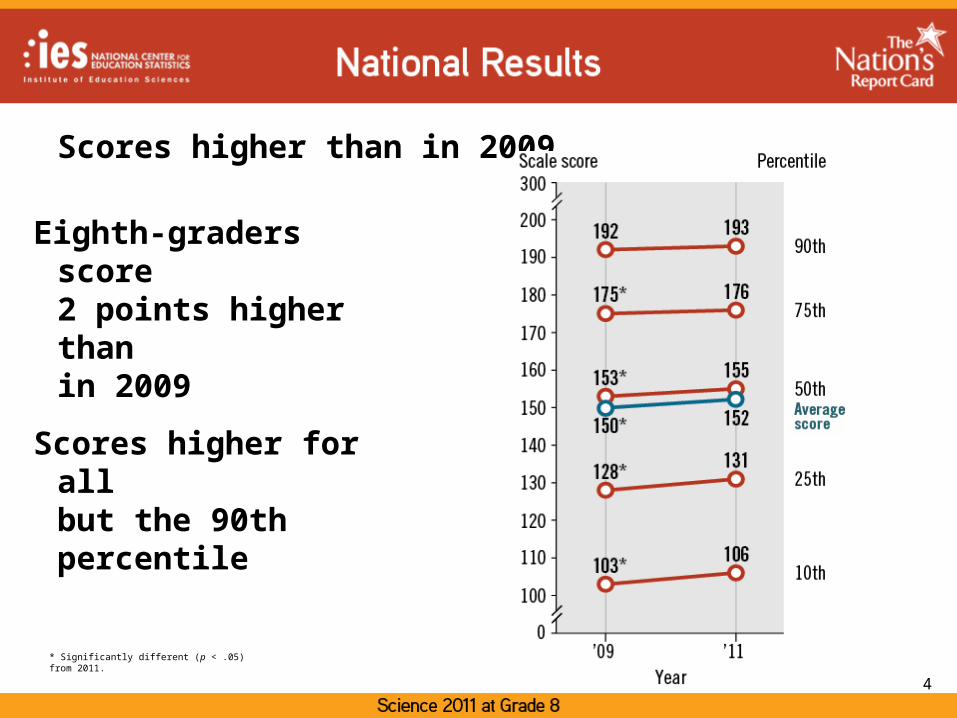
Scores higher than in 2009
Eighth-graders score 2 points higher than in 2009
Scores higher for all but the 90th percentile
* Significantly different (p < .05) from 2011.
4

Higher percentages of students perform at or above Basic and Proficient in 2011
* Significantly different (p < .05) from 2011.
5

White and Asian students score higher than other racial/ethnic groups
# Rounds to zero. NOTE: Black includes African American and Hispanic includes Latino. Race categories exclude Hispanic origin. Detail may not sum to totals because of rounding.
6

White – Black score gap narrows from 2009
7
* Significantly different (p < .05) from 2011.NOTE: Black includes African American, and Hispanic includes Latino. Race categories exclude Hispanic origin. Score gaps are calculated based on differences between unrounded average scores.
White – Hispanic score gap narrows from 2009Racial/ethnic gaps narrow from 2009

Male students score 5 points higher than female students in 2011
8
* Significantly different (p < .05) from 2011.
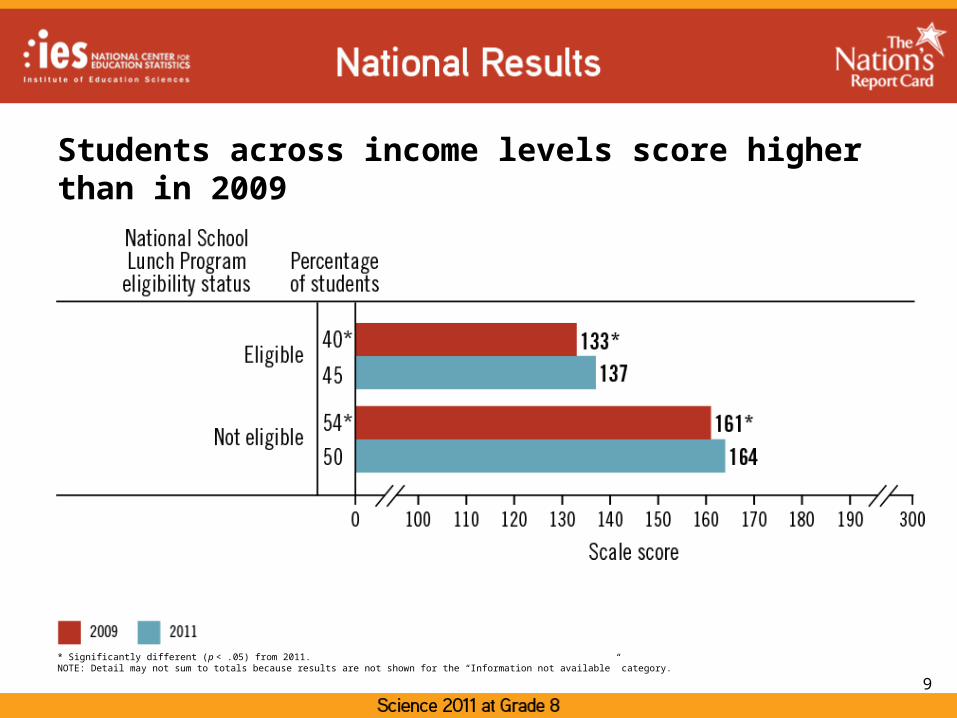
Students across income levels score higher than in 2009
9
* Significantly different (p < .05) from 2011.NOTE: Detail may not sum to totals because results are not shown for the “Information not available” category.
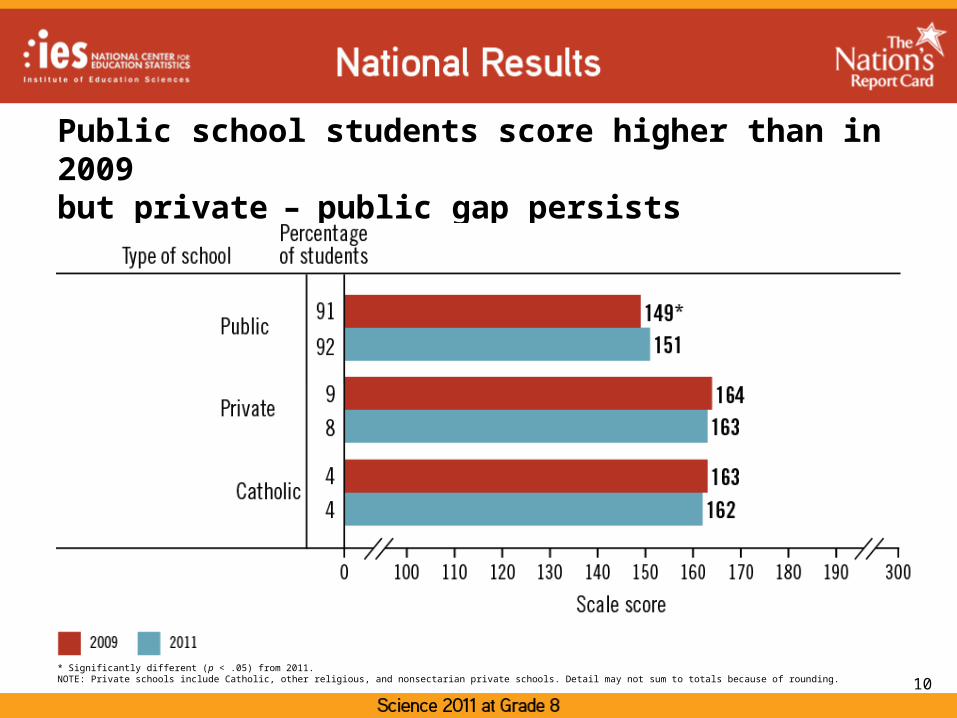
Public school students score higher than in 2009 but private – public gap persists
10* Significantly different (p < .05) from 2011.NOTE: Private schools include Catholic, other religious, and nonsectarian private schools. Detail may not sum to totals because of rounding.

Students in 16 states score higher in 2011 than in 2009
11
1 Department of Defense Education Activity (overseas and domestic schools).

Students in 29 states and jurisdictions score higher than the nation in 2011
12
1 Department of Defense Education Activity (overseas and domestic schools).

Students doing hands-on projects in class more frequently score higher
13
NOTE: Detail may not sum to totals because of rounding.

Students who report doing science-related activities that are not for schoolwork score higher
NOTE: Detail may not sum to totals because of rounding.
14

Earth and space sciences question
15
72% of eighth-graders were able to predict a geological consequence from the collision of two tectonic plates
NOTE: Detail may not sum to totals because of rounding.

Physical science question
54% of eighth-graders were able to identify what atoms combine to make up a molecule of water
# Rounds to zero.NOTE: Detail may not sum to totals because of rounding.
16

Life science question
17

Life science question
18
15% of eighth-graders demonstrated a “Complete” understanding of the behavior of a mosquito larva and pupa
NOTE: Detail may not sum to totals because the percentage of responses rated as “Off-task” is not shown. Off-task responses are those that do not provide any information related to the assessment task.

Photo Credits: © Bill Denison Photography, © Steve Cole/Photodisc/Getty Images #ST001352, © Suzann Julien/iStockphoto#2375032, © Carol Oostman/iStockphoto #5943307
http://nationsreportcard.gov
For more information
19