Embed Size (px)
Citation preview

Jack Lakes Wetlands Biodiversity Assessment, November 2007 & June 2008
CYMAG Environmental Inc.March 2009
APPENDICES
CYMAGEnvironmentalCYMAGEnvironmental
Jack Lakes Wetlands Biodiversity Assessment, November 2007 & June 2008 - APPENDICES2
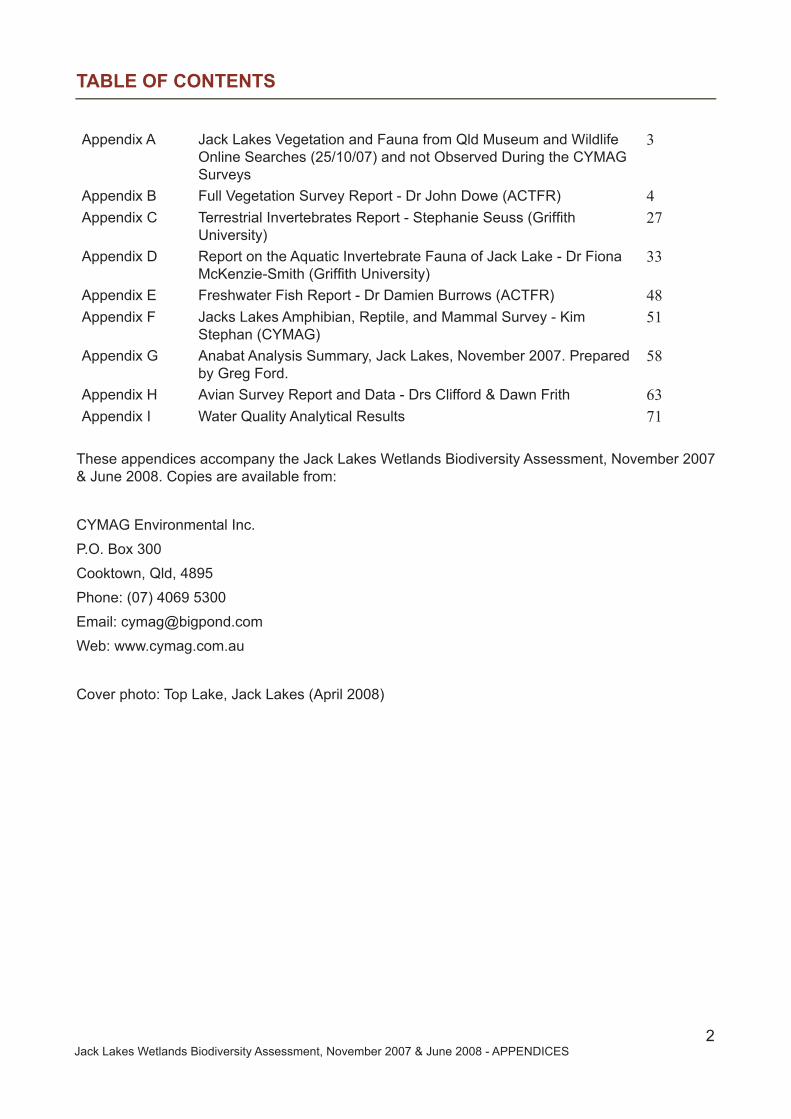
TABLE OF CONTENTS
Appendix A Jack Lakes Vegetation and Fauna from Qld Museum and Wildlife Online Searches (25/10/07) and not Observed During the CYMAG Surveys
3
Appendix B Full Vegetation Survey Report - Dr John Dowe (ACTFR) 4Appendix C Terrestrial Invertebrates Report - Stephanie Seuss (Griffith
University)27
Appendix D Report on the Aquatic Invertebrate Fauna of Jack Lake - Dr Fiona McKenzie-Smith (Griffith University)
33
Appendix E Freshwater Fish Report - Dr Damien Burrows (ACTFR) 48Appendix F Jacks Lakes Amphibian, Reptile, and Mammal Survey - Kim
Stephan (CYMAG)51
Appendix G Anabat Analysis Summary, Jack Lakes, November 2007. Prepared by Greg Ford.
58
Appendix H Avian Survey Report and Data - Drs Clifford & Dawn Frith 63Appendix I Water Quality Analytical Results 71
These appendices accompany the Jack Lakes Wetlands Biodiversity Assessment, November 2007 & June 2008. Copies are available from:
CYMAG Environmental Inc.P.O. Box 300Cooktown, Qld, 4895Phone: (07) 4069 5300Email: [email protected]: www.cymag.com.au
Cover photo: Top Lake, Jack Lakes (April 2008)
Jack Lakes Wetlands Biodiversity Assessment, November 2007 & June 2008 - APPENDICES3
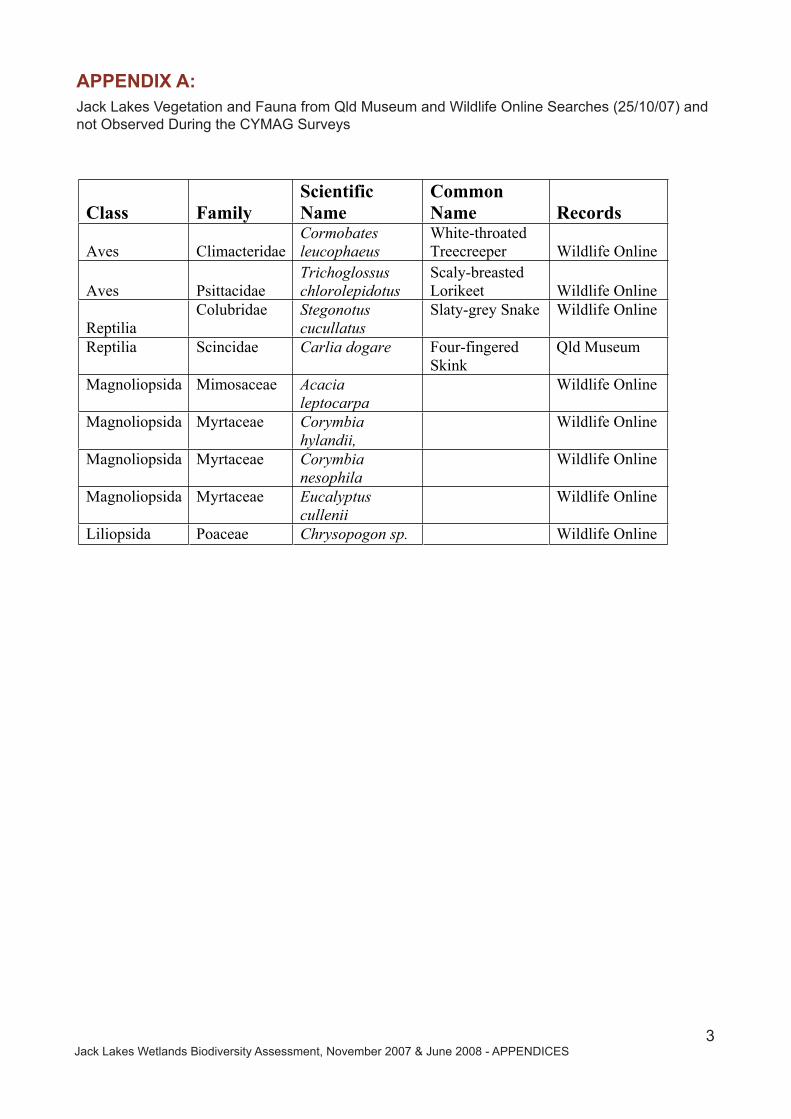
APPENDIX A: Jack Lakes Vegetation and Fauna from Qld Museum and Wildlife Online Searches (25/10/07) and not Observed During the CYMAG Surveys
Class Family ScientificName
CommonName Records
Aves Climacteridae Cormobatesleucophaeus
White-throatedTreecreeper Wildlife Online
Aves Psittacidae Trichoglossuschlorolepidotus
Scaly-breasted Lorikeet Wildlife Online
ReptiliaColubridae Stegonotus
cucullatus Slaty-grey Snake Wildlife Online
Reptilia Scincidae Carlia dogare Four-fingeredSkink
Qld Museum
Magnoliopsida Mimosaceae Acacialeptocarpa
Wildlife Online
Magnoliopsida Myrtaceae Corymbiahylandii,
Wildlife Online
Magnoliopsida Myrtaceae Corymbianesophila
Wildlife Online
Magnoliopsida Myrtaceae Eucalyptuscullenii
Wildlife Online
Liliopsida Poaceae Chrysopogon sp. Wildlife Online

Jack Lakes Wetlands Biodiversity Assessment, November 2007 & June 2008 - APPENDICES4
APPENDIX B: Full Vegetation Survey Report - Dr John Dowe (ACTFR)
A SURVEY OF THE VEGETATION OF JACK LAKES,
NOVEMBER 2007
ACTFR Report No. 07/33
December 2007

Jack Lakes Wetlands Biodiversity Assessment, November 2007 & June 2008 - APPENDICES5
A SURVEY OF THE VEGETATION OF JACK LAKES, NOVEMBER 2007
ACTFR Report No. 07/33, December 2007
Prepared by John Leslie Dowe Australian Centre for Tropical Freshwater Research,
James Cook University, Townsville Qld 4811 Phone: (07) 4781 4262; Fax: (07) 4781 5589; Email: [email protected]

Jack Lakes Wetlands Biodiversity Assessment, November 2007 & June 2008 - APPENDICES6
A Survey of the Vegetation of Jack Lakes, November 2007 - ACTFR Report 07/33
TABLE OF CONTENTS
EXECUTIVE SUMMARY .....................................................................................ii
1.0 INTRODUCTION..........................................................................................1
2.0 METHODS .....................................................................................................1
3.0 RESULTS .......................................................................................................3
3.1 Dominant Tree Species ...............................................................................3
3.2 Distribution and Physiognomy of Melaleuca species...............................3
3.3 Distribution of Lake Margin Species ........................................................7
4.0 DISCUSSION ..................................................................................................8
4.1 Rare Species.................................................................................................8
4.2 Regeneration................................................................................................8
4.3 High Value Habitat Areas ..........................................................................9
4.4 Habitat Condition and Biodiversity Values..............................................11
5.0 REFERENCES................................................................................................12
APPENDICES
Appendix 1. Descriptions of Transects .................................................................13
Appendix 2. Plant Species List...............................................................................14
Appendix 3. Voucher Specimens Collected ..........................................................16
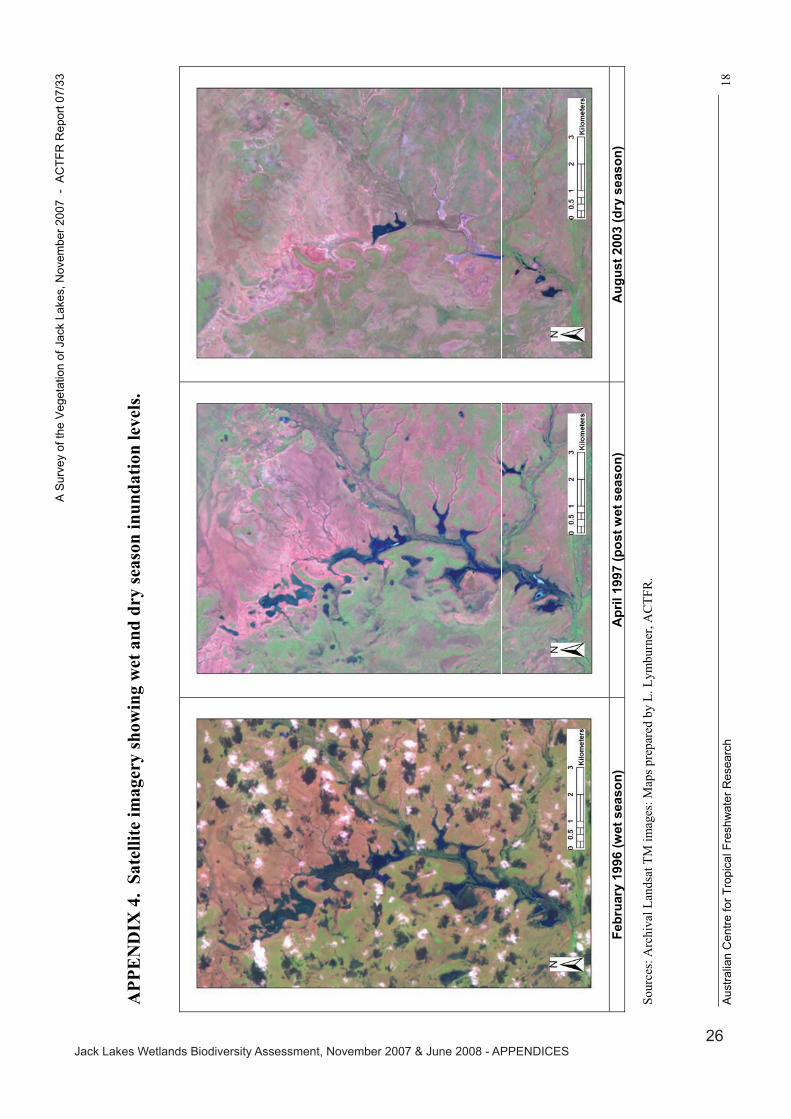
Appendix 4. Satellite imagery showing wet and dry season inundation levels .18
Australian Centre for Tropical Freshwater Research i

Jack Lakes Wetlands Biodiversity Assessment, November 2007 & June 2008 - APPENDICES7
A Survey of the Vegetation of Jack Lakes, November 2007 - ACTFR Report 07/33
EXECUTIVE SUMMARY
� A vegetation survey of the Jack Lakes area was conducted 19-22 November 2007.
As this was at the end of the dry season, many aquatic species were in a state of
quiescence and were either present only as dried remnants or not detectable. It is
recommended that another survey be conducted at the end of the wet season to
record the seasonal species.
� This present survey brings the number of plant species recorded at Jack Lakes to
137. The most speciose families include Myrtaceae (22 spp.), Poaceae (18 spp.),
Cyperaceae (9 spp.), Mimosaceae (8 spp.) and Euphorbiaceae (6 spp.).
� The dominant structural trees on the margins of Jack Lakes and associated
connecting and drainage lines were, by order of prevalence, Melaleuca
leucadendra, Melaleuca viridiflora, Melaleuca stenostachya and Lophostemon
suaveolens. The lake margins are otherwise dominated by herbaceous species of
Cyperaceae (sedges), and Poaceae (grasses).
� Areas of High Habitat Value were determined, based on intactness and resilience
to the impacts of pigs and cattle. These areas included:
1. margins and adjoining forest on the eastside of Top Lake, where areas of
Cyperaceae spp. are intact.
2. seasonally dry drainage channels and adjacent forests between Top Lake and
Middle Lakes, where fringing M. leucadendra and M. fluviatilis populations are
relatively healthier than other areas, and with little evidence of decline or stress.
3. sandy ridges on the east side of Middle Lakes, particularly in the areas between
‘Fish Lake’ and the eastern branch of Middle Lakes, where patches of open forest
and Acacia thickets occur, and where populations of Lomandra banksii and
Thryptomene oligandra show considerable development and lack of disturbance.
4. eastern side of Lower Lakes, particularly on the margins and adjacent inflow
channels and creeks on the most eastern section, where a number of very tall (~25
m tall) M. leucadendra populations occur.
Australian Centre for Tropical Freshwater Research ii
Jack Lakes Wetlands Biodiversity Assessment, November 2007 & June 2008 - APPENDICES8
A Survey of the Vegetation of Jack Lakes, November 2007 - ACTFR Report 07/33
Australian Centre for Tropical Freshwater Research iii
5. at the confluence of Jack River and the drainage channels of the Lower Lakes,
where the Melaleuca dominated fringing vegetation meets riparian vegetation
[evergreen notophyll vine forest] including Buchanania arborescens, Dillenia
alata, Leptospermum longifolium, Melaleuca fluviatilis, Syzygium papyraceum
and S. eucalyptoides. The contiguousness of these two significantly different
types of habitats is unusual and worthy of listing as a high value ecosystem in its
own right.
� Variation among the dominant species of Melaleuca was determined at a number
of sites. It was found that Melaleuca leucadendra and Melaleuca stenostachya
displayed little variation in morphology at a number of moisture gradient
locations regards of moisture levels, whilst Melaleuca viridiflora showed
considerable variation with increasing size with increasing water availability.
� A study of species distributions adjacent to the lakes revealed that most species
occurrences are controlled by soil moisture levels, particularly with regard to the
upper limits of seasonal inundation.
� Recommendations for Habitat Condition Assessment and Biodiversity Values
Maintenance include:
1. that effective control of pigs and the limiting of access to cattle must be initiated and
achieved.
2. that vigilance be maintained for Rubber Vine, and that if detected, an eradication
program be put in place.
3. that the role of fire at Jack Lakes is investigated and that a fire management program is
put in place.
4. that species of conservation significance be further investigated and that a program for
their conservation be established.

Jack Lakes Wetlands Biodiversity Assessment, November 2007 & June 2008 - APPENDICES9
A Survey of the Vegetation of Jack Lakes, November 2007 - ACTFR Report 07/33
1.0 INTRODUCTION
A broad assessment of the vegetation associated with the Jack Lakes aggregation was provided by
Blackman et al. (1996), based on the survey work undertaken by Nelder & Clarkson (1995), in
which they documented both aquatic and terrestrial species. These authors reiterated the
conservation significance of the area as first proposed by McFarland (1993). The catchment area
associated with Jack River [to include Jack Lakes] had previously been designated with high
‘wilderness quality’ (Lesslie et al. 1992). An overview of pre-settlement vegetation was provided
by DPI (1993) and was described, at that time, as ‘relatively undisturbed’. The Jack Lakes area
contains one ‘of concern’ bioregional ecosystem (Nelder, 1999) [RE 3.3.66], this being palustrine
wetland, i.e. ‘permanent lakes and lagoons frequently with fringing woodlands’, which provides
habitat for rare aquatic species and has local high diversity. Rubber Vine (Cryptostegia
grandiflora) was listed as a ‘threatening process’ (ANRA, 2007), but that species otherwise has
not yet been recorded for Jack Lakes although it occurs in nearby river systems.
Nelder & Clarkson (1995) described the surrounding vegetation as Eucalyptus woodlands and
Melaleuca low open woodlands. The vegetation in the four permanent lakes was described as
composed of free floating plants, bottom-rooted species and emergent grasses and sedges, and the
margins with seasonally inundated woodlands and/or shrublands with a sparse understorey.
This report aims to summarise what is presently known about the vegetation associated with Jack
Lakes, to add to the list of species already developed, and to provide information on vegetation
structure, ecological character and distribution of species within the Jack Lakes system. Special
focus has been placed on the structurally dominant trees associated with the seasonally inundated
lake margins.
2.0 METHODS
A desktop assessment of both the aquatic and terrestrial vegetation associated with Jack Lakes
was undertaken prior to field work, of 18-22 November 2007. Primary references included DPI
(1993), Nelder & Clarkson (1995) and Nelder (1999). A list of species collected in the general
area was supplied by EPA (2007). To my knowledge, there have been no recent vegetation
surveys in the immediate vicinity of Jack Lakes.
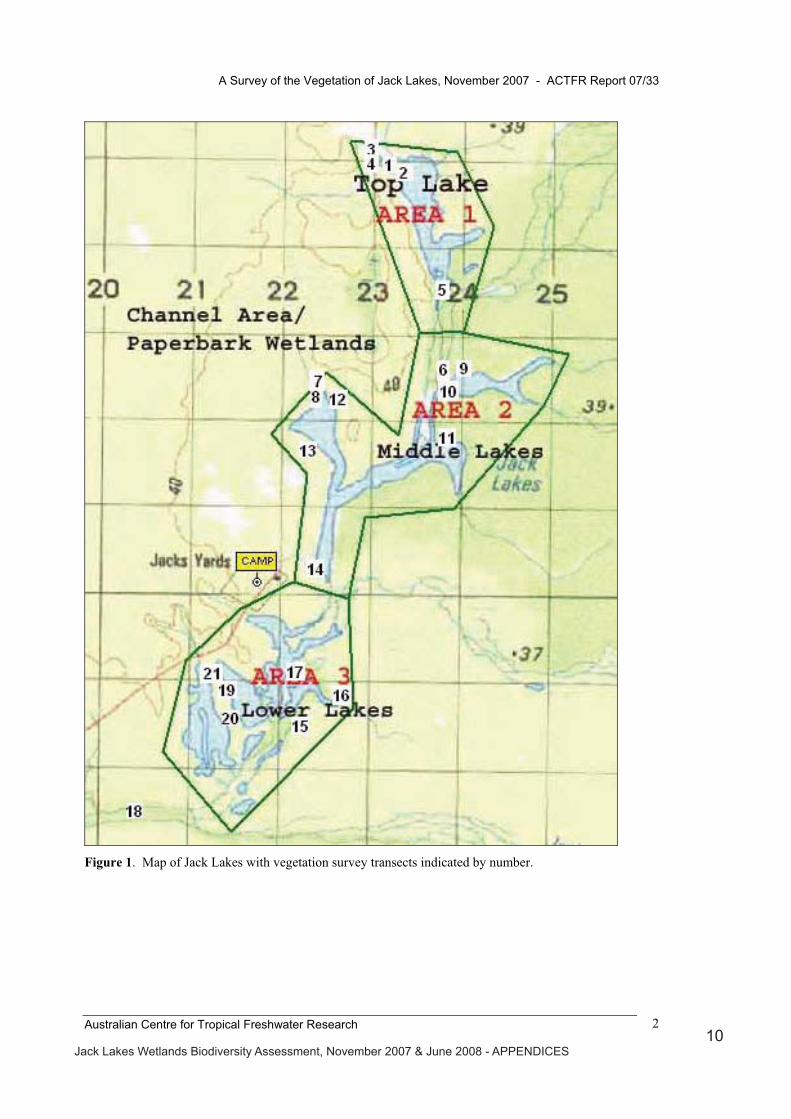
For survey purposes, Jack Lakes can be divided into three zones (Fig. 1), and will be referred to
as Top Lake, Middle Lakes and Lower Lakes in this report. A fourth zone, where Jack Lakes join
Australian Centre for Tropical Freshwater Research 1
Jack Lakes Wetlands Biodiversity Assessment, November 2007 & June 2008 - APPENDICES10
A Survey of the Vegetation of Jack Lakes, November 2007 - ACTFR Report 07/33
Figure 1. Map of Jack Lakes with vegetation survey transects indicated by number.
Australian Centre for Tropical Freshwater Research 2

Jack Lakes Wetlands Biodiversity Assessment, November 2007 & June 2008 - APPENDICES11
A Survey of the Vegetation of Jack Lakes, November 2007 - ACTFR Report 07/33
Jack River and the associated downstream riparian forest, can also be included, as this area offers
a distinct vegetation type that is otherwise not found anywhere else within the Jack Lakes area.
Twenty-one transects were established, ranging from 110 m to 1380 m long, and with each being
10 m wide. Five transects were on Top Lake, nine in the Middle Lakes, six in the Lower Lakes
and one on Jack River downstream of the lake confluence. The positions of transects are indicated
on the map in Figure 1. A summary of transects, including description, survey methods and GPS
co-ordinates, is provided in Appendix 1. A plant species list for Jack Lakes is presented in
Appendix 2.
Data derived from the transects included species presence, population structure, species
distributions, and demographics of the dominant trees. Data were recorded at 10 m intervals along
each transect, therefore quadrats were effectively 100 m² each. Voucher specimens of appropriate
species were collected for deposition in Queensland Herbarium, Brisbane (BRI) (Appendix 3),
and photographs, included on an accompanying CD, of habitat and species were taken at each
transect.
3.0 RESULTS
3.1 Dominant Tree Species
Melaleuca leucadendra, M. viridiflora, M. fluviatilis and Lophostemon suaveolens were identified
as the dominant tree species on the seasonally inundated margins of Jack Lakes, with M.
leucadendra being the most ubiquitous species (Fig. 2). Other common tree/shrub species
included, in order of prevalence, Barringtonia acutangula, Calycopeplus casuarinoides,
Asteromyrtus symphyocarpa, Leptospermum longifolium, Acacia auriculiformis, Livistona
muelleri, Melaleuca stenostachya, and Acacia holosericea. In November, at the end of the dry
season, very few understorey and/or ground cover species were present. Many species in these
strata were in a senescent and/or dried state, including Eleocharis spp., Cyperus spp., and
Poaceae spp. The only grass that was actively growing, either on the lake margins or on dried
lake pans, was Cynodon dactylon. Persistent macrophytes and other aquatic plants included
Nymphaea spp., Nyphoides spp., Marsilea mutica and Azolla pinnata. A list of previously
recorded species and newly recorded species is presented in Appendix 3.
3.2 Distribution and physiognomy of Melaleuca species
The four Melaleuca species recorded on the margins of Jack Lakes (i.e. M. leucadendra, M.
viridiflora, M. fluviatilis and M. stenostachya) occurred in either monospecific stands or in
Australian Centre for Tropical Freshwater Research 3

Jack Lakes Wetlands Biodiversity Assessment, November 2007 & June 2008 - APPENDICES12
A Survey of the Vegetation of Jack Lakes, November 2007 - ACTFR Report 07/33
Dominant tree species on Jack Lakes margins
0
5
10
15
20
25
M. leucadendra M.viridif lora M.fluviatilis L.suaveolens
occu
rren
ce in
rans
ects
(n=2
1)
Figure 2. Relative abundance of dominant tree species on the margins of Jack Lakes, as recorded in 21
transects.
various associations of up to three of the species. The presence of both surface and ground water
is among the primary factors influencing the distribution of these Melaleuca species. The
moisture gradient from Top Lake, through the Middle Lakes to the Lower Lakes indicated an
increase in water availability in a southerly direction, with the Top Lake retaining proportionally
less surface water than the Middles Lakes or the Bottom Lakes, into the dry season (Appendix 4).
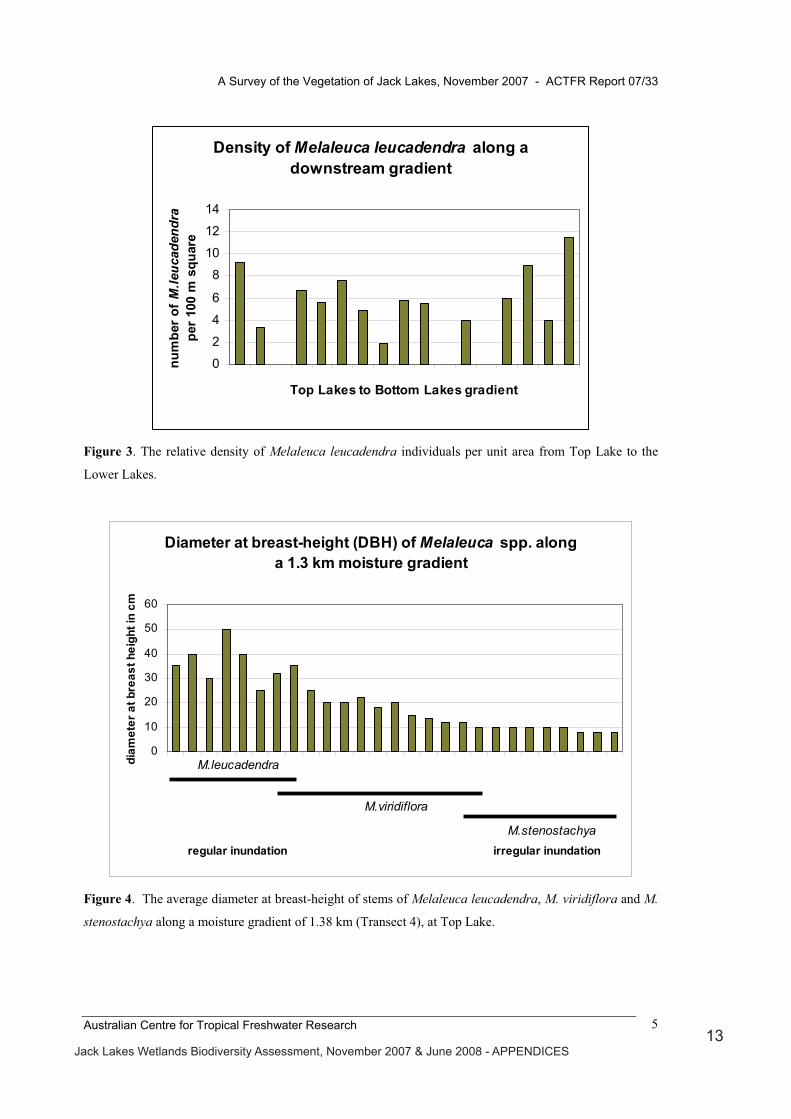
The density of M. leucadendra, as measured at the vegetation transects along this gradient
indicated that the relative densities of stems per unit area increased along this gradient from north
to south, i.e. density increased with increasing water availability (Fig. 3). It may also be possible
that the level of nutrient availability also increases along this gradient, but to resolve this question
requires further investigation.
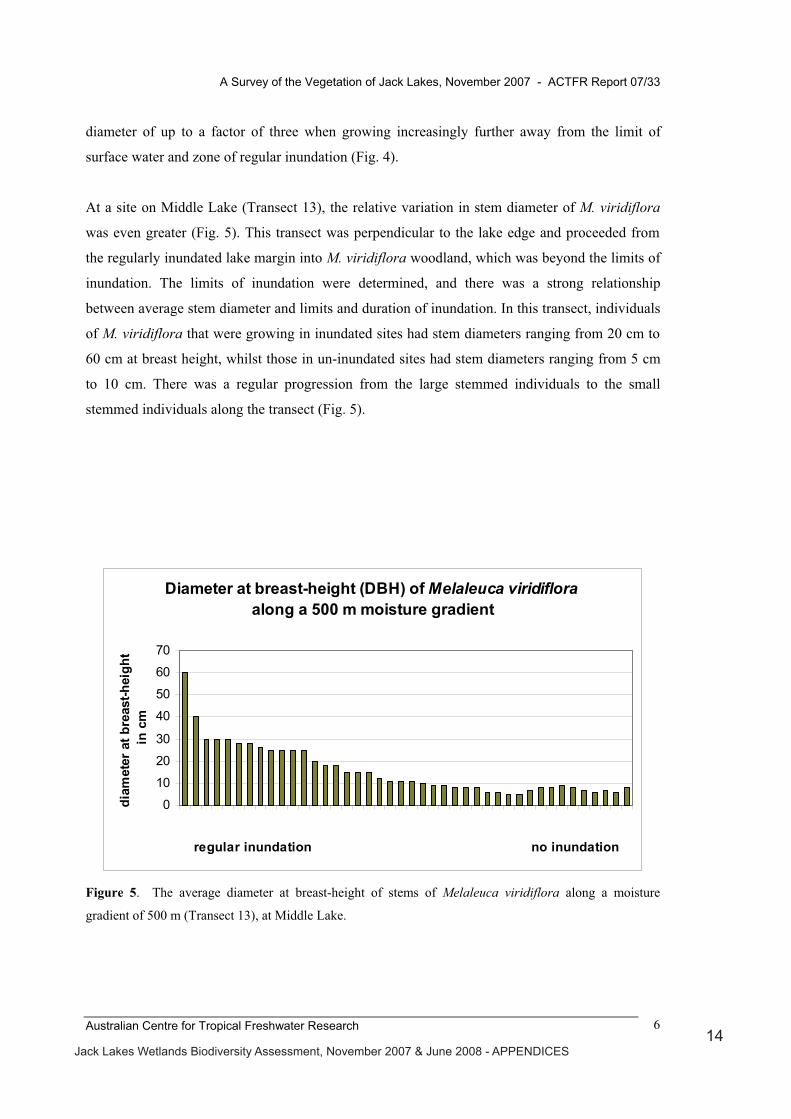
Variation in stem diameter (measured at breast height) was recorded in the individual Melaleuca
species along a north/south moisture gradient of 1.38 km from the north-western in-flow point of
Top Lake to the limit of surface water (Transect 4, see Appendix 1) (Fig. 4). Of the three species
observed along that transect (M. leucadendra, M. viridiflora and M. stenostachya), both M.
leucadendra and M. stenostachya showed relatively limited variation to stem diameter relative to
distance away from surface water, whilst M. viridiflora showed a marked decrease in stem
Australian Centre for Tropical Freshwater Research 4
Jack Lakes Wetlands Biodiversity Assessment, November 2007 & June 2008 - APPENDICES13
A Survey of the Vegetation of Jack Lakes, November 2007 - ACTFR Report 07/33
Density of Melaleuca leucadendra along a downstream gradient
0
2
4
6
8
10
12
14
1 2 3 4 5 6 7 8 9 10 11 12 13 14 15 16 17Top Lakes to Bottom Lakes gradient
num
ber
of M
.leuc
aden
dra
per 1
00 m
squ
are
Figure 3. The relative density of Melaleuca leucadendra individuals per unit area from Top Lake to the
Lower Lakes.
Diameter at breast-height (DBH) of Melaleuca spp. along a 1.3 km moisture gradient
0
10
20
30
40
50
60
1 3 5 7 9 11 13 15 17 19 21 23 25 27
regular inundation irregular inundation
diam
eter
at b
reas
t hei
ght i
n cm
M.leucadendra
M.viridiflora
M.stenostachya
Figure 4. The average diameter at breast-height of stems of Melaleuca leucadendra, M. viridiflora and M.
stenostachya along a moisture gradient of 1.38 km (Transect 4), at Top Lake.
Australian Centre for Tropical Freshwater Research 5
Jack Lakes Wetlands Biodiversity Assessment, November 2007 & June 2008 - APPENDICES14
A Survey of the Vegetation of Jack Lakes, November 2007 - ACTFR Report 07/33
diameter of up to a factor of three when growing increasingly further away from the limit of
surface water and zone of regular inundation (Fig. 4).
At a site on Middle Lake (Transect 13), the relative variation in stem diameter of M. viridiflora
was even greater (Fig. 5). This transect was perpendicular to the lake edge and proceeded from
the regularly inundated lake margin into M. viridiflora woodland, which was beyond the limits of
inundation. The limits of inundation were determined, and there was a strong relationship
between average stem diameter and limits and duration of inundation. In this transect, individuals
of M. viridiflora that were growing in inundated sites had stem diameters ranging from 20 cm to
60 cm at breast height, whilst those in un-inundated sites had stem diameters ranging from 5 cm
to 10 cm. There was a regular progression from the large stemmed individuals to the small
stemmed individuals along the transect (Fig. 5).
Diameter at breast-height (DBH) of Melaleuca viridiflora along a 500 m moisture gradient
0
10
20
30
40
50
60
70
1 3 5 7 9 11 13 15 17 19 21 23 25 27 29 31 33 35 37 39 41
regular inundation no inundation
diam
eter
at b
reas
t-hei
ght
in c
m
Figure 5. The average diameter at breast-height of stems of Melaleuca viridiflora along a moisture
gradient of 500 m (Transect 13), at Middle Lake.
Australian Centre for Tropical Freshwater Research 6

Jack Lakes Wetlands Biodiversity Assessment, November 2007 & June 2008 - APPENDICES15
A Survey of the Vegetation of Jack Lakes, November 2007 - ACTFR Report 07/33
3.3 Distribution of lake margin species
The distribution of species relative to distance from the lake margins was determined at a number
of transects (see Appendix 1). At Transect 20 in the Lower Lakes, which traversed a distance of
230 m between two of the lakes in that area, the distribution of species occurring in regularly
inundated to infrequently inundated zones was recorded (Fig. 6). Of the species recorded at
Transect 20, four (Lophostemon suaveolens, Asteromyrtus symphyocarpa, M. leucadendra and
Barringtonia acutangula) displayed a positive response to occurrence in regularly inundated
zones; two species (Calycopeplus casuarinoides and M. viridiflora) showed no particular
preference and occurred in more or less equal densities in both regularly inundated and
infrequently inundated zones.
In another transect in the Lower Lakes (Transect 21), species occurrence along a regularly
inundated to never inundated gradient of 900 m length was recorded (Fig. 7). The preference of
species relative to inundation regimes was established. There were four species (Acacia
auriculiformis, L. suaveolens, B. acutangula and M. leucadendra) that were strictly confined to
the regularly inundated zone. Two species (Asteromyrtus symphyocarpa and Acacia holosericea)
displayed preference for the infrequently inundated zone, whilst two species (Corymbia sp. and
M. foliolosa) displayed a strict preference to the never inundated zone.
0% 10% 20% 30% 40% 50% 60% 70% 80% 90% 100%
Melaleuca viridiflora
Calycopeplus casuarinoides
Barringtonia acutangula
Melaleuca leucadendra
Asteromyrtus symphyocarpa
Lophostemon suaveolens
regular inundation regular inundationinfrequent inundation
Figure 6. Presence of tree and shrub species along a 230 m transect between two lakes at Jack Lakes,
Lower Lakes area (Transect 20), recorded on a presence/absence basis in 100 m² quadrats.
.
Australian Centre for Tropical Freshwater Research 7

Jack Lakes Wetlands Biodiversity Assessment, November 2007 & June 2008 - APPENDICES16
A Survey of the Vegetation of Jack Lakes, November 2007 - ACTFR Report 07/33
0% 20% 40% 60% 80% 100%
Melaleuca leucadendra
Melaleuca viridiflora
Melaleuca foliolosa
Barringtonia acutangula
Lophostemon suaveolens
Calycopeplus casuarinoides
Acacia holosericea
Asteromyrtus symphyocarpa
Acacia auriculiformis
Corymbia sp.
regular inundation zone infrequent inundation zone never inundated zone
Figure 7. Presence of tree and shrub species along a 900 m transect along a moisture gradient on a ridge
between two lakes at Jack Lakes, Lower Lakes area (Transect 21), recorded on a presence/absence basis in
100 m² quadrats.
4.0 DISCUSSION
4.1 Rare species
Given the preliminary nature and short duration of the present survey, no rare or threatened
species were directly observed. However, some aquatic species such as Aponogeton spp.,
Cyperaceae spp. (e.g. Lepironia articulata, Schoenus calystachyus and Baumea teretifolia) and
Restionaceae (Dapsilanthus elatior) may have been in a state of seasonal quiescence, as the
survey time was in late dry season and with water levels at their lowest. Conversely, these species
may also have been consumed by pigs, which were observed in large numbers and whose impact
on aquatic vegetation is unknown but strongly evident. Evidence of pig activities were prevalent
at all the vegetation transects, with the most severe levels of impact on the lake margins and in
shallow water zones.
4.2 Regeneration
Regeneration of the dominant tree species was recorded in most transects. Dense swathes (>50
per 1 m²) of M. leucadendra saplings were present at what were the limits of previous high
inundation events. Seedlings and juveniles of M. viridiflora were otherwise observed scattered
throughout the populations, although the densest aggregations of these were in the irregularly
inundated or never inundated zones, rather than at the limits of high inundation events.
Australian Centre for Tropical Freshwater Research 8

Jack Lakes Wetlands Biodiversity Assessment, November 2007 & June 2008 - APPENDICES17
A Survey of the Vegetation of Jack Lakes, November 2007 - ACTFR Report 07/33
Significant levels of regeneration of secondary species such as Barringtonia acutangula and
Calycopeplus casuarinoides were observed.
4.3 High Value Habitat Areas
Considering the results of the 21 vegetation survey transects, a number of High Value Habitat
areas can be recognized. These areas are indicated on the map in Figure 8.
1. margins and adjoining forest on the eastside of Top Lake, where areas of Cyperaceae
spp. are intact.
2. seasonally dry drainage channels and adjacent forests between Top Lake and Middle
Lakes, where fringing M. leucadendra and M. fluviatilis populations are relatively
healthier than other areas, and with little evidence of decline or stress.
3. sandy ridges on the east side of Middle Lakes, particularly in the areas between ‘Fish
Lake’ and the eastern branch of Middle Lakes, where patches of open forest and
Acacia thickets occur, and where populations of Lomandra banksii and Thryptomene
oligandra show considerable development and lack of disturbance.
4. eastern side of Lower Lakes, particularly on the margins and adjacent inflow
channels and creeks on the most eastern section, where a number of very tall (~25 m
tall) M. leucadendra populations occur.
5. at the confluence of Jack River and the drainage channels of the Lower Lakes, where
the Melaleuca dominated fringing vegetation meets riparian vegetation [evergreen
notophyll vine forest] including Buchanania arborescens, Dillenia alata,
Leptospermum longifolium, Melaleuca fluviatilis, Syzygium papyraceum and S.
eucalyptoides. The contiguousness of these two significantly different types of
habitats is unusual and worthy of listing as a high value ecosystem in its own right.
Of considerable interest was the high density of the uncommon orchid Cepobaculum
(Dendrobium) trilamellatum, which occurred on Melaleuca spp. throughout the Jack Lakes area,
but with significant high density in the areas adjacent to the northern margins of Top Lake on
host trees of M. stenostachya and M. clarksonii. It was otherwise uncommon on other, more
dominant species such as M. leucadendra and M. viridiflora, and with another orchid
Cepobaculum (Dendrobium) canaliculatum, being common on the latter species.
Australian Centre for Tropical Freshwater Research 9

Jack Lakes Wetlands Biodiversity Assessment, November 2007 & June 2008 - APPENDICES18
A Survey of the Vegetation of Jack Lakes, November 2007 - ACTFR Report 07/33
Figure 8. Map indicating High Value Habitat areas as determined during the November 2007
vegetation survey.
Australian Centre for Tropical Freshwater Research 10

Jack Lakes Wetlands Biodiversity Assessment, November 2007 & June 2008 - APPENDICES19
A Survey of the Vegetation of Jack Lakes, November 2007 - ACTFR Report 07/33
4.4 Habitat Condition and Biodiversity Values
Overall, the impact of pigs is severely negatively affecting the condition of habitats throughout
the Jack Lakes area. With seasonal reduction is surface water, and greater accessibility to aquatic
plants that have grown during the inundation period, pigs are capable of consuming and trampling
vast areas of sedge beds and aquatic grass swards. In addition, the impact of cattle on the margins
has a similar, though less detrimental, effect. To effectively maintain the existing biodiversity
values, effective control of pigs and the limiting of access to cattle must be initiated and achieved.
In general, the eastern portion of Jack Lakes is in a much better ecological condition than the
western portion. It may be that the impact of cattle has been greater on the western areas as access
to the east is restricted during the wet season inundation, a time when vegetation is more sensitive
to disturbance.
During this survey, no weeds of significance were observed within the Jake Lakes system.
However, the potential for Rubber Vine (Cryptostegia grandiflora) to become established is high.
This species has the propensity to invade disturbed areas, particular those where cattle impacts
are prevalent. It is recommended that vigilance be maintained for Rubber Vine, and that if
detected, an eradication program be put in place.
During this survey, the evidence of past fires was observed in a number of transects. It is not
known whether fires have had a detrimental effect on regeneration and distribution of lake margin
species, or whether they are exacerbating or assisting in maintaining ecological integrity that is
being threatened by pig and cattle impacts. It is recommended that the role of fire at Jack Lakes
be investigated and that a fire management program be put in place.
There are a number of plant species of conservation significance within the Jack Lakes system.
These include a suite of aquatic macrophytes including Aponogeton elongatus, A. queenslandicus,
Astonia australiense and Vallisneria gracilis. Vulnerable species known to occur in adjacent
forests and woodlands include Gardenia psidioides, Acacia fleckeri, Archidendron hirsutum,
Croton brachypus and Macrostelia grandiflora, among others. During this survey, an extensive
population of the orchid Cepobaculum (Dendrobium) trilamellatum was observed, with very high
density in the lake margin Melaleuca forest associated with Top Lake. An effort to conserve the
species of conservation significance is highly recommended.
Australian Centre for Tropical Freshwater Research 11
Jack Lakes Wetlands Biodiversity Assessment, November 2007 & June 2008 - APPENDICES20
A Survey of the Vegetation of Jack Lakes, November 2007 - ACTFR Report 07/33
Australian Centre for Tropical Freshwater Research 12
5.0 REFERENCES
ANRA [Australian Natural Resources Atlas] 2007. Biodiversity Assessment – Cape York
Peninsula: Important Wetlands. Department of Environment & Water, Canberra.
[website accessed 9 December 2007].
Blackman, J.G., Perry, T.W., Ford, G.I., Craven, S.A., Gardiner, S.J. & De Lai, R.J.
1996. Queensland. In: A Directory of Important Wetlands in Australia, Second Edition,
pp. 177-433. Australian Nature Conservation Agency, Canberra.
DPI [Department of Primary Industries] 1993. The Condition of River Catchments in
Queensland. Department of Primary Industries, Government of Queensland.
EPA [Environmental Protection Agency] 2007. WildNet. (Extracted from database on 11 November 2007).
Lesslie, R., Abrahams, H. & Maslen, M. 1992. National Wilderness Inventory: Stage III.
Wilderness Quality on Cape York Peninsula. Report to the Australian Heritage
Commission. Commonwealth of Australia, Canberra.
McFarland, D. 1993. Fauna of Cape York Peninsula Biogeographic Region. Queensland
Department of Environment and Heritage, Brisbane.
Nelder, V.J. 1999. Cape York Peninsula. In: Sattler, P. & Williams, R. (eds), The
Conservation Status of Queensland Bioregional Ecosystems, 3/1-3/85. Environmental
Protection Agency, Queensland Government, Brisbane.
Nelder, V.J. & Clarkson, J.R. 1995. Vegetation Survey Mapping of Cape York Peninsula.
In: Cape York Peninsula Land Use Strategy. Office of the Co-ordinator General and
Department of Environment and Heritage, Government of Queensland, Brisbane,
Department of Environment, Sport and Territories and Australian Geological Survey
Organisation, Canberra.

Jack Lakes Wetlands Biodiversity Assessment, November 2007 & June 2008 - APPENDICES21
A Survey of the Vegetation of Jack Lakes, November 2007 - ACTFR Report 07/33
APPENDIX 1: Descriptions and positions of vegetation transects (n=21)
that were established at Jack Lakes 19-22 November, 2007.
Top Lake - Transects 1-5
Middle Lakes – Transects 6-14
Bottom Lakes – Transects 15-21
Transect Description GPS co-ordinates 1 across lake, 260 m long, perpendicular to edges, population
density of Melaleuca spp. S14° 51.469’, E144° 25.586’ S14° 51.547’, E144° 25.703’
2 across lake, 310 m long, perpendicular to edges, ± parallel to Transect 1, population density of Melaleuca spp.
S14° 51.621’, E144° 25.680’ S14° 51.592’, E144° 25.535’
3 along drainage line into lake, parallel to edge, 1380 m long, population density of Melaleuca spp.
S14° 51.000’, E144° 25.584’ S14° 51.650’, E144° 25.605’
4 along drainage line into lake, parallel to edge, 1380 m long, height and DBH of Melaleuca spp., presence of species
S14° 51.000’, E144° 25.584’ S14° 51.650’, E144° 25.605’
5 parallel to edge, 300 m long, population density of Melaleuca leucadendra
S14° 51.384’, E144° 26.090’ S14° 52.567’, E144° 25.964’
6 parallel to edge, 300 m long, population structure of Melaleuca leucdadendra
S14° 53.619’, E144° 25.437’ S14° 53.477’, E144° 25.416’
7 perpendicular to edge, 260 m long, population structure of Melaleuca leucadendra
S14° 53.155’, E144° 25.198’ S14° 53.252’, E144° 25.000’
8 parallel to edge, 200 m long, density of Melaleuca spp. S14° 53.252’, E144° 25.267’ S14° 53.346’, E144° 25.193’
9 parallel to edge, 200 m long, density of Melaleuca spp. S14° 53.320’, E144° 25.918’ S14° 53.498’, E144° 25.921’
10 parallel to edge, 200 m long, density of Melaleuca spp. S14° 53.121’, E144° 26.115’ S14° 53.210’, E144° 26.068’
11 parallel to edge, 200 m long, density of Melaleuca spp. S14° 53.561’, E144° 26.094’ S14° 53.633’, E144° 26.022’
12 parallel to edge, 200 m long, density of Melaleuca spp. S14° 53.576’, E144° 25.258’ S14° 53.508’, E144° 25.172’
13 perpendicular to edge, 500 m long, density of Melaleuca spp., and presence of other species
S14° 53.481’, E144° 25.199’ S14° 53.700’, E144° 25.126’
14 parallel to edge, 200 m long, Melaleuca spp. density, and presence of other species
S14° 54.310’, E144° 25.243’ S14° 54.235’, E144° 25.166’
15 parallel to edge, 200 m long, Melaleuca spp. density, and presence of other species
S14° 55.298’, E144° 25.075’ S14° 55.310’, E144° 25.181’
16 parallel to edge, 200 m long, Melaleuca leucadendra density, and presence of other species
S14° 55.188’, E144° 25.370’ S14° 55.100’, E144° 25.315’
17 parallel to edge, 200 m long, Melaleuca leucadendra density, and presence of other species
S14° 54.973’, E144° 25.216’ S14° 54.905’, E144° 25.286’
18 across Jack River, 110 m long, presence of species S14° 55.922’, E144° 24.434’ S14° 55.800’, E144° 24.438’
19 parallel to edge, 200 m long, population structure of Melaleuca leucadendra, presence of other species
S14° 55.076’, E144° 24.720’ S14° 55.177’, E144° 24.762’
20 between lakes, 230 m long, presence of all species S14° 55.32’, E144° 24.712’ S14° 55.384’, E144° 24.834’
21 along ridge between lakes (parallel to edges), 900 m long, presence of all species
S14° 55.384’, E144° 24.834’ S14° 54.901’, E144° 24.569’
Australian Centre for Tropical Freshwater Research 13

Jack Lakes Wetlands Biodiversity Assessment, November 2007 & June 2008 - APPENDICES22
A Survey of the Vegetation of Jack Lakes, November 2007 - ACTFR Report 07/33
APPENDIX 2: Plant species recorded in the Jack Lakes area. Compiled
from data in DPI (1993), Nelder & Clarkson (1995) and Nelder (1999), and
vegetation surveys done 18-22 November, 2007. Family abbreviations are
included in brackets.
Abrus precatorius (Fab.) Acacia auriculiformis (Mimos.) Acacia fleckeri (Mimos.) Acacia midgleyi (Mimos.) Acacia polystachya (Mimos.) Acacia salicina (Mimos.) Acacia torulosa (Mimos.) Albizia canescens (Mimos.) Alyxia spicata (Apocyn.) Aponogeton elongatus (Aponogeton.) Aponogeton queenslandicus (Aponogeton.)Archidendron hirsutum (Mimos.) Aristida sp. (Poa.) Asteromyrtus symphyocarpa (Myrt.) Astonia australiense (Alismat.) Atracocarpus sessilis (Rubi.) Austrosteenisia blackii (Fab.) Azolla pinnata (Azoll.) Banksia dentata (Prote.) Barringtonia acutangula (Lecythid.) Baumea teretifolia (Cyper.) Blepharocarya involucrigera (Anacard.) Blyxa sp. (Hydrocharit.) Brachychiton garrawayae (Stercul.) Buchanania arborescens (Anancard.) Calycopeplus casuarinoides (Euphorb.) Carallia brachiata (Rhizophor.) Cepobaculum canaliculatum (Orchid.) Cepobaculum trilamellatum (Orchid.) Chionanthus ramiflora (Ole.) Choriceras tricorne (Euphorb.) Chrysophyllum lanceolatum (Sapot.)
Cleistanthus apodus (Euphorb.) Corymbia clarksonii (Myrt.) Corymbia polycarpa (Myrt.) Croton brachypus (Euphorb.) Cymbidium canaliculatum (Orchid.) Cynodon dactylon (Poa.) Cyperus spp. (Cyper.) Dapsilanthus elatior (Restion.) Dichanthium sericeum (Poa.) Dillenia alata (Dillen.) Diospyros sp. (Eben.) Diplatia tomentosa (Loranth.) Dischidia nummularia (Asclepiad.) Dolichandrone heterophylla (Bignon.) Dysoxylum oppositifolium (Meli.) Eleocharis (Cyper.) Endiandra glauca (Laur.) Epaltes australis (Aster.) Eragrostis sp. (Poa.) Eremochloa bimaculata (Poa.) Eriachne sp. (Poa.) Erythrophleum chlorostachys (Caesalpin.)Eucalyptus chlorophylla (Myrt.) Eucalyptus hylandii (Myrt.) Eucalyptus phoenicea (Myrt.) Eucalyptus tetradonta (Myrt.) Eustrephus latifolius (Geitonoples.) Ficus virens (Mor.) Fimbristylis spp. (Cyper.) Flagellaria indica (Flagellar.) Flindersia brassii (Rut.) Flueggea virosa (Euphorb.)
Australian Centre for Tropical Freshwater Research 14
Jack Lakes Wetlands Biodiversity Assessment, November 2007 & June 2008 - APPENDICES23
A Survey of the Vegetation of Jack Lakes, November 2007 - ACTFR Report 07/33
Gardenia psidioides (Rubi.) Grevillea glauca (Prote.) Grevillea pteridifolia (Prote.) Grevillea striata (Prote.) Grewia retusifolia (Tili.) Hakea persiehana (Prote.) Heteropogon contortus (Poa.) Heteropogon triticeus (Poa.) Hyptis suaveolens* (Lam.) Hypserpa decumbens (Menisperm.) Lagerstroemia archeriana (Lythr.) Lepironia articulata (Cyper.) Leptocarpus sp. (Restion.) Leptospermum longifolium (Myrt.) Leptospermum madidum (Myrt.) Litsea macrophylla (Laur.) Livistona muelleri (Arec.) Lomandra banksii (Laxmann.) Lophostemon suaveolens (Myrt.) Ludwigia perrenis (Onagra.) Lygodium fexuosum (Lygod.) Macrostelia grandiflora (Malv.) Mallotus polyadenos (Euhorb.) Marsilea mutica (Marsil.) Melaleuca arcana (Myrt.) Melaleuca clarksonii (Myrt.) Melaleuca fluviatilis (Myrt.) Melaleuca foliolosa (Myrt.) Melaleuca leucadendra (Myrt.) Melaleuca saligna (Myrt.) Melaleuca stenostachya (Myrt.) Melaleuca viridiflora (Myrt.) Memecylon pauciflorum (Melastomat.) Millettia pinnata (Fab.) Monochoria cyanea (Ponteder.) Myrsine porosa (Myrsin.) Najas tenuifolia (Hydrocharit.)
Nauclea orientalis (Rubi.) Nelumbo nucifera (Nelumbon.) Nymphaea gigantean (Nymphae.) Nymphoides sp. (Menyanth.) Oplismenus spp. (Poa.) Oryza australiensis (Poa.) Oryza rufipogon (Poa.) Owenia venosa (Meli.) Pandanus spiralis (Pandan.) Panicum sp. (Poa.) Parinari nonda (Chrysobalan.) Parsonsia sp. (Apocyn.) Paspalidium sp. (Poa.) Petalostigma banksii (Euphorb.) Philydrum lanuginosum (Philydr.) Rhynchospora heterochaeta (Cyper.) Sarga plumosa (Poa.) Schizachyrium sp. (Poa.) Schoenus calostachyus (Cyper.) Schoenus sparteus (Cyper.) Scleria sp. (Cyper.) Siphonodon pendulus (Celast.) Strychnos lucida (Logan.) Syzygium argyropedicum (Myrt.) Syzygium forte (Myrt.) Syzygium papyraceum (Myrt.) Terminalia platyphylla (Combret.) Themeda arguens (Poa.) Themeda triandra (Poa.) Thryptomene oligandra (Myrt.) Triumfetta rhomboidea* (Tili.) Utricularia sp. (Lentibular.) Vallisneria gracilis (Hydrocharit.) Vandasina retusa (Fab.) Vetiveria sp. (Poa.) Vitex helogiton (Lami.)
Australian Centre for Tropical Freshwater Research 15

Jack Lakes Wetlands Biodiversity Assessment, November 2007 & June 2008 - APPENDICES24
A Survey of the Vegetation of Jack Lakes, November 2007 - ACTFR Report 07/33
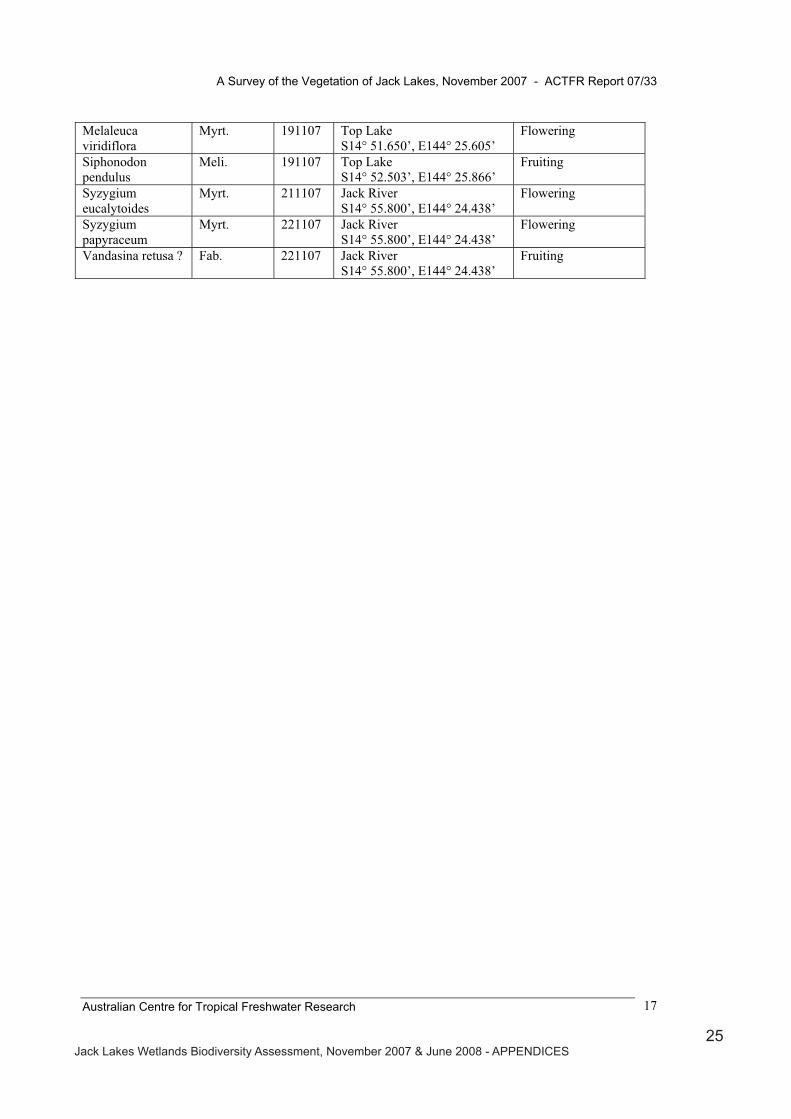
APPENDIX 3. List of Voucher Specimens collected at Jack Lakes, 18-22 November 2007.
Species Family Date GPS NotesAlbizia sp. ? Mimos. 191107 Top Lake
S14° 52.503’, E144° 25.866’Flowering
Asteromyrtus symphyocarpa
Myrt. 181107 Middle Lakes S14° 53.576’, E144° 25.258’
Fruiting
Atractocarpus sessilis
Rubi. 221107 Jack River S14° 55.800’, E144° 24.438’
Fruiting
Barringtoniaacutangula
Lecythid. 221107 Lower Lakes, Lake 3b S14° 55.177’, E144° 24.762’
Flowering and fruiting
Baumea sp. Cyper. 221107 Jack River S14° 55.800’, E144° 24.438’
Flowering
Calycopeplus casuarinoides
Euphorb. 221107 Jack River S14° 55.800’, E144° 24.438’
Fruiting
Cepobaculum canaliculatum
Orchid. 221107 Lower Lakes, Lake 3c S14° 55.272’, E144° 24.752’
Fruiting, growing on Melaleuca viridiflora
Cepobaculum trilamellatum
Orchid. 181107 Top Lake S14° 50.923’, E144° 25.527’
Flowering and fruiting, growing on Melaleucastenostachya
Cyperus sp. Cyper. 221107 Top Lake S14° 51.547’, E144° 25.703’
Flowering
Diplatia furcata Loranth. 221107 Jack River S14° 55.800’, E144° 24.438’
Flowering, growing on Melaleuca leucadendra
Dischidia mammalaria
Asclepiad. 221107 Jack River S14° 55.800’, E144° 24.438’
Flowering
Eleocharis sp. Cyper. 191107 Top Lake S14° 51.592’, E144° 25.535’
Sterile
Epaltes australis Aster. 191107 Top Lake S14° 51.592’, E144° 25.535’
Fruiting
Erythrophleum chlorostachys
Caesalpin. 191107 Top Lake S14° 52.503’, E144° 25.866’
Flowering
Grevillea glauca Prot. 221107 Top Lake S14° 52.503’, E144° 25.866’
Fruiting
Grevillea striata Prot. 221107 Top Lake S14° 52.503’, E144° 25.866’
Fruiting
Leptospermum longifolium
Myrt. 221107 Jack River S14° 55.800’, E144° 24.438’
Flowering and fruiting
Livistona muelleri (1)
Arec. 191107 Top Lake S14° 52.567’, E144° 25.964’
Sterile
Livistona muelleri (2)
Arec. 221107 Jack River S14° 55.922’, E144° 24.434’
Fruiting
Lomandra banksii Laxmann. 201107 Middle Lakes, east side S14° 53.350’, E144° 26.099’
Flowering and fruiting
Melaleucafoliolosa
Myrt. 221107 Bottom Lakes S14° 54.901’, E144° 24.569’
Sterile
Melaleucaleucadendra
Myrt. 221107 Top Lake S14° 51.547’, E144° 25.703’
Flowering
Melaleucastenostachya
Myrt. 191107 Top Lake S14° 51.000’, E144° 25.584’
Fruiting, host tree of Cepobaculum trilamellatum
Australian Centre for Tropical Freshwater Research 16
Jack Lakes Wetlands Biodiversity Assessment, November 2007 & June 2008 - APPENDICES25
A Survey of the Vegetation of Jack Lakes, November 2007 - ACTFR Report 07/33
Australian Centre for Tropical Freshwater Research 17
Melaleucaviridiflora
Myrt. 191107 Top Lake S14° 51.650’, E144° 25.605’
Flowering
Siphonodon pendulus
Meli. 191107 Top Lake S14° 52.503’, E144° 25.866’
Fruiting
Syzygium eucalytoides
Myrt. 211107 Jack River S14° 55.800’, E144° 24.438’
Flowering
Syzygium papyraceum
Myrt. 221107 Jack River S14° 55.800’, E144° 24.438’
Flowering
Vandasina retusa ? Fab. 221107 Jack River S14° 55.800’, E144° 24.438’
Fruiting
Jack Lakes Wetlands Biodiversity Assessment, November 2007 & June 2008 - APPENDICES26
A S
urve
y of
the
Veg
etat
ion
of J
ack
Lake
s, N
ovem
ber 2
007
- A
CTF
R R
epor
t 07/
33
APP
EN
DIX
4.
Sate
llite
imag
ery
show
ing
wet
and
dry
seas
on in
unda
tion
leve
ls.
Febr
uary
199
6 (w
et s
easo
n)
Apr
il 19
97 (p
ost w
et s
easo
n)
Aug
ust 2
003
(dry
sea
son)
Sour
ces:
Arc
hiva
l Lan
dsat
TM
imag
es: M
aps p
repa
red
by L
. Lym
burn
er, A
CTF
R.
Aus
tralia
n C
entre
for T
ropi
cal F
resh
wat
er R
esea
rch
18

Jack Lakes Wetlands Biodiversity Assessment, November 2007 & June 2008 - APPENDICES27
APPENDIX C: Terrestrial Invertebrates Report - Stephanie Seuss (Griffith University)
1
Invertebrates of Jack Lakes Stephanie Suess Griffith University 25/9/08
Trapping methods
Flying insects were targeted for sampling using malaise trapping techniques. Malaise traps are made
of combination white and black polyamide textile, designed to be suspended in the terrain and fixed by
steel pins (26.61 height 120 cm, breadth 100 cm, length 150 cm). Malaise, are a flight interception
trap, which is placed 90 degrees to a natural insect flight line. A flying invertebrate once stopped by
the netting instinctively flies upward towards the roof and into the collection bottle, which in this case
contained tissues covered in household fly spray as the insecticide. A Malaise trap is used to ascertain
the diversity within orders on the sites and, being a 'flight intercept' trap, it is particularly good at
catching orders of flying insect, which tend to feature; Diptera (flies), Lepidoptera (moths &
butterflies), Neuroptera (lacewings), Coleoptera (beetles), Orthoptera (grasshoppers & crickets),
Odonata (damselflies & dragonflies).
Insect sampling design
Traps were left on each site, top, middle, and lower lakes of Jack Lakes. One was placed in the
riparian zone, which is close to and influenced by the body of water, and the other in the woodland,
which is further away from the water. The Malaise traps were left out for approximately 24 hours on
each site and collected at as close to the same times as possible. The collected samples were preserved
in methylated spirits.
Traps were set at the top lake on the 17/6/18, one in the riparian (close to water) and one in the
woodland (further from water) zone. On the 18/6/08 both were moved to the middle site, then the
bottom site on the 19/6/08. Traps were set in the afternoon, and removed at around the same time of
day, 24 hours later, preserving collected samples in methylated spirites. Once preserved and labeled,

Jack Lakes Wetlands Biodiversity Assessment, November 2007 & June 2008 - APPENDICES28
2
samples were transported to Griffith University (Brisbane), and sorted into the taxonomic orders:
Collembola; Blattodea; Orthoptera; Heteroptera; Neuroptera; Coleoptera; Diptera; Trichoptera;
Lepidoptera; Hymenoptera; Araneae; and Odonata. Numbers were tallied and used as raw data.
Results
Table 1. Raw data table of orders at each site from Malaise traps
Bottom Lake (3C) Middle Lake Top Lake
Orders Woodland Riparian Woodland Riparian Woodland Riparian
Collembola 0 12 1 0 0 4
Blattodea 2 2 0 0 0 4
Orthoptera 0 1 0 0 0 1
Heteroptera 10 10 26 11 6 3
Neuroptera 5 5 0 0 0 2
Coleoptera 3 10 2 3 0 4
Diptera 113 233 247 200 141 44
Trichoptera 2 9 0 0 0 0
Lepidoptera 5 15 3 7 11 16
Hymenoptera 11 16 10 9 24 6
Araneae 2 0 0 2 0 2
Odonata 0 0 1 0 0 0
Using the raw data table, graphs were produced using the Windows Excel program to visually
show the comparisons between lakes, each looking at different Orders with ample abundance,
which are depicted on figures 1 to 5.

Jack Lakes Wetlands Biodiversity Assessment, November 2007 & June 2008 - APPENDICES29
3
Figure 1. Quantities of Heteroptera at Lakes Figure 2. Quantities of Hymenoptera at Lakes
Figure 3. Quantities of Lepidoptera at Lakes Figure 4. Quantities of Coleoptera at Lakes
Quantities of Diptera throughout sites
0
50
100
150
200
250
300
Bottom Lake Middle Lake Top Lake
Sites
# of D
ipte
ra
Woodland
Riparian
Figure 5. Quantities of Diptera at Lakes
Quantities of Heteroptera throughoutsites
0
5
10
15
20
25
30
Bottom Lake Middle Lake Top Lake
Sites
Woodland
Riparian
Quantities of Hymenoptera throughout sites
0
5
10
15
20
25
30
Bottom Lake Middle Lake Top Lake
sites
Woodland
Riparian
Quantities of Coleoptera throughout Lake sites
0
2
4
6
8
10
12
Bottom Middle Top
Sites
# of Coleoptera
Woodland
Riparian
Quantities of Lepidoptera throughout Lake sites
0
2
4
6
8
10
12
14
16
18
Bottom Middle Top
Sites
# of Lepidoptera
Woodland
Riparian

Jack Lakes Wetlands Biodiversity Assessment, November 2007 & June 2008 - APPENDICES30
4
Using the Statistical Analyst System, SAS, a table of means shows there is larger variance and higher
abundance closer to the water as shown in figure 6.
Table of means for Diptera
Figure 6. SAS table of means for Diptera comparing riparian and woodland
Figure 7. Multi Dimensional Scaling, using square root Bray, Curtis dissimilarity (PRIMER)

Jack Lakes Wetlands Biodiversity Assessment, November 2007 & June 2008 - APPENDICES31
5
Cluster analysis was conducted using a PRIMER algorithm, using each site as an a-priori cluster.
Multi-dimensional scaling (MDS) was used to produce ordination plots illustrating the relationship
between sites, using the Bray-Curtis dissimilarity measure. This figure depicts the similarities of all of
the sites, illustrating that riparian and woodland sites are not clearly distinguished from each other.
Discussion
Invertebrates constitute a major component of diverse ecosystems and play a lead roll in functioning of
ecosystem processes, and are known to be one of the most important groups in the natural world (Kim
1993). As insects are easier to catch, track, more abundant and diverse, and be as trackers of
ecosystem health, it is of most importance that they are studies in a methodical way for a
comprehensive look at particular ecology health. They are rarely addressed effectively within
biodiversity monitoring programs, although they are given overwhelmingly dominant contribution in
the tracking of changes of biological integrity of ecosystems (Anderson et al 2004), referring to the
ecological complexity of the entire body of organisms and their environment, and the related
ecological processes (You et al 1993).
As Malaise traps are biased toward winged invertebrates, they are expected to collect high of Diptera,
Hymenoptera, Coleoptera, Heteroptera, and Lepidoptera seen in Table 1. Because of timeframe
requirements, Orders were the only identification level possible at this time
Time restrictions also effected the sampling, so two replicates were placed on each site (woodland and
riparian), or looking at it differently; only one at each division. This causes major problems when
trying to perform statistical analysis upon the data, because it gives the samples incredibly low power.
Statistical Power reflects the ability to detect real effects as the size of the study sample is critical to
producing meaningful results (Williams, 1997). Low power produces little chance to detect a
significant effect when looking at a hypothesis test (High 2000), therefore statistical analysis was
unable to be run upon this data.
Using the raw data (Table 1), the Diptera are evidently the higher in abundance throughout all the lake
sites, dominating in the Woodland zones in the Middle and Top Lakes (Figure 5). The Diptera also had
the largest variety in species diversity compared to any other of the orders
Jack Lakes Wetlands Biodiversity Assessment, November 2007 & June 2008 - APPENDICES32
6
The Woodland Zone shows higher abundance in Hymenoptera, Heteroptera, and Diptera, with each
order dominating a different lake sites (figures 1, 2, & 5). Lepidoptera however, show significantly
higher numbers in the Riparian zone in the Bottom and Top Lakes (figure 3).
The surprising find, is the lack of Odonata (dragonflies) found in the traps within the riparaian zones
because of the huge numbers observed on site, which suggests that dragonflies are not easily trapped
using this particular method. Although the lack of replications prevented statistical analysis, the
presentation of data shows at this small scale of information attained doesn’t give enough information
and the whole representation of each sites. It is clear that any further investigation into the diversity of
insects in this area, and the patterns associated with the riparian and woodland zones, requires further
sampling effort.
Bibliography
Andersen, A. N., Fisher, A., Hoffmann, B. D., Read, J. L., Richrards, R., 2004 “Use of terrestrial invertebrates for biodiversity monitoring in Australian rangelands, with particular reference to ants”Ecological Society of Australia. Volume 29 Issue 1, Pages 87 - 92
CSIRO, “Establishing an ECOWATCH project” (www.csiro.au/files/files/pfe8.pdf, (20/9/08)
High, R. 2000, “Computing News” (http://cc.uoregon.edu/cnews/summer2000/statpower.html),(20/9/08)
Raper, C., 2000 “Malaise Trapping”, (http://www.chrisraper.org.uk/Html/malaise.htm), (20/9/08)
You, M., Xu, D., Cai, H., Vasseur, L., 1993 “Biodiversity, conservation and inventory; why insects matter”, Fujiun Agriculture and Forestry University
Jack Lakes Wetlands Biodiversity Assessment, November 2007 & June 2008 - APPENDICES33
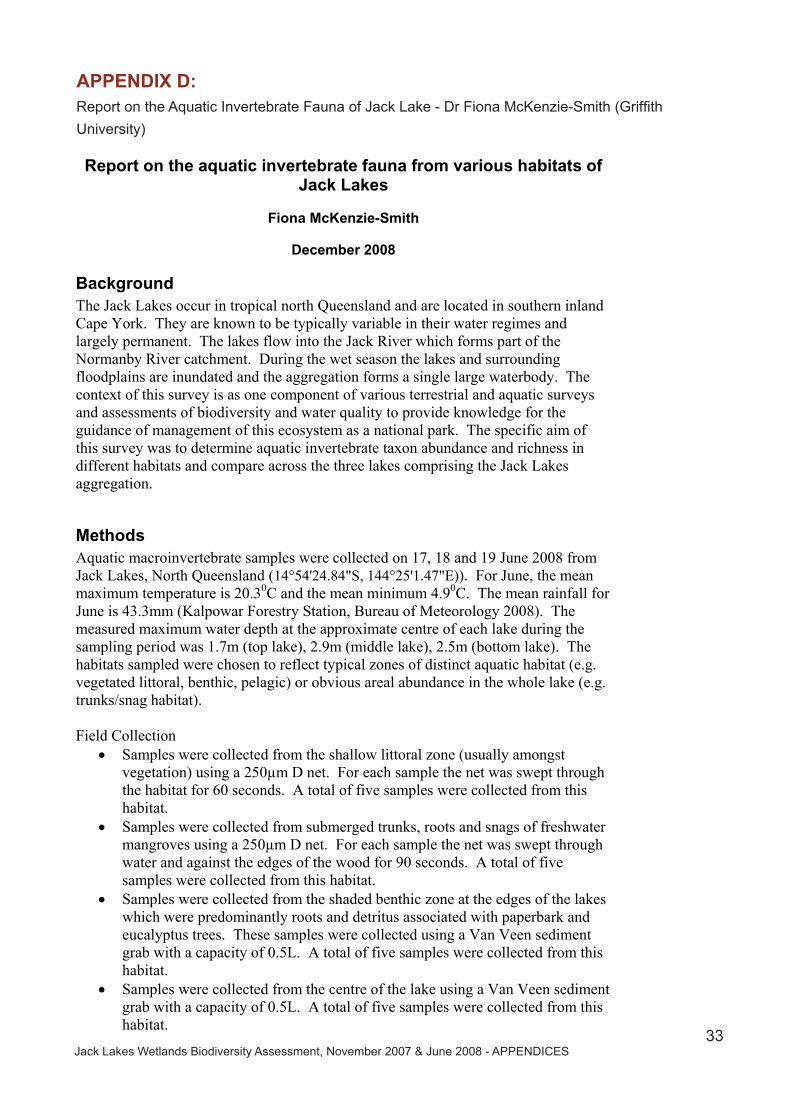
APPENDIX D: Report on the Aquatic Invertebrate Fauna of Jack Lake - Dr Fiona McKenzie-Smith (Griffith University)
Report on the aquatic invertebrate fauna from various habitats of Jack Lakes
Fiona McKenzie-Smith
December 2008
Background The Jack Lakes occur in tropical north Queensland and are located in southern inland Cape York. They are known to be typically variable in their water regimes and largely permanent. The lakes flow into the Jack River which forms part of the Normanby River catchment. During the wet season the lakes and surrounding floodplains are inundated and the aggregation forms a single large waterbody. The context of this survey is as one component of various terrestrial and aquatic surveys and assessments of biodiversity and water quality to provide knowledge for the guidance of management of this ecosystem as a national park. The specific aim of this survey was to determine aquatic invertebrate taxon abundance and richness in different habitats and compare across the three lakes comprising the Jack Lakes aggregation.
Methods Aquatic macroinvertebrate samples were collected on 17, 18 and 19 June 2008 from Jack Lakes, North Queensland (14°54'24.84"S, 144°25'1.47"E)). For June, the mean maximum temperature is 20.30C and the mean minimum 4.90C. The mean rainfall for June is 43.3mm (Kalpowar Forestry Station, Bureau of Meteorology 2008). The measured maximum water depth at the approximate centre of each lake during the sampling period was 1.7m (top lake), 2.9m (middle lake), 2.5m (bottom lake). The habitats sampled were chosen to reflect typical zones of distinct aquatic habitat (e.g. vegetated littoral, benthic, pelagic) or obvious areal abundance in the whole lake (e.g. trunks/snag habitat).
Field Collection � Samples were collected from the shallow littoral zone (usually amongst
vegetation) using a 250µm D net. For each sample the net was swept through the habitat for 60 seconds. A total of five samples were collected from this habitat.
� Samples were collected from submerged trunks, roots and snags of freshwater mangroves using a 250µm D net. For each sample the net was swept through water and against the edges of the wood for 90 seconds. A total of five samples were collected from this habitat.
� Samples were collected from the shaded benthic zone at the edges of the lakes which were predominantly roots and detritus associated with paperbark and eucalyptus trees. These samples were collected using a Van Veen sediment grab with a capacity of 0.5L. A total of five samples were collected from this habitat.
� Samples were collected from the centre of the lake using a Van Veen sediment grab with a capacity of 0.5L. A total of five samples were collected from this habitat.

Jack Lakes Wetlands Biodiversity Assessment, November 2007 & June 2008 - APPENDICES34
� Samples were collected from the subsurface pelagic zone using a 75µm plankton trawl net. Three replicate trawls (each 60m) were conducted in the morning and afternoon on each lake.
In the field samples were stained with rose bengal and preserved in 70% alcohol.
Laboratory Processing Samples were evaluated for processing by examining a subset of habitats. This evaluation indicated that a subsampling procedure would be required. Samples were rinsed into a 250µm sieve and the sample was floated in water and then evenly distributed in a shallow dish. A 32 section grid was then applied and 8 random sections were selected and the sample contents removed using a pipette. The selected sample sections were then recombined to produce a subsample comprising of a total of 25% of the original sample. Samples were then picked for fauna using a stereo (dissecting) microscope. All fauna macroinvertebrate fauna were removed, however, in some samples the abundance of microcrustacea meant that organisms remained after 1.5 hours picking.
Due to the high number of individuals per sample and time constraints, for each lake, fauna were enumerated and identified to family or a practicable taxonomic level from three samples from the following habitats; littoral vegetation, submerged trunks and snags, centre benthic sediment and shaded littoral benthic roots.
Univariate and multivariate analyses were performed on fourth root transformed taxonomic abundance data. The data are coded and samples with the prefix 1000 are top lake; 2000 middle lake; 3000 bottom lake. The habitats are coded using a suffix so that 1 represents the vegetated littoral zone; 2 trunk/snag habitat; 3 benthic centre; 4 shaded benthic roots. For example, 1003 is the top lake benthic centre.
ResultsThe composition of organic material and sediments in samples was variable for each habitat type and between lakes. For example, benthic centre samples from top lake were observed to be rich in silt and clay, apparently more so than middle lake, and both contained more silt and clay than bottom lake samples. For the vegetated littoral zone, a typical sample contained fine particulate organic matter and detritus (approximately 80%) with the remainder being macrophyte or coarse particulate matter. Benthic roots and trunk/snag samples contained wood, bark, whole leaves and roots comprising up to 80% or 20% of sample organic material respectively. The remainder of these samples was fine particulate organic material and detritus. Benthic root samples from middle lake contained gravel whereas samples from this habitat in the top lake contained silt and clay.
Samples from the benthic centre were generally not well preserved compared to all other samples, this may have been due to a chemical or physical aspect of the sediment. Therefore, these samples are thought to have been an underestimate of abundance at least and, perhaps, richness.
Microcrustacea, and sometimes chironomids, were so abundant in many samples that after 1.5 hours of picking 100’s and 1000’s still remained in subsamples. This was

Jack Lakes Wetlands Biodiversity Assessment, November 2007 & June 2008 - APPENDICES35
particularly noted for samples collected from trunk/snag habitat from the top and middle lakes.
Table 1 (attached excel document) provides a list of the taxa that were identified during this survey. For some taxa, gross morphology or known characteristics were used as a guide to separation beyond the family level.
The microcrustacea and acarina are noted to be taxonomically diverse however due to time constraints these fauna were enumerated but identified only to a coarse taxonomic level.
Univariate diversity indices are provided in Table 2. The indicies are S : the total species - the number of species in each sample. i.e. species with non zero counts. N : total individuals - the number of individuals in each sample representing accumulated species counts. D : Margalef's species richness for each sample. It is a measure of the number of species present, making some allowance for the number of individuals. J� : Pielou's evenness- this is a measure of equitability, a measure of how evenly the individuals are distributed among the different species. H� : Shannon-Wiener diversity index.
Table 2
Sample S N d J' H'(loge)1001 35 64 8.173 0.9637 3.4261002 39 62 9.214 0.9746 3.571003 14 19 4.454 0.9861 2.6021004 24 37 6.376 0.9732 3.0932001 55 88 12.05 0.978 3.9192002 41 67 9.503 0.977 3.6282003 14 19 4.444 0.9745 2.5722004 21 33 5.717 0.9758 2.9713001 40 67 9.288 0.9805 3.6173002 29 50 7.16 0.9777 3.2923003 10 13 3.543 0.9778 2.2523004 33 43 8.487 0.9888 3.457
The highest numbers of taxa were observed in samples from the vegetated littoral zone and the snag/trunk habitats from all lakes. The lowest numbers of taxa were from the benthic centre habitat from all lakes. There were relatively high numbers of taxa observed in samples from the shaded benthic root zone of the bottom lake. Taxon richness was high in samples from the vegetated littoral zone and the trunk/snag habitat, except for the latter habitat in the bottom lake. In the bottom lake, the taxon richness was higher in the shaded benthic root zone compared with the other lakes and to the trunk/snags samples from this lake. There was no significant difference amongst the diversity measures (ANOVA F (2,9) = 0.1237 p>0.05). The most variability in taxon richness observed amongst habitats within lakes was from middle lake. Evenness was lowest in the vegetated littoral zone of the top lake and high amongst samples from the benthic centre habitats from all lakes. Evenness was

Jack Lakes Wetlands Biodiversity Assessment, November 2007 & June 2008 - APPENDICES36
also high amongst samples from the shaded benthic root zone in the bottom lake. Diversity was lowest in samples from the benthic centres of all lakes. Diversity was highest in samples from the vegetated littoral zone and trunk/snag habitat from all lakes and in the shaded benthic root zone of the top and bottom lakes.
The degree of association between lakes and habitats is represented in a dendogram shown in Figure 1. This figure illustrates that samples from benthic centre habitat are unique from other habitats, with the top lake being more distinct from the other two lakes. Samples from the benthic root zone are linked with other habitats but also distinct for the top and bottom lakes whereas this habitat from the middle lake was most similar to the trunk/snag habitat from the bottom lake. Samples from the vegetated littoral zone from the top lake were most similar to each other and closely associated with the same habitat type from other lakes. The vegetated littoral zone samples from the bottom lake were most similar to the middle lake vegetated littoral zone and trunk/snag habitat.
A plot of multi-dimensional scaling based on a bray-curtis similarity measure (Figure 2. MDS stress 0.03) illustrates a similar pattern to that described above for the dendogram where the strongest cluster of similarity occurs amongst samples from the vegetated littoral zone. This figure also illustrates that the middle and bottom lake have samples that are relatively interspersed for the vegetated littoral and trunk/snag habitat and compared with the top lake. The most dispersed samples overall are associated with the bottom lake.

Jack Lakes Wetlands Biodiversity Assessment, November 2007 & June 2008 - APPENDICES37
1004
3004
2004
3002
1001
1002
3001
2001
2002
1003
2003
3003
0204060
Ranks
Figu
re 1
Den
dogr
am r
epre
sent
ing
prox
imity
of r
elat
ions
hips
of d
iffer
ent h
abita
ts fr
om e
ach
lake
.

Jack Lakes Wetlands Biodiversity Assessment, November 2007 & June 2008 - APPENDICES38
Figure 2
-1.0-0.8
-0.6-0.4
-0.20.0
0.2
0.4
0.6
0.8
-2.0-1.5
-1.0-0.5
0.00.5
1.01.5
-0.8
-0.6
-0.4
-0.20.0
0.20.4
0.60.8
1.0
ZD
ata
X Data
YD
ata
3D MDS plot of aquatic taxa from top, middle and bottom lakes from 4 different habitat types
100110021003100420012002200320043001
3002
3003
3004

Jack Lakes Wetlands Biodiversity Assessment, November 2007 & June 2008 - APPENDICES39
Discussion Taxa observed represented a variety of trophic levels and dynamics and clear distinction between habitats. There was a high representation of taxa that have desiccation resistant life stages or those that are able to relocate to suitable habitat through an aerial adult stage. These features are typical of Australian wetlands.Invertebrate fauna represented a range of functional groups including bactivores (e.g. microcrustacea, algal/diatom grazers (e.g. gastropods, chironomids, caddisflys, mayflys) and detritivores (e.g. mayflys, caddisflys) along with predators (e.g. beetles, dragonflys, true bugs).
The observed diverse and species rich littoral vegetated zone reflects the complexity of this habitat resource. A less obvious but similarly diverse and species rich habitat was the trunk/snag habitat which was prevalent in areal extent at the time of sampling. Due to water regimes, both habitats are variable in terms of availability and extent yet potentially provide abundant food and refuge to support bacteria, algae and other primary, secondary and higher order trophic consumers. The richness and diversity observed is comparable with other Australian intermittent aquatic habitats.
Samples collected from middle lake’s vegetated littoral zone were the most taxon rich and diverse. During the sampling period this lake was the most extensive in terms of aquatic habitat and the indicies noted are comparable with other healthy, permanent freshwaters in Australia. This lake was also observed to have the most dense and extensive stands of trees associated with the shore lines, compared to other lakes where dense tree growth was patchy.

Jack Lakes Wetlands Biodiversity Assessment, November 2007 & June 2008 - APPENDICES40
Dense fringe of vegetation on shore of middle lake
The top lake had different faunal characteristics from other lakes and interpretation and understanding of these differences will require further consideration of physical and chemical processes, including features of the water regime (timing, frequency, duration, extent and depth). This lake was highly turbid at the time of sampling which was observed on a previous end of wet season survey. There was one obvious temporal variation in the lake characteristics being the vast extent of coverage by emergent macrophytes across the surface of the lake that were not observed during the end of wet season survey.

Jack Lakes Wetlands Biodiversity Assessment, November 2007 & June 2008 - APPENDICES41
Emergent macrophytes in the turbid waters of top lake
The bottom lake showed some overlap of taxon characteristics in samples collected in the shaded benthic root zone and the trunk/snag habitats of the middle lake (Figure 1). This may be attributable to the factors associated with water regime (inundation more recent in middle lake samples) or a decreased siltation in the shaded benthic roots of the bottom lake compared with other lakes.
A further observation was the areal extent of subsurface macrophytes due to the extensive photic zone in the bottom lake which would have extended the range of resources which in other lakes was limited to a narrow band of littoral zone vegetation. Water clarity would also increased foraging efficiency of predatory fauna.Numerous schools of small sized fish were observed foraging in littoral and extended macrophyte zone of the bottom lake. A comparative study of the morphology of the lakes along with knowledge of the key components of their water regimes would further inform hypotheses about the overlap in characteristics between bottom and middle lake habitats. The occurrence of a particular fish assemblage is likely to be determined by chance as waterbodies contract and become separated following wet season floodplain inundation. This may result in unique spatial and temporal assemblage characteristics and consequent pressures on the invertebrate prey which are a key food resource for small bodied fish.
Jack Lakes Wetlands Biodiversity Assessment, November 2007 & June 2008 - APPENDICES42
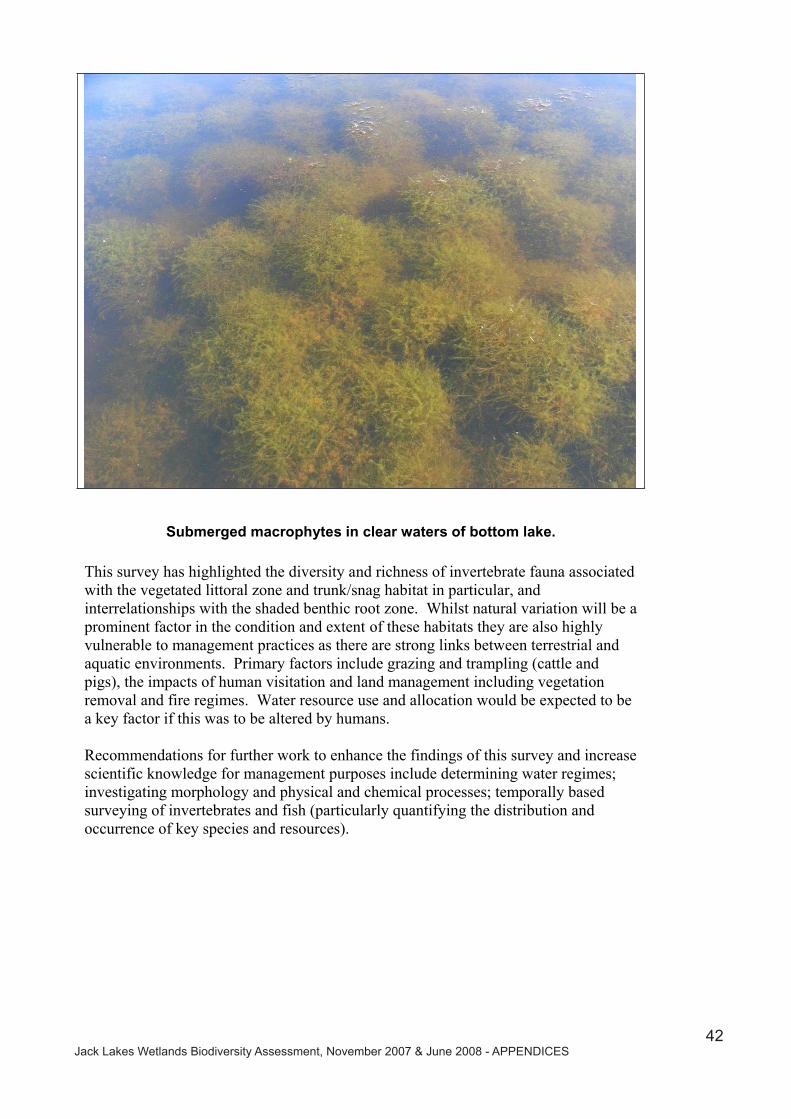
Submerged macrophytes in clear waters of bottom lake.
This survey has highlighted the diversity and richness of invertebrate fauna associated with the vegetated littoral zone and trunk/snag habitat in particular, and interrelationships with the shaded benthic root zone. Whilst natural variation will be a prominent factor in the condition and extent of these habitats they are also highly vulnerable to management practices as there are strong links between terrestrial and aquatic environments. Primary factors include grazing and trampling (cattle and pigs), the impacts of human visitation and land management including vegetation removal and fire regimes. Water resource use and allocation would be expected to be a key factor if this was to be altered by humans.
Recommendations for further work to enhance the findings of this survey and increase scientific knowledge for management purposes include determining water regimes; investigating morphology and physical and chemical processes; temporally based surveying of invertebrates and fish (particularly quantifying the distribution and occurrence of key species and resources).

Jack Lakes Wetlands Biodiversity Assessment, November 2007 & June 2008 - APPENDICES43
Terrestrial surrounds (near shores of bottom lake)

Jack Lakes Wetlands Biodiversity Assessment, November 2007 & June 2008 - APPENDICES44
� TABLE �1:�Aqu
atic�In
verteb
rates�
Jack
Lak
es (1
4°54
'24.
84"S
, 144
°25'
1.47
"E)
aqua
tic in
vert
ebra
te fa
una
asse
mbl
age
from
3 la
kes a
nd 4
hab
itats
C
olle
ctor
s F. M
cKen
zie-
Smith
, Ste
phan
ie S
uess
& M
alco
lm M
cCol
lum
. Id
entif
ied
by F
. McK
enzi
e-Sm
ith
CO
DE
1001
= T
op L
ake
litto
ral v
eget
atio
n
2001
= M
iddl
e La
ke li
ttora
l veg
etat
ion
30
01 =
Bot
tom
Lak
e lit
tora
l veg
etat
ion
1002
= T
op L
ake
trun
k/sn
ag
2002
= M
iddl
e La
ke tr
unk/
snag
30
02 =
Bot
tom
Lak
e tr
unk/
snag
1003
= T
op L
ake
bent
hic
cent
re se
dim
ent
2003
= M
iddl
e La
ke b
enth
ic c
entr
e se
dim
ent
3003
= B
otto
m L
ake
bent
hic
cent
re se
d 10
04 =
Top
Lak
e sh
aded
ben
thic
root
s 16
/6/2
008
2004
= M
iddl
e La
ke sh
aded
ben
thic
root
s 17
/6/2
008
3004
= B
otto
m L
ake
shad
ed b
enth
ic
root
s 18/
6/20
08
PHYLUM�
CLASS�
ORD
ER�
FAMILY�
Sub�FA
MILY�
GEN
US�&�SPE
CIES�
COMMON�
NAME�
1001
�10
02�
1003
�10
04�
2001
�20
02�
2003
�20
04�
3001
�30
02�
3003
�� 30
04�
Nem
atop
hora�
��
Gordiidae
��
�ho
rseh
air�
worm�
0�0�
0�0�
1�0�
0�0�
0�0�
0�0�
Nem
atod
a��
���
���
roun
d�worms�
36�
6�0�
27�
1�2�
1�1�
0�3�
0�0�
Playhe
lminthes�
Turbellaria�
��
��
flatw
orm�
19�
5�0�
1�0�
4�0�
3�1�
28�
1�5�
Ann
elida�
Oligocha
eta�
��
�Ch
aetoga
ster�sp.�
segm
ented�
worm�
43�
6�1�
1�0�
1�1�
�3�
2�0�
0�
Ann
elida�
Oligocha
eta�
�type
�A�
��
segm
ented�
worm�
51�
47�
3�20
�7�
24�
2�23
�1�
15�
0�0�
Ann
elida�
Oligocha
eta�
�type
�B�
��
segm
ented�
worm�
9�3�
0�0�
0�0�
0�0�
1�0�
0�0�
Ann
elida�
Oligocha
eta�
�type
�C�
��
segm
ented �
worm�
0�0�
0�0�
0�2�
0�0�
9�35
�0�
2�
Ann
elida�
Oligocha
eta�
�Tu
bificidae
��
�segm
ented �
worm�
0�0�
1�0�
0�0�
0�1�
0�0�
0�3�
Ann
elida�
Hirud
inea
��
Glossipho
niidae
��
�leech�
0�0�
0�0�
0�0�
0�0�
1�0�
0�0�
Cnidaria�
Hyd
rozoa�
�Hyd
rida
e��
�hydra�
7�1�
0�0�
1�1�
0�0�
1�6�
0�2�
Mollusca�
Gastrop
oda�
�Plan
orbida
e��
�Ameriann
a�snails�
0�0�
0�1�
10�
17�
0�6�
2�9�
0�7�
Mollusca�
Gastrop
oda�
�Plan
orbida
e��
�Helicorbis�
snails�
0�6�
0�0�
9�0�
0�0�
0�13
�0�
6�Mollusca�
Gastrop
oda�
�Ancylidae
��
�snails�
0�0�
0�1�
0�2�
0�0�
0�0�
0�0�
Arthrop
oda�
Crustacea�
(branchiop
oda)�
Diplostraca�
��
Clad
ocera�&�
Concho
straca�
water�flea
s�&�
clam
�shrim
ps�
360�
230�
14�
102�
17�
98�
35�
23�
27�
85�
18�
11�
Arthrop
oda�
Crustacea�
Ostracoda
��
�Taxon�A�spp
.�seed
�shrim
ps�
38�
5�1�
2�49
�13
�0�
1�27
�27
�0�
1�Arthrop
oda�
Crustacea�
Ostracoda
��
�Taxon�B�spp.�
seed
�shrim
ps�
3�14
�3�
43�
4�7�
0�22
�12
�10
�0�
19�
Arthrop
oda�
Crustacea�
(cop
epod
a)�
Cyclop
oida
��
��
cope
pods�
1121
�10
6�21
�44
�87
�13
7�2�
39�
35�
41�
1�12
�
Arthrop
oda�
Crustacea�
(cop
epod
a)�
Calano
ida�
��
�cope
pods�
58�
0�0�
0�1�
6�0�
0�0�
0�1�
0�

Jack Lakes Wetlands Biodiversity Assessment, November 2007 & June 2008 - APPENDICES45
PHYLUM�
CLASS�
ORD
ER�
FAMILY�
Sub�FA
MILY�
GEN
US�&�SPE
CIES�
COMMON�
NAME�
1001
�10
02�
1003
�10
04�
2001
�20
02�
2003
�20
04�
3001
�30
02�
3003
�� 30
04�
Arthrop
oda�
Crustacea�
(cop
epod
a)�
Harpa
cticoida
��
��
cope
pods�
66�
0�0�
0�0�
0�0�
0�0�
0�0�
0�
Arthrop
oda�
Crustacea�
(malacostraca)�
Decap
oda�
Atyidae
��
�shrimp�
1�5�
0�0�
8�38
�0�
0�7�
0�0�
5�Arthrop
oda�
Arachnida
��
Araen
ae�(terr.)�
��
spider�
0�1�
0�0�
0�1�
0�0�
0�0�
0�0�
Arthrop
oda�
Acarina
���
��
��water�m
ites�
26�
45�
2�0�
21�
4�1�
2�89
�6�
1�1�
Arthrop
oda�
Insecta�
Ephe
merop
tera�
Caen
idae
��
�mayfly
�1�
3�0�
0�17
�67
�2�
0�41
�1�
1�1�
Arthrop
oda�
Insecta�
Ephe
merop
tera�
Baetidae�
��
mayfly
�5�
3�3�
0�68
�38
�13
�0�
54�
36�
1�0�
Arthrop
oda�
Insecta�
Odo
nata�
(Zygop
tera)�
Coen
oagrionida
e��
�da
mselfly�
0�4�
0�0�
10�
27�
0�0�
7�0�
0�2�
Arthrop
oda�
Insecta�
Odo
nata�
(Zygop
tera)�
Proton
eurida
e��
�da
mselfly�
0�0�
0�0�
2�0�
0�0�
0�0�
0�0�
Arthrop
oda�
Insecta�
Odo
nata�
(Zygop
tera) �
Calopterygidae
��
�da
mselfly�
0�0�
0�0�
0�0�
0�0�
1�0�
0�0�
Arthrop
oda�
Insecta��
Odo
nata�
(Zygop
tera)�
Diphleb
iidae
��
�da
mselfly�
0�0�
0�0�
0�0�
0�0�
0�0�
0�0�
Arthrop
oda�
Insecta��
Odo
nata�
(Zygop
tera)�
��
Immature�
specim
ens�
damselfly�
1�2�
0�1�
8�10
�0�
0�21
�0�
0�3�
Arthrop
oda�
Insecta��
Odo
nata�
(Epiproctoph
ora)�
Lind
eniid
ae�
��
dragon
fly�
0�0�
0�0�
1�3�
0�0�
0�0�
0�0�
Arthrop
oda�
Insecta��
Odo
nata�
(Epiproctoph
ora)�
Hem
icordu
lia�
��
dragon
fly�
1�0�
0�0�
0�0�
0�0�
0�0�
0�0�
Arthrop
oda�
Insecta��
Odo
nata�
(Epiproctoph
ora)�
Libe
llulid
ae�
��
dragon
fly�
2�25
�0�
0�13
�14
�0�
0�0�
0�0�
1�
Arthrop
oda�
Insecta��
Odo
nata�
(Epiproctoph
ora)�
Gom
phidae
��
�dragon
fly�
1�1�
0�0�
0�0�
0�0�
0�0�
0�0�
Arthrop
oda�
Insecta��
Odo
nata�
(Epiproctoph
ora)�
Austrocordu
liida
e��
�dragon
fly�
0�0�
0�0�
0�0�
0�0�
1�0�
0�0�
Arthrop
oda�
Insecta��
Odo
nata�
(Epiproctoph
ora)�
Macromiid
ae�
��
dragon
fly�
0�6�
0�0�
9�1�
0�0�
0�0�
0�1�
Arthrop
oda�
Insecta��
Odo
nata�
(Epiproctoph
ora)�
��
Immature�
specim
ens�
dragon
fly�
2�1�
0�5�
1�3�
0�0�
8�0�
0�1�
Arthrop
oda�
Insecta�
Hem
iptera��
Noton
ectid
ae�
��
backsw
immer�
0�0�
0�0�
0�0�
0�0�
10�
2�0�
0�Arthrop
oda�
Insecta�
Hem
iptera��
Mesov
eliid
ae�
��
water�trea
der�
2�0�
0�0�
12�
0�0�
0�3�
0�0�
0�
Arthrop
oda�
Insecta�
Hem
iptera��
Veliida
e��
�sm
all�w
ater�
trea
der �
3�1�
0�0�
31�
0�0�
1�3�
0�0�
0�Arthrop
oda�
Insecta�
Hem
iptera��
Corixida
e��
�waterbo
atmen
�1�
1�0�
1�1�
0�0�
1�11
�8�
0�0�
Arthrop
oda�
Insecta�
Hem
iptera��
Gelastocorida
e��
Taxon�A�
toad
bug�
3�0�
0�0�
5�1�
0�0�
6�1�
0�0�
Arthrop
oda�
Insecta�
Hem
iptera��
Gelastocorida
e�?�
�Taxon�B�
toad
bug�
0�0�
0�1�
0�0�
0�0�
1�0�
0�0�
Arthrop
oda�
Insecta�
Hem
iptera��
Hyd
rometrida
e��
�water�
mea
sureer�
1�0�
0�0�
1�0�
0�0�
0�0�
0�0�
Arthrop
oda�
Insecta�
Hem
iptera��
Nep
idae
��
�ne
edle�bug
�0�
1�0�
0�0�
0�0�
0�0�
0�0�
0�
Arthrop
oda�
Insecta�
Hem
iptera��
Nau
rocorida
e��
�cree
ping
�water�
bug�
0�1�
0�0�
0�0�
0�0�
0�0�
0�0�

Jack Lakes Wetlands Biodiversity Assessment, November 2007 & June 2008 - APPENDICES46
PHYLUM�
CLASS�
ORD
ER�
FAMILY�
Sub�FA
MILY�
GEN
US�&�SPE
CIES�
COMMON�
NAME�
1001
�10
02�
1003
�10
04�
2001
�20
02�
2003
�20
04�
3001
�30
02�
3003
�� 30
04�
Arthrop
oda�
Insecta�
Hem
iptera��
Pleida
e��
�py
gmy�
backsw
immer�
0�0�
0�0�
0�1�
0�0�
15�
0�0�
0�Arthrop
oda�
Insecta�
Hem
iptera��
Gerrida
e��
�true
�bug
�0�
0�0�
0�1�
1�0�
0�0�
0�0�
0�
Arthrop
oda�
Insecta�
Tricho
ptera�
Hyd
roptilida
e��
Taxon�A�
?Tricholeiochiton�
cadd
isfly
�0�
1�0�
0�6�
2�0�
2�0�
1�0�
1�Arthrop
oda�
Insecta�
Tricho
ptera�
Hyd
roptilida
e��
Taxon�B�
cadd
isfly
�0�
0�0�
0�6�
4�0�
2�0�
3�0�
1�Arthrop
oda�
Insecta�
Tricho
ptera�
Hyd
roptilida
e��
Ortho
trichia�
cadd
isfly
�0�
0�0�
0�1�
0�0�
0�12
�0�
0�0�
Arthrop
oda�
Insecta�
Tricho
ptera�
Ecno
midae
��
�cadd
isfly
�0�
0�0�
0�7�
5�0�
7�0�
0�0�
2�Arthrop
oda�
Insecta�
Tricho
ptera�
Hyd
ropsychida
e��
�cadd
isfly
�1�
0�0�
0�18
�1�
0�0�
1�1�
0�2�
Arthrop
oda�
Insecta�
Tricho
ptera�
Leptoceridae�
�Taxon�A�
cadd
isfly
�2�
0�0�
0�2�
0�0�
0�0�
0�0�
0�Arthrop
oda�
Insecta�
Tricho
ptera�
Leptoceridae�
�Taxon�B�
cadd
isfly
�0�
3�0�
0�1�
0�0�
1�0�
1�0�
2�Arthrop
oda�
Insecta�
Tricho
ptera�
Leptoceridae�
�Taxon�C�
cadd
isfly
�0�
0�0�
0�0�
0�0�
0�0�
0�0�
2�
Arthrop
oda�
Insecta�
Tricho
ptera�
��
Immature�
specim
ens�
cadd
isfly
�0�
0�0�
0�3�
0�0�
0�0�
0�0�
0�
Arthrop
oda�
Insecta�
Coleop
tera�
Hyd
roph
ilida
e�(adu
lt)�
�sp. �A
�
water�
scaven
ger�
beetle�
0�3�
0�0�
1�0�
0�0�
0�0�
0�0�
Arthrop
oda�
Insecta�
Coleop
tera�
Hyd
roph
ilida
e�(adu
lt)�
�sp.�B
�
water�
scaven
ger�
beetle�
0�2�
0�0�
1�1�
0�0�
0�1�
0�0�
Arthrop
oda�
Insecta�
Coleop
tera�
Dytiscida
e�(adu
lt)�
�sp.�A
�diving
�bee
tle�
0�1�
0�0�
0�0�
0�0�
0�0�
0�0�
Arthrop
oda�
Insecta�
Coleop
tera�
Dytiscida
e�(adu
lt)�
�sp.�B
�diving
�bee
tle�
0�0�
0�0�
0�0�
0�0�
0�0�
0�16
�Arthrop
oda�
Insecta�
Coleop
tera�
Dytiscida
e�(adu
lt)�
�sp.�C
�diving
�bee
tle�
0�0�
0�0�
0�0�
0�0�
0�0�
0�1�
Arthrop
oda�
Insecta�
Coleop
tera�
Dytiscida
e�(adu
lt)�
�sp.�D
�diving
�bee
tle�
0�0�
0�45
�0�
0�0�
0�0�
0�0�
1�Arthrop
oda�
Insecta�
Coleop
tera�
Dytiscida
e�(adu
lt)�
�sp.�E�
diving
�bee
tle�
0�0�
0�1�
0�0�
0�0�
0�0�
0�0�
Arthrop
oda�
Insecta�
Coleop
tera�
Dytiscida
e�(adu
lt)�
�sp.�F�
diving
�bee
tle�
0�0�
0�1�
0�0�
0�0�
0�0�
0�0�
Arthrop
oda�
Insecta�
Coleop
tera�
Stap
hylin
idae
�(adu
lt)�
��
beetle�
0�0�
0�0�
1�0�
0�0�
0�0�
0�0�
Arthrop
oda�
Insecta�
Coleop
tera�
Hyd
rochidae�
(adu
lt)�
��
beetle�
0�0�
0�2�
1�0�
0�0�
0�0�
0�0�
Arthrop
oda�
Insecta�
Coleop
tera�
UNIDEN
TIFIED
�(adu
lt)�
��
beetle�
0�1�
0�0�
1�0�
0�0�
0�1�
0�0�
Arthrop
oda�
Insecta�
Coleop
tera�
Gyrinidae
�(adu
lt)�
��
whirligig�bee
tle�
0�0�
0�0�
1�0�
0�0�
0�2�
0�0�
Arthrop
oda�
Insecta�
Coleop
tera�
Hyd
roph
ilida
e�(la
rvae)�
�sp.�A
�
water�
scaven
ger�
beetle�
0�0�
0�3�
3�0�
0�0�
0�0�
0�0�
Arthrop
oda�
Insecta�
Coleop
tera�
Hyd
roph
ilida
e�(la
rvae)�
�sp. �B
�
water�
scaven
ger�
beetle�
0�1�
0�0�
1�0�
0�0�
0�0�
0�0�
Arthrop
oda�
Insecta�
Coleop
tera�
Dytiscida
e�(la
rvae)�
�sp.�A
�diving
�bee
tle�
1�0�
0�0�
0�0�
0�0�
0�0�
0�0�
Arthrop
oda�
Insecta�
Coleop
tera�
Dytiscida
e�(la
rvae)�
�sp.�B
�diving
�bee
tle�
0�0�
0�0�
2�2�
0�0�
4�0�
0�1�
Arthrop
oda�
Insecta�
Coleop
tera�
Noteridae��
��
beetle�
0�0�
0�0�
0�1�
0�0�
0�0�
0�0�
Arthrop
oda�
Insecta�
Coleop
tera�
Curculionida
e �(la
rvae)�
��
aqua
tic�wee
vil�
0�1�
0�1�
1�0�
1�0�
2�0�
0�0�

Jack Lakes Wetlands Biodiversity Assessment, November 2007 & June 2008 - APPENDICES47
PHYLUM�
CLASS�
ORD
ER�
FAMILY�
Sub�FA
MILY�
GEN
US�&�SPE
CIES�
COMMON�
NAME�
1001
�10
02�
1003
�10
04�
2001
�20
02�
2003
�20
04�
3001
�30
02�
3003
�� 30
04�
Arthrop
oda�
Insecta�
Diptera�
Chiron
omidae�
Tany
podina
e��
non�bitin
g�midge�
13�
9�8�
3�10
0�60
�2�
42�
108�
73�
1�1�
Arthrop
oda�
Insecta�
Diptera�
Chiron
omidae�
Ortho
clad
inae
��
non�bitin
g�midge�
38�
25�
1�2�
30�
16�
0�3�
13�
4�0�
11�
Arthrop
oda�
Insecta�
Diptera�
Chiron
omidae�
Chiron
ominae�
�no
n�bitin
g�midge�
29�
187�
7�10
�22
3�14
6�1�
86�
111�
147�
0�38
�
Arthrop
oda�
Insecta�
Diptera�
Chiron
omidae�
�da
maged
�specim
ens�
non�bitin
g�midge�
0�0�
0�0�
169�
0�42
�0�
0�0�
16�
2�Arthrop
oda�
Insecta�
Diptera�
Ceratopo
gonida
e��
��bitin
g�midge�
21�
31�
0�19
�50
�11
�1�
17�
6�8�
0�0�
Arthrop
oda�
Insecta�
Diptera�
Ceratopo
gonida
e�Fo
rcipom
yiinae�
�bitin
g�midge�
0�2�
0�0�
0�2�
0�0�
0�0�
0�0�
Arthrop
oda�
Insecta�
Diptera�
Dixidae
��
�midge�
1�0�
0�0�
0�0�
0�0�
0�0�
0�0�
Arthrop
oda�
Insecta�
Diptera�
Culicidae
��
�mosqu
ito�
4�0�
0�0�
4�0�
0�0�
15�
0�0�
0�Arthrop
oda�
Insecta�
Diptera�
Dolicho
podida
e��
��
0�0�
1�0�
0�0�
0�0�
0�0�
0�0�
Arthrop
oda�
Insecta�
Diptera�
Taba
nida
e�(L)�
��
march�fly�
0�0�
0�0�
4�0�
0�0�
0�0�
0�0�
Arthrop
oda�
Insecta�
Diptera�
Chao
borida
e��
��ph
antom�
midges �
0�0�
0�0�
0�0�
1�1�
0�0�
7�0�
Arthrop
oda�
Insecta�
Lepido
ptera�
Pyralid
ae�
��
moth�
0�0�
1�0�
0�1�
0�0�
1�0�
0�0�
Arthrop
oda�
Insecta�
Collembo
la�
��
�spring
tails�
0�0�
0�0�
0�0�
0�0�
0�0�
0�1�
Chorda
ta�
Osteichthyes�
Percifo
rmes�
Apo
gonida
e��
Glossom
ia�aprion�
�0�
0�0�
0�0�
0�0�
0�1�
0�0�
0�
Chorda
ta�
Osteichthyes�
Atherinifo
rmes�
Atherinidae
��
Craterocep
halus�
stercusm
uscarum�
�0�
0�0�
0�1�
0�0�
0�0�
0�0�
0�
Chorda
ta�
Osteichthyes�
Percifo
rmes�
Chan
dida
e��
Den
ariusa�
band
ata�
�0�
0�0�
0�1�
0�0�
0�1�
0�0�
0�
Chorda
ta�
Osteichthyes�
Percifo
rmes�
Terapo
ntidae
��
Amniatab
a�pe
rcoide
s��
0�0�
0�0�
0�1�
0�0�
0�0�
0�0�
�

Jack Lakes Wetlands Biodiversity Assessment, November 2007 & June 2008 - APPENDICES48
APPENDIX E: Freshwater Fish Report - Dr Damien Burrows (ACTFR)
Freshwater Fish Report
Dr Damien Burrows Australian Centre for Tropical Freshwater Research, James Cook University, Townsville.
The survey was very brief and only intended to identify the fish species resident in Jack Lakes and their potential management issues.
Given the survey occurred at the end of the dry season, water levels in the lakes were very low.This prevented sampling in all but the top lake as the water level was too low for boat work and use of gill nets, and its is too dangerous (crocodile are present) to undertaken seine netting, backpack electrofishing or other forms of fishing that require entry into water. In addition, water clarity was poor, limiting visual observations.
Even within the top lake, only an area approx. 150m long by 50m wide was able to be accessed by boat for electrofishing. Electrofishing was conducted using an ETS boat-mounted electroshocker. A total of two 15-minute electrofishing shots were conducted totalling 801 seconds of on-time. The water was so turbid, that stunned fish could not easily be observed, and certainly not identified in the water. The dip net was used as a beam trawl in front of the boat while power was applied. This is not a particularly effective method, limiting the number of fish caught, but the extreme turbidity necessitated this approach. The limitations to the sampling method (including being unable to identify fish in the water) meant that no estimate of abundance could be applied and the data remain as presence/absence data.
Results and Discussion
In general, the site is greatly impacted by cattle and pig activity. This has resulted in the loss of much of the grass and sedge community around the wetland margins and shallow areas and aquatic macrophytes throughout, which would provide useful fish habitat. Cattle and pigs are known to increase sediment resuspension, thus increasing water turbidity. Their impacts may also include increased ammonia levels and reduced dissolved oxygen levels.
A total of 12 fish species were caught in the top lake (Table 1). This included archerfish, which, being highly visual hunters, are normally assumed to avoid turbid water. Bony bream, a fish normally thought to be sensitive to low dissolved oxygen, was present. Unfortunately, no barramundi were captured. The Lakefield area is renowned for its barramundi fishing, but these lakes may not be optimal barramundi habitat.
No species of conservation value were caught, with all those caught being common species with wide distributions. Red claw crayfish (Cherax quadricarinatus) were also caught in Top Lake.Tissue samples were taken from several fish to contribute to other studies examining the genetics of northern Australian freshwater fish.
Table 1 also list fish caught from other scientific surveys that have been conducted in the Normanby River catchment (with most of the sites being within Lakefield National Park itself).This records a total of 29 species.

Jack Lakes Wetlands Biodiversity Assessment, November 2007 & June 2008 - APPENDICES49
During the wet season, this whole area would be underwater and fish would disperse across the floodplain including throughout the Jack Lakes system. However, once surface flow ceases, fish are confined for the remainder of the year, to the waterholes they remained in when they become disconnected. Many waterholes in this area dry up during the dry season. Jack Lakes are permanent, but with the low water level, which makes the lakes vulnerable to disturbance, and the effects of cattle and pigs, they are not likely to be suitable habitat for all fish species.
No barramundi were caught in this survey, though it is possible that some were present. Given the condition at the end of the dry season, it is not likely that many (or even possibly any) barramundi would survive the year. Thus the nursery or refuge value of Jack Lakes for barramundi may be limited. However, this does not mean that it is not valuable as a fishing location as good fishing occurs during the year, only that the system may not be suitable dry season refuge habitat. This possibility reflects on any management limitations imposed upon the lake.
It would be highly instructive to survey the Jack Lakes shortly after the wet season, early in the dry season and late in the dry season to see what fish are present at the beginning versus the end of the dry season.
The other big management issue is the extent to which the extreme turbidity is natural or influenced by other factors such as cattle and/or pigs. The role of pigs in accelerating the rate of evaporation from these lakes via exposed pug holes is also worth pursuing. It is highly likely that control of pig numbers would benefit the aquatic values and functioning of this lake system.
Table 1 Fish Species Recorded from Lakefield National Park.
Common name Scientific name Kennard 1995 Puseyunpub.
BurrowsandPerna2006
Thissurvey
Sailfin glassfish Ambassis agrammus X X Macleay’s glassfish Ambassis macleayi X X X Barred grunter Amniataba percoides X X X Pacific short-finned eel Anguilla obscura X X
Marbled eel Anguilla reinhardtii X X X X Lesser salmon catfish Ariopsis graeffei X
Carpentaria catfish* Ariopsis paucus X X
Fly-specked hardyhead Craterocephalus stercusmuscarum X X X
Pennyfish Denariusa bandata X X Mouth almighty Glossamia aprion X X X Golden goby Glossogobius aureus X X Stringray Himantura chaophrya X Carp Gudgeon Hypseleotris compressa X Barramundi Lates calcarifer X X X Spangled perch Leiopotherapon unicolor X X X X Tarpon Megalops cyprinoides X X X X Eastern rainbowfish Melanotaenia splendida splendida X X X X
Purple-spotted Mogurnda adspersa X

Jack Lakes Wetlands Biodiversity Assessment, November 2007 & June 2008 - APPENDICES50
Gudgeon Northern trout Gudgeon Mogurnda mogurnda X
Bony bream Nematalosa erebi X X X X Black catfish Neosilurus ater X X X X Hyrtl’s tandan Neosilurus hyrtlii X X X X Sleepy cod Oxyeleotris lineolatus X X X Giant Gudgeon Oxyeleotris selheimi X Rendahl’s tandan Porochilus rendahli X X X X Speckled goby Redigobius bikolanus X X Spotted scat Scatophagus argus X Longtom Strongylura krefftii X X X Seven-spot archerfish Toxotes chatareus X X X X
*=the taxonomy of these species has changed since the original reports were produced Kennard (1995) sampled 8 lagoon sites in the Lakefield National Park Dr. Brad Pusey (Griffith University - unpub. data) sampled 7 sites in the Lakefield/Kalpowar area Burrows and Perna (2006) sampled 5 sites in the Lakefield National Park
Reference List
Burrows, D.W. and Perna, C. 2006. Freshwater Fishes of the Normanby River Catchment, North-East Queensland. Report No. 06/32 Australian Centre for Tropical Freshwater Research, James Cook University, Townsville.
Kennard, M. 1995. Factors Influencing Freshwater Fish Assemblages in Floodplain Lagoons of the Normanby River, Cape York Peninsula: A Large Tropical Australian River. Unpublished Masters Thesis, Division of Environmental Sciences, Griffith University, Brisbane.
During the wet season, this whole area would be underwater and fish would disperse across the floodplain including throughout the Jack Lakes system. However, once surface flow ceases, fish are confined for the remainder of the year, to the waterholes they remained in when they become disconnected. Many waterholes in this area dry up during the dry season. Jack Lakes are permanent, but with the low water level, which makes the lakes vulnerable to disturbance, and the effects of cattle and pigs, they are not likely to be suitable habitat for all fish species.
No barramundi were caught in this survey, though it is possible that some were present. Given the condition at the end of the dry season, it is not likely that many (or even possibly any) barramundi would survive the year. Thus the nursery or refuge value of Jack Lakes for barramundi may be limited. However, this does not mean that it is not valuable as a fishing location as good fishing occurs during the year, only that the system may not be suitable dry season refuge habitat. This possibility reflects on any management limitations imposed upon the lake.
It would be highly instructive to survey the Jack Lakes shortly after the wet season, early in the dry season and late in the dry season to see what fish are present at the beginning versus the end of the dry season.
The other big management issue is the extent to which the extreme turbidity is natural or influenced by other factors such as cattle and/or pigs. The role of pigs in accelerating the rate of evaporation from these lakes via exposed pug holes is also worth pursuing. It is highly likely that control of pig numbers would benefit the aquatic values and functioning of this lake system.
Table 1 Fish Species Recorded from Lakefield National Park.
Common name Scientific name Kennard 1995 Puseyunpub.
BurrowsandPerna2006
Thissurvey
Sailfin glassfish Ambassis agrammus X X Macleay’s glassfish Ambassis macleayi X X X Barred grunter Amniataba percoides X X X Pacific short-finned eel Anguilla obscura X X
Marbled eel Anguilla reinhardtii X X X X Lesser salmon catfish Ariopsis graeffei X
Carpentaria catfish* Ariopsis paucus X X
Fly-specked hardyhead Craterocephalus stercusmuscarum X X X
Pennyfish Denariusa bandata X X Mouth almighty Glossamia aprion X X X Golden goby Glossogobius aureus X X Stringray Himantura chaophrya X Carp Gudgeon Hypseleotris compressa X Barramundi Lates calcarifer X X X Spangled perch Leiopotherapon unicolor X X X X Tarpon Megalops cyprinoides X X X X Eastern rainbowfish Melanotaenia splendida splendida X X X X
Purple-spotted Mogurnda adspersa X

Jack Lakes Wetlands Biodiversity Assessment, November 2007 & June 2008 - APPENDICES51
APPENDIX F: Jacks Lakes Amphibian, Reptile, and Mammal Survey - Kim Stephan (CYMAG)
CYMAG Environmental Inc. - Jack Lakes Biodiversity Report January 2000 6
Jacks Lakes Amphibian, Reptile, and Mammal Survey
Kim Stephan Cape York Marine Advisory Group Environmental Inc. Cooktown, Qld Australia
In November 2007 and June 2008 a survey of the amphibians, reptiles and mammals from Jack Lakes was conducted by K. Stephan (CYMAG), Russell Best (QPWS) and C. Howley (CYMAG).
Survey Methodology
The biodiversity of amphibians, reptiles and mammals was assessed by compiling a list of all the species confirmed to be present at Jack Lakes. The data collected was used to calculate the abundance (count) of each species observed during the surveys. Search efforts were made in a variety of specific habitat types during the day and night to detect new species unlikely to be trapped (e.g., geckos, monitor lizards).
Site location One site at each of the Top, Middle and Lower Lakes was chosen. The field methodology was designed according to the National Fauna Survey Standards and the quadrat design was recommended by Dr Alex Kutt. For the November survey two 100m transects were set up at each site. The survey effort was increased for the June survey to two 50x50m quadrats per site (total of 6 quadrats) set 200m apart. The quadrats were selected to include the Regional Ecosystem 3.3.66. As this ecosystem is often a thin ribbon of vegetation around the edge of the wetland the quadrats also included a section of adjacent woodland. This approach incorporated the ecotone of melaleuca riparian vegetation and eucalypt woodland vegetation and intended to increase the number of species detected. It is reported that ecotones (i.e., the zone where two ecosystems meet) tend to support relatively high diversity of species by providing greater vegetative complexity than either community surrounding it (Yahner, 1988; Harris, 1988; Andren, 1994).
Where possible the localities of the November sites were used for June. However, as a result of inundation with water the June sites were set further back into the riparian zone. The methodology for the June survey was altered in an effort to improve the effectiveness of the survey. Therefore, the sites used for June and November are not considered to be replicates of each other, and cannot be statistically compared to determine differences between the seasons.
Fauna survey techniques Trapping and Hair Tubes- In June (Figure1) each quadrat contained 20 Elliott traps, 2 cage traps, 10 hair tubes (5 big and 5 small), 4 pitfall traps, 6 funnel traps and two turtle/yabby traps. In November the transects contained 6 Elliott traps, 6 Hair tubes (3 big and 3 small), 4 pitfall traps and one turtle/yabby trap.
The Elliott traps and hair tubes were baited with a mixture of peanut butter, oats, pistachio oil and salami rolled into balls. The bait in the Elliott and cage traps was removed in the morning and replaced at dusk when the traps were set. The bait in the hair tubes was left for the duration of the survey to avoid contaminating the tape. The two cage traps were placed at opposite corners of the quadrat, and baited with the peanut butter mixture, and chicken frames. Turtle

Jack Lakes Wetlands Biodiversity Assessment, November 2007 & June 2008 - APPENDICES527
traps were baited with a perforated tin of sardines, and thrown into the lake with approximately 10cm remaining out of the water. Pitfall traps were positioned outside the quadrats, closer to the waters edge and consisted of four 20L buckets in a T-shape pattern connected by 15-20m of drift line fence. Funnel traps were placed in between the buckets (June survey only). The traps were cleared in the morning and the pits, funnels and turtle traps were cleared morning, noon and afternoon. Water was added to the pitfall traps to prevent dehydration of caught animals. The traps were left in place for four consecutive nights.
Figure 1. Amphibian, Reptile and Mammal Survey Design June Survey (Not to scale)
Targeted Surveys - Spotlighting and diurnal (pre-dusk) searches for reptiles, amphibians and mammals were undertaken two times at each site outside of the quadrats. Diurnal searches involved searching under logs, bark and leaf litter for 30 minutes at each site. Spotlighting involved a 15 minute scan across the surface of the lakes for crocodile eye shine and a 30 minute spotlight walk parallel to the water body shining the light on tree tops, tree trunks and surrounds. Additional spotlighting also occurred when driving between sites and in habitats of interest (e.g., flowering Eucalyptus phoenicia woodland for fruit bats).
Opportunistic Observations- Opportunistic sightings of fauna were recorded throughout the survey period. The date, time, GPS coordinate and habitat of the animal were noted.
= Cage trap
= Funnel Trap
= Turtle Trap
Key
= Pitfall Trap
HB = Hair Tube Big
E = Elliot Trap
HS = Hair Tube Small
WETLAND
E11 HB
E12 HS
100m
E9 HB
E19 HB E20 HS
E1 HB
E2 HS
E3 HB
E4 HS
E5 HB
E6 HS E7 HB E8 HS E10 HS
E13 HB
E14 HS
E15 HB
E16 HS E17 HB E18 HS 0m & 200m
50m
150m
Pitfall Trap Design

Jack Lakes Wetlands Biodiversity Assessment, November 2007 & June 2008 - APPENDICES538
Indirect Detection –Scats, turtle shells, regurgitated pellets, tracks and other signs were recorded or collected for analysis by Robyn Carter Hair Identification. Carter classifies the hair and scat results into three levels of reliability - Definite, Probable and Possible. Only ‘Definite’ results were included in the species list. They were given a count of one for abundance.
Sound – During the November survey bat echolocation calls were recorded overnight at each site with an AnabatII bat detector. The box was set up at dusk near the water bodies and left to record overnight. The calls were identified by Anabat Call Analysis Specialist Greg Ford and noted as Definite, Probable or Possible. Only definite identifications were included in the species list. The calls were also reviewed by Dr Roger Coles who was later contracted to undertake the June bat survey. Bat species recorded by sonar detection were given a count of one for abundance for each record.
TaxonomyWhere necessary voucher specimens of reptiles, amphibians and mammals were collected using humane methods and sent to experts Keith McDonald (QP&W), Alistair Freeman (QP&W) or the Queensland Museum for identification.
ResultsEight species of amphibians, seventeen species of reptiles and twenty one mammals were identified during the survey. An additional forty six species were added to the amphibian, reptile and mammal species records for Jack Lakes and entered into the EPA’s WildNet database. In addition to this list one introduced amphibian (Cane toad (Rhinella marina)) and five introduced mammals (Dog (Canis familiaris), Feral Pig (Sus scrofa), Cattle (Bos sp.), Black Rat (Rattusrattus), Horse (Equus caballus)) were recorded.
Table 1. Amphibian, Reptile and Mammal Species List for Jack Lakes November 2007 and June 2008 * = Species not native to Australia
Class Family Scientific name Common name June2008
Nov2007
TotalAbun-dance
Bufonidae Rhinella marina* Cane Toad* 46 19 65
Litoria nasuta Striped Rocket Frog 9 3 12 Litoria pallida Pallid Rocket Frog 64 3 67
Litoria rothi Northern Laughing Tree Frog 3 1 4
Hylidae
Litoria rubella Red Tree Frog 1 1 Limnodynastes convexiusculus Marbled Frog 4 4 Notadenmelanoscaphus Northern Spadefoot Toad 1 1
Limnodynastidae
Opisthodon ornatus Ornate Burrowing Frog 27 10 37
Amphibia(Frogs)
Myobatrachidae Crinia remota Northern Froglet 535 535
Crocodylidae Crocodylus johnstoni Australian Freshwater Crocodile 3 3
Crocodylus porosus Saltwater Crocodile 1 1 Crocodylus sp. Crocodile 5 14 19
Agamidae Diporiphora sp. Dragon 1 1 2
Reptilia(Reptiles)
Diporiphora bilineata Northern Two-lined Dragon 1 1

Jack Lakes Wetlands Biodiversity Assessment, November 2007 & June 2008 - APPENDICES54
9
Colubridae Tropidonophis mairii Freshwater Snake 3 1 4 Gekkonidae Gehyra dubia Tree Dtella 1 1 2
Oedura rhombifer Velvet Gecko 1 1 Scincidae Carlia aerata Rainbow Skink 5 5
Carlia munda Rainbow Skink 1 1 Cryptoblepharusvirgatus Striped Snake-eyed Skink 2 2 Ctenotus spaldingi Striped Skink 1 1 Glaphyromorphuspardalis Skink 1 1 Cryptoblepharus sp. Skink 1 1 2
Varanidae Varanus panoptes Yellow-spotted Monitor 1 1 Varanus sp. Monitor Lizard 1 1
ChelidaeEmydura macquarii krefftii Krefft's River Turtle 17 1 18 Macrochelodinarugosa
Northern Snake-necked Turtle 1 1 2
Canidae Canis lupus dingo Dingo 2 2 Canis familiaris* Dog* 1 1
Macropodidae Macropus agilis Agile Wallaby 2 3 5 Macropus giganteus Eastern Grey Kangaroo 1 1 Onychogaleaunguifera
Northern Nailtail Wallaby 5 5
Suidae Sus scrofa* Pig* 1 46 47 Bovidae Bos sp. Cattle* 20 3 23 Pteropodidae Pteropus scapulatus Little Red Flying Fox 7 7
Pteropus sp. Flying fox 300 300
Vespertilionidae Scotorepens sanborni Northern Broad-nosed Bat 5 3 8
Chalinolobus nigrogriseus Hoary Wattled Bat 2 1 3 Miniopterus australis Little Bent-winged Bat 2 1 3
Nyctophilus sp. Unknown Long-eared Bat 1 1
Miniopterus schreibersii Common Bentwing Bat 2 2 Vespadelustroughtoni Troughton's Forest Bat 2 2 Myotis macropus Large-footed Myotis 4 4 Saccolaimusflaviventris
Yellow-bellied Sheath-tailed Bat 4 4
Nyctophilus bifax Eastern Long-eared Bat 4 4
MolossidaeMormopterus loriae ridei
Little Northern Free-tailed Bat 2 2
Chaerophon jobensis Northern Free-tailed Bat 3 3 Mormopterus beccarii Beccari's Free-tailed Bat 2 2
Emballonuridae Saccolaimussaccolaimus
Bare-rumped Sheathtail-bat 1 1
Muridae Rattus rattus* Black Rat* 1 1 Rattus fuscipes Bush Rat 1 1
Equidae Equus caballus* Horse* 3 3
Mammalia (Mammals)
Peramelidae Isoodon macrourus Northern Brown Bandicoot 1 1
10
Phalangeridae (blank) Possum 1 1 2
Amphibians (Frogs)
Eight species of amphibians were identified (Table 1) from the surveys. A total of 662 frogs were recorded. Frogs were more abundant in June with 644 individuals recorded compared with only 18 frogs recorded in November. An additional three species (Crinia remota, Limnodynastes convexiusculus and Notoden melanoscaphus) were recorded in the June survey. The only species recorded in November and not June was the Red Tree Frog (Litoria rubella). The most abundant amphibian species in June was the Northern Froglet (Crinia remota) with 535 individuals recorded. In November many frogs were juveniles and the most abundant frog was the Ornate Burrowing Frog with 10 individuals (Opisthodon ornatus).
Most of the frogs identified are reasonably widespread and common in the region. One exception was the Northern Spadefoot frog (Notaden melanoscaphus) which is not frequently seen because it spends most of its life underground. Suspected threats to this species include habitat modification and degraded water quality (Australian Frog Database, 2005). This frog was caught on the Lower Lakes which are considered to have the least disturbance and the best water quality in the Jack Lakes system.
The raw data (Table 1) indicates a shift in the abundance and species of frogs between the wet and dry seasons. The greater abundance of frogs in June is attributed to the after effects of the wet season and the end of the breeding season when more water and habitat is available. Some frog species may also have been dormant (e.g., burrowing species) in November and harder to detect.
There was a marked difference in the condition of the Lakes between the end of the dry and wet seasons. Many frogs breed on the edges of lake margins where there is food for tadpoles, safety from predators and easy access to land once they have metamorphosed. In June the flood waters had receded leaving nutrient rich soil and thick aquatic vegetation. Ample habitat was available in the dense carpets of Green Couch Grass, Azolla Waterfern, Water Lilies and Bulkaru reeds. The sediment had dropped, the water was clearer and the conditions for breeding had improved. In contrast to June the exposed lake margins of the Top and Middle Lakes in November had been devastated by Feral Pig and cattle activity. The vegetation along the shoreline had been dug out, eaten or trampled and the water was fouled and heavy with sediment. Fine particles of clay remained suspended in the water giving the lakes a chocolate milk appearance. These conditions are not ideal for amphibian reproduction and may be disadvantaging certain species.
In June the vegetation around the Lakes had restablished after the flush of the wet season. However, long term damage such as increased evaporation (drying up of the Lakes), and loss of species could be occurring as a result of introduced animal pressures on the Lakes. Feral pigs have previously been reported to contribute to the decline of frogs through predation and habitat destruction in rainforest areas (Richards et al. 1993).
A study at nearby Wakooka Outstation revealed a number of frog species additional to this survey including Crinia deserticola, Cyclorana brevipes, Cyclorana novaehollandiae, Litoria alboguttata, L. caerulea, Uperolia mimula and the first Queensland record of Cycloranacryptotis (McDonald, 1998). It is possible these species are present at Jack Lakes and could be revealed in future surveys.
Jack Lakes Wetlands Biodiversity Assessment, November 2007 & June 2008 - APPENDICES55
10
Phalangeridae (blank) Possum 1 1 2
Amphibians (Frogs)
Eight species of amphibians were identified (Table 1) from the surveys. A total of 662 frogs were recorded. Frogs were more abundant in June with 644 individuals recorded compared with only 18 frogs recorded in November. An additional three species (Crinia remota, Limnodynastes convexiusculus and Notoden melanoscaphus) were recorded in the June survey. The only species recorded in November and not June was the Red Tree Frog (Litoria rubella). The most abundant amphibian species in June was the Northern Froglet (Crinia remota) with 535 individuals recorded. In November many frogs were juveniles and the most abundant frog was the Ornate Burrowing Frog with 10 individuals (Opisthodon ornatus).
Most of the frogs identified are reasonably widespread and common in the region. One exception was the Northern Spadefoot frog (Notaden melanoscaphus) which is not frequently seen because it spends most of its life underground. Suspected threats to this species include habitat modification and degraded water quality (Australian Frog Database, 2005). This frog was caught on the Lower Lakes which are considered to have the least disturbance and the best water quality in the Jack Lakes system.
The raw data (Table 1) indicates a shift in the abundance and species of frogs between the wet and dry seasons. The greater abundance of frogs in June is attributed to the after effects of the wet season and the end of the breeding season when more water and habitat is available. Some frog species may also have been dormant (e.g., burrowing species) in November and harder to detect.
There was a marked difference in the condition of the Lakes between the end of the dry and wet seasons. Many frogs breed on the edges of lake margins where there is food for tadpoles, safety from predators and easy access to land once they have metamorphosed. In June the flood waters had receded leaving nutrient rich soil and thick aquatic vegetation. Ample habitat was available in the dense carpets of Green Couch Grass, Azolla Waterfern, Water Lilies and Bulkaru reeds. The sediment had dropped, the water was clearer and the conditions for breeding had improved. In contrast to June the exposed lake margins of the Top and Middle Lakes in November had been devastated by Feral Pig and cattle activity. The vegetation along the shoreline had been dug out, eaten or trampled and the water was fouled and heavy with sediment. Fine particles of clay remained suspended in the water giving the lakes a chocolate milk appearance. These conditions are not ideal for amphibian reproduction and may be disadvantaging certain species.
In June the vegetation around the Lakes had restablished after the flush of the wet season. However, long term damage such as increased evaporation (drying up of the Lakes), and loss of species could be occurring as a result of introduced animal pressures on the Lakes. Feral pigs have previously been reported to contribute to the decline of frogs through predation and habitat destruction in rainforest areas (Richards et al. 1993).
A study at nearby Wakooka Outstation revealed a number of frog species additional to this survey including Crinia deserticola, Cyclorana brevipes, Cyclorana novaehollandiae, Litoria alboguttata, L. caerulea, Uperolia mimula and the first Queensland record of Cycloranacryptotis (McDonald, 1998). It is possible these species are present at Jack Lakes and could be revealed in future surveys.

Jack Lakes Wetlands Biodiversity Assessment, November 2007 & June 2008 - APPENDICES5611
The introduced amphibian Cane Toad (Rhinella marina) was widespread across the Lakes and abundant in the pitfall traps. In a study by Catling et. al (1999) Litoria rothii (present at Jack Lakes) was one of three amphibian species considered seriously at risk of being poisoned by Cane Toads. Other species that occur at Jack Lakes and ‘probably’ at risk from Cane Toads include the Ornate Burrowing Frog, Desert Tree Frog (Litoria rubella), Slaty-grey Snake (Stegonotus cucullatus), Black Bittern (Ixobrychus flavicollis), and Blue-winged Kookaburra (Dacelo leachii) (Catling et. al,1999). Many dead Cane Toads were observed. Some of these had been turned over and eaten, presumably by crows or raptors.
Reptiles
Seventeen species of reptiles were identified (Table 1) and recorded as new species for Jack Lakes. A range of reptile families including geckos, dragons, goannas, skinks, turtles, snakes and crocodiles were recorded. Nine additional species from the June survey were added to the November species list.
Moderate numbers of crocodiles were observed in all of the Lakes during both surveys. Both Freshwater (Crocodylus johnstoni) and Saltwater (Crocodylus porosus) Crocodile species were present.
Given the amount of survey effort, the low number of reptile species possibly reflects the fact that the entire area floods annually, so the reptiles present (with the exception of the burrowing Glaphyromorphus pardalis) are all either small tree-climbers or strong swimmers able to escape the flood (pers.comm. Russell Best, 17 Nov., 2008).
The turtle recorded as Krefft’s River Turtle (Emydura krefftii) had characteristics of a Northern Yellow-faced Turtle (Emydura tanybaraga), but lacked the diagnostic dark streak through the pupil (pers.comm. Mike Trennery, 25 June, 2008). This anomaly could suggest it is a different species. However the record remains as E. krefftii due to taxonomic uncertainty of the chelids at this time. The Northern Snake-necked Turtle (Macrochelodina rugosa) was identified from carapace remains. The carapace had a bite taken from the front presumably by a pig or dog. An additional two empty carapaces and two dead turtles were found in the November survey. Feral Pigs are known to eat Northern Snake-necked Turtles. Feral Pigs depleted turtle populations in Maningrida, Northern Territory, in excess of levels that could be replaced by surviving hatchlings (Fordham et. al., 2007). Projective models predicted certain elimination of affected populations within 50 years. In the absence of pigs the increase in hatchling survival was sufficient enough to allow an annual indigenous harvest of up to 20% without causing substantial population pressure.
The previous records of the Slaty-grey Snake (Stegonotus cucullatus) (Wildlife Online) and Four Fingered Skink (Carlia dogare) (Qld Museum) were not observed during the survey (Table 1). There were no previous mammal records for Jack Lakes in the Qld Museum and Wildlife Online searches.
Mammals
Twenty one species of mammals were identified. Fourteen of these were bats. There were no previous mammal records for Jack Lakes in the Qld Museum and Wildlife Online searches.
Jack Lakes Wetlands Biodiversity Assessment, November 2007 & June 2008 - APPENDICES5712
The Bush Rat (Rattus fuscipes) and Northern Brown Bandicoot (Isoodon macrourus) were identified from hairs in a Feral Dog scat. The Northern Brown Bandicoot is reported to be susceptible to predation by canines (Vernes et al, 2001). ‘Definite’ possum underhairs were identified from large hair tubes in both the November and June surveys. The species was a ‘probable’ Common Brush-tail Possum (Trichosurus vulpecular), but due to insufficient hairs could not be identified to species level. There are anecdotal reports of Common Brushtail Possums at the nearby Kalpowar Station. The Common Brushtail Possum is considered to have a generally low population throughout Cape York Peninsula with some areas of relatively high density (Winter, 2007). The IUCN (2008) notes the population trend of the Common Brushtail Possum to be decreasing, sparse and declining in monsoonal northern Australia.
Macropods including the Eastern Grey Kangaroo (Macropus giganteus), Agile Wallaby(Macropus agilis) and Northern Nailtail Wallaby (Onychogalea unguifera) were seen frequently throughout the study especially in the lightly wooded channel country and paperbark floodplain of the Top Lakes. Although the Northern Nailtailed Wallaby has suffered some local extinctions and its distribution is patchy, it is regarded as common in its range (Strahan, 1983).
Little Red Flying Foxes (Pteropus scapulatus) were identified from a spotlight search in flowering Scarlet Gum (E. phoenicia) forest. A small group were seen actively feeding and flying throughout the forest. A cloud of over 300 Flying Fox flew over the Lower Lakes during a spotlighting session. The species could not be confirmed.
The low number of mammal species, especially small mammals, maybe due to annual flooding events in the riparian zone of Jack Lakes. Most of the mammal species (macropods and bats) recorded are highly mobile. Smaller mammals were detected in predator scats or regurgitations that could have come from dogs or birds outside of Jack Lakes. The small mammals detected in hair tubes were sparse. It may be more productive in future mammal surveys of Jack Lakes to conduct the survey in woodland areas on the higher ground around the Lakes.
References Australian Frog Database, 2005. Notaden melanoscaphus Northern Spadefoot toad. Frogs Australia Network. Viewed November 22nd 2008. http://www.frogsaustralia.net.au/frogs/display.cfm?frog_id=183
Fordham, D.A., Georges, A., Brook, B.W. (2007). Indigenous harvest, exotic pig predation and local persistence of a long-lived vertebrate: managing a tropical freshwater turtle for sustainability and conservation. Journal of Applied Ecology 45 Issue 1 : 52-62
Kutt, A. (2002) Biodiversity Monitoring. Summary of Methods. CSIRO Sustainable Ecosystems, Townsville, Queensland
McDonald, K.R. (1998). First Queensland record of the Burrowing frog Cyclorana cryptotis Tyler and Martin, 1977 (Anura: Hylidae). Brief Communication. Transactions of the Royal Society of S. Aust. 122(2). 85-86
Richards, S.J., McDonald, K.R. and Alford, R.A. (1993). Declines in populations of Australia’s endemic tropic frogs. Pacific Conservation Biology 1: 66–77
Vernes, K, Dennis, A and Winter, J (2001) Mammalian Diet and Broad Hunting Strategy of the Dingo (Canis familiaris dingo) in the Wet Tropical Rain Forests of North-eastern Australia. Biotropica Volume 33 Issue 2 Article pp339-345, James Cook University
Winter, J. W. (2007) Eucalypt Woodland in Cape York Peninsula as Habitat for Arboreal Marsupials: Responses of the Common Brushtail Possum. Tree Kangaroo and Mammal Group, Atherton (121pp.), Queensland

Jack Lakes Wetlands Biodiversity Assessment, November 2007 & June 2008 - APPENDICES58
APPENDIX G: Anabat Analysis Summary, Jack Lakes, November 2007. Prepared by Greg Ford.
14
Anabat Analysis Summary, Jack Lakes, November 2007. Prepared by Greg Ford.
Data received for analysis Three compressed file folders (batsite 1.zip, batsite 2.zip, batsite 3.zip) containing Anabat sequence files recorded at Jack Lakes on 20th, 21st and 22nd November 2007.
Call identification standard No keys or descriptions have been published for bat calls of north-eastern Queensland, and access to reliable locally recorded reference calls is limited. However, many species likely to be present are covered in keys published for southern Queensland (Reinhold et al. 2001) and the Northern Territory (Milne 2002).
The extent of geographic variation in call characteristics is poorly known, but the available evidence suggests that calls of most species do not vary significantly between regions. Therefore, it is deemed sufficient to refer to the above-named keys and reference calls collected from other regions in determining the identity of calls recorded in the present survey.
Please note, however, that neither reliable reference calls nor call descriptions from other regions exist for some of the species likely to occur in the survey area, including several rare or threatened species. Where there is a possibility that calls may represent those species, they are listed in the results (Table 1) and descriptions of the calls and reliability of identity are discussed in the ‘Species Notes” section below Table 1.
Analysis resultsRecording quality was good, with most sequence files containing recognisable bat calls. Many call sequences included clearly defined call features, thereby affording reliable identification for some species; however, the lack of local reference material meant that even some good calls could not be reliably identified.
Four microbat species were positively identified from the call data. At least four, and perhaps as many as ten other species may also have been present but reliability of identification was lower for those species. Table 1 lists the species recorded and shows the reliability of identification attributed to the best calls available for each species. Detailed discussion of the reliability of call identification and likely presence of particular species, where several species use similar calls, is provided in the ‘Species Notes’ section, following the table.
Rare or threatened species potentially present during survey
Of particular note amongst the species listed in Table 1, is the possible presence of two species that are scheduled as rare or threatened under Queensland and/or Australian government nature conservation legislation.
The critically endangered bare-rumped sheath-tailed bat (Saccolaimus saccolaimus) was possibly present, but cannot be confirmed due to strong similarity between its calls and those of the more common yellow-bellied sheath-tailed bat (S. flaviventris). S. saccolaimus roosts primarily in hollow eucalypts, such as E. alba (Churchill 1998), and very likely inhabits woodlands in the survey area.
There is a slight possibility that the coastal sheath-tailed bat (Taphozous australis), a vulnerable species, may also have been present. Some reference calls are available for this species, but similarities to several other species make identification difficult (see “Species Notes”). This species is “rarely found more than a few kilometres from the sea” (Churchill 1998), so the likelihood of its presence at Jack Lakes is very low.
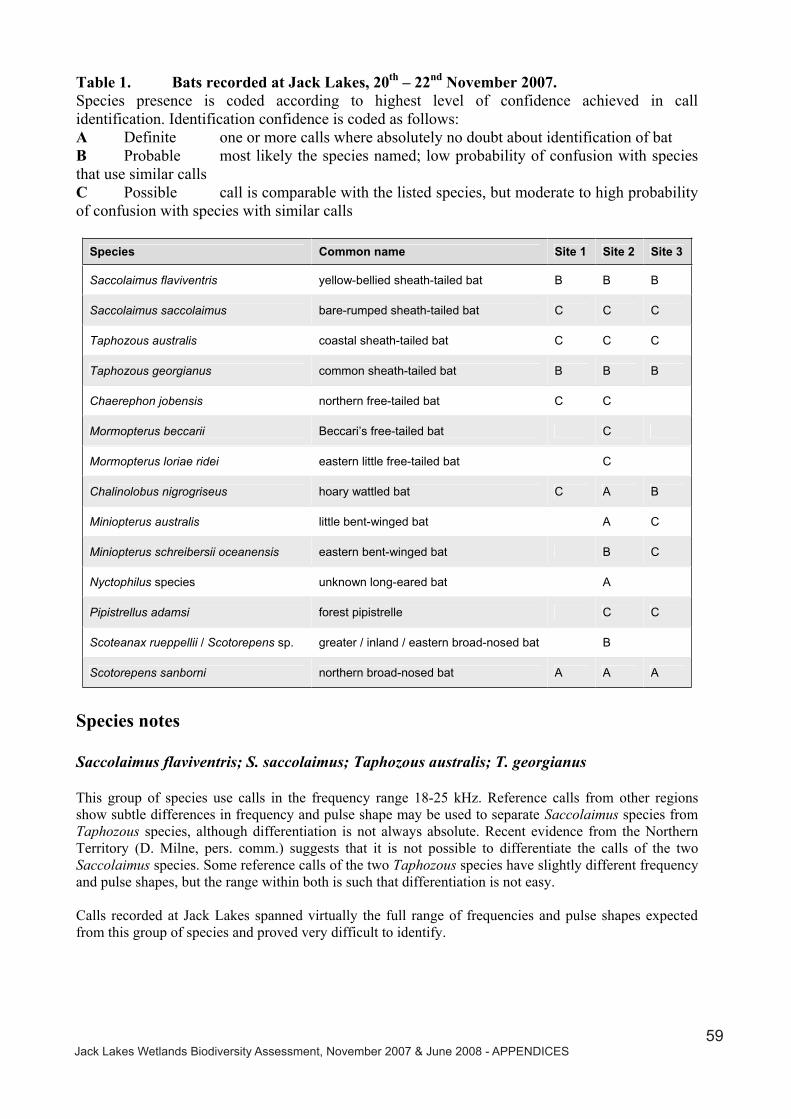
Jack Lakes Wetlands Biodiversity Assessment, November 2007 & June 2008 - APPENDICES5915
Table 1. Bats recorded at Jack Lakes, 20th – 22nd November 2007. Species presence is coded according to highest level of confidence achieved in call identification. Identification confidence is coded as follows: A Definite one or more calls where absolutely no doubt about identification of bat B Probable most likely the species named; low probability of confusion with species that use similar calls C Possible call is comparable with the listed species, but moderate to high probability of confusion with species with similar calls
Species Common name Site 1 Site 2 Site 3
Saccolaimus flaviventris yellow-bellied sheath-tailed bat B B B
Saccolaimus saccolaimus bare-rumped sheath-tailed bat C C C
Taphozous australis coastal sheath-tailed bat C C C
Taphozous georgianus common sheath-tailed bat B B B
Chaerephon jobensis northern free-tailed bat C C
Mormopterus beccarii Beccari’s free-tailed bat C
Mormopterus loriae ridei eastern little free-tailed bat C
Chalinolobus nigrogriseus hoary wattled bat C A B
Miniopterus australis little bent-winged bat A C
Miniopterus schreibersii oceanensis eastern bent-winged bat B C
Nyctophilus species unknown long-eared bat A
Pipistrellus adamsi forest pipistrelle C C
Scoteanax rueppellii / Scotorepens sp. greater / inland / eastern broad-nosed bat B
Scotorepens sanborni northern broad-nosed bat A A A
Species notes
Saccolaimus flaviventris; S. saccolaimus; Taphozous australis; T. georgianus
This group of species use calls in the frequency range 18-25 kHz. Reference calls from other regions show subtle differences in frequency and pulse shape may be used to separate Saccolaimus species from Taphozous species, although differentiation is not always absolute. Recent evidence from the Northern Territory (D. Milne, pers. comm.) suggests that it is not possible to differentiate the calls of the two Saccolaimus species. Some reference calls of the two Taphozous species have slightly different frequency and pulse shapes, but the range within both is such that differentiation is not easy.
Calls recorded at Jack Lakes spanned virtually the full range of frequencies and pulse shapes expected from this group of species and proved very difficult to identify.

Jack Lakes Wetlands Biodiversity Assessment, November 2007 & June 2008 - APPENDICES6016
A large portion of calls over all sites, with distinctly curved pulse shape at 18-20 kHz, were almost certainly from one of the Saccolaimus species. It is highly likely that many of these were from S.flaviventris, but S. saccolaimus may also have been present.
At Site 2 there was a small subset of calls with short, flat 24 kHz pulses that were probably from Taphozous. These were similar to reference calls from T. georgianus in north-western Queensland. T.australis reference calls are at similar frequency, but the few reference calls available have longer pulse-duration than that exhibited in this data set.
Published distributional information suggests that T. georgianus does not occur this far north on Cape York (Churchill, 1998; Jolly et al., in press), but this may simply be an artefact of poor historical survey effort. T. australis has a predominantly coastal distribution in the region (Churchill, 1998; Richards, in press a); however, little is known about this species and it is possible that T. australis may occur inland as far as the survey site.
The presence of either Taphozous species at Jack Lakes would depend on the availability of suitable roosting caves within about 10 km of the survey sites. An inspection of satellite imagery and terrain layers available on “Google Maps” (http://maps.google.com.au/maps) indicate a paucity of landscape features likely to provide such caves.
Chaerephon jobensisThis species’ calls overlap in frequency with those of the above group; however, it is usually easy to differentiate due to erratic changes in frequency and pulse shape. C. jobensis was not positively identified for this survey, but it was possibly responsible for a few lower quality calls recorded at Sites 1 & 2.
Mormopterus beccarii Calls are generally around the upper end of the frequency range used by the Saccolaimus/Taphozousgroup, but pulse shape is diagnostic in most cases. However, in poorer quality calls (short duration, weak and noisy sequences) it is possible to confuse M. beccarii with those other species. Several such calls, at around 24 kHz, were recorded at site 2 and may have been from M. beccarii or Taphozous species.
Mormopterus loriae ridei This species uses a range of call types, usually around 30 kHz; pulse shape is typically flat (Milne, 2002), but some calls have a more curved pulse shape (T. Reardon, pers. comm.) that may be confused with some vespertilionid bats (e.g. Scotorepens balstoni). Short duration calls or those with poor signal quality are not reliably differentiated between these species; however, S. balstoni apparently does not occur in the survey area (Churchill, 1998; Parnaby, in press). Several calls from site 2 were possibly from M. l. ridei. The curved pulse shape and 32 kHz frequency of these calls was more suggestive of Scotorepens balstoni but M. l. ridei cannot be discounted.
Chalinolobus nigrogriseus and Scotorepens sanborniThese two species’ calls are very similar, although pulse shape is diagnostic in better quality recordings. More than 50% of all calls recorded during the Jack Lakes survey were attributable to this pair of species, many of which were positively identified as S. sanborni. C. nigrogriseus was definitely present at site 2, but no clearly identifiable calls from this species were present at sites 1 or 3.
Miniopterus australis Has highly distinctive calls above 55 kHz; readily differentiated from other species likely to occur in this survey area. M. australis was definitely present at site 2; possibly also at site 3 but only very brief and low quality sequences recorded so not possible to be certain.
Miniopterus schreibersii oceanensis and Pipistrellus adamsi
Jack Lakes Wetlands Biodiversity Assessment, November 2007 & June 2008 - APPENDICES61
17
M. s. oceanensis calls often exhibit a distinctive pulse shape, with erratic pulse repetition rate and variable characteristic frequency within a single call. Several sequences from site 2 showed evidence of these characteristics and were considered most likely attributable to M. schreibersii.P. adamsi calls overlap in frequency and sometimes have similar pulse shapes those of M. s. oceanensis(Milne 2002), thereby making identification difficult in lower quality calls. Based on published distributional information (e.g. Churchill 1998; Hoye & Milne, in press), P. adamsi would be at beyond the south-eastern limit of their known range in the Lakefield region. Some calls from this survey show a striking similarity to reference calls of P. adamsi from the Northern Territory (Milne 2002), so it is possible that this species was also present during the survey at Jack Lakes.
Nyctophilus species The long-eared bats use very low amplitude calls (i.e. weak signal strength) that rarely result in good quality Anabat call files. Nyctophilus calls are similar to those of Myotis macropus, but can be differentiated by subtle differences in pulse shape in better quality calls. Two calls at site 2 were positively attributable to Nyctophilus. It is not possible to differentiate the species of Nyctophilus from their calls, but N. bifax is the most likely species responsible for these calls, based on published distributional information for the genus (e.g. Churchill, 1998).
Scoteanax rueppellii, Scotorepens balstoni and S. orion According to published distribution maps (Churchill, 1998; Hoye & Richards, in press; Parnaby, in press; Tidemann & Parnaby, in press) none of these three species should occur in the survey area. However, a number of calls from site 2 bear a striking resemblance to those of S. balstoni.Calls of the three species are often difficult to distinguish, although S. balstoni is easier to differentiate than the other two.
It is possible that these calls were made by Mormopterus loriae ridei (see above), but insufficient reference material exists to support positive differentiation of this and the broad-nosed species on calls alone. However, unlike the broad-nosed species, M. l. ridei is known to occur on this part of Cape York. This actuality lends support to the consideration of M. l. ridei being more likely responsible for the problematic calls than any of the broad-nosed bats.
References Churchill, S. (1998). Australian Bats. New Holland, Sydney.
Hall, L. S., Thomson, B. G. and Milne, D. J. (in press). Bare-rumped Sheath-tailed Bat Saccolaimus saccolaimus in The Mammals of Australia (Third Edition), S. Van Dyck & R. Strahan (Eds).
Hoye, G. and Milne, D. J. (in press). Forest Pipistrelle Pipistrellus adamsi in The Mammals of Australia (Third Edition), S. Van Dyck & R. Strahan (Eds).
Hoye, G. A. and Richards, G. C. (in press). Greater Broad-nosed Bat Scoteanax rueppellii inThe Mammals of Australia (Third Edition), S. Van Dyck & R. Strahan (Eds).
Jolly, S., Armstrong, K.N. and Reardon, T. B. (in press). Common Sheath-tailed Bat Taphozousgeorgianus in The Mammals of Australia (Third Edition), S. Van Dyck & R. Strahan (Eds).
Milne, D.J. (2002). Key to the Bat Calls of the Top End of the Northern Territory. Technical Report No. 71, Parks and Wildlife Commission of the Northern Territory, Darwin.
Parnaby, H. (in press). Inland Broad-nosed Bat Scotorepens balstoni in The Mammals of Australia (Third Edition), S. Van Dyck & R. Strahan (Eds).
16
A large portion of calls over all sites, with distinctly curved pulse shape at 18-20 kHz, were almost certainly from one of the Saccolaimus species. It is highly likely that many of these were from S.flaviventris, but S. saccolaimus may also have been present.
At Site 2 there was a small subset of calls with short, flat 24 kHz pulses that were probably from Taphozous. These were similar to reference calls from T. georgianus in north-western Queensland. T.australis reference calls are at similar frequency, but the few reference calls available have longer pulse-duration than that exhibited in this data set.
Published distributional information suggests that T. georgianus does not occur this far north on Cape York (Churchill, 1998; Jolly et al., in press), but this may simply be an artefact of poor historical survey effort. T. australis has a predominantly coastal distribution in the region (Churchill, 1998; Richards, in press a); however, little is known about this species and it is possible that T. australis may occur inland as far as the survey site.
The presence of either Taphozous species at Jack Lakes would depend on the availability of suitable roosting caves within about 10 km of the survey sites. An inspection of satellite imagery and terrain layers available on “Google Maps” (http://maps.google.com.au/maps) indicate a paucity of landscape features likely to provide such caves.
Chaerephon jobensisThis species’ calls overlap in frequency with those of the above group; however, it is usually easy to differentiate due to erratic changes in frequency and pulse shape. C. jobensis was not positively identified for this survey, but it was possibly responsible for a few lower quality calls recorded at Sites 1 & 2.
Mormopterus beccarii Calls are generally around the upper end of the frequency range used by the Saccolaimus/Taphozousgroup, but pulse shape is diagnostic in most cases. However, in poorer quality calls (short duration, weak and noisy sequences) it is possible to confuse M. beccarii with those other species. Several such calls, at around 24 kHz, were recorded at site 2 and may have been from M. beccarii or Taphozous species.
Mormopterus loriae ridei This species uses a range of call types, usually around 30 kHz; pulse shape is typically flat (Milne, 2002), but some calls have a more curved pulse shape (T. Reardon, pers. comm.) that may be confused with some vespertilionid bats (e.g. Scotorepens balstoni). Short duration calls or those with poor signal quality are not reliably differentiated between these species; however, S. balstoni apparently does not occur in the survey area (Churchill, 1998; Parnaby, in press). Several calls from site 2 were possibly from M. l. ridei. The curved pulse shape and 32 kHz frequency of these calls was more suggestive of Scotorepens balstoni but M. l. ridei cannot be discounted.
Chalinolobus nigrogriseus and Scotorepens sanborniThese two species’ calls are very similar, although pulse shape is diagnostic in better quality recordings. More than 50% of all calls recorded during the Jack Lakes survey were attributable to this pair of species, many of which were positively identified as S. sanborni. C. nigrogriseus was definitely present at site 2, but no clearly identifiable calls from this species were present at sites 1 or 3.
Miniopterus australis Has highly distinctive calls above 55 kHz; readily differentiated from other species likely to occur in this survey area. M. australis was definitely present at site 2; possibly also at site 3 but only very brief and low quality sequences recorded so not possible to be certain.
Miniopterus schreibersii oceanensis and Pipistrellus adamsi

Jack Lakes Wetlands Biodiversity Assessment, November 2007 & June 2008 - APPENDICES62
18
Reinhold, L., Law, B., Ford, G. and Pennay, M. (2001). Key to the bat calls of south-east Queensland and north-east New South Wales. Department of Natural Resources and Mines, Brisbane.
Richards, G. C. (in press, a). Coastal Sheath-tailed Bat Tahozous australis in The Mammals of Australia (Third Edition), S. Van Dyck & R. Strahan (Eds).
Richards, G. C. (in press, b). Yellow-bellied Sheath-tailed Bat Saccolaimus flaviventris in TheMammals of Australia (Third Edition), S. Van Dyck & R. Strahan (Eds).

Jack Lakes Wetlands Biodiversity Assessment, November 2007 & June 2008 - APPENDICES63
APPENDIX H: Avian Survey Report and Data - Drs Clifford & Dawn Frith
19
Avifaunal survey list for Jack Lakes
Clifford B. Frith PhD and Dawn W. Frith PhD. From observations made during 17th to 24th November 2007 and 14th to 19th June 2008, with comparative notes
IntroductionDuring both survey periods systematic records were made at each specified lake or lakes during four-hour periods of direct observation, typically performed during 06:00 to 10:00 during mornings and 14:00 to 18:00 during afternoons of the November 2007 survey and during 0630 to 1030 in the mornings and 1330 to 1730 in the afternoons during the June 2008 survey. During the four hour survey periods we walked slowly and silently through vegetation around lake edges to count bird species and numbers seen and heard on their shores and water/plant surfaces and within the woodland habitats within c. 50 metres of the higher lake shoreline. During these walks we both used high quality Leica binoculars and we also made observations from advantageous, sheltered, viewing sites on lake edges using a tripod-mounted high quality powerful Leica spotting scope. Nightbirds heard and identified by their calls near and around the camp are included in the species list as species records. For a comprehensive listing of all species seen or heard and indications of their relative abundance for both the November 1007 and the June 2008 surveys, and their combined totals, see our tabulated survey results (Table 1 below).
Comparative observations between the two major survey periods are as follows:
A total of 101 bird species (32 waterbirds and 69 bush birds) were recorded for the November 2007 survey. A total of 91 species (23 waterbirds and 68 bush birds) were recorded for the June 2008 survey. A total of 117 bird species (33 waterbirds and 84 bush birds) were identified during the combined November 2007 and June 2008 surveys. Of the 117 species, 75 of them (22 waterbirds and 53 bush birds) were recorded during both the November 2007 and June 2008 surveys (i.e. were common to both surveys). A total of 26 species (10 waterbirds and 16 bush birds) were recorded during November 2007 that were not recorded in June 2008. A total of 16 species (1 waterbird and 15 bush birds) were recorded during June 2008 that were not recorded in November 2007. A greater diversity of both water and bush bird species were recorded during the November survey than during the June one. A conspicuously lower density of many waterbird species was recorded during the June than during the November survey. Conversely, a greater density of nectarivorous species, i.e. lorikeets and honeyeaters, were present during the June survey than during the November one (Table 1)
WaterbirdsIn November, at the end of the dry season, the density of waterbirds such as the Magpie Goose, Wandering Whistling-Duck, Radjah Shelduck and Pacific Black Duck was notably high. During June, following the wet season, their numbers were, however, dramatically reduced. Magpie Geese, Little Egrets, Glossy Ibis, and Black-winged Stilt were entirely absent and a number of other species (e.g. Green-Pygmy Goose, White-necked Herons, Pied Herons, Nankeen Night-Herons, Royal Spoonbills, Comb-crested Jacana, and Brolga) present in but relatively small numbers albeit that some samples are small (see Table 1). During the November survey the estimated 3000 Magpie Geese on the lakes may represent an over-estimated because the large number of them seen early one morning on Top Lake had clearly roosted there for the night and were not feeding – where those seen on the Lower lakes were
Avifauna Survey Reports and Data for Jack Lakes- Drs Clifford & Dawn Frith

Jack Lakes Wetlands Biodiversity Assessment, November 2007 & June 2008 - APPENDICES6420
actively feeding. Thus the population may have been a single one moving between roost and feeding locations.
As no Magpie Geese were present in June it is clear that the extensive and widespread wetlands produced by the wet season rains had resulted in this, and other waterbird, species dispersing from Jacks Lakes. In November we recorded only two Green Pygmy-Geese and no Comb-crested Jacana on the Top and Middle Lakes, whereas on the Lower Lakes we estimated there to be > 200 on both Lake 3a and 3 b and > 100 on Lake 3c. We suggested that such significant differences were because the Lower Lake shores were better protected than those at Top and Middle Lakes and had extensive water lily beds. In this regard we noted that the Green-Pygmy Goose is dependant upon floating small plants and the Comb-crested Jacana upon invertebrates associated with aquatic plants for food – both resources in November were apparently lacking to any significant extent on Top and Middle Lakes. In June, however, water lilies covered the Top Lake extensively and we estimated there to be more than 100 Green Pygmy-Goose and more than 100 Comb-crested Jacana; in marked contrast to the previous survey. Not surprisingly the migrant species of waders that were seen in small numbers, mostly around the exposed sandy shores of Fish Lake, during November were entirely absent in June. In June Black-necked Storks and White-bellied Sea Eagles were found to have young in the nest.
BushbirdsThe most noteworthy difference between the November and June surveys was the lack of migrant species and the considerable and conspicuous increase in the number of nectarivorous birds. The former group (migrants) includes the Pied Imperial-Pigeon, Asian Koel, and Dollarbird and the latter group (nectarivores) the Rainbow Lorikeets and a number of honeyeater species including the Yellow, Brown-backed, White-throated, Blue-faced, Little Friarbird, and Silver-crowned Friarbirds. The latter species, a notable nomad nectarivore was not sighted in November. The notable increase in nectarivore species and numbers was due to flowering Scarlet Gum Eucalyptus phoenicea, melaleucas and grevilleas that in the woodlands immediately about the Lakes. At least the Brown-backed and White throated Honeyeaters were nesting (nests and juveniles seen to be attended by adults). There was a noticeable decline in flocks and numbers of Red-tailed Black-cockatoos, while Sulphur-crested Cockatoos were more abundant. Laughing Kookaburras, Forest and Sacred Kingfishers were also notably more abundant in trees around the Lakes during June than in November. The Forest Kingfisher was conspicuously feeding over the Lakes’ littoral zones and in the immediately adjacent shallows of the Lakes and thus appeared to be obtaining much foraging advantage by seasonally initial water evaporation. Over the littoral zone they were eating adult dragonflies and other insects and invertebrates while in the shallow water they were taking small fishes. Male Great Bowerbirds were active at bowers during both surveys. Drongos, Leaden Flycatchers, and Rufous Songlarks were more common or more conspicuous in June than in November.
Other comments Given the extremely limited nature of extensive tall, dense, shallow water vegetation, such as reed beds, it is not surprising that we did not see a single species of rail – not even a Purple Swamp-hen during either survey. It is also remarkable that we recorded only a single individual Black-fronted Plover during November, and no other plover species save some Masked Lapwings over the many kilometres of lake shoreline surveyed. This is far less surprising for June, given the high water at that time, but remains so for November. Equally as remarkable is that only one record of a single Willie Wagtail was made and none or next to no individuals of the various species of the swift/swallow/martin/woodswallow aerial insect feeding ecological guild that we might expect to be present and taking airborne insects so typically associated with tropical lake habitats were seen. It would be significantly interesting to know if this situation is in fact typical of such lakes prior to the introduction of exotic mammals or if the absence of such birds reflects their detrimental ecological impact (i.e. upon what should possibly be naturally-occurring insect populations now lacking as a result of microhabitat disturbance/destruction by, or resulting from, pig and cattle activities).

Jack Lakes Wetlands Biodiversity Assessment, November 2007 & June 2008 - APPENDICES6521
November 2007
THE JACK LAKES AVIFAUNA Report on results of a survey performed, during 17-21 November 2007, and prepared by Clifford B. Frith PhD & Dawn W. Frith PhD
Introduction The enclosed tabulated results of our survey of the avifauna of the Jack Lakes study area during 17th to 21st November 2007 provide our resulting comprehensive raw data. These tables present the actual number of individual birds seen or heard for the majority of species recorded, with but a limited number of species being sufficiently abundant for us to describe them as “common” or “abundant”.
Systematic observations were made at each specific lake or lakes (see Tables) during timed four-hour periods of direct observation, and these were typically performed during 06:00 to 10:00 in the mornings and 14:00 to 18:00 in afternoons. During these periods we walked slowly and silently through vegetation around lake edges to survey birds seen and heard on their shores and water/plant surfaces and also through woodland habitat within 50 metres of the upper lake shoreline in order to survey the avifauna of this lake-associated woodland zone. During these walks we both used high quality Leica binoculars. We also made observations from advantageous, sheltered, viewing sites on lake edges using a tripod-mounted high quality powerful Leica spotting scope (enabling us to record species that would undoubtedly have otherwise been overlooked).
Given the limited time available at the study site and the, appropriate, methods employed we can provide but a snapshot impression of the avifauna present at the study site at that time of the year in 2007 under the prevailing ecological and climatic conditions. This was at the end of the dry season when the surface areas of the lakes were much reduced by lack of precipitation and their evaporation.
The environments The most conspicuously striking aspect of our overall observations was the apparently profound ecological differences between the relatively ‘barren’ Top and Middle Lakes on the one hand compared with the more biologically diverse Lower Lakes on the other as expressed by both their gross appearance and avifaunas:
The Top and Middle lakes supported very limited floating vegetation (e.g. water lilies) and their shallows/banks were all but completely lacking in aquatic plants (e.g. reed beds etc, see image 7637 of Top Lake) and were predominantly devoid of sheltering vegetation and/or cover. While the banks of the Lower Lakes also lacked significant aquatic plants they had far more shelter and cover present (see images 7610 & 7616 of Lower Lake (a)), in the form of fallen heavy timber and dense copses of thick lakeside vegetation of approximately 4 to 6 metres tall. While these factors are possibly significant with respect to the striking avifaunal differences between Top and Middle Lakes versus the Lower Lakes it is perhaps also possible that the latter have on average both deeper water and steeper banks and that these might possibly limit access by foraging pigs and cattle. This theoretical scenario remains to be studied/tested however.
The shore of all lakes readily accessible to cattle and pigs had obviously been progressively deeply trodden and rooted as their water levels fell, thus leaving the ploughed mud so severely
Jack Lakes Wetlands Biodiversity Assessment, November 2007 & June 2008 - APPENDICES66
22
disturbed and then sun-dried to rock-hard as to be difficult for us to traverse on foot. Birds cannot probe this hard mud. The intense pig foraging in the seasonally ever-lowering wet zone of the lake shores presumably significantly increases evaporation rates and leaves even these briefly moist areas devoid of aquatic plants and other organic matter, including numerous and diverse aquatic animals.
Even in areas of the Lower Lakes it was apparent that pigs and/or cattle has grossly disturbed and damaged extensive areas of water lily beds in contrast to other areas they had/could not reach perhaps due to deeper water (see image 7628 of Lower Lake (a)). The avifauna Given the significant surface areas and shore-lines of these lakes the avifauna directly associated with their habitats (i.e. aquatic and shore birds) stuck us as relatively poor in species diversity and in the numbers of individuals of those species present at the time of our survey. This situation was far more apparent at Top and Middle Lakes than at the Lower Lakes, where better-protected shores and extensive water lily beds supported species in large numbers not seen on Top and Middle Lakes, such as Green Pygmy-Goose Nettapus pulchellus and Comb-crested Jacana Irediparra gallinacea. It is noteworthy in this regard that the former bird is dependant upon floating small plants and the latter upon invertebrates associated with aquatic plants for food – both resources apparently lacking to any significant extent on Top and Middle Lakes (where these species were absent or all but so). Also notable in this context was that while hundreds of Magpie Geese Anseranus semipalmata were seen to be night-roosting on Top Lake we did not see them feeding there, whereas many of them were travelling to the Lower Lakes to feed during daylight.
We strongly suspect that had the shores of these lakes been undisturbed by pigs and cattle, and thus their wet zones more extensive, flat, and rich in surface and subsurface plant and invertebrate life, many more shorebirds might have been present during the survey period. We recorded extremely small numbers of both resident and migratory shorebird species, notwithstanding that the period of our survey was during that time of year when most adult shorebirds migrating to Australia should be present and when their juveniles are continuing to arrive in northern Australia en route to the south. Again, we cannot be sure to what extent the brief nature of our survey biased our shorebird results, but we remain surprised by the small numbers of species and individuals we encountered over these lakes given their significant location to these bird species.
Given the near total lack of dense shallow water vegetation, such as reed beds, it is not surprising that we did not see a single species or individual of rail – not even a Purple Swamp-hen. It is most remarkable, however, that we recorded but a single individual Black-fronted Plover and no other plover species save notably few Masked Lapwings Vanellus miles, over the many kilometres of lake shoreline surveyed. Equally as remarkable is that we did not record a single Willie Wagtail Rhipidura leucophrys on the shorelines and immediately adjacent vegetation or a single individual of any species of the swift/swallow/martin/woodswallow aerial insect feeding ecological guild that we might expect to be present and taking airborne insects so typically associated with tropical lake habitats. While this total lack of this ecological guild of passerine birds could conceivably reflect a natural local seasonal phenomenon it should be considered a matter of real concern until properly understood – because it could equally possibly reflect a fundamental problem of insect populations lacking as a result of microhabitat disturbance/destruction by, or resulting from, pig and cattle activities.
Concluding observations

Jack Lakes Wetlands Biodiversity Assessment, November 2007 & June 2008 - APPENDICES67
23
Our brief, qualitative, observations suggest to us that fundamental ecological damage to high and seasonally subsequently falling wet zones by pigs and cattle is having a profound detrimental effect upon plant and animal biodiversity on all of these lakes, but dramatically more so on Top and Middle Lakes than on the Lower Lakes.
Of particular concern is the possibility that these lakes might represent a significant ecological resource and resting reserve to migrant shorebirds during their southward and northward passage to and from Australia respectively. As this migrating avifauna is a matter of international importance, and several binding intergovernmental agreements, its movements and rest-over needs must be given serious consideration in the context of the conservation status and ecological quality of these lakes.
With respect to the latter issues, we witnessed several vehicles carrying numbers of people and many hunting dogs literally driving around the actual and entire shoreline of several lakes. These were obviously pig hunters that were looking for fresh pig activity before putting their dogs to the chase. Their progress around the shoreline disturbed and flushed to flight every single one of many hundreds of water birds present and feeding. If frequent, as vehicle tracks present would suggest to us, this level of disturbance to feeding (not to mention nesting) birds, and in particular to migrant ones, would undoubtedly be extremely detrimental to the lakes as an avifaunal reserve and would greatly reduce the viability of them as a tourist attraction.
In our view some parts of the Lower Lakes, even in their present state, show real potential for birding-based tourist development. This would, however, undoubtedly have to be restricted to extremely carefully located, designed, and constructed world-class-style bird hides with extensive concealed foot/wheelchair access from vehicle parking well removed from them. With appropriate ecological management, and theoretically resultant improvements, these lakes could offer birding experiences of world class that might, if appropriately marketed and managed, generate significant income to local communities.
Given the above, we think that consideration should be given to small scale (and thus relatively economical) studies of pig and cattle exclusion along some easily fenced straight lengths of shorelines of all of these lakes in order to assess what ecological improvements might result that might prove advantageous to their significance as wildlife refuges and/or tourist attractions. Certainly pig hunting activities could continue in the general area but, without any doubt whatsoever, would have to be fully and firmly excluded from a defined area about all lakeshores of some half a kilometre or so.
The Jack Lakes area clearly requires further significant study at other times of year and, thus, under different climatic conditions. Moreover high water levels of typical wet seasons would need to be studied in order to appreciate where bird hides could and should be located that would remain accessible and usable throughout the year should bird-based tourism be further considered.
Clifford B. Frith and Dawn W. Frith, December 2007
22
disturbed and then sun-dried to rock-hard as to be difficult for us to traverse on foot. Birds cannot probe this hard mud. The intense pig foraging in the seasonally ever-lowering wet zone of the lake shores presumably significantly increases evaporation rates and leaves even these briefly moist areas devoid of aquatic plants and other organic matter, including numerous and diverse aquatic animals.
Even in areas of the Lower Lakes it was apparent that pigs and/or cattle has grossly disturbed and damaged extensive areas of water lily beds in contrast to other areas they had/could not reach perhaps due to deeper water (see image 7628 of Lower Lake (a)). The avifauna Given the significant surface areas and shore-lines of these lakes the avifauna directly associated with their habitats (i.e. aquatic and shore birds) stuck us as relatively poor in species diversity and in the numbers of individuals of those species present at the time of our survey. This situation was far more apparent at Top and Middle Lakes than at the Lower Lakes, where better-protected shores and extensive water lily beds supported species in large numbers not seen on Top and Middle Lakes, such as Green Pygmy-Goose Nettapus pulchellus and Comb-crested Jacana Irediparra gallinacea. It is noteworthy in this regard that the former bird is dependant upon floating small plants and the latter upon invertebrates associated with aquatic plants for food – both resources apparently lacking to any significant extent on Top and Middle Lakes (where these species were absent or all but so). Also notable in this context was that while hundreds of Magpie Geese Anseranus semipalmata were seen to be night-roosting on Top Lake we did not see them feeding there, whereas many of them were travelling to the Lower Lakes to feed during daylight.
We strongly suspect that had the shores of these lakes been undisturbed by pigs and cattle, and thus their wet zones more extensive, flat, and rich in surface and subsurface plant and invertebrate life, many more shorebirds might have been present during the survey period. We recorded extremely small numbers of both resident and migratory shorebird species, notwithstanding that the period of our survey was during that time of year when most adult shorebirds migrating to Australia should be present and when their juveniles are continuing to arrive in northern Australia en route to the south. Again, we cannot be sure to what extent the brief nature of our survey biased our shorebird results, but we remain surprised by the small numbers of species and individuals we encountered over these lakes given their significant location to these bird species.
Given the near total lack of dense shallow water vegetation, such as reed beds, it is not surprising that we did not see a single species or individual of rail – not even a Purple Swamp-hen. It is most remarkable, however, that we recorded but a single individual Black-fronted Plover and no other plover species save notably few Masked Lapwings Vanellus miles, over the many kilometres of lake shoreline surveyed. Equally as remarkable is that we did not record a single Willie Wagtail Rhipidura leucophrys on the shorelines and immediately adjacent vegetation or a single individual of any species of the swift/swallow/martin/woodswallow aerial insect feeding ecological guild that we might expect to be present and taking airborne insects so typically associated with tropical lake habitats. While this total lack of this ecological guild of passerine birds could conceivably reflect a natural local seasonal phenomenon it should be considered a matter of real concern until properly understood – because it could equally possibly reflect a fundamental problem of insect populations lacking as a result of microhabitat disturbance/destruction by, or resulting from, pig and cattle activities.
Concluding observations
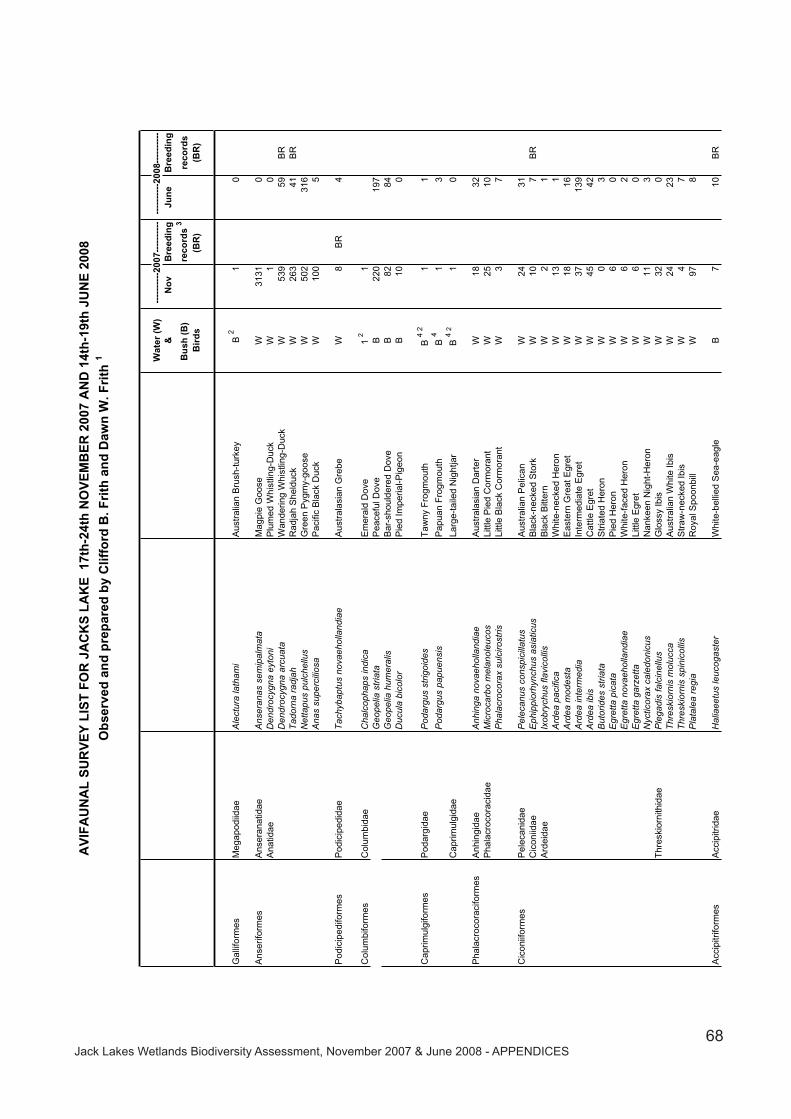
Jack Lakes Wetlands Biodiversity Assessment, November 2007 & June 2008 - APPENDICES68
Wat
er (
W)
&N
ov
Bre
edin
gJu
ne
Bre
edin
g
Bu
sh (
B)
reco
rds
3re
cord
sB
ird
s(B
R)
(BR
)
Gal
lifor
mes
Meg
apod
iidae
Ale
ctur
a la
tham
iA
ustr
alia
n B
rush
-tur
key
B
21
0
Ans
erifo
rmes
Ans
eran
atid
aeA
nser
anas
sem
ipal
mat
aM
agpi
e G
oose
W31
310
Ana
tidae
Den
droc
ygna
eyt
oni
Plu
med
Whi
stlin
g-D
uck
W1
0D
endr
ocyg
na a
rcua
taW
ande
ring
Whi
stlin
g-D
uck
W53
959
BR
Tad
orna
rad
jah
Rad
jah
She
lduc
kW
263
41B
RN
etta
pus
pulc
hellu
sG
reen
Pyg
my-
goos
eW
502
316
Ana
s su
perc
ilios
aP
acifi
c B
lack
Duc
kW
100
5
Pod
icip
edifo
rmes
Pod
icip
edid
aeT
achy
bapt
us n
ovae
holla
ndia
eA
ustr
alas
ian
Gre
beW
8B
R4
Col
umbi
form
esC
olum
bida
eC
halc
opha
ps in
dica
Em
eral
d D
ove
1 2
1G
eope
lia s
tria
taP
eace
ful D
ove
B22
019
7G
eope
lia h
umer
alis
Bar
-sho
ulde
red
Dov
eB
8284
Duc
ula
bico
lor
Pie
d Im
peria
l-Pig
eon
B10
0
Cap
rimul
gifo
rmes
Pod
argi
dae
Pod
argu
s st
rigoi
des
Taw
ny F
rogm
outh
B
4 2
11
Pod
argu
s pa
puen
sis
Pap
uan
Fro
gmou
th B
41
3
Cap
rimul
gida
eLa
rge-
taile
d N
ight
jar
B
42
10
Pha
lacr
ocor
acifo
rmes
Anh
ingi
dae
Anh
inga
nov
aeho
lland
iae
Aus
tral
asia
n D
arte
rW
1832
Pha
lacr
ocor
acid
aeM
icro
carb
o m
elan
oleu
cos
Littl
e P
ied
Cor
mor
ant
W25
10P
hala
croc
orax
sul
ciro
stris
Littl
e B
lack
Cor
mor
ant
W3
7
Cic
oniif
orm
esP
elec
anid
aeP
elec
anus
con
spic
illat
usA
ustr
alia
n P
elic
anW
2431
Cic
oniid
aeE
phip
pior
hync
hus
asia
ticus
Bla
ck-n
ecke
d S
tork
W10
7B
RA
rdei
dae
Ixob
rych
us fl
avic
ollis
Bla
ck B
itter
nW
21
Ard
ea p
acifi
caW
hite
-nec
ked
Her
onW
131
Ard
ea m
odes
taE
aste
rn G
reat
Egr
etW
1816
Ard
ea in
term
edia
Inte
rmed
iate
Egr
etW
3713
9A
rdea
ibis
Cat
tle E
gret
W45
42B
utor
ides
str
iata
Str
iate
d H
eron
W0
3E
gret
ta p
icat
aP
ied
Her
onW
60
Egr
etta
nov
aeho
lland
iae
Whi
te-f
aced
Her
onW
62
Egr
etta
gar
zetta
Littl
e E
gret
W6
0N
yctic
orax
cal
edon
icus
Nan
keen
Nig
ht-H
eron
W11
3T
hres
kior
nith
idae
Ple
gadi
s fa
lcin
ellu
sG
loss
y Ib
isW
320
Thr
eski
orni
s m
oluc
caA
ustr
alia
n W
hite
Ibis
W24
23T
hres
kior
nis
spin
icol
lisS
traw
-nec
ked
Ibis
W4
7P
lata
lea
regi
aR
oyal
Spo
onbi
llW
978
Acc
ipitr
iform
esA
ccip
itrid
aeH
alia
eetu
s le
ucog
aste
rW
hite
-bel
lied
Sea
-eag
leB
710
BR
---
----
---2
007-
----
----
- -
----
----
-200
8---
----
---
AV
IFA
UN
AL
SU
RV
EY
LIS
T F
OR
JA
CK
S L
AK
E 1
7th
-24t
h N
OV
EM
BE
R 2
007
AN
D 1
4th
-19t
h J
UN
E 2
008
Ob
serv
ed a
nd
pre
par
ed b
y C
liffo
rd B
. Fri
th a
nd
Daw
n W
. Fri
th 1

Jack Lakes Wetlands Biodiversity Assessment, November 2007 & June 2008 - APPENDICES69
Wat
er (
W)
&N
ov
Bre
edin
gJu
ne
Bre
edin
g
Bu
sh (
B)
reco
rds
3re
cord
sB
ird
s(B
R)
(BR
)
Hal
iast
ur s
phen
urus
Whi
stlin
g K
iteB
7546
Hal
iast
ur in
dus
Bra
hmin
y K
iteB
12
Milv
us m
igra
nsB
lack
Kite
B0
2
Acc
ipite
r no
vaeh
olla
ndia
eG
rey
Gos
haw
k
B 2
01
Circ
us a
ssim
ilis
Spo
tted
Har
rier
B0
1A
quila
aud
axW
edge
-tai
led
Eag
leB
20
Fal
coni
form
esF
alco
nida
eFa
lco
cenc
hroi
des
Nan
keen
Kes
trel
B
20
2F
alco
long
ipen
nis
Aus
tral
ian
Hob
byB
23
Gru
iform
esG
ruid
aeG
rus
rubi
cund
aB
rolg
aB
366
Cha
radr
iifor
mes
Bur
hini
dae
Bur
hinu
s gr
alla
rius
Bus
h S
tone
-cur
lew
B1
1R
ecur
viro
strid
aeH
iman
topu
s hi
man
topu
sB
lack
-win
ged
Stil
tW
70
Cha
radr
iidae
Els
eyor
nis
mel
anop
sB
lack
-fro
nted
Dot
tere
lW
10
Van
ellu
s m
iles
C10
0M
aske
d La
pwin
gW
4334
Jaca
nida
eIr
edip
arra
gal
linac
eaC
omb-
cres
ted
Jaca
naW
303
BR
212
Sco
lopa
cida
eT
ringa
sta
gnat
ilis
Mar
sh S
andp
iper
W5
0C
alid
ris r
ufic
ollis
Red
-nec
ked
Stin
tW
40
Cal
idris
acu
min
ata
Sha
rp-t
aile
d S
andp
iper
W2
0
Psi
ttaci
form
esC
acat
uida
eC
alyp
torh
ynch
us b
anks
ii R
ed-t
aile
d B
lack
-Coc
kato
oB
112
5E
olop
hus
rose
icap
illus
Gal
ahB
3123
Cac
atua
gal
erita
Sul
phur
-cre
sted
Coc
kato
oB
3978
Psi
ttaci
dae
Tric
hogl
ossu
s ha
emat
odus
R
ainb
ow L
orik
eet
B22
012
99A
pros
mic
tus
eryt
hrop
teru
sR
ed-w
inge
d P
arro
tB
1530
Pla
tyce
rcus
ads
citu
s P
ale-
head
ed R
osel
laB
3314
Cuc
ulifo
rmes
Cuc
ulid
aeE
udyn
amys
sco
lopa
ceus
Asi
an K
oel
B8
0S
cyth
rops
nov
aeho
lland
iae
Cha
nnel
-bill
ed C
ucko
oB
20
Cha
lcite
s ba
salis
Hor
sfie
ld's
Bro
nze-
Cuc
koo
B0
3C
acom
antis
pal
lidus
Pal
lid C
ucko
oB
20
Cac
oman
tis v
ario
losu
sB
rush
Cuc
koo
B1
0
Str
igifo
rmes
Str
igid
aeN
inox
con
nive
nsB
arki
ng O
wl
B 4
01
Nin
ox n
ovae
seel
andi
aeS
outh
ern
Boo
bock
B 4
01
Cor
aciif
orm
esA
lced
inid
aeC
eyx
azur
eus
Azu
re K
ingf
ishe
rB
21
Hal
cyon
idae
Dac
elo
nova
egui
neae
Laug
hing
Koo
kabu
rra
B21
90D
acel
o le
achi
iB
lue-
win
ged
Koo
kabu
rra
B9
12T
odira
mph
us m
acle
ayii
For
est K
ingf
ishe
rB
3095
Tod
iram
phus
san
ctus
Sac
red
Kin
gfis
her
B0
7M
erop
idae
Mer
ops
orna
tus
Rai
nbow
Bee
-eat
erB
9312
8C
orac
iidae
Eur
ysto
mus
orie
ntal
isD
olla
rbird
B24
0
Pas
serif
orm
esP
tilon
orhy
nchi
dae
Ptil
onor
hync
hus
nuch
alis
Gre
at B
ower
bird
B20
6M
alur
idae
Mal
urus
mel
anoc
epha
lus
Red
-bac
ked
Fai
ry-w
ren
B4
3A
cant
hizi
dae
Sm
icro
rnis
bre
viro
stris
Wee
bill
B1
7
---
----
---2
007-
----
----
- -
----
----
-200
8---
----
---

Jack Lakes Wetlands Biodiversity Assessment, November 2007 & June 2008 - APPENDICES70
Wat
er (
W)
&N
ov
Bre
edin
gJu
ne
Bre
edin
g
Bu
sh (
B)
reco
rds
3re
cord
sB
ird
s(B
R)
(BR
)
Ger
ygon
e m
agni
rost
risLa
rge-
bille
d G
eryg
one
B10
17G
eryg
one
albo
gula
risW
hite
-thr
oate
d G
eryg
one
B24
59B
RP
arda
lotid
aeP
arda
lotu
s ru
bric
atus
Red
-bro
wed
Par
dalo
teB
15
Par
dalti
s st
raitu
sS
tria
ted
Par
delo
te B
20
1M
elip
hagi
dae
Lich
enos
tom
us fl
avus
Yel
low
Hon
eyea
ter
B20
BR
80R
amsa
yorn
is m
odes
tus
Bro
wn-
back
ed H
oney
eate
rB
7884
BR
Ram
sayo
rnis
fasc
iatu
sB
ar-b
reas
ted
Hon
eyea
ter
B9
6C
onop
ophi
la a
lbog
ular
isR
ufou
s-ba
nded
Hon
eyea
ter
B8
2M
yzom
lea
obs
cura
Dus
ky H
oney
eate
rB
02
Cis
som
ela
pect
oral
isB
ande
d H
oney
eate
rB
117
Lich
mer
a in
dist
inct
aB
row
n H
oney
eate
rB
68
Mel
ithre
ptus
alb
ogul
aris
Whi
te-t
hroa
ted
Hon
eyea
ter
B77
130
BR
Ent
omyz
on c
yano
tisB
lue-
face
d H
oney
eate
rB
5611
8P
hile
mon
citr
eogu
laris
Littl
e F
riarb
irdB
999
Phi
lem
on a
rgen
ticep
sS
ilver
-cro
wne
d F
riarb
irdB
05
Pom
atos
tom
idae
Pom
atos
tom
us te
mpo
ralis
G
rey-
crow
ned
Bab
bler
B14
10N
eosi
ttida
eD
apho
enos
itta
chry
sopt
era
Var
ied
Sitt
ella
B1
23
Cam
peph
agid
aeC
orac
ina
nova
ehol
land
iae
Bla
ck-f
aced
Cuc
koo-
shrik
eB
35
BR
Cor
acin
a pa
puen
sis
Whi
te-b
ellie
d C
ucko
o-sh
rike
B70
62B
RC
orac
ina
tenu
irost
risC
icad
abird
B1
0La
lage
sue
urii
Whi
te-w
inge
d T
rille
rB
10
Pac
hyce
phal
idae
Pac
hyce
phal
a ru
fiven
tris
Ruf
ous
Whi
stle
rB
34
Orio
lidae
Orio
lus
flavo
cinc
tus
Yel
low
Orio
leB
10
Orio
lus
sagi
ttatu
sO
live-
back
ed O
riole
B0
5
. A
rtam
idae
Art
amus
leuc
oryn
chus
Whi
te-b
reas
ted
Woo
dsw
allo
w
B 2
20
Art
amus
cin
ereu
sLi
ttle
woo
dsw
allo
wB
07
Cra
ctic
us m
enta
lisB
lack
-bac
ked
But
cher
bird
B9
24C
ract
icus
tibi
cen
Aus
tral
ian
Mag
pie
B2
2D
icru
ridae
Dic
ruru
s br
acte
atus
Spa
ngle
d D
rong
oB
28
Rhi
pidu
ridae
Rhi
pidu
ra r
ufifr
ons
Ruf
ous
Fan
tail
B2
0
Rhi
pidu
ra le
ucop
hyrs
Will
ie W
agta
il B
20
1
Cor
vida
eC
orvu
s co
rono
ides
Aus
tral
ian
Rav
en
B 2
40
Cor
vus
orru
Tor
resi
an C
row
B62
45M
onar
chid
aeM
yiag
ra r
ubec
ula
Lead
en F
lyca
tche
rB
220
Gra
llina
cya
nole
uca
Mag
pie-
lark
B76
81P
etro
icid
aeM
icro
eca
flavi
gast
erLe
mon
-bel
lied
Fly
catc
her
B34
BR
42M
egal
urid
aeC
incl
oram
phus
mat
hew
siR
ufou
s S
ongl
ark
B0
4N
ecta
riniid
aeD
icae
um h
irund
inac
eum
Mis
tleto
ebird
B18
23N
ecta
rinia
jugu
laris
Oliv
e-ba
cked
Sun
bird
B12
1E
stril
dida
eT
aeni
opyg
ia b
iche
novi
iD
oubl
e-ba
rred
Fin
chB
125
18P
oeph
ila c
inct
aB
lack
-thr
oate
d F
inch
B10
25P
oeph
ila p
erso
nata
Mas
ked
Fin
chB
1011
BR
To
tal n
um
ber
s11
7 sp
ecie
s33
W &
84B
7161
4219
---
----
---2
007-
----
----
- -
----
----
-200
8---
----
---
To
tal n
um
ber
s11
7 sp
ecie
s33
W &
84B
7161
4219
Nu
mb
er o
f sp
ecie
s (t
ota
l an
d f
or
each
su
rvey
)10
191
Nu
mb
er o
f sp
ecie
s co
mm
on
to
eac
h s
urv
ey75
75N
um
ber
of
spec
ies
reco
rded
du
rin
g o
nly
on
e su
rvey
26
16
1 =
Tax
on
om
ic o
rder
an
d n
om
encl
atu
re f
rom
Sys
tem
atic
s an
d T
axo
no
my
of
Au
stra
lian
Bir
ds
by
Les
Ch
rist
idis
an
d W
alte
r E
. Bo
les
2008
2 =
Iden
tifi
ed b
y p
eop
le o
ther
th
an C
. & D
. Fri
th3
= P
aren
ts o
bse
rved
at
nes
ts, w
ith
fle
dg
ling
s o
r ju
ven
iles
4 =
Rec
ord
ed c
allin
g a
t n
igh
t

Jack Lakes Wetlands Biodiversity Assessment, November 2007 & June 2008 - APPENDICES71
APPENDIX I: Water Quality Analytical Results
Jack�Lak
es�W
ater�Qua
lity�Data��Nutrien
ts,��Iron
�and
�Aluminium�
Sam
ple
Lo
cati
on
T
ime
To
tal
Ph
osp
ho
rus
Filt
Rea
c P
ho
sph
oru
s A
mm
on
ia
Nit
rog
en
Nit
rog
en
Oxi
des
T
ota
l N
To
tal
Al
Dis
solv
ed A
l T
ota
l F
eD
isso
lved
Fe
Dat
e
m
g/L
mg/
L m
g/L
mg/
L m
g/L
mg/
L m
g/L
mg/
L m
g/L
JL-T
op L
ake
23
/07/
07
934
0.12
<
0.00
2 0.
025
0.05
61.
60
NA
N
A
NA
N
A
JL-C
hann
el
26/0
6/07
16
000.
087
0.00
5 0.
041
0.02
01.
10
NA
N
A
NA
N
A
JL-T
op L
ake
23/1
1/07
1630
0.82
N
A
NA
N
A
8.90
12
.1
NA
25
.2
NA
JL
-Mid
dle
Lake
23
/11/
07
1400
0.73
N
A
NA
N
A
6.70
19
N
A
27.4
N
A
JL-L
ower
Lak
e
24/1
1/07
93
00.
16
NA
N
A
NA
1.
80
3.16
N
A
5.94
N
A
JL-T
op L
ake
15
/04/
08
1300
0.05
6 0.
013
0.01
3 0.
004
1.10
N
A
NA
N
A
NA
JL
-Low
er L
ake
15
/04/
08
1400
0.
016
0.00
2 0.
006
0.00
3 0.
39
0.04
0.
1 0.
9 0.
72
JL-T
op L
ake
19
/06/
08
1500
0.
126
NA
N
A
NA
1.
33
1.08
N
A
3.06
N
A
JL-C
hann
el
17/0
6/08
13
200.
097
NA
N
A
NA
0.
99
NA
N
A
NA
N
A
JL-M
iddl
e La
ke
17/0
6/08
15
00
0.07
8 N
A
NA
N
A
0.86
1.
6 N
A
4.92
N
A
JL-L
ower
Lak
e 18
/06/
0814
30
0.03
6 0.
004
0.02
0 0.
003
0.59
0.
1 0.
03
2.9
1.36
AN
ZE
CC
200
0 T
rop
ical
wet
lan
ds
gu
idel
ines
.0
1 to
.05
.0
05 -
.025
0.
010.
01.3
5 -1
.2
� Sam
ple
Lo
cati
on
T
ime
pH
te
mp
co
nd
D
O
DO
tu
rbid
ity
Dat
e
(u
S/c
m)
(mg
/L)
(%S
AT
) N
TU
JL
-Top
Lak
e
23/0
7/07
93
45.
97
21.7
7 75
.33
7.67
87
.43
217.
67JL
-Cha
nnel
26
/06/
07
1600
5.73
23
.80
68.2
3 2.
67
33.8
0 10
8.50
JL-T
op L
ake
23/1
1/07
1630
4.39
31
.40
295.
55
5.51
77
.10
>800
JL-M
iddl
e La
ke
23/1
1/07
14
004.
60
36.5
0 21
7.03
4.
32
63.5
7>8
00
JL-L
ower
Lak
e
24/1
1/07
93
05.
61
29.2
2 12
2.70
1.
19
17.6
620
5.50
JL
-Top
Lak
e
15/0
4/08
13
00
NA
N
A
NA
N
A
NA
N
A
JL-L
ower
Lak
e
15/0
4/08
14
00
6.94
29
.33
53.2
0 2.
50
33.3
3 6.
65
JL-T
op L
ake
19
/06/
08
1500
5.
54
22.4
6 54
.50
1.06
12
.11
71.4
4 JL
-Cha
nnel
17
/06/
08
1320
6.
06
23.5
0 53
.37
2.52
29
.47
33.7
0
JL-M
iddl
e La
ke
17/0
6/08
15
00
5.97
24
.00
102.
94
4.94
59
.08
128.
50
JL-L
ower
Lak
e 18
/06/
0814
30
6.04
25
.22
62.1
5 5.
30
64.9
0 8.
49
AN
ZE
CC
200
0 T
rop
ical
wet
lan
ds
gu
idel
ines
8.
00
90-
120
Item
s�high
lighted
�in�re
d�exceed
�the�ANZECC
�200
0�Water�Qua
lity�Guide
lines.�
� �
� �