Embed Size (px)
Citation preview
A Health Census Of A Community With
Groundwater Contamination
Jackson Township, 19S0
Prepared by
Margaret G. Conomos, M.P.H.
Research Scientist III
Environmental Health Hazard Evaluation Program
Division of Epidemiology and Disease Control
New Jersey State Department of Health
Trenton, New Jersey 08625
, 1983
TABLE OF CONTENTS
LIST OF ILLUSTRATIONS iv
LIST OF TABLES v
ACKNOWLEDGEMENTS vii
INTRODUCTION 1
METHODS 5
Collection and Analysis of Data 5
Statistical Methods 6
RESULTS 9
Survey Population 9
Health Complaints 10
Skin and systemic effects of groundwater .
according to proximity to the landfill 14
Systemic effects of groundwater according
a to length of time of well use and depth of well 14
Skin and eye and ear effects according to
frequency of skin exposure 15
Reproductive effects of ground water 16
Air Sampling Measurements 17
DISCUSSION 21
REFERENCES 26
TABLES 27
APPENDIX 1. Instructions to Interviewers 63
APPENDIX 2. Community Survey Questionnaire:Jackson Township 1980 . 70
APPENDIX 3. Memo on Groundwater Contamination 104
LIST OF ILLUSTRATIONS
Map
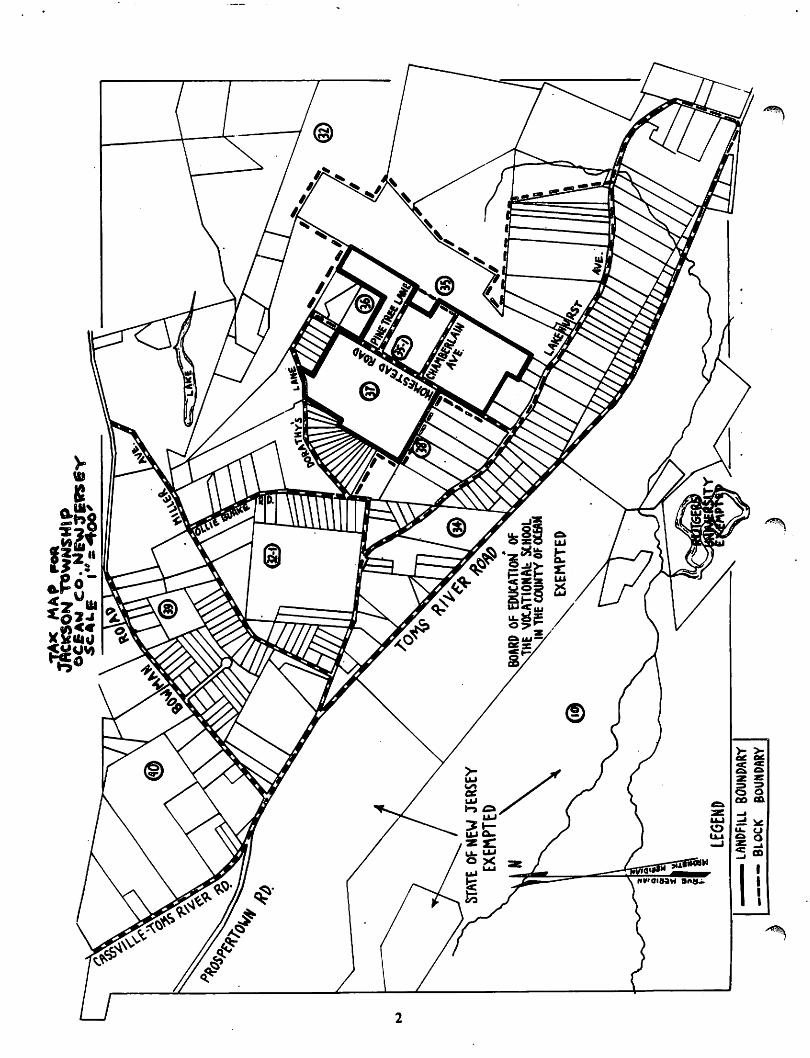
1. Tax Map for Jackson Township, Ocean County, New Jersey 2
Graph
1. Reported Year and Outcome of Pregnancies Completed
Following Move to Jackson Township, 1980 18
IV
LIST OF TABLES
1. Distribution of Population Sampled by Age, Sex, and Race, Jackson, 1980. 28
2. Distribution of Respondents Among the Ten Blocks, Jackson, 1980. 29
3. Distribution of Population Sampled by Lifetime Cigarette Consumption,
Jackson, 1980. 30
4. Classification of Residents by Current Occupation, Jackson, 1980. 31
5. Comprehensive Listing of Occupation Titles, Jackson, 1980. 32
6. Report of Noticing Skin Problems Following Bathing or Showering
Among 560 Residents, Jackson, 1980. 35
7. Report of Systemic Problems Among 560 Respondents whose Onset was
After Start of Well Use, Jackson, 1980. 36
8. Classification of "Other Illnesses" Reported in Table 7
(Classification adapted from Eighth Revision, International
Classification of Diseases), Jackson, 1980. 37
9. Classification of Hospitalization Reported in Table 7
(Classification adapted from Eighth Revision, International
Classification of Diseases), Jackson, 1980. 39
10. Proportion of Males and Females Reporting Skin and Systemic Effects,
Jackson, 1980. 41
11. Percent Age Distribution of Males Reporting Skin Problems After
Showering or Bathing with Well Water by Age at Interview and
Type of Skin Problem, Jackson, 1980. 42
12. Percent Age Distribution of Females Reporting Skin Problems After
Showering or Bathing with Well Water by Age at Interview and Type
of Skin Problem, Jackson, 1980. 43
13. Percent Age Distribution of Males Reporting Systemic Problems Since
Start of Well Use by Age at Interview and Type of Health Problem,
Jackson, 1980. 44
14. Percent Age Distribution of Females Reporting Systemic Problems
Since Start of Well Use by Age at Interview and Type of Health Problem,
Jackson, 1980. 45
15. Distribution of Respondents Reporting Systemic Problems by Smoking
History, Jackson, 1980. 46
16. Proportion of Respondents Reporting Local and Systemic Effects by
Chemical Exposure on the Job, Jackson, 1980. 47
LIST OF TABLES (Continued)
17. Distribution of Reported Acute Infections of the Kidney, Bladder
or Urinary Tract After Start of Well Use, Jackson, 1980. 48
18. Distribution of Reported Chronic Kidney Conditions After
Start of Well Use, Jackson, 1980. 49
19. Age-adjusted Rates Per 100 of Respondents Reporting Local
and Systemic Effects by Block, Jackson, 1980. 50
20. Age-adjusted Rates Per 100 for Respondents Reporting Systemic
Effects Since Start of Well Use for Drinking and Cooking
by Depth and Years of Well Use, Jackson 1980. 51
21. Age-adjusted Rates Per 100 of Respondents Reporting Skin
Problems and Eye or Ear Problems by Usual Number
of Showers and/or Baths per Week, Jackson 1980. 52
22. Age-adjusted Rates for Respondents Reporting Skin Problems
by Number of Times Dishes Washed by Hand per Week
When Well Water was Used, Jackson, 1980. 53
23. Distribution of Reported Pregnancy Outcomes by Residence
During Pregnancy, Jackson, 1980. 54
24. Percent Distribution of Reported Pregnancy Outcomes by
Residence During Pregnancy (Jackson (J) and before
Jackson (BJ) and Maternal Age at Pregnancy, Jackson, 1980. 55
25. Rates Per 100 of Reported Pregnancy Outcomes by Block,
Jackson, 1980. 56
26. Rates of Reported Pregnancy Outcomes Since Start of Well
Use by Depth and Years of Well Use, Jackson, 1980. 57
27. Characteristics of Legler Households Selected for
Air Sampling, Jackson, 1980. 58
28. Specific Occurence and Concentrations (parts per billion) of Organic Compounds in Selected Legler and
Non-Legler Basements, Jackson, 1980. 59
29. Concentrations of Measured Chemicals in Legler and
Non-Legler Households, Jackson, 1980. 60
30. Incidence of Urinary Tract Infection According to Age
and Sex, Jackson, 1980. 61
31. Frequency of Selected Reproductive Endpoints,
Jackson, 1980. 62
VI
ACKNOWLEDGEMENTS
f^ I would like to express gratitude and appreciation to the following individuals who had major roles in conducting the field work and/or contributing to the
preparation of this report:
Toshi Abe
Ronald Altman, M.D.
3oanne Bill
Elizabeth Brooks
Herbert Budrecki
Evelyn Burd
Greg Creamer
John Crutchfield
Kathleen Gensheimer, M.D.
Robert Gogats
Haig Kasaback
Charles Kauffman
Betsy Kohler
Mike Lakat
4PK David Martin
Victoria Mele
Alex Mogielnicki
Helen Monks
Joan Morrell
John Muccioli.
Dhun Patel, Ph.D.
Anne Pfieffer
Kenneth Rosenman, M.D.
Wayne Saunders
John Siade, M.D.
Annette Stemhagen, Dr.P.H.
Kerry Tessein
Henry Voss
I would also like to acknowledge the residents of the Legler Section of
Jackson Township, without whose cooperation, this work would not have been
possible.
Margaret G. Conomos, M.P.H.
VII
INTRODUCTION
Jackson Township landfill is owned and operated by Jackson Township
and is located on and about Homestead Road in the Legier Section in Jackson
Township, Ocean County, New Jersey (Map). The landfill overlies the
Cohansey aquifer which was the prime source of water for the shallow wells
found in residences proximate to the landfill. The landfill had been in
operation since approximately April 24, 1972, when it was registered by the
Department of Environmental Protection (DEP). Under the condition of the
registration, the landfill was prohibited from accepting or disposing of "liquid
or soluble industrial materials" such as chemical wastes.
jpav The landfill was not insulated from the underlying groundwaters and/or
from surface waters in the area. The landfill was originally'located in a
relatively undeveloped part of the Township, but many new homes have been
built and occupied in the area'in recent years. The soil in the area is sandy,
and the homes occupied prior to 1979 used water from shallow wells as their
potable supply. Complaints about water quality in the summer of 1978 led
the DEP to obtain water samples for analysis. The earlier samples were
subjected to routine tests, such as for bacteriological contamination and
selected inorganic chemicals. By December 1978, more samples had been
analyzed (partly in the Department of Health Laboratory), and contamination
of the aquifer with a variety of organic chemicals was demonstrated.
In general, there was more contamination near the landfill, but there
r were variations in test results from the same wells taken at different times.
MA*..**
STATE OF NEW JERSEY
EXEMPTED
N
OF EDUCATION OF
VOCATIONAL SCHOOL
JNTHECOUMTYOFOtEAM
LANDFILL BOUNDARY
BLOCK
BOUNDARY
Despite this limitation, geologists from DEP were able to define an area
f** around the landfill which was subject to the contamination emanating from
this dump. The contamination has been ascribed to illegal chemical dumping
in the area, and the landfill has been judicially determined to be the
repository for much of this waste. Various regulatory actions were initiated
in December, 1978, and the landfill has been closed since February, 1980.
The contamination included compounds which are on the federal Envi
ronmental Protection Agency (EPA) Priority Pollutant List, and the observed
levels were high enough to generate concern about the risk to human health
from a long-term consumption of this water. In November 1978, the Board of
Health of Jackson Township, in consultation with the State Departments of
Health and Environmental Protection, advised families neighboring the
landfill not to use water from their wells for potable purposes due to
' chemical contamination of the aquifer. Since about January, 1979, until
June, 1980, local authorities had provided water in tank trucks to area
residents for potable purposes. Houses occupied since that time have had
their water supplied from deep wells which DEP feels draw from a relatively
clean aquifer. All the residents now have an alternative clean source of
water supply.
During January of 1980, the Concerned Citizens Committee, comprised
of the 94 households involved in a class action lawsuit, completed health
surveys, consisting of mailed self-administered questionnaires, similar to one
of the surveys administered at Love Canal. The form had a checklist for 148
signs, symptoms and conditions, as well as questions related to medications,
occupation, chemical exposure, family history and maternal history. The
cover letter to the survey stated that the dual purpose of the survey was to
assist in obtaining federal funds for health purposes, and to assist the
Committee's attorney in preparing for litigation by providing information
about health problems as they might be related to the groundwater. The
completed surveys from 82 households (87% response rate) were evaluated by
the New Jersey State Department of Health, and the responses suggested
that the only significant complaints were related to skin irritation and, to a
lesser extent, eye irritation (Groundwater Contamination and Possible Health
Effects in Jackson Township, New Jersey, July 1980).
Since the Health Department had some concern about long-term
effects of exposure to the water, it was decided to obtain a census of the
community for possible use at a later date. To be useful, such a census
should have information about exposure to the water supply, so that detailed
information on water supply and usage was obtained. As the census was done
by personal interview, it was felt that better data could be obtained on the
health of the community than from the self-administered questionnaire
analyzed in our first study; and, therefore, health questions were included in
the census with particular emphasis on areas which were of concern to the
citizens or that came out of the analysis of the first questionnaire. The
design of the census permitted an analysis of some health effects compared
to exposure to the water. This report largely contains results of this analysis.
In addition, it was decided that the air of a representative sample of
homes be tested for possible chemical contamination from the groundwater.
It was also felt necessary to test the air in the basements of some homes
away from the Legler Section for comparison purposes. This report also gives
the results of that investigationi
METHODS
Collection and Analysis of Data
Under the supervision of a physician of the New Jersey State Depart
ment of Health, the Community Services Division of the Ocean County
Health Department coordinated and completed the Health Survey between
the months of August and November, 1980. A letter requesting a personal
interview was sent to each residence in the Legler Section of Jackson
Township. Appointments were made with the head of the household to be
interviewed, and other members of the household were requested to be
present.
Interviews were conducted in the home by one of the three trained
nurse interviewers. At the time of the interview, the intent of the survey
was explained, and 'the family was advised of the confidentiality of the
information and adult members of the family were asked to sign an informed
consent. They were also requested to sign a release of medical records, if
any health problems were reported. A three-part questionnaire was used.
The first part consisted of eight pages of forty-four questions designed to
identify all members of the household and collect information considered
relevant to the sources of drinking and cooking water while living in the
Legler Section of Jackson Township. The second part consisted of thirteen
pages of fifty-eight questions asked of each member of the household. An
adult member responded for children. Questions were designed to elicit
demographic data, residential history, occupational history, smoking history,
water use patterns, acute skin problems, and chronic health problems. The
third part consisted of six pages of twenty-six questions asked of each female
household member who had ever been pregnant. Responses concerning the
four possible mutually exclusive pregnancy outcomes of live births, mis
carriages, stillbirths, and therapeutic abortions, as well as birth defects and
infant and child deaths, were gathered. Copies of the instructions to the
interviewers and the questionnaire are in appendixes 1 and 2, respectively.
Answers were coded and computerized. The results were checked for
logical consistency and gross errors. Keypunched data were stored and
analyzed on an IBM 370 system, with APL and SAS software. Responses
dealing with medical problems were coded by the Eighth Revision of the
International Classification of Diseases (ICD-8). All medical problems
diagnosed after the start of well water use for drinking and cooking water
were included in the analysis. The time between first exposure to the
groundwater and the diagnosis of the medical problem may have ranged from
a month to more than ten years. •
Statistical Methods
The basic hypotheses being tested were that trends exist in health
effects, with the highest exposures having the highest percent of respondents
reporting health effects, and the lowest exposures having the lowest percent
of respondents reporting health effects. Although the onset of disease could
be approximately determined from the respondents, based on reported date of
diagnosis, it was not possible to definitively determine the onset of exposure
to contaminated ground water. Therefore, it was simply assumed that
reported date of start of well use was equivalent to the date that exposure
began.
The statistical test used was the test for a linear trend in proportions
(Snedecor, 1967). In this application, the measures of exposure, years of well
use, frequency of showers and/or baths per week, and frequency of dishes
washed per week, were each grouped into four categories of increasing
exposure, and the assigned scores were the estimated median of each group.
Also, using the information from a DEP Geological Survey (Appendix 3),
a dichotomous presentation of high and low exposure areas was possible. The
higher exposures were presumed to be on Blocks 34, 37, and 38, and the lower
exposures were on Blocks 10, 32, 32-1, 35, 36, 39, and 40. The decision on
grouping high and low exposure areas was made after the interview but prior
to the analysis of the health data. Criteria used in reaching this decision
include:
1) The two major sources of groundwater pollution identified were
the Jackson Township Municipal Landfill located on Block 37 and
the Kenneth Wickham property on Block 38.
2) The major groundwater component from the landfill and the
Wickham property is toward the southeast (Appendix 3).
3) DEP sampling data, which was used to establish the extent of
contamination, showed high levels of pollution in Blocks 34, 37
and 38.
The rates of health effects stratified by well water use and residential
block were age-adjusted by the direct method of standardization to the 1970
United States standard million population. Because these rates have been
age-adjusted to the same standard, these rates may be directly compared
with one another.
Relative risk is the rate of illness among those exposed to a given
factor divided by the rate of illness among those not exposed to a given
factor. Estimates of relative risk (odds ratios) and significance levels were
obtained on stratified sets of tables using the Mantel-Haenszel procedure
(1959). The classic chi-square test of independence was also used.
RESULTS
Survey Population
In the area identified by geologists as at risk for having a contaminated
shallow aquifer, there were 162 households. This is in agreement with the
estimate of 165 homes made by the Concerned Citizens Committee. There
were 150 households (92.6%) who responded to the survey. Among the
households not responding to the survey, members from 9 households (5.5%)
refused to be interviewed, and members from 3 households (1.9%) moved
from the area and were not contacted.
In the 150 households surveyed, there were 560 persons. Of these
people, 50% were male and 50% were female; 97.3% were white, and 2.7%
were non-white. Thirty-nine percent were children (19 years of age or
younger). The median age group was 25-29. The population's distribution by
race, sex, and age is shown in Table 1.
A tax map of the surveyed area is shown in Map 1. For tax purposes,
the area is divided into sections called blocks. One of the parameters was
determined by residency of different blocks. Of the ten blocks surveyed,
approximately 40% of the residents lived on Block 34 (Table 2).
The lifetime cigarette consumption of smokers and exsmokers is shown
in Table 3. Sixty percent of the population were non-smokers; this
sub-population included children.
Forty percent of the population were employed at the time of the
interview. Their occupations may be classified into 9 categories, based on
the Occupational Classification System in the 1970 Alphabetical Index of
Industries and Occupations (pp X-XIV) published by the U.S. Bureau of the
Census. The greatest proportion were craftsmen (Table <0. Eighteen percent
of the population were housewives, and twenty-five percent were students.
A more detailed description of each category is shown in Table 5. Sixty-six
individuals (11.8%) reported chemical exposure on a job; three individuals
(0.5%) had chemical exposure at home which was not related to the water
supply.
Health Complaints
The sets of questions concerning skin problems and other health
problems are to be found on pages 88 through 95. There were ten categories
of skin problem questions: acne, psoriasis, excessive dryness, hives, redness,
itching, blisters, scaling, sore lips and gums, and other skin problems. The
other health problem questions included eye or ear problems during the past
three years for which a physician was consulted, hospitalization during the
past 10 years excluding pregnancies, kidney illness, liver illness, cancer,
neurological illness, and any other medical problem, besides the ones
previously mentioned, for which a physician had been visited more than 3
times during the past ten years.
For the purpose of classification, the questions are divided into two
groups in the tables: skin effects, which include all categories of skin
problems, and systemic effects, which include all the remaining health
10
/^
problems previously mentioned. The terminology of the specific health
problems in the questionnaire is also found in the tables. In addition, the
terms used in the questionnaire, were selected as representative of how the
respondents expressed their illness. For example, kidney illness was broadly
interpreted to mean not only illness related to the kidney, but also to its
collecting system, i.e. the ureter and bladder.
Of the ten skin conditions, the most commonly reported effect was
itching, followed by other conditions which might be related to or the cause
of itching, like dryness, redness, and scaling (Table 6). Of seven chronic
variables, the broad categories of other illness, eye and ear problem, and
hospitalization were most commonly reported (Table 7). The other illnesses
and reasons for hospitalization are shown explicitly in Tables 8 and 9,
respectively.
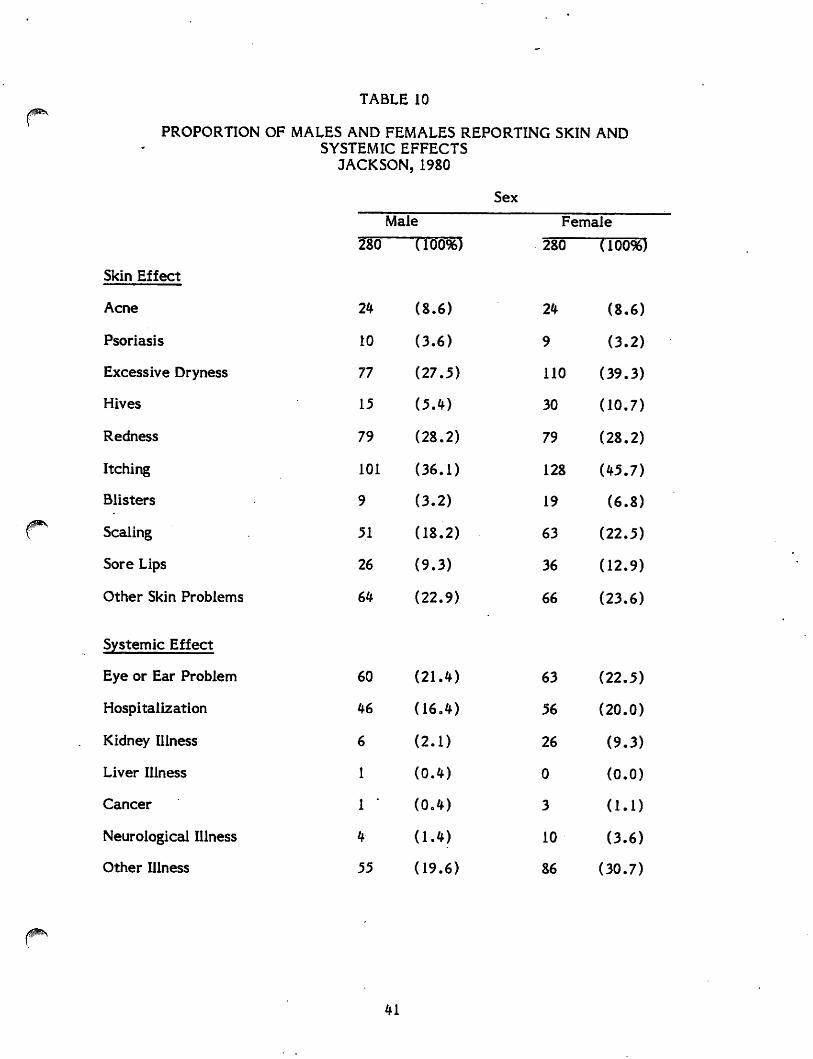
Comparable rates of skin problems were reported by men and women,
except for dryness and itching which were reported in excess by women.
Rates of systemic effects were similar for men and women, except for kidney
illness, and the broad category of other illness which were again reported in
significant excess by women (Table 10).
Reported health problems by age are shown in Tables 11-14.
The distribution of systemic illness in the population by pack-year of
cigarettes is shown in Table 15.
11
The small proportion of respondents who reported chemical exposure on
the job (12%) reported more acne, skin dryness, hives, and redness. There '
was no excessive reporting of systemic conditions among the people with
chemical job exposures (Table 16).
Among the more serious health complaints the Department of Health
was asked to evaluate were reports of kidney, bladder, and urinary tract
disease. Therefore, reported illness of these mentioned sites was considered
in more detail than other health problems. The thirty-two reports of kidney
disease may be divided into two categories based on the time of onset of the
disease: acute infections of the kidney, bladder, or urinary tract and chronic
kidney conditions.
Two men and twenty-two women had reported infections of the kidney,
bladder, or urinary tract. The ages at diagnosis ranged from 4 to 70. Well
use experience ranged from 0.5 to 18 years. The majority of cases (54%)
resided on Block #34. The median reported year of diagnosis was 1978,
although the most frequently reported year of diagnosis was 1980 (Table 17).
Two men and six women reported chronic kidney conditions. The ages
at diagnosis ranged from 8 to 59. Well use experience ranged from 1 to 51
years. The majority of cases (75%) resided on Block #34. The median and
most frequently reported year of diagnosis was 1979 (Table 18).
12
The 8 reports of chronic kidney conditions included kidney stones,
f^ reflux-flowing back, pain in right kidney, right kidney removed, left kidney
removed, total kidney failure, kidney operation and kidney 40% function.
A medical record review was conducted for the latter six reported chronic
renal illnesses to clarify the specific diagnoses. .For three individuals, it was
not possible to obtain medical records. The individual who reported "pain in
right kidney" had never consulted a physician. Neither the person who
reported "right kidney removed" nor the person who reported "left kidney
removed" had signed a Release of Medical Records form.
Three physicians were contacted and responded to corroborate the
remaining reported diagnoses. The individual who reported "total kidney
failure" indeed had chronic renal failure, diagnosed as secondary to diabetic
nephropathy with hypertension and nephrotic syndrome and diabetic retino-
■ pathy. The individual had had juvenile-onset diabetes, diagnosed in 1948,
prior to moving to Jackson. The individual who reported "kidney operation"
had a left extended pyelolithotomy, i.e. an operation for a kidney stone. The
individual who reported "kidney 40% function" has chronic renal disease, of
unknown etiology. In addition, the individual has coronary atherosclerotic
heart disease, diabetes mellitis, and hypertension.
13
Skin and Systemic Effects of groundwater according to proximity to
the landfill
With the exception of redness, a higher proportion of residents on
Blocks 34, 37, and 38 than elsewhere in the Legler section reported
experiencing each skin problem, although only itching and blisters show
statistically significant differences. In addition, with the exception of
hospitalization and neurological illness, a higher proportion of systemic
effects were reported, although none showed a statistically significant
difference (Table 19).
Skin and systemic effects of groundwater according to length of time of well
use and depth of well.
The length of time and depth of well which these respondents reported
using for drinking and cooking were used as measures of their ingestion
exposure to groundwater. Two assumptions were made. First, the longer the
well usage, the greater would be the exposure and therefore the percent of
the population experiencing health effects. Second, the shallower the well
(less than 100 feet), the more contaminated the water (Appendix 3), the
greater would be the exposure and the percent of the population experiencing
health effects. A significantly increasing trend with increasing years of well
water use was observed for reports of hospitalization and kidney illness at all
well depths combined, and the subgroup of well depth less than 100 feet.
Overall, the percentage of respondents reporting health problems was higher
among shallow well users than among deep well users. However, the validity
of the deep well users' data is limited because of the relatively small number
of respondents using deep wells. The frequencies with which health effects
were reported according to years and depth of well use are shown in Table 20.
Skin effects and eye and ear effects according to frequency of skin exposure.
The frequency with which the respondents reported using well water for
showers and/or baths and dish washing was used as a measure of their skin
contact exposure to groundwater, as shown in Tables 21 and 22, respectively.
The interpretation of increasing exposure levels was limited, since most
people reported bathing seven or more times a week or washing dishes less
than seven times per week.
The highest proportion of people reporting acne did not shower or
bathe. Psoriasis was reported least among those who showered most. Of the
remaining symptoms, the reports increased from zero use, but not necessarily
in a linear fashion. Dryness, hives, scaling and sore lips were reported most
by those who showered or bathed four to six times a week. At the highest
exposures (7+), a higher proportion of people reported redness, itching,
blisters, other skin problems, and eye or ear problems. Significant positive
trends were detected for reports of redness, itching, and other skin problems.
Increasing exposure to groundwater by dish washing did not result in
increased reports of skin symptoms in a significant positive trend, except for
one condition, hives. Seven symptoms, acne, dryness, hives, itching, blisters,
scaling, and sore lips and gums showed more reports among those who washed
dishes than among those who did not. Three symptoms, psoriasis, redness,
and other skin problems, showed more reports among those who did not wash
dishes. In fact, increasing dishwashing was associated with decreasing
reports of redness in a significant negative trend.
Reproductive effects of groundwater
Residence in the study area during pregnancy was used as a measure of
the 141 mother's, and hence fetus's exposure, to groundwater in Jackson.
That is to say, mothers' pregnancy outcomes prior to moving to Jackson was
compared to the same mothers' pregnancy outcomes while living in Jackson.
All reported adverse pregnancy outcomes, miscarriages, abortions, stillbirths
and low birth weight, did not occur in a substantial excess in Jackson, in
either the total or specific age groups, except for miscarriages in the "under
20" age group. However, it is difficult to interpret the rate of 40%, since the
numbers representing this percent are small (2/5) (Table 23 and 24).
The birth defect reported after 3& years of parental exposure to
groundwater was described as multiple congenital anomalies. The infant
subsequently died one day later of congenital heart disease, as reported on a
death certificate. The mother had occupational exposure to anesthesia which
has been associated with developmental defects at birth (Pharoah, 1977). The
second infant death, reported after approximately 5 years of parental
exposure to groundwater, was in an 8-month old and the reported cause was
Wilm's tumor. A child death, reported after approximately one year of the
household's exposure to ground water (there was no fetal exposure), occurred
at the age of one year and five months and the cause, reported on a death
certificate, was anoxic-ischemic encephalopathy.
16
#
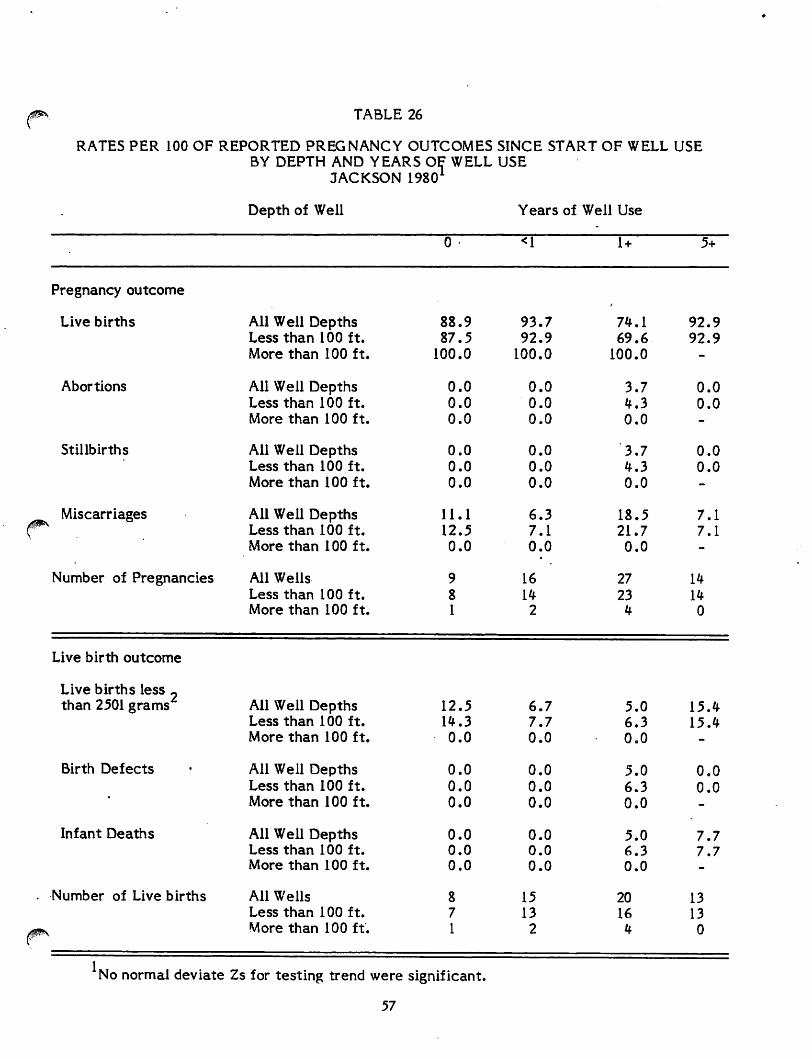
In addition, the sixty-six pregnancy outcomes which occurred while the
women were living in Jackson, were stratified on the basis of various
gradients of groundwater exposure, specifically, by residence block and depth
and years of well use. No statistically significant differences between high
and low. exposure blocks were observed (Table 25); nor was any statistically
significant trend evident from depth and years of well use (Table 26).
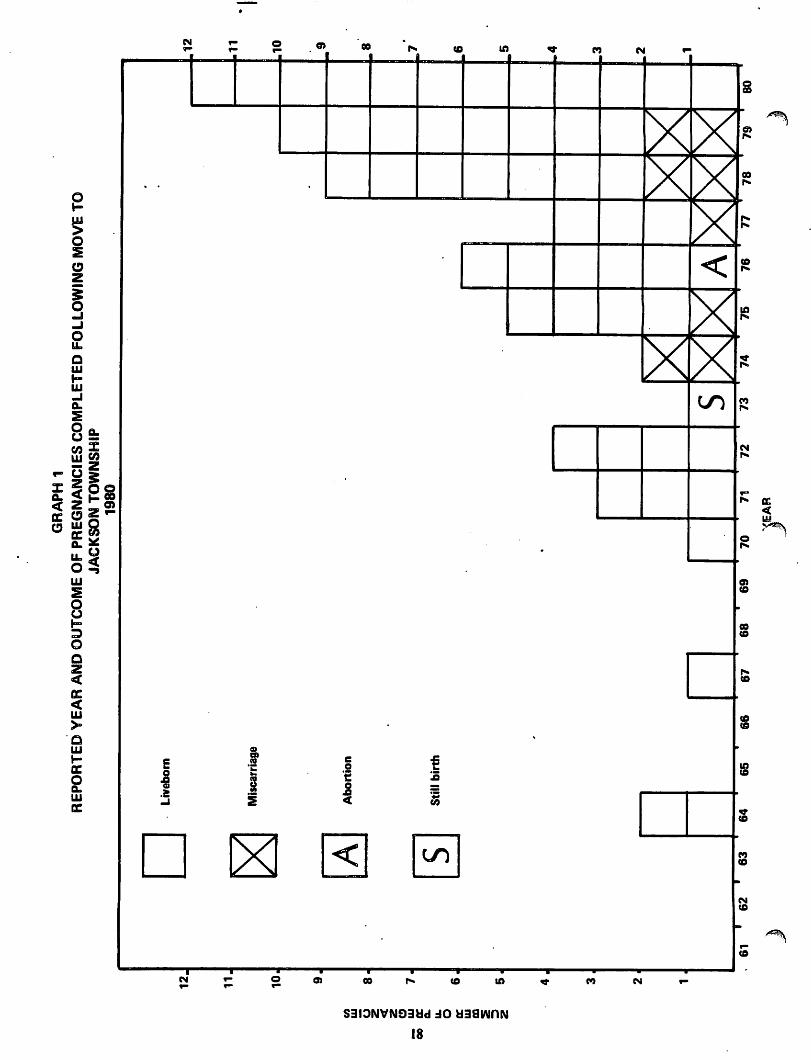
Graph 1 plots the year of pregnancy after moving to Jackson Township,
and is similar in format, but not information, to Figure 2, presented in the
first report of Groundwater Contamination and Possible Health Effects in
Jackson Township, New Jersey, page 33. Six of the sixty-six reported
pregnancies occurred prior to 1961. From 1970 to 1980, there was an almost
linear increase in the number of reported pregnancies, from one in 1970 to
twelve in 1980. Miscarriages, stillbirths and abortions were reported between
the years of 1973 to 1979. No more than two of these outcomes occurred in
any one of those years.
Air Sampling Measurements
During the week of August 18 and 22, 1980, the New Jersey State
Department of Health (DOH) conducted air sampling inside a selected group
of homes in the Legler section of Jackson Township. The purpose was to
determine whether basement contamination by volatile organics, resulting
from groundwater pollution, had occurred.
The presumed exposed population consisted of 15 households located in
five different blocks as designated by municipal tax maps. Of these
17
09
UJ
u
<
Z
O
_
UJ
00
(C
0.
u.
O
oc
UJ
m
2
z
GRAPH 1
REPORTED YEAR AND OUTCOME OF PREGNANCIES COMPLETED FOLLOWING MOVE TO
JACKSON TOWNSHIP
1980
{EAR
households, three had at least one member with a history of reported kidney
'•. disorders. Five homes were still utilizing water from shallow domestic wells
and, at the time of sampling, had not yet been connected to the new, deeper
municipal system. A summary of the presumed exposed households is
presented in Table 27.
Between February 2 and 6, 1981, an unexposed group composed of
volunteers from the local Rotary Club were similarly sampled. The ten
control households similarly utilized water from the Cohansey aquifer but
were located in the northwest section of Jackson Township and were not
exposed to the alleged point source of contamination.
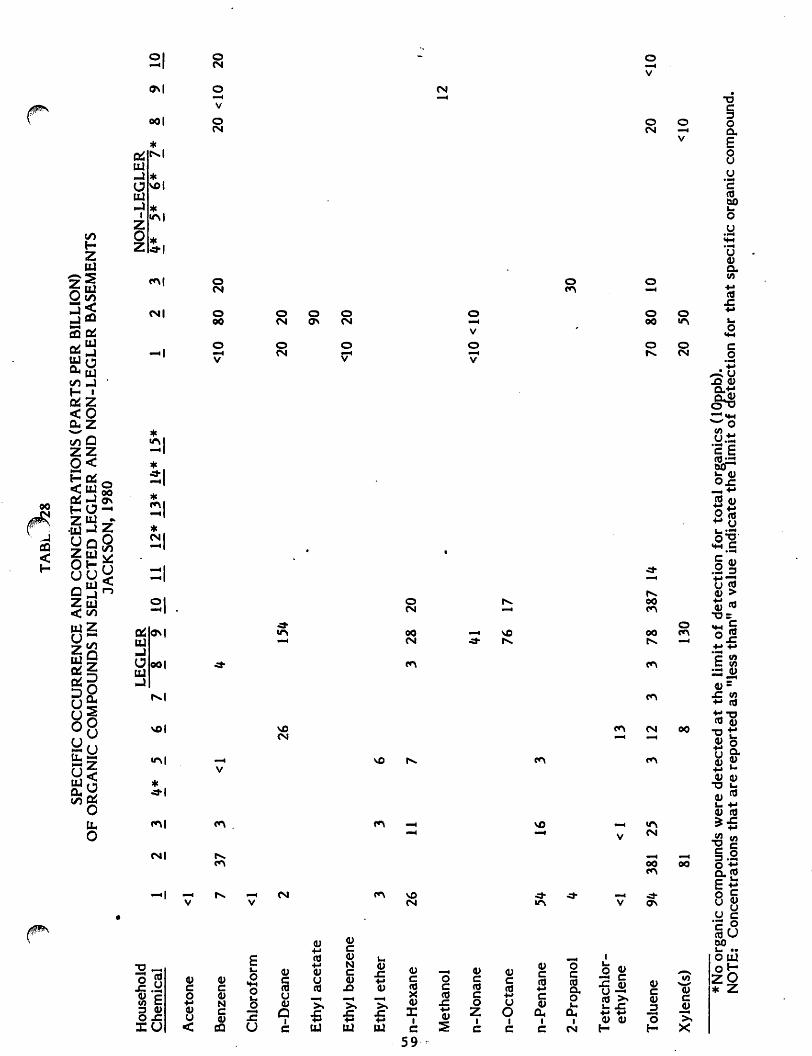
The specific occurrence and concentration of organic compounds in air
in the basements of Legler and non-Legler homes is presented in Table 28.
As shown in the table, several different compounds were usually at low levels
in varying concentrations in both study and control homes. Ten of the 15
case homes (66.7%) showed at least one organic compound while six of the 10
controls (60%) were similarly positive. As such, there was no significant
difference in the number of positive air results between cases and controls
(p = 0.31, Fisher's exact test). Toluene was the most frequently detected
organic compound in the Legler homes.
Table 29 summarizes data on all of the organic chemicals detected in
these air samples; mean, minimum and maximum concentrations are pre
sented for each of these organic chemicals.
19
It appears that there were no significant differences in constituents or
concentrations of detectable organic compounds between Legler and non-
Legler households. Unfortunately, the air samplings in the Legler and control
homes were done during different seasons. These seasonal differences may
mask any slight increase in air levels in the Legler homes as compared to the
control homes. The individuals whose homes were sampled were notified of
the findings, and it was recommended that any household chemicals,
pesticides and materials used for hobbies, etc., be stored in a cool place,
preferably outside their homes, such as in sheds.
20
DISCUSSION
The reported health effects and exposures afforded us the opportunity
to assess if possible relationships exist between adverse health effects and
exposure to toxic materials present in a landfill site. To this end, 560
individuals from 150 households were interviewed. This was a response rate
of 92.6% of the potentially exposed households. With this high a response
rate, the results obtained can be considered to be representative of reported
health problems in this community.
One of the major difficulties in assessing the health effects of toxic
waste dumps is to be able to assess the differing levels of exposures
individuals have had. Since there is no information available to quantitate
previous exposure, four methods were used to estimate individuals' exposure:
1) for skin and systemic problems: residence in the area suspected of having
the highest contamination; 2) for systemic problems: years of well use; 3) for
systemic problems: use of shallow wells which were felt to have higher levels
of contamination than deep wells; and 4) for skin problems: number of
showers or baths per week, and number of times an individual washed dishes
per week.
If health complaints are related to toxic contaminants in the water, one
would expect increased symptoms to be associated with increased measures
of exposure. Of the ten categories of skin complaints recorded (Table 6), the
report of blisters was statistically increased among residents in the presumed
more highly contaminated area (Table 19). Redness, itching and other skin
problems were statistically associated with increased showering or bathing
21
(Table 21), and hives were statistically associated with number of times an
individual washed dishes per week (Table 22). The results were not totally
consistent across the three measures of exposure used. For example,
although redness was increased among individuals who reported increased
showering or bathing, there were less reports of redness in individuals who
reported washing the dishes frequently and in individuals living on the
presumed higher contaminated blocks than the less contaminated blocks.
Various haiogenated organic compounds have been found in the well water.
At higher concentrations in occupational settings, these compounds have been
associated with similar skin symptoms. We, therefore, see the occurrence of
these skin symptoms and their relationship, although not totally consistent,
with measures of water exposure to be biologically plausible.
The percentage of individuals who reported systemic problems is shown
in Table 7% The "other illnesses" are classified in Table 8. There were no
particular diseases that were reported in excess. Besides skin rashes,
common illnesses like bronchitis, hypertension or sore throat were the most
frequently reported illness. The reasons for hospitalization are reported in
Table 9. Again, there was no single cause for hospitalization reported in
excess. The most common reasons for hospitalization were cystitis/urinary
infection", uterine dilatation and curettage, concussion and tonsillitis
acute/removal.
No systemic illness was statistically associated with living in the
presumed more highly contaminated area (Table 19). When systemic illness
was correlated with years of well use, both kidney illness and hospitalization
were reported with highly significant increasing frequency with increased
22
years of well use (Table 20). This trend was seen only in individuals using
\ shallow wells (Table 20). This association with years of well use and, in
particular, shallow wells is consistent with a dose-response relationship.
Hospitalization also increased with years of well use (Table 20). Like
kidney illness, this was seen only in individuals using shallow wells (Table 20).
There was, however, no increase in hospitalization in individuals living in the
presumed high exposure area (Table 19). The absence of any one particular
cause for hospitalization makes the association found between water use and
hospitalization to be of questionable biologic significance. It is hard to
imagine that exposure to water was associated with the wide range of
conditions for which individuals were hospitalized.
The majority of kidney illnesses were diagnosed to be of infectious
origin (Table 17). Urinary tract infections are known to be very common.
They are rarely seen in males before the age of 50 years and are much more
prevalent in females (Rubin, 1982). In Jackson, more women than men
reported urinary tract infections. The age distribution of reported urinary
tract infections in Jackson, was similar to the age distribution shown in a
compilation of published incidence rates (Table 30).
The chronic kidney problems were diverse. One individual reported pain
and had not seen a physician, two had kidney stones, one had reflux, which is
generally considered to be congenital, two individuals with kidney failure had
diabetes and hypertension and two individuals, who had had nephrectomies,
did not sign medical release forms.
23
With our present understanding of the etiology of chronic kidney disease '
and urinary infections, as well as the absence of similar problems in the
occupational settings at higher exposures to the same compounds found in the
contaminated wells, the association between well use and kidney disease
found in this study does not make biologic sense. Further studies of other
similarly exposed groups will be necessary to replicate these findings before
these results can be accepted as more than a statistical coincidence.
The frequency of reported adverse reproductive outcomes among
mothers exposed to groundwater contamination did not increase with
presumed increased exposure to contaminated groundwater, as observed by
three different measures: pregnancies in Jackson compared to pregnancies
before moving to Jackson (Tables 23-24), residence in the presumed more
contaminated area by block (Table 25), and years of well use (Table 26). As
a further observation, the frequency of reported adverse reproductive
outcomes among the fifty- seven pregnancies which occurred between 1970
and 1980, were compared to the expected frequency, as published in the
literature (Table 31). The Stein reference does not show original data, but is
a compilation of many studies. Once again, no excessive frequency was
observed among the pregnancies in Jackson.
In this type of study, the investigators are always concerned about
differential reporting of health effects in the exposed individuals who are
more aware and concerned about the issue than the control or less exposed
group. This type of bias, which epidemiologists call respondent or recall bias,
may have contributed to the results found in this study. However, all
individuals interviewed in this study considered themselves exposed. All
comparisons in the analysis are made between the presence of greater
exposed versus lesser exposed individuals. In order for the associations found
between measures of increasing exposure and our estimates of health
complaints to-be based merely on respondent bias, individuals interviewed
would have needed to have associated living in a certain area, shallow wells,
and frequent or long use with health problems. This may have been true, and
there may have been different levels of concern throughout the community
interviewed. However, we do not believe that respondent bias explains all
our results as the measures of exposure were set up after the study.
Air levels found in the basements of homes around the landfill were
generally low and comparable to levels found in control group of houses. The
data do not support an unusual exposure to chemicals subsequent to the
replacement of contaminated well water.
In summary, an association was found between various skin symptoms,
hospitalizations, kidney disease and exposure to well water. Based on
previous studies done on exposure to similar toxins, only the findings related
to skin symptoms are consistent with the known effects of the chemicals
found in the drinking water, although the concentrations found are much
lower than levels found to cause similar problems in the occupational setting.
These findings are not consistent with current medical knowledge on the
etiology of these diseases. Further work will need to be done on similarly
exposed individuals to replicate the findings that these conditions are
associated with exposure to low levels of chemicals in the water.
REFERENCES
*• Groundwater Contamination and Possible Health Effects in Jackson Town
ship, New Jersey. Division of Epidemiology and Disease Control. New Jersey
State Department of Health, Trenton, 1980.
2. International Classification of Diseases. Manual of the International Statist
ical Classification of Diseases, Injuries and Causes of Death. Eighth
Revision. Geneva: World Health Organization, 1967.
3. Mantel N. Haenszel W. Statistical Aspects of the Analysis of Data From
Retrospective Studies of Disease. Journal of the National Cancer Institute.
1959; 22:719-7*8.
*. Pharoah, P.D.D., Alberman, E. and Doyle, P. Outcome of Pregnancy Among
Women in Anesthetic Practise. Lancet, 1977,1:3*-36.
5. Snedecor, G. W. and Cochran, W.G.: Statistical Methods. 6th edition, Ames,
Iowa State University Press, 1967, pages 2*6-2*8.
6. United States Department of Commerce, Bureau of the Census: 1970 Census
of Population, Alphabetical Index of Industries and Occupations. Library of
Congress, 74-612012.
26

TABLES
27
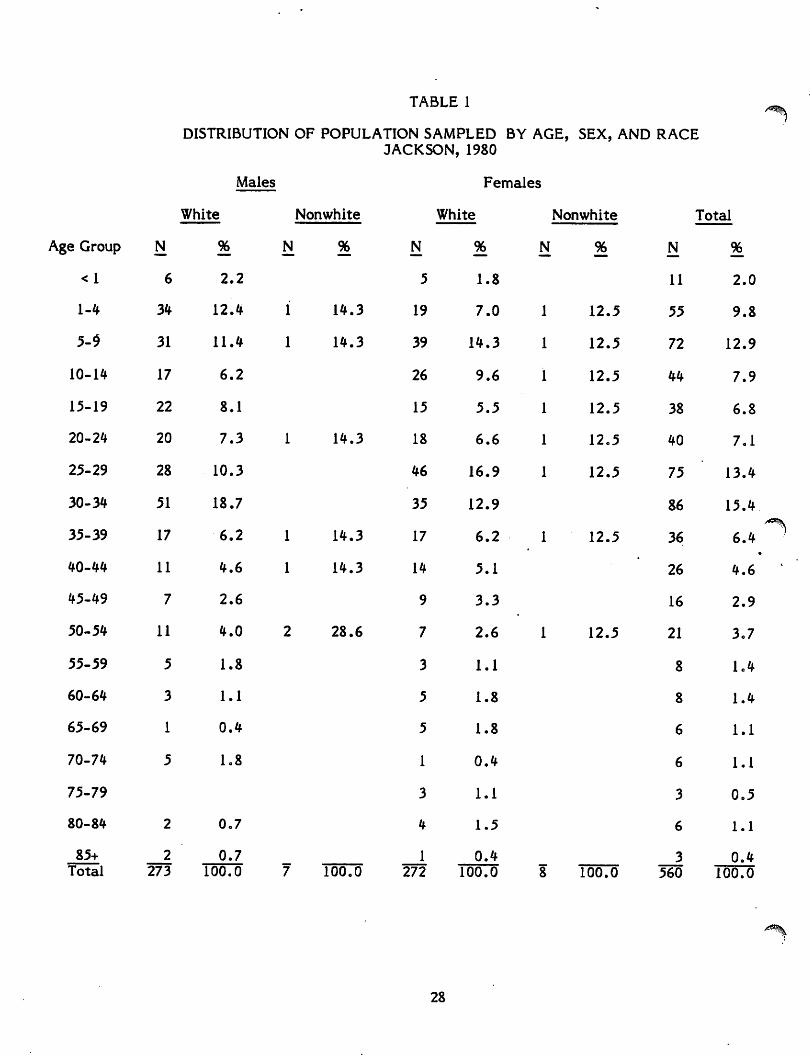
TABLE 1
DISTRIBUTION OF POPULATION SAMPLED BY AGE, SEX, AND RACE
JACKSON, 1980
Males Females
28
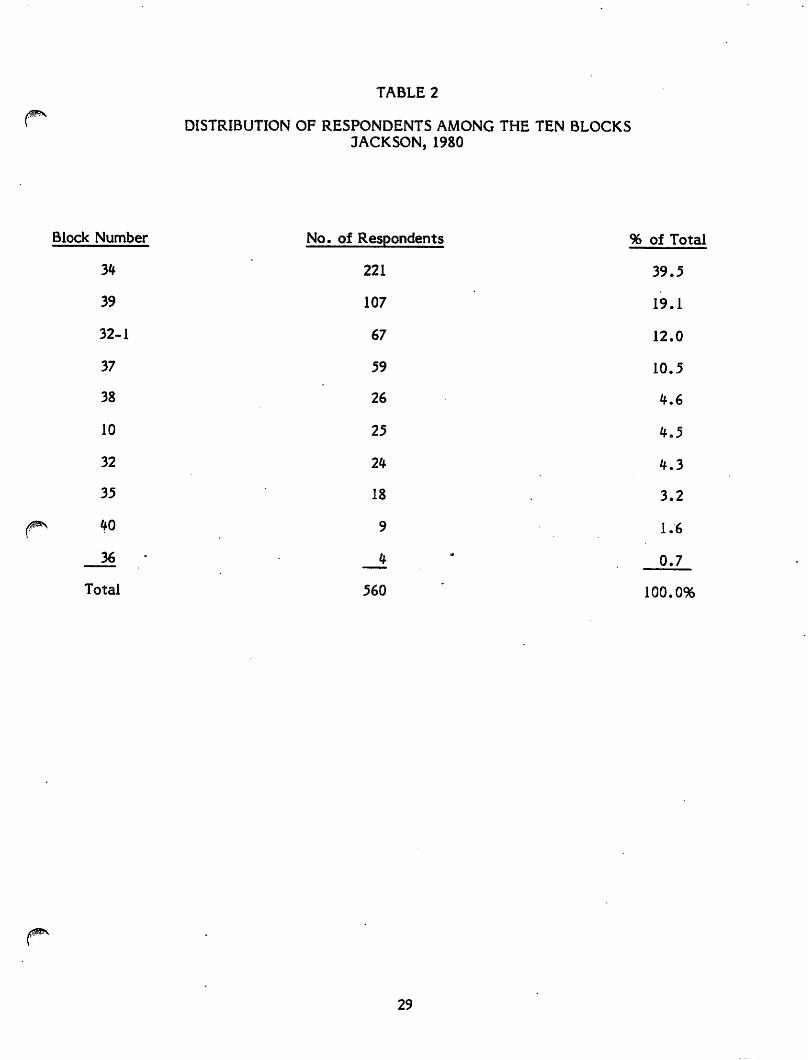
TABLE 2
DISTRIBUTION OF RESPONDENTS AMONG THE TEN BLOCKS
JACKSON, 1980
Block Number
34
39
32-1
37
38
10
32
35
40
36 •
Total
No. of Respondents
221
107
67
59
26
25
24
18
9
4
560
% of Total
39.5
19.1
12.0
10.5
4.6
4.5
4.3
3.2
1.6
0.7
100.0%
29
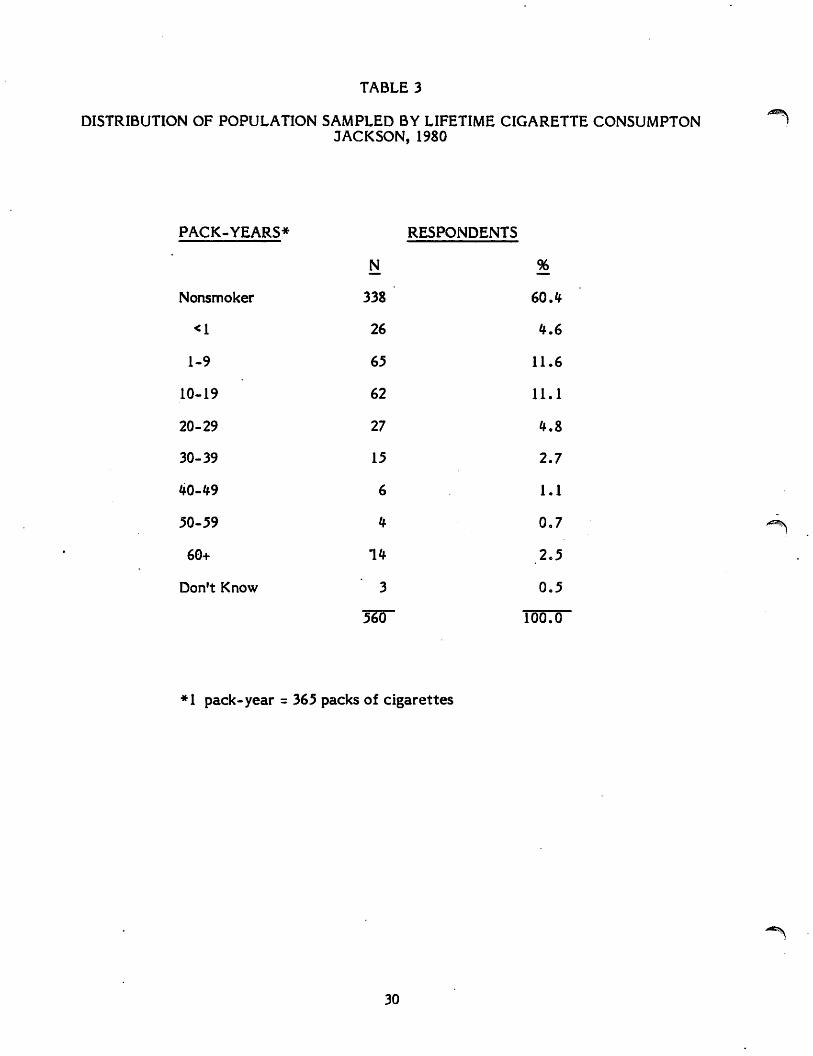
TABLE 3
DISTRIBUTION OF POPULATION SAMPLED BY LIFETIME CIGARETTE CONSUMPTON
JACKSON, 1980
*1 pack-year = 365 packs of cigarettes
30
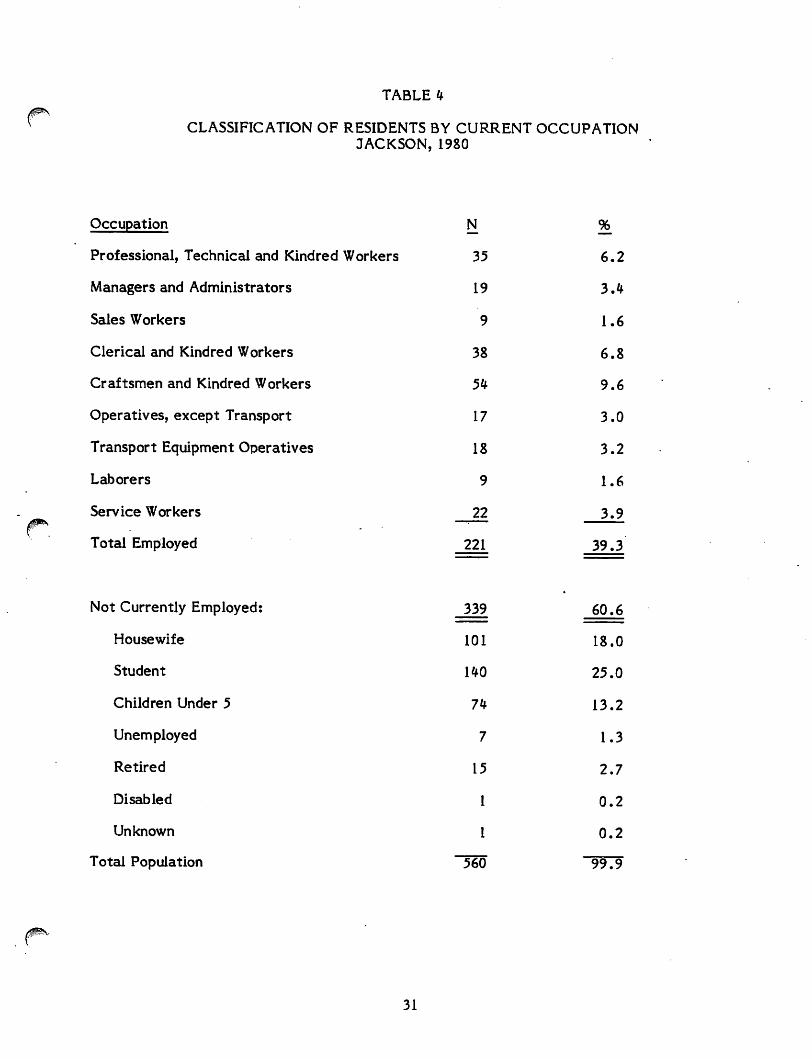
TABLE 4
CLASSIFICATION OF RESIDENTS BY CURRENT OCCUPATION
JACKSON, 1980
31

TABLE 5
COMPREHENSIVE LISTING OF OCCUPATION TITLES
JACKSON, 1980
1. Professional, Technical and Kindred Workers 35
Accountant 1
Architect 1
Computer programmer 1
Computer systems analyst 1
Computer specialist 1
Industrial engineer 1
Engineer 3
Chemists 1
Life and physical scientist 1
Registered Nurse 7
Clinical Laboratory Technologists and Technicians 1
Psychologists 2
Social Workers 1
Elementary School Teacher 4
Secondary School Teacher 2
Teachers, except college and university n.e.c. 2
Chemical Technicians 1
Draftsmen . 3
Painters and sculptors 1
2. Managers and Administrators 19
Assessors, controllers, treasures, local public admin. 1
Bank Officers and financial managers 2
Managers and superintendents, building 1
Office managers 1
Restaurant, cafeteria and bar managers 2
Sales manager and dept. heads, retail trade 1
Sales manager, except retail trade 1
Managers and administrators 9
Farm manager 1
3. Sales Workers 9
Insurance agents, brokers, and underwriters 2
Newsboy 1
Salesmen and sales clerks 6
32
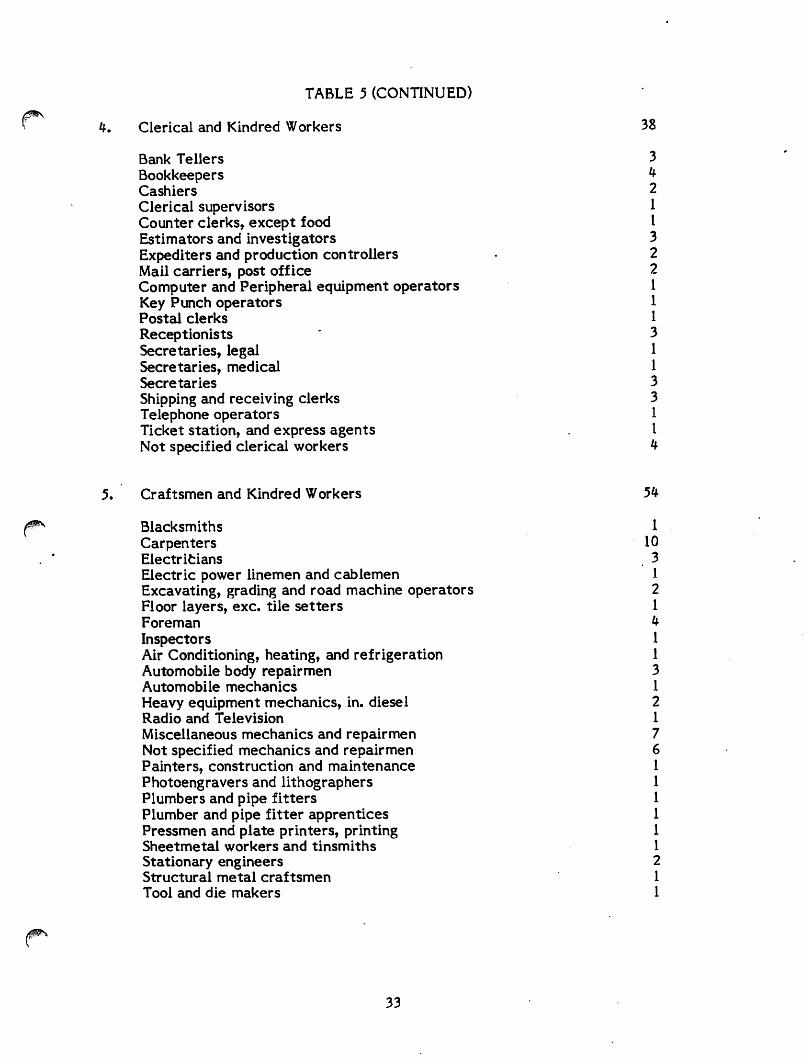
TABLE 5 (CONTINUED)
* 4. Clerical and Kindred Workers 38
Bank Tellers 3 Bookkeepers ^ Cashiers 2 Clerical supervisors 1 Counter clerks, except food I Estimators and investigators 3 Expediters and production controllers • 2
Mail carriers, post office 2 Computer and Peripheral equipment operators 1
Key Punch operators 1 Postal clerks 1 Receptionists ' 3
Secretaries, legal 1
Secretaries, medical 1 Secretaries 3 Shipping and receiving clerks 3
Telephone operators 1
Ticket station, and express agents . I
Not specified clerical workers 4
5. Craftsmen and Kindred Workers 54
Blacksmiths 1
Carpenters 10
Electricians . 3
Electric power linemen and cablemen 1
Excavating, grading and road machine operators 2
Floor layers, exc. tile setters 1
Foreman *
Inspectors 1
Air Conditioning, heating, and refrigeration 1
Automobile body repairmen 3
Automobile mechanics 1
Heavy equipment mechanics, in. diesel 2
Radio and Television 1
Miscellaneous mechanics and repairmen 7
Not specified mechanics and repairmen 6
Painters, construction and maintenance 1
Photoengravers and lithographers 1
Plumbers and pipe fitters 1
Plumber and pipe fitter apprentices 1
Pressmen and plate printers, printing 1
Sheetmetal workers and tinsmiths 1
Stationary engineers 2
Structural metal craftsmen 1
Tool and die makers 1
33
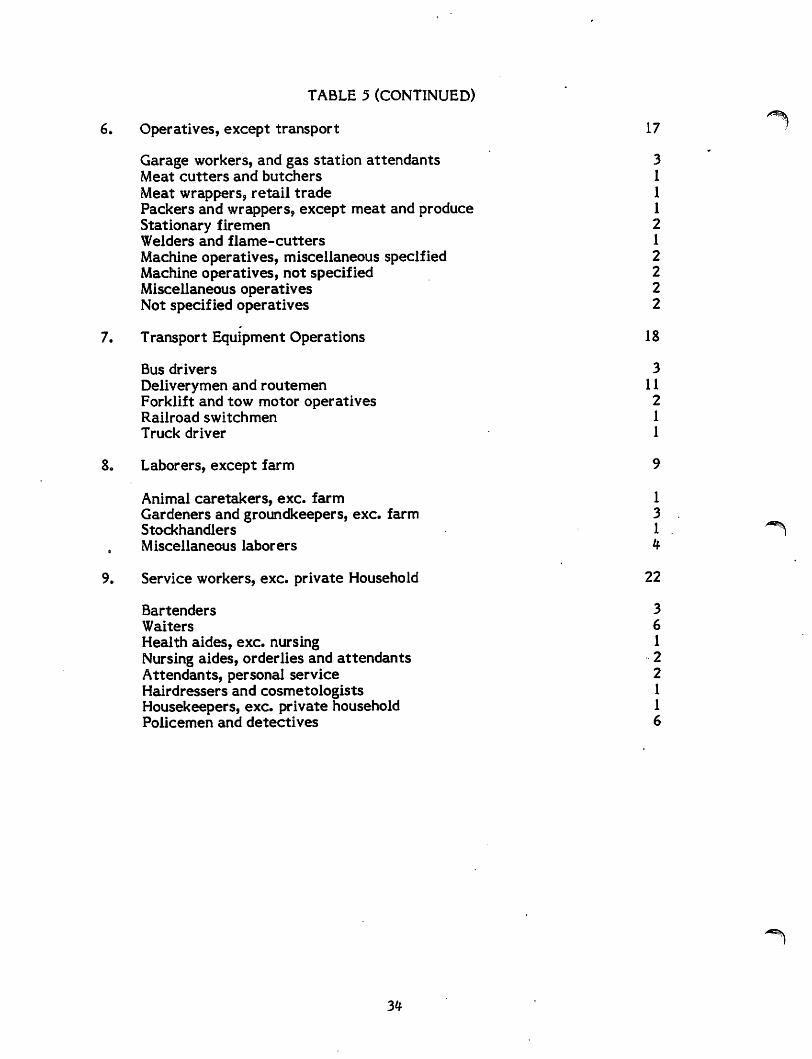
TABLE 5 (CONTINUED)
6. Operatives, except transport 17
Garage workers, and gas station attendants 3
Meat cutters and butchers 1
Meat wrappers, retail trade 1
Packers and wrappers, except meat and produce 1
Stationary firemen 2
Welders and flame-cutters 1
Machine operatives, miscellaneous specified 2
Machine operatives, not specified 2
Miscellaneous operatives 2
Not specified operatives 2
7. Transport Equipment Operations 18
Bus drivers 3
Deliverymen and routemen 11
Forklift and tow motor operatives 2
Railroad switchmen 1
Truck driver 1
8. Laborers, except farm 9
Animal caretakers, exc. farm 1
Gardeners and groundkeepers, exc. farm 3
Stockhandlers 1
Miscellaneous laborers 4
9. Service workers, exc. private Household 22
Bartenders 3
Waiters 6 Health aides, exc. nursing 1
Nursing aides, orderlies and attendants 2
Attendants, personal service 2
Hairdressers and cosmetologists 1
Housekeepers, exc. private household 1
Policemen and detectives 6
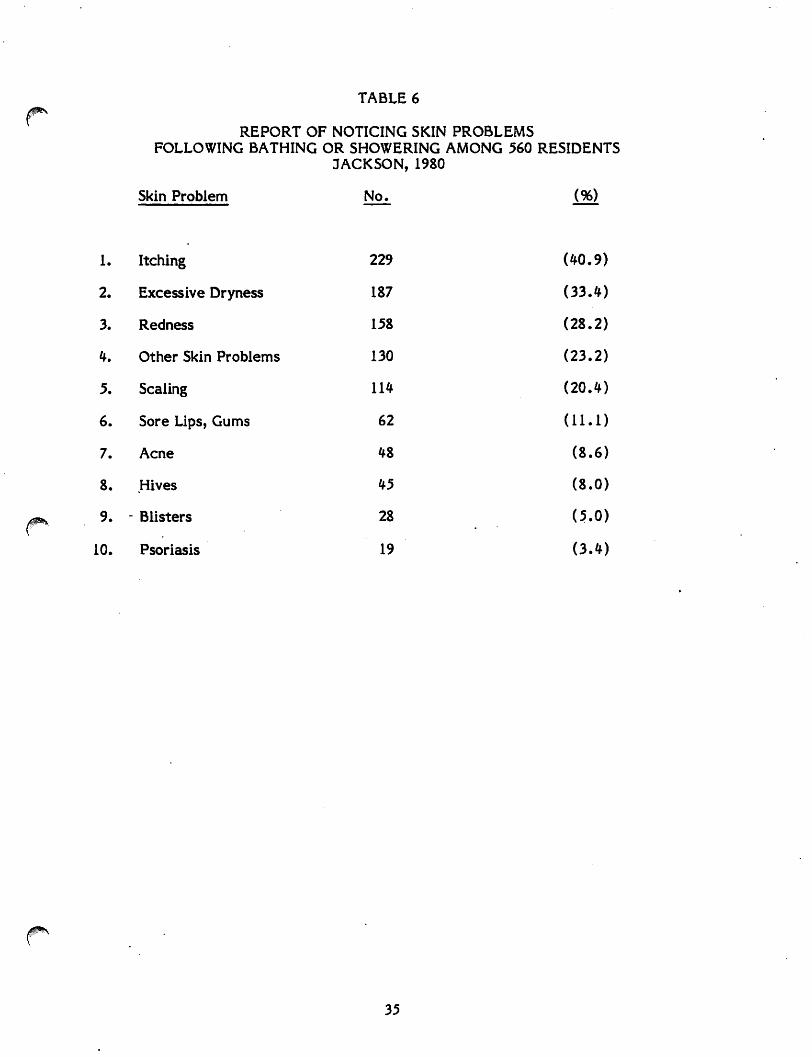
TABLE 6
REPORT OF NOTICING SKIN PROBLEMS
FOLLOWING BATHING OR SHOWERING AMONG 560 RESIDENTS
JACKSON, 1980
(40.9)
(33.4)
(28.2)
(23.2)
(20.4)
(11.1)
(8.6)
(8.0)
(5.0)
(3.4)
35
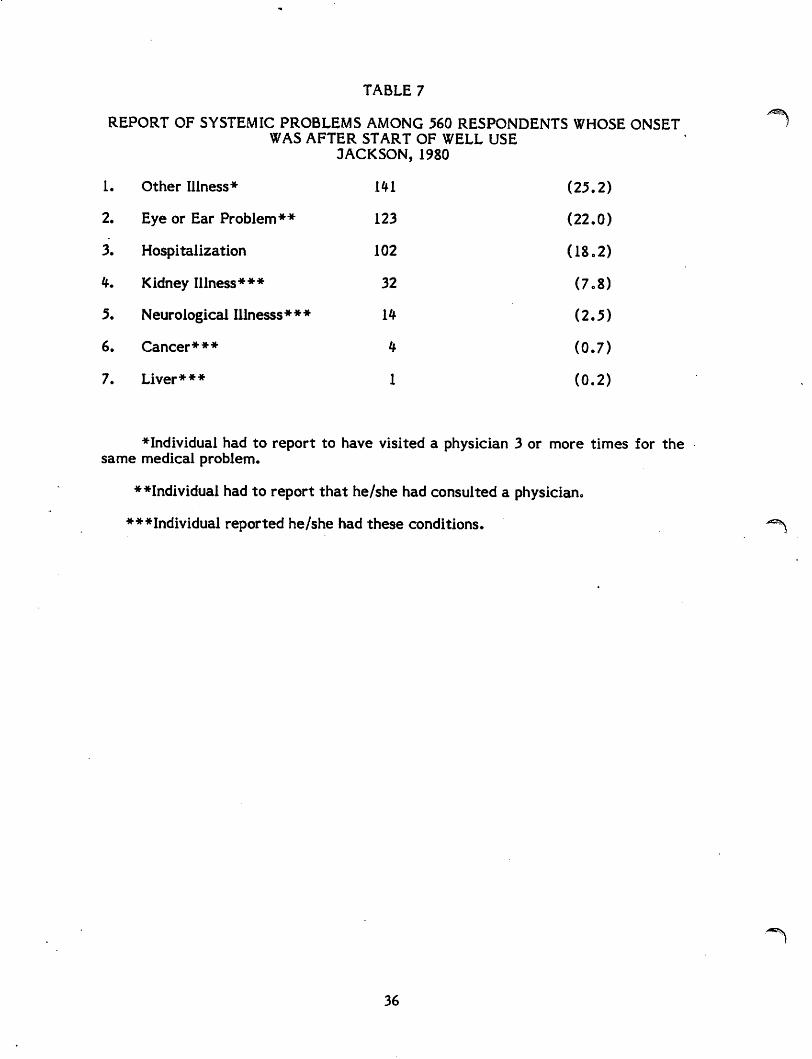
TABLE 7
REPORT OF SYSTEMIC PROBLEMS AMONG 560 RESPONDENTS WHOSE ONSET
WAS AFTER START OF WELL USE
JACKSON, 1980
1. Other Illness* 1*1 (25.2)
2. Eye or Ear Problem** 123 (22.0)
3. Hospitalization 102 (18.2)
4. Kidney Illness*** 32 (7.8)
5. Neurological Illnesss * * * 1 * (2.5)
6. Cancer*** * (0.7)
7. Liver*** 1 (0.2)
♦Individual had to report to have visited a physician 3 or more times for the
same medical problem.
♦♦Individual had to report that he/she had consulted a physician.
♦♦^Individual reported he/she had these conditions.
36
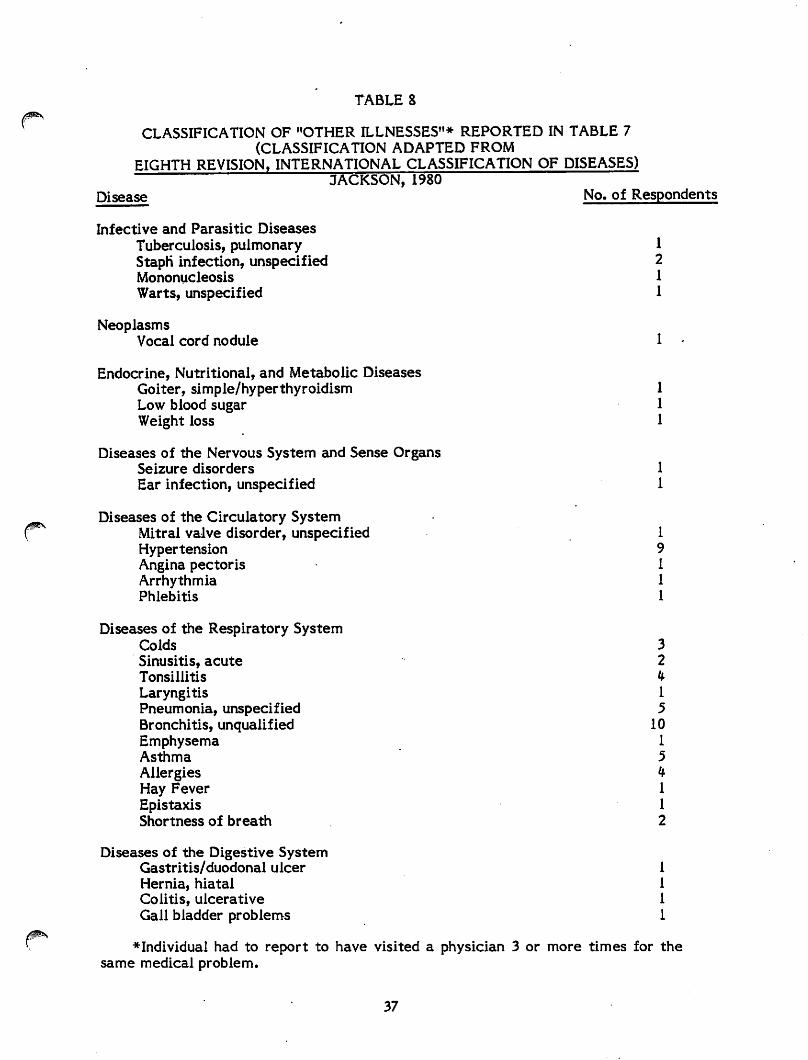
TABLE 8
CLASSIFICATION OF "OTHER ILLNESSES"* REPORTED IN TABLE 7
(CLASSIFICATION ADAPTED FROM
EIGHTH REVISION, INTERNATIONAL CLASSIFICATION OF DISEASES) JACKSON, 1980
Disease No. of Respondents
Infective and Parasitic Diseases
Tuberculosis, pulmonary 1 Staph* infection, unspecified 2
Mononucleosis 1
Warts, unspecified 1
Neoplasms
Vocal cord nodule 1
Endocrine, Nutritional, and Metabolic Diseases
Goiter, simple/hyperthyroidism 1
Low blood sugar 1
Weight loss 1
Diseases of the Nervous System and Sense Organs
Seizure disorders 1
Ear infection, unspecified 1
Diseases of the Circulatory System
Mitral valve disorder, unspecified 1
Hypertension 9
Angina pectoris 1
Arrhythmia 1
Phlebitis 1
Diseases of the Respiratory System
Colds 3
Sinusitis, acute 2
Tonsillitis *
Laryngitis 1
Pneumonia, unspecified 5
Bronchitis, unqualified 10
Emphysema 1
Asthma 5
Allergies 4
Hay Fever 1
Epistaxis 1
Shortness of breath 2
Diseases of the Digestive System
Gastritis/duodonal ulcer 1
Hernia, hiatal 1
Colitis, ulcerative 1
Gall bladder problems 1
♦Individual had to report to have visited a physician 3 or more times for the
same medical problem.
37
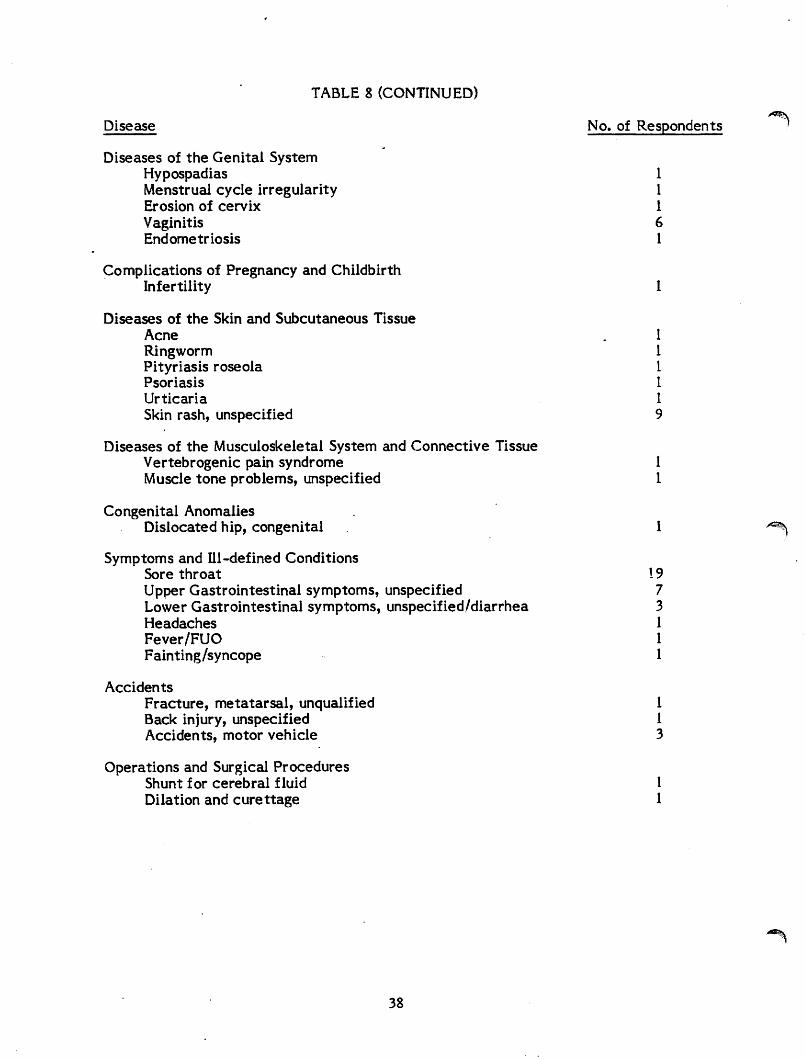
TABLE 8 (CONTINUED)
Disease No> of Respondents
Diseases of the Genital System
Hypospadias 1
Menstrual cycle irregularity 1
Erosion of cervix 1
Vaginitis 6
Endometriosis 1
Complications of Pregnancy and Childbirth
Infertility 1
Diseases of the Skin and Subcutaneous Tissue
Acne . 1
Ringworm 1
Pityriasis roseola 1
Psoriasis 1
Urticaria 1
Skin rash, unspecified 9
Diseases of the Musculoskeletal System and Connective Tissue
Vertebrogenic pain syndrome 1
Muscle tone problems, unspecified 1
Congenital Anomalies
Dislocated hip, congenital 1
Symptoms and 111-defined Conditions
Sore throat 19
Upper Gastrointestinal symptoms, unspecified 7
Lower Gastrointestinal symptoms, unspecified/diarrhea 3
Headaches 1
Fever/FUO 1
Fainting/syncope 1
Accidents
Fracture, metatarsal, unqualified 1
Back injury, unspecified 1
Accidents, motor vehicle 3
Operations and Surgical Procedures
Shunt for cerebral fluid 1
Dilation and curettage 1
38
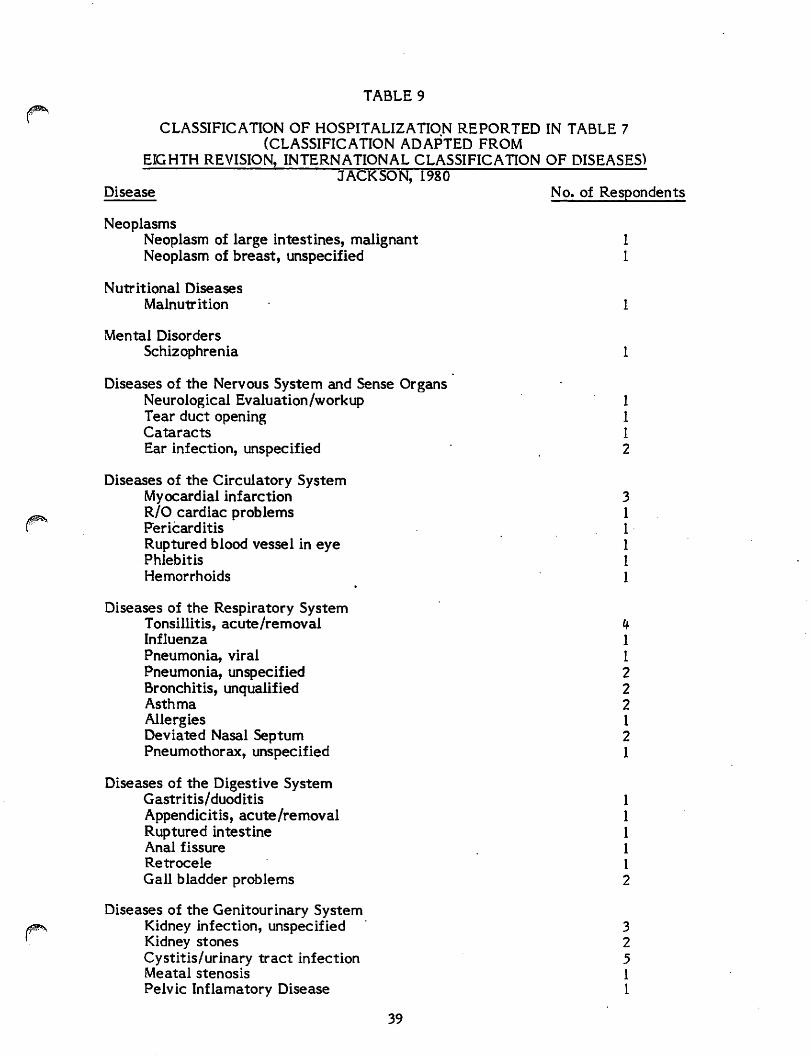
TABLE 9
CLASSIFICATION OF HOSPITALIZATION REPORTED IN TABLE 7
(CLASSIFICATION ADAPTED FROM
EIGHTH REVISION, INTERNATIONAL CLASSIFICATION OF DISEASES)
JACKSON, 1980
Disease No. of Respondents
Neoplasms
Neoplasm of large intestines, malignant 1
Neoplasm of breast, unspecified 1
Nutritional Diseases
Malnutrition 1
Mental Disorders
Schizophrenia 1
Diseases of the Nervous System and Sense Organs
Neurological Evaluation/workup 1
Tear duct opening 1
Cataracts 1
Ear infection, unspecified 2
Diseases of the Circulatory System
Myocardiai infarction 3
R/O cardiac problems 1 Pericarditis 1
Ruptured blood vessel in eye 1
Phlebitis I
Hemorrhoids 1
Diseases of the Respiratory System
Tonsillitis, acute/removal 4
Influenza 1
Pneumonia, viral 1
Pneumonia, unspecified 2
Bronchitis, unqualified 2
Asthma 2
Allergies 1
Deviated Nasal Septum 2
Pneumothorax, unspecified 1
Diseases of the Digestive System
Gastritis/duoditis 1
Appendicitis, acute/removal 1
Ruptured intestine 1
Anal fissure . 1
Retrocele I
Gall bladder problems 2
Diseases of the Genitourinary System
Kidney infection, unspecified 3
Kidney stones 2
Cystitis/urinary tract infection 5 Meatal stenosis 1
Pelvic Inflamatory Disease I
39
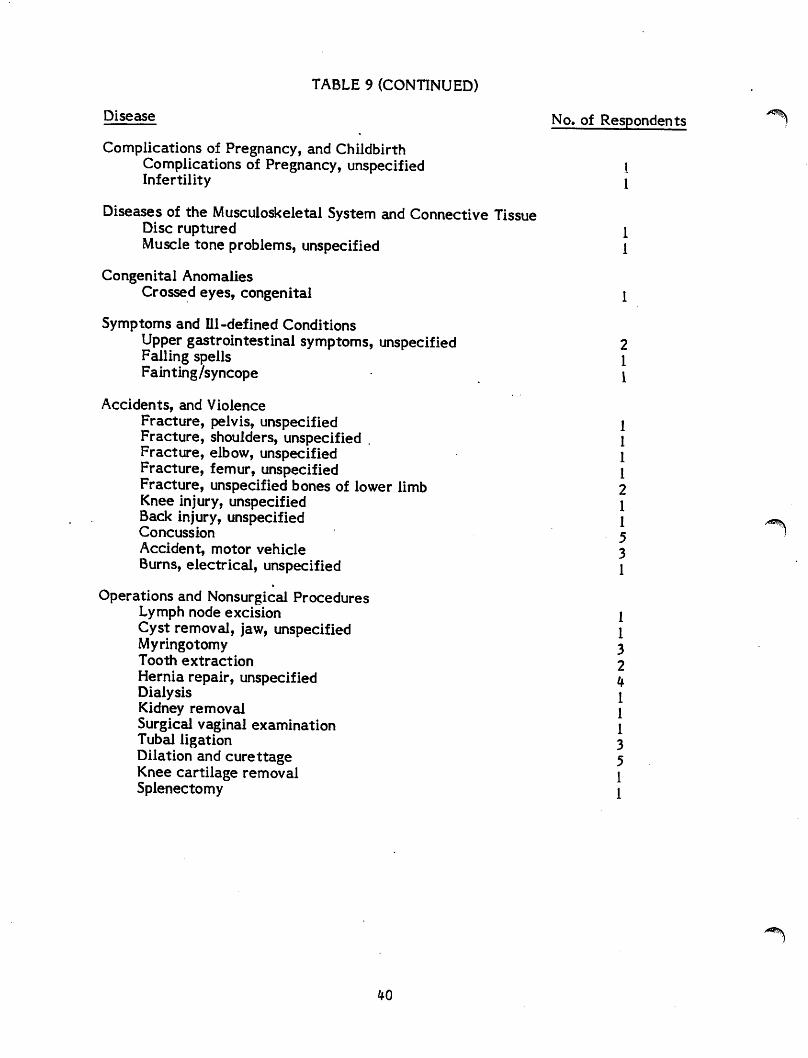
TABLE 9 (CONTINUED)
Disease No. of Respondents
Complications of Pregnancy, and Childbirth
Complications of Pregnancy, unspecified 1 Infertility 1
Diseases of the Musculoskeletal System and Connective Tissue Disc ruptured 1
Muscle tone problems, unspecified 1
Congenital Anomalies
Crossed eyes, congenital 1
Symptoms and 111-defined Conditions
Upper gastrointestinal symptoms, unspecified 2 Falling spells \
Fain ting /syncope \
Accidents, and Violence
Fracture, pelvis, unspecified \
Fracture, shoulders, unspecified . 1
Fracture, elbow, unspecified 1
Fracture, femur, unspecified 1
Fracture, unspecified bones of lower limb 2 Knee injury, unspecified 1
Back injury, unspecified 1 ^
Concussion 5 ?
Accident, motor vehicle 3
Burns, electrical, unspecified 1
Operations and Nonsurgical Procedures Lymph node excision I
Cyst removal, jaw, unspecified 1 Myringotomy 3
Tooth extraction 2
Hernia repair, unspecified 4 Dialysis I
Kidney removal 1
Surgical vaginal examination 1 Tubal ligation 3
Dilation and curettage 5
Knee cartilage removal \
Splenectomy 1
/SSv
TABLE 10
PROPORTION OF MALES AND FEMALES REPORTING SKIN AND
SYSTEMIC EFFECTS
JACKSON, 1980
Sex
41
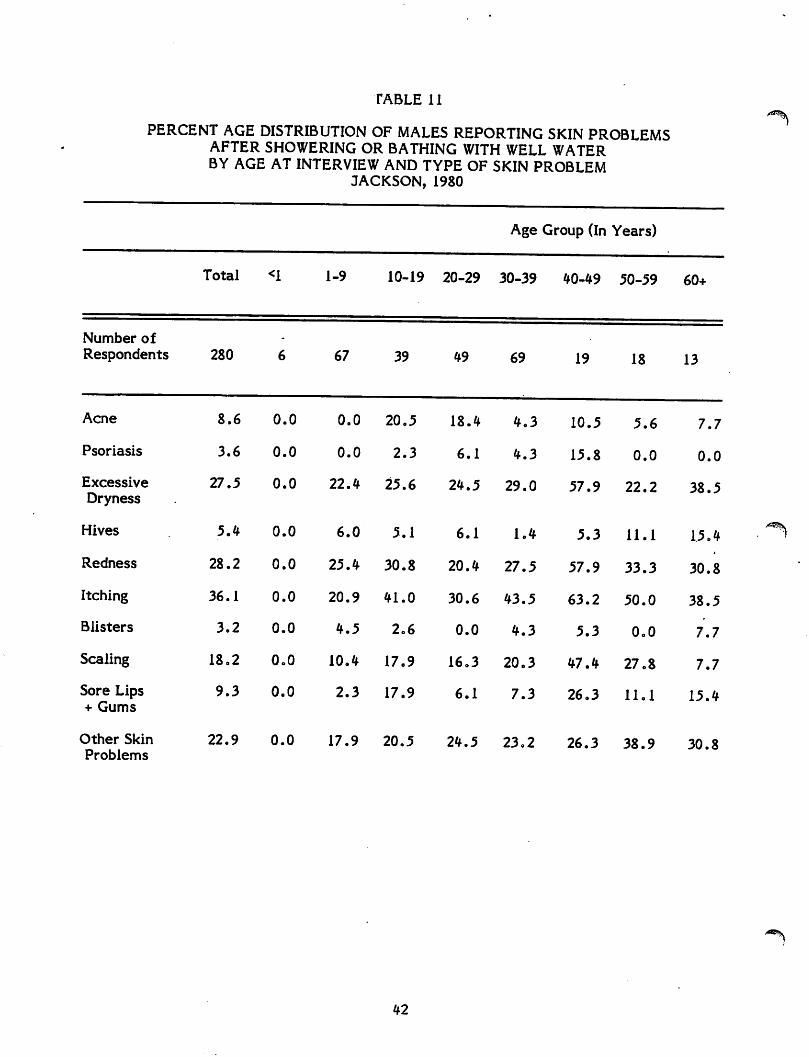
TABLE 11
PERCENT AGE DISTRIBUTION OF MALES REPORTING SKIN PROBLEMS AFTER SHOWERING OR BATHING WITH WELL WATER BY AGE AT INTERVIEW AND TYPE OF SKIN PROBLEM
JACKSON, 1980
42
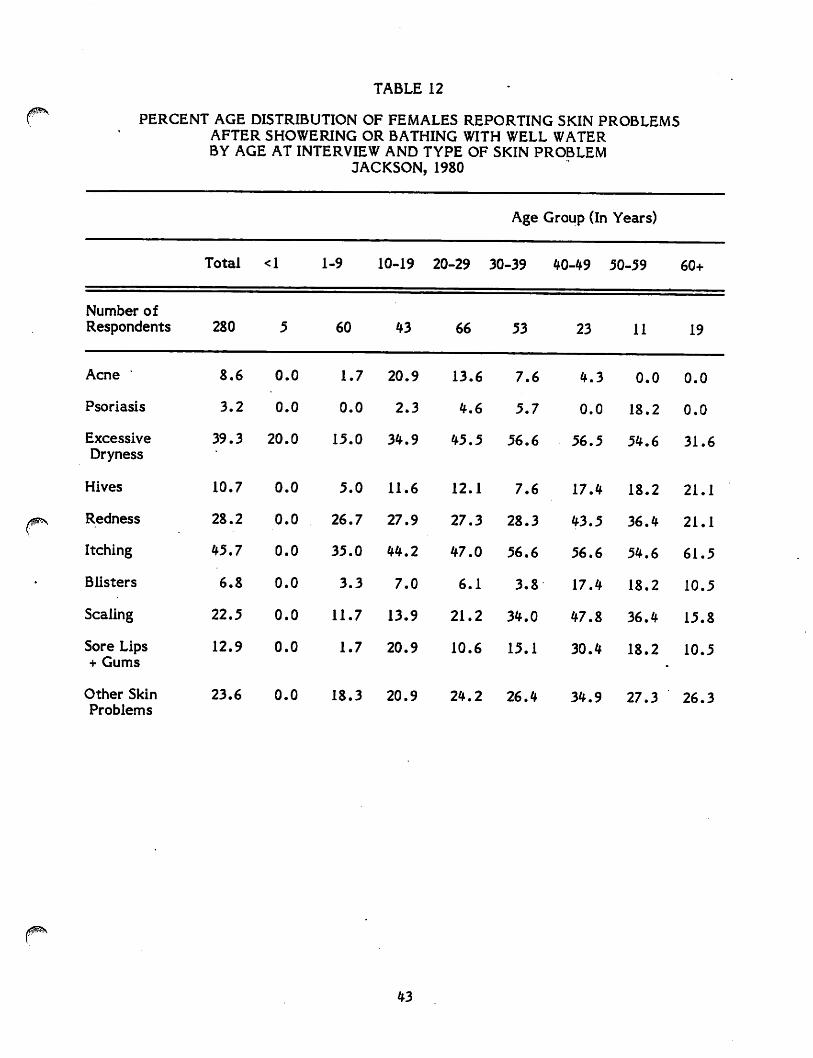
TABLE 12
PERCENT AGE DISTRIBUTION OF FEMALES REPORTING SKIN PROBLEMS
AFTER SHOWERING OR BATHING WITH WELL WATER
BY AGE AT INTERVIEW AND TYPE OF SKIN PROBLEM
JACKSON, 1980
/^S
43
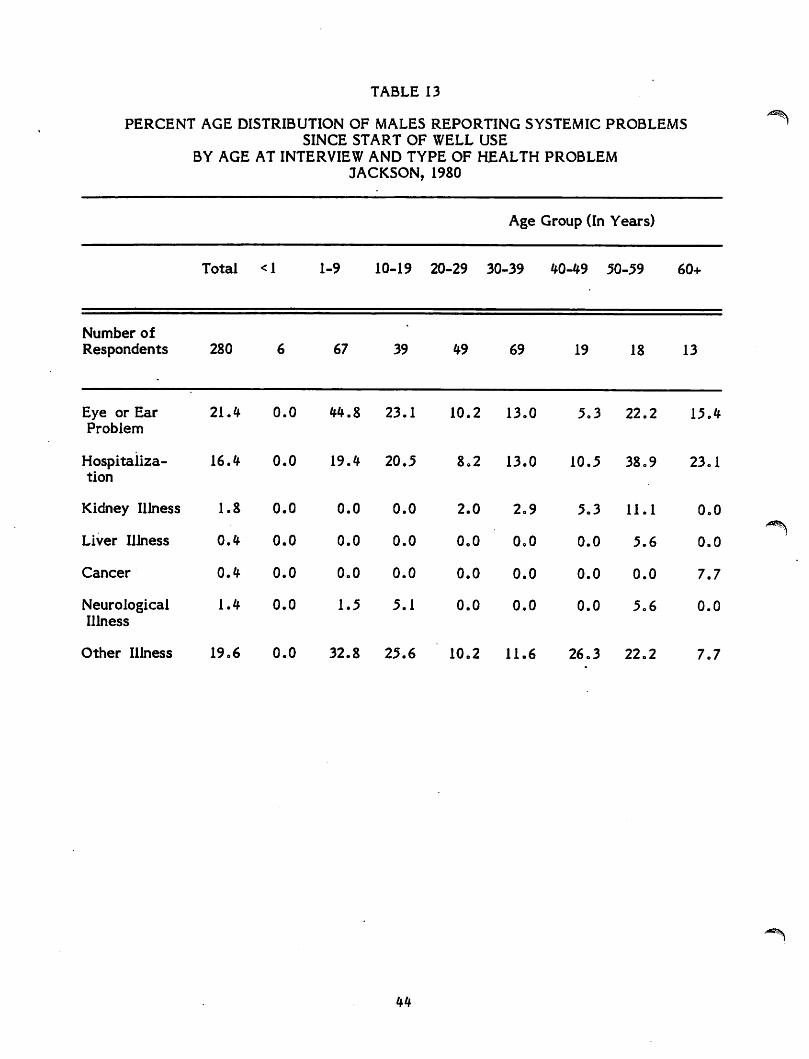
TABLE 13
PERCENT AGE DISTRIBUTION OF MALES REPORTING SYSTEMIC PROBLEMS
SINCE START OF WELL USE
BY AGE AT INTERVIEW AND TYPE OF HEALTH PROBLEM
JACKSON, 1980
Age Group (In Years)
Total <1 1-9 10-19 20-29 30-39 40-49 50-59 60+
^^\
44
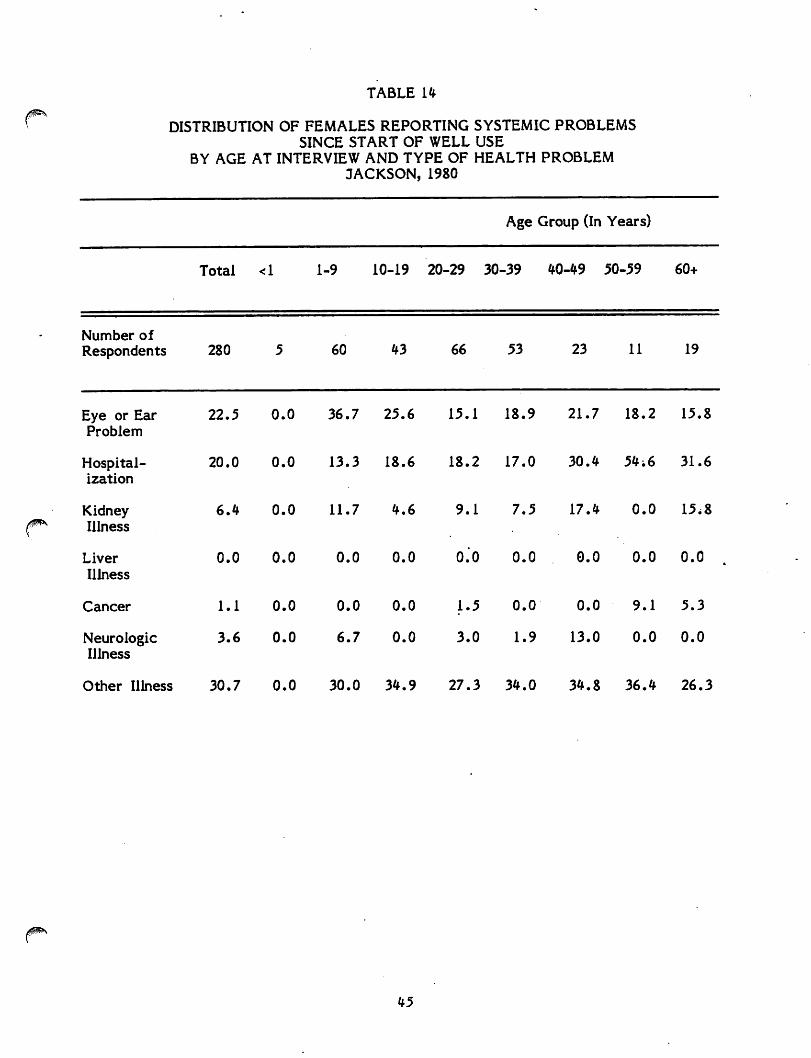
TABLE 14
DISTRIBUTION OF FEMALES REPORTING SYSTEMIC PROBLEMS
SINCE START OF WELL USE
BY AGE AT INTERVIEW AND TYPE OF HEALTH PROBLEM
JACKSON, 1980
Age Group (In Years)
Total <1 1-9 10-19 20-29 30-39 40-49 50-59 60+
Number of
Respondents 280 5 60 43 66 53 23 11 19
Eye or Ear
Problem
Hospital-
ization
Kidney
Illness
Liver
Illness
Cancer
Neurologic
Illness
22.5 0.0 36.7 25.6 15.1 18.9 21.7 18.2 15.8
20.0 0.0 13.3 18.6 18.2 17.0 30.4 54;6 31.6
6.4 0.0 11.7 4.6 9.1 7.5 17.4 0.0 15,8
0.0 0.0 0.0 0.0 0.0 0.0 0.0 0.0 0.0
1.1 0.0 0.0 0.0 1.5 0.0 0.0 9.1 5.3
3.6 0.0 6.7 0.0 3.0 1.9 13.0 0.0 0.0
Other Illness 30.7 0.0 30.0 34.9 27.3 34.0 34.8 36.4 26.3
45
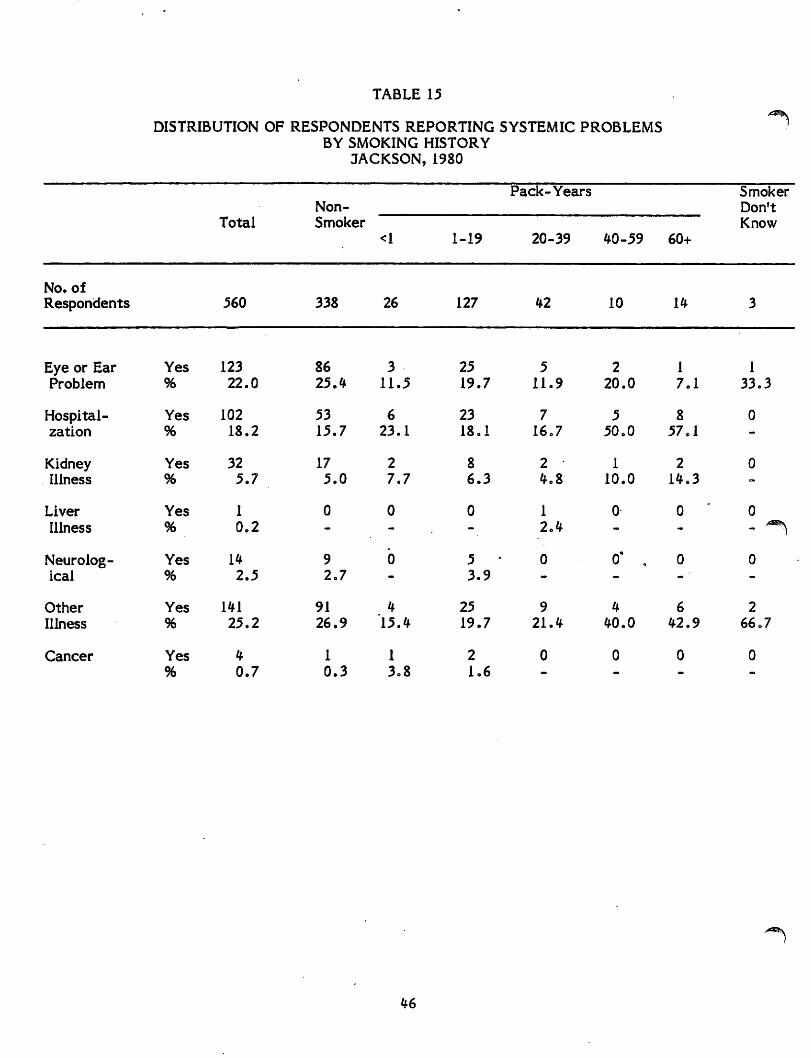
TABLE 15
DISTRIBUTION OF RESPONDENTS REPORTING SYSTEMIC PROBLEMS
BY SMOKING HISTORY
JACKSON, 1980
46
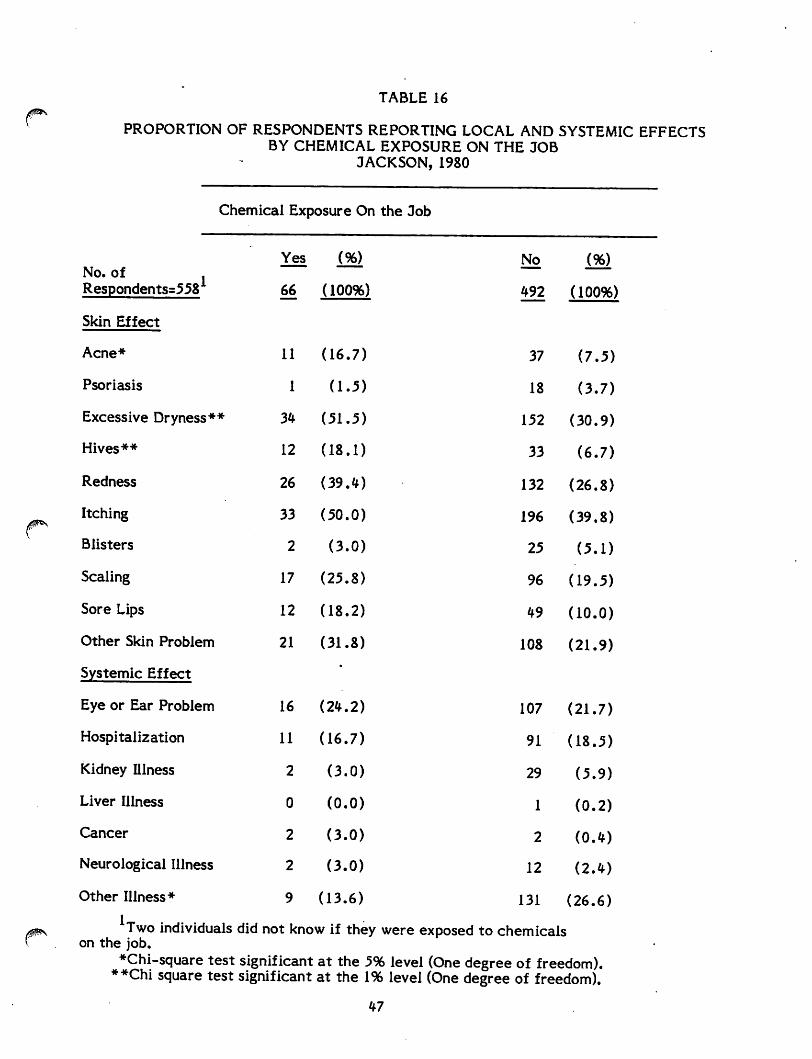
TABLE 16
PROPORTION OF RESPONDENTS REPORTING LOCAL AND SYSTEMIC EFFECTS
BY CHEMICAL EXPOSURE ON THE JOB
JACKSON, 1980
*Chi-square test significant at the 5% level (One degree of freedom). **Chi square test significant at the 1% level (One degree of freedom).
47
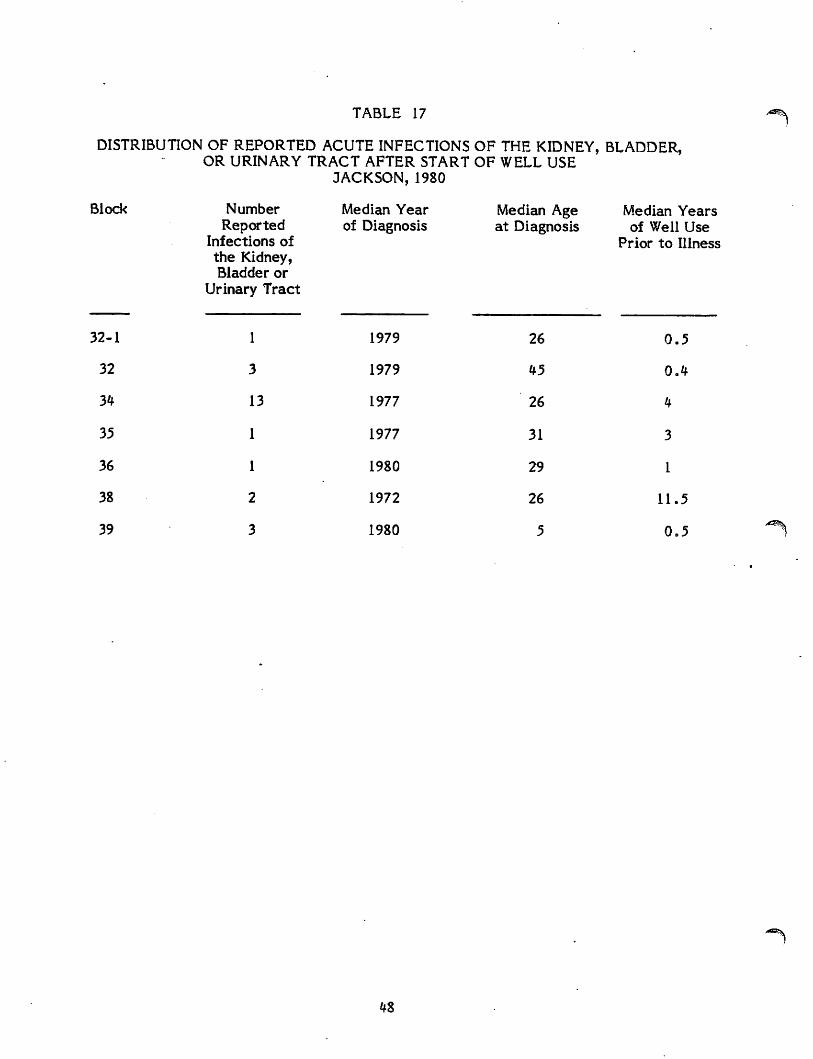
TABLE 17
DISTRIBUTION OF REPORTED ACUTE INFECTIONS OF THE KIDNEY, BLADDER,
OR URINARY TRACT AFTER START OF WELL USE
JACKSON, 1980
/^\
j*\
\
48
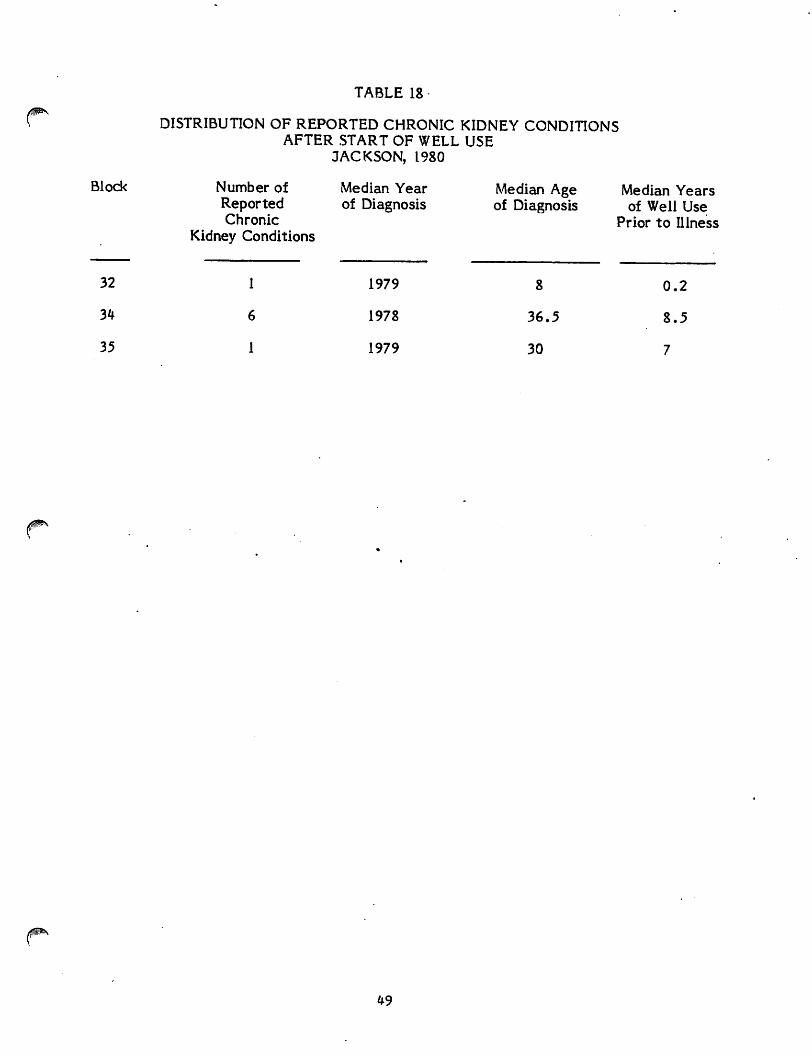
TABLE 18
DISTRIBUTION OF REPORTED CHRONIC KIDNEY CONDITIONS AFTER START OF WELL USE
3ACKSON, 1980
Block Number of
Reported
Chronic
Kidney Conditions
Median Year
of Diagnosis
Median Age
of Diagnosis
Median Years
of Well Use
Prior to Illness
32
34
35
1979
1978
1979
8
36.5
30
0.2
8.5
7
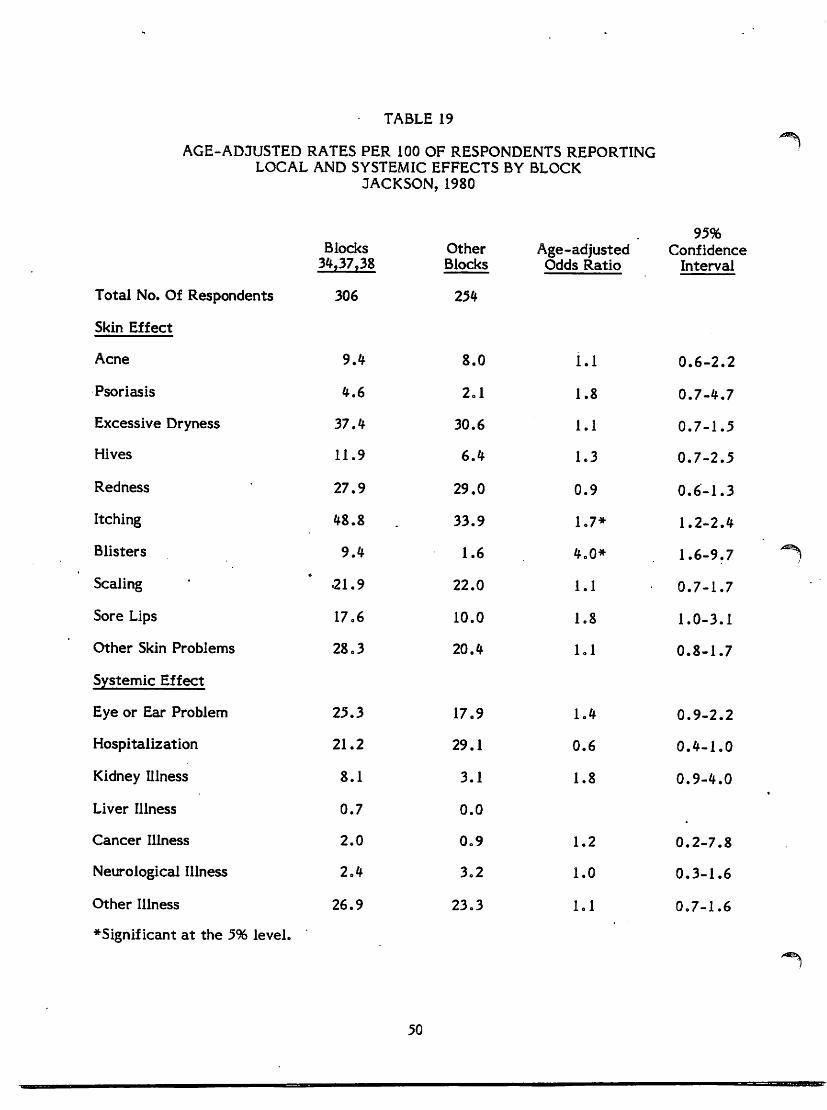
TABLE 19
AGE-AD JUSTED RATES PER 100 OF RESPONDENTS REPORTING
LOCAL AND SYSTEMIC EFFECTS BY BLOCK
JACKSON, 1980
50

TABLE 20
AGE-ADJUSTED RATES PER 100 FOR RESPONDENTS REPORTING SYSTEMIC EFFECTS
SINCE START OF WELL USE FOR DRINKING AND COOKING
BY DEPTH AND YEARS OF WELL USE
JACKSON, 1980
♦Normal deviate Z for testing trend significant at 1% level.
51
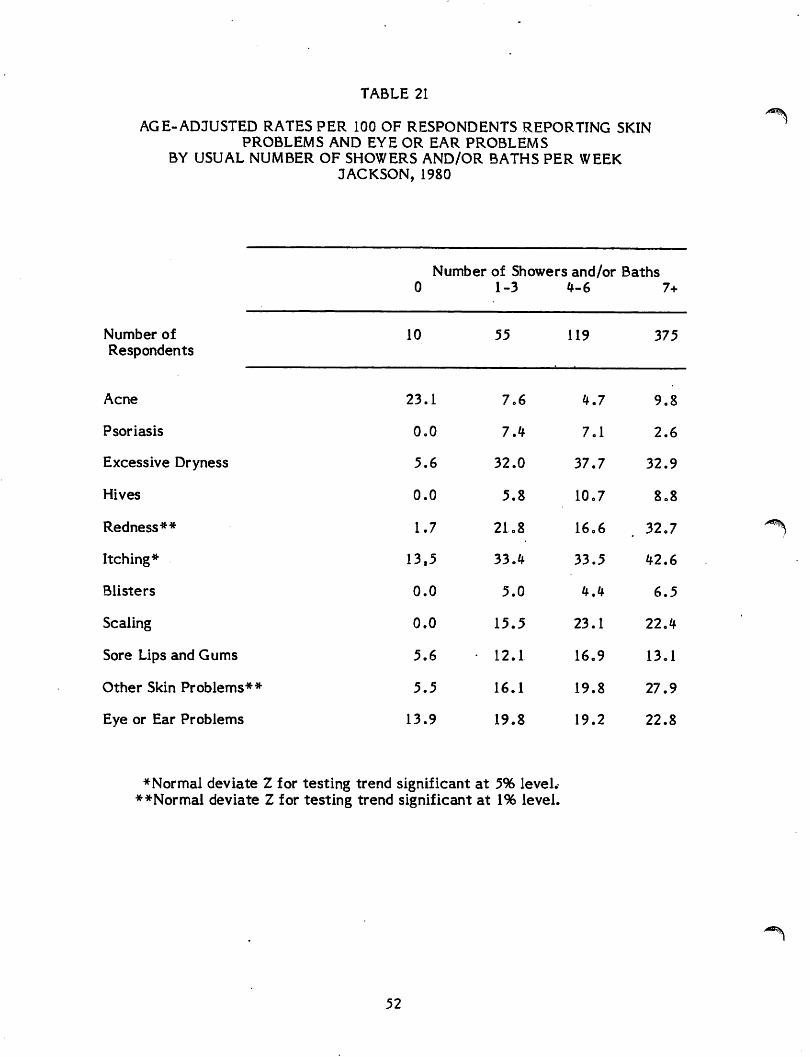
TABLE 21
AGE-ADJUSTED RATES PER 100 OF RESPONDENTS REPORTING SKIN
PROBLEMS AND EYE OR EAR PROBLEMS
BY USUAL NUMBER OF SHOWERS AND/OR BATHS PER WEEK
JACKSON, 1980
%
Number of
Respondents
Acne
Psoriasis
Excessive Dryness
Hives
Redness**
Itching*
Blisters
Scaling
Sore Lips and Gums
Other Skin Problems**
Eye or Ear Problems
Number of Showers and/or Baths
0 1-3 4-6 7+
10 55 119 375
♦Normal deviate Z for testing trend significant at 5% level.-
**Normal deviate Z for testing trend significant at 1% level.
52
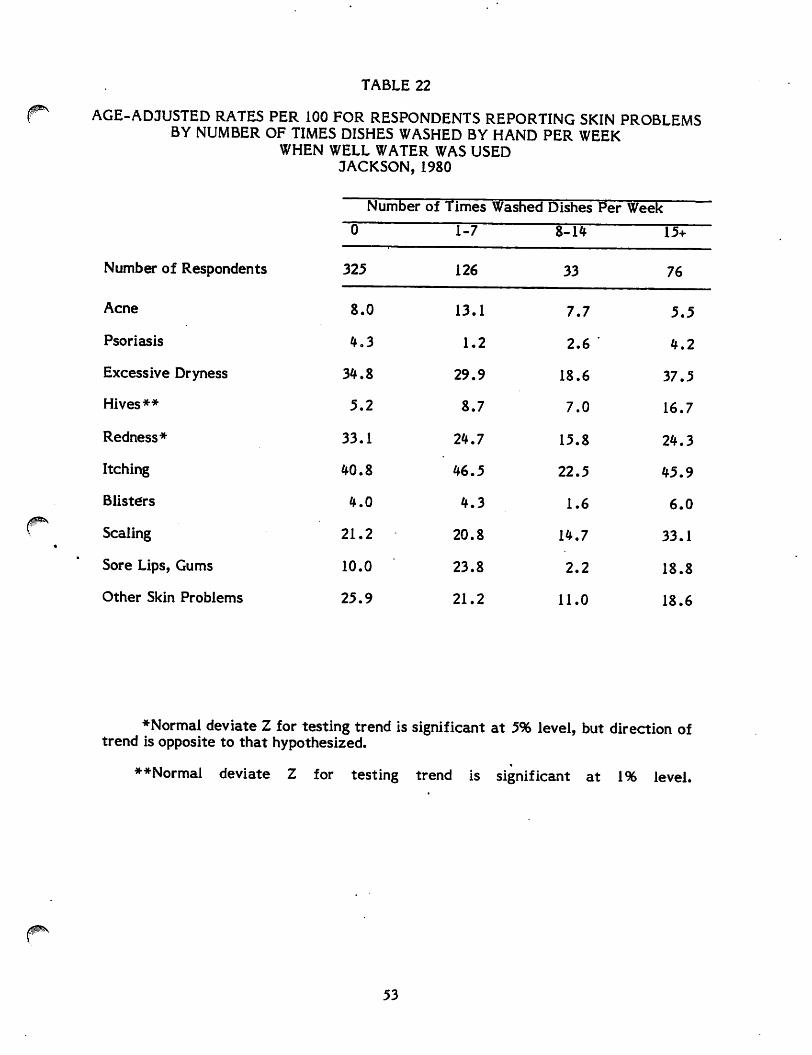
TABLE 22
AGE-ADJUSTED RATES PER 100 FOR RESPONDENTS REPORTING SKIN PROBLEMS BY NUMBER OF TIMES DISHES WASHED BY HAND PER WEEK
WHEN WELL WATER WAS USED
JACKSON, 1980
♦Normal deviate Z for testing trend is significant at 5% level, but direction of trend is opposite to that hypothesized.
**Normal deviate Z for testing trend is significant at 1% level.
53
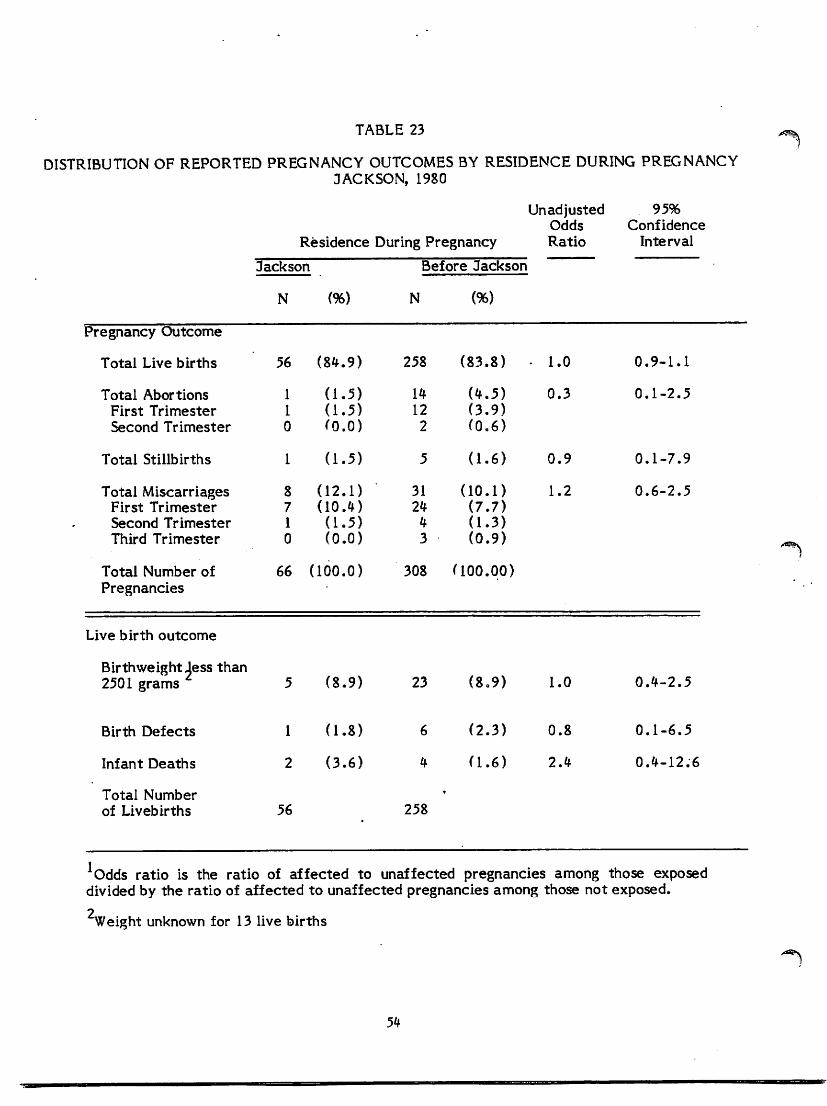
TABLE 23
DISTRIBUTION OF REPORTED PREGNANCY OUTCOMES BY RESIDENCE DURING PREGNANCY
JACKSON, 1980
%i
Residence During Pregnancy
Unadjusted 95%
Odds Confidence
Ratio Interval
Odds ratio is the ratio of affected to unaffected pregnancies among those exposed
divided by the ratio of affected to unaffected pregnancies among those not exposed.
2
Weight unknown for 13 live births
\
54
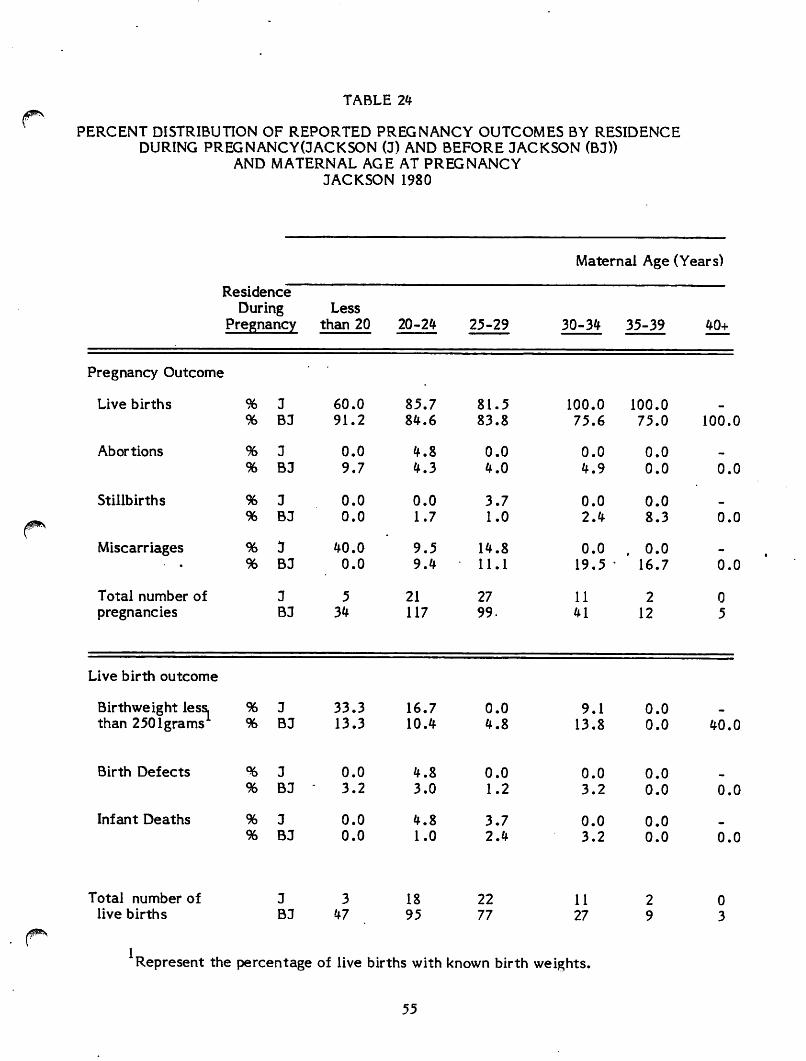
TABLE 24
PERCENT DISTRIBUTION OF REPORTED PREGNANCY OUTCOMES BY RESIDENCE
DURING PREGNANCY(JACKSON (J) AND BEFORE JACKSON (BJ))
AND MATERNAL AGE AT PREGNANCY
JACKSON 1980
V
Represent the percentage of live births with known birth weights.
55
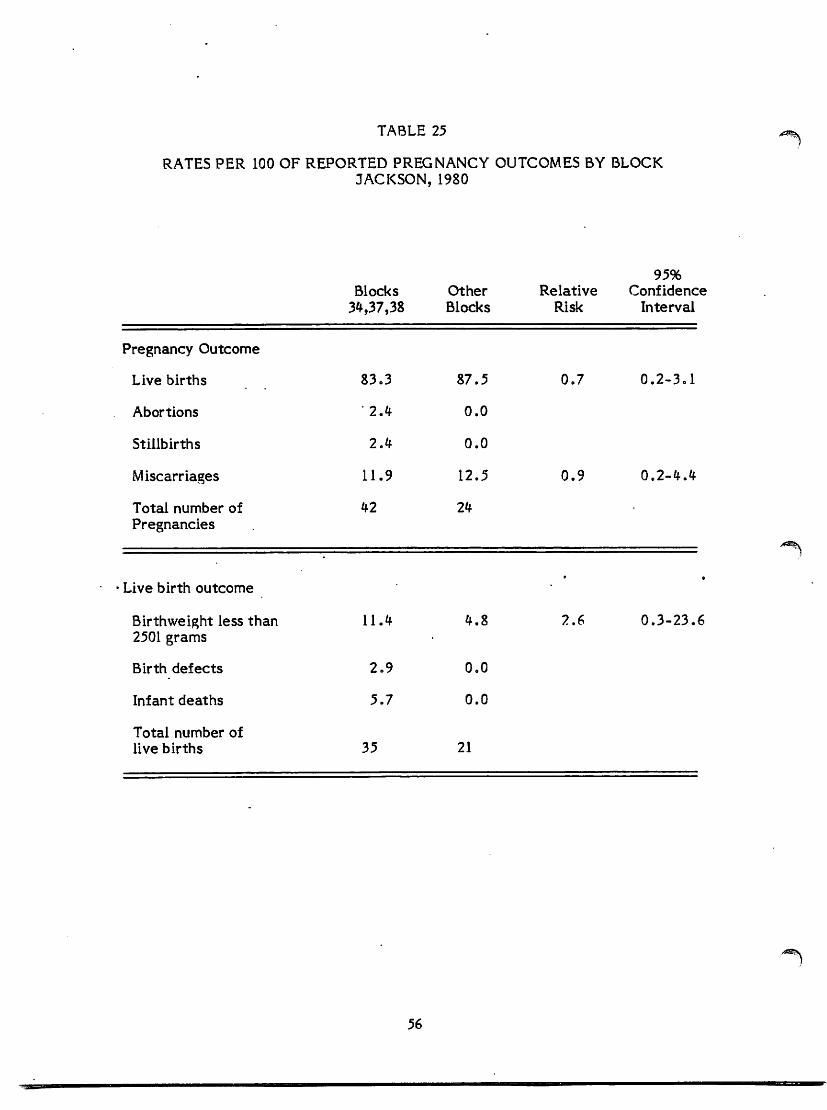
TABLE 25
RATES PER 100 OF REPORTED PREGNANCY OUTCOMES BY BLOCK
JACKSON, 1980
Live birth outcome
Birthweight less than
2501 grams
Birth defects
Infant deaths
Total number of
live births
11.4
2.9
5.7
35
4.8
0.0
0.0
21
2.6 0.3-23.6
56
No normal deviate Zs for testing trend were significant.
57
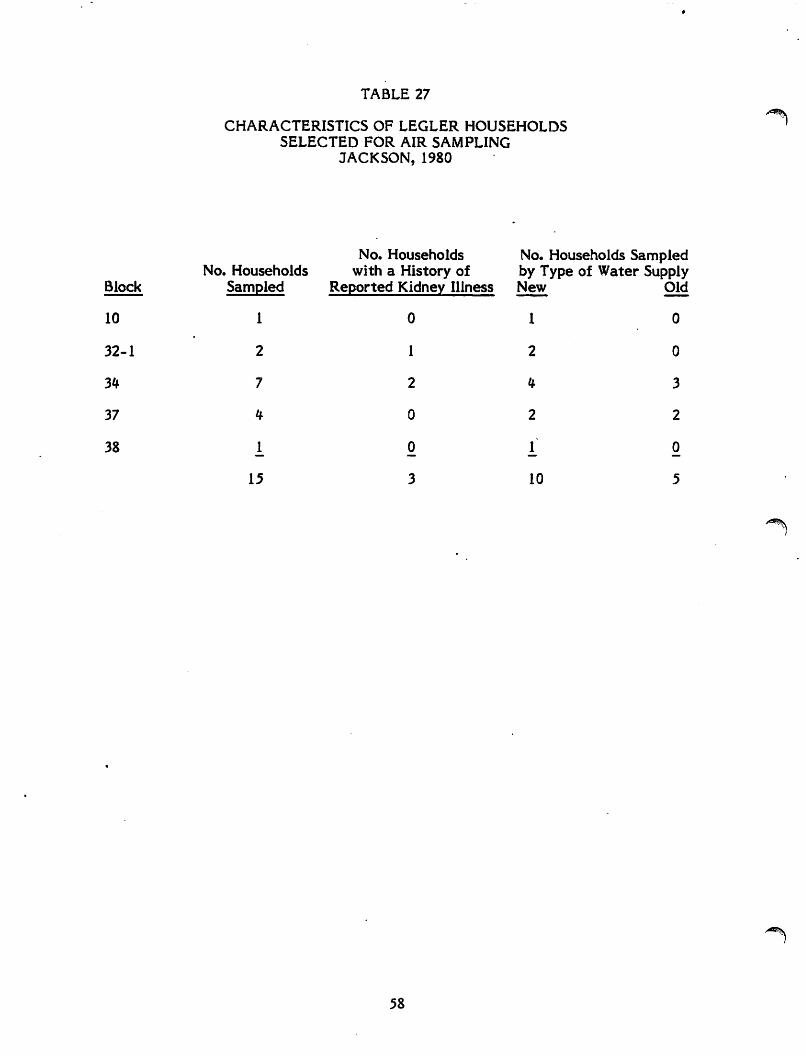
TABLE 27
CHARACTERISTICS OF LEGLER HOUSEHOLDS ' SELECTED FOR AIR SAMPLING
JACKSON, 1980
%
58
TABL
SPECIFIC OCCURRENCE AND CONCENTRATIONS (PARTS PER BILLION)
OF ORGANIC COMPOUNDS IN SELECTED LEGLER AND NON-LEGLER BASEMENTS
JACKSON, 1980
26
LEGLER
10
11
12* 13* 14* 15*
154
3
28
20
41
76
17
80
20
20
20
90
20
30
70
80
10
20
50
*No organic compounds were detected at the limit of detection for total oreanics (lOppb).
NOTE: Concentrations that are reported as "less than" a value indicate the limit of detecti
NON-LEGLER
4*
5* 6* 7*
8
9
10
20 <10
20
12
20
etection for that specific organic compound.
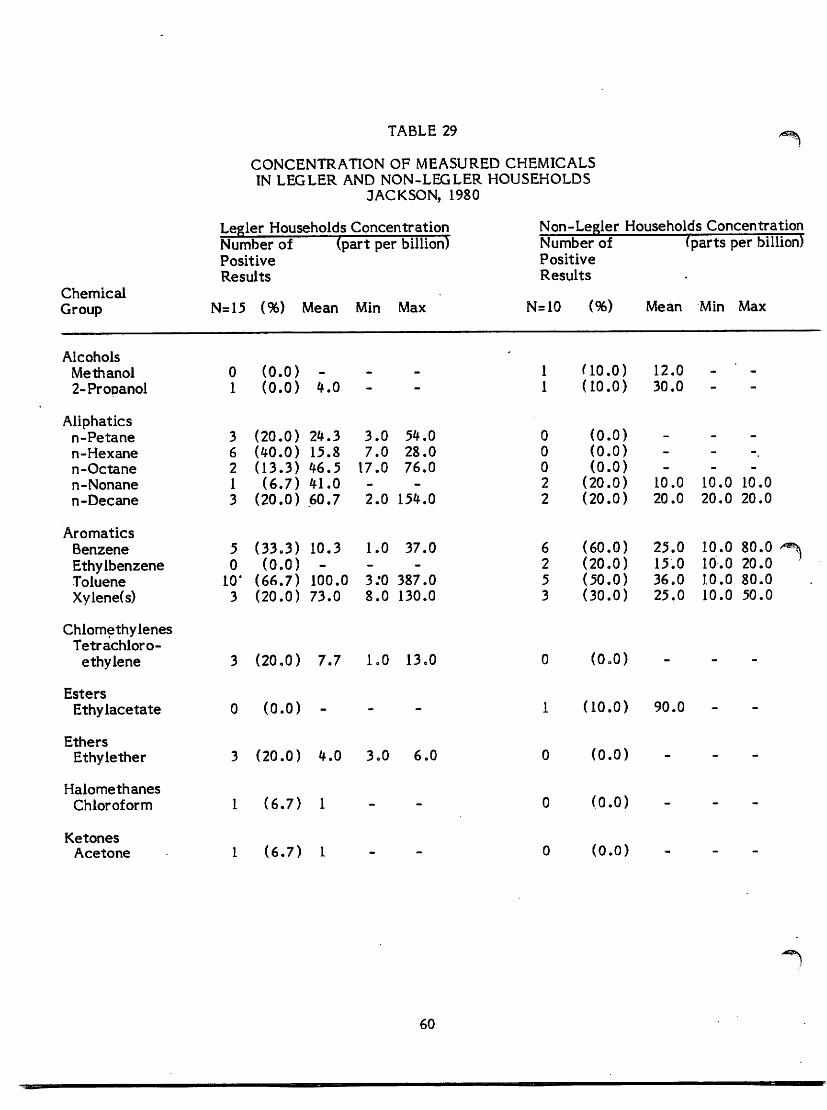
TABLE 29
CONCENTRATION OF MEASURED CHEMICALS
IN LEGLER AND NON-LEGLER HOUSEHOLDS
JACKSON, 1980
%k
60
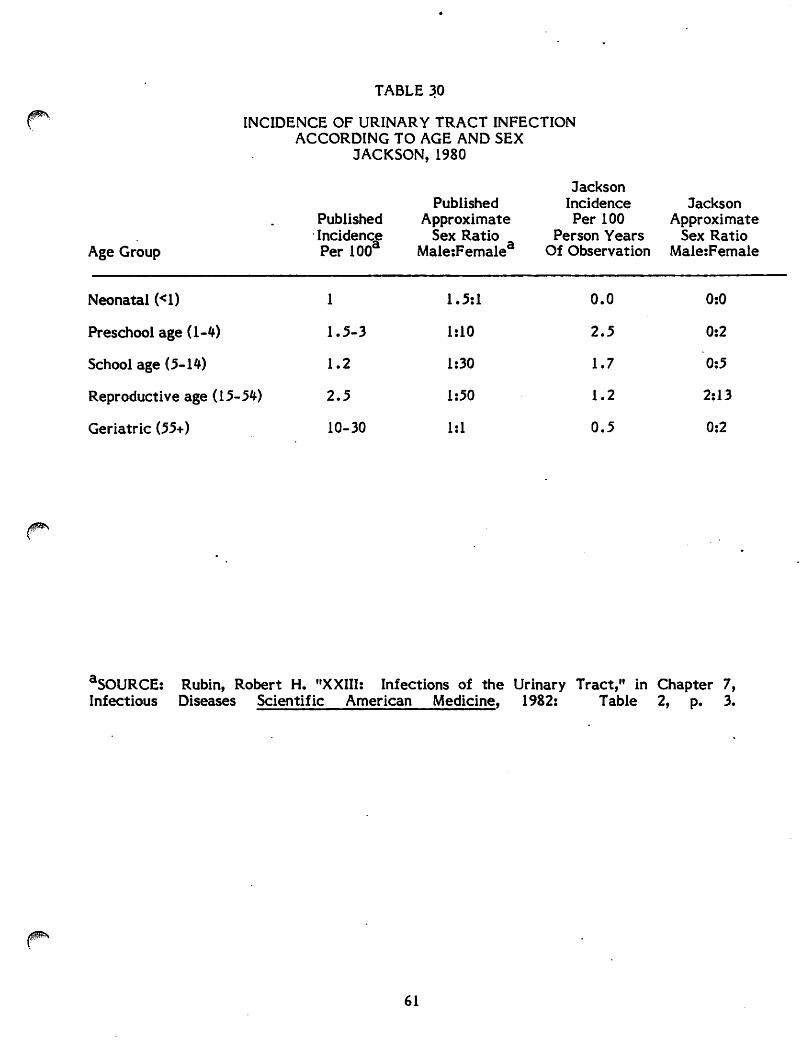
TABLE 30
INCIDENCE OF URINARY TRACT INFECTION
ACCORDING TO AGE AND SEX
JACKSON, 1980
aSOURCE: Rubin, Robert H. "XXIII: Infections of the Urinary Tract," in Chapter 7, Infectious Diseases Scientific American Medicine, 1982: Table 2, p. 3.
61
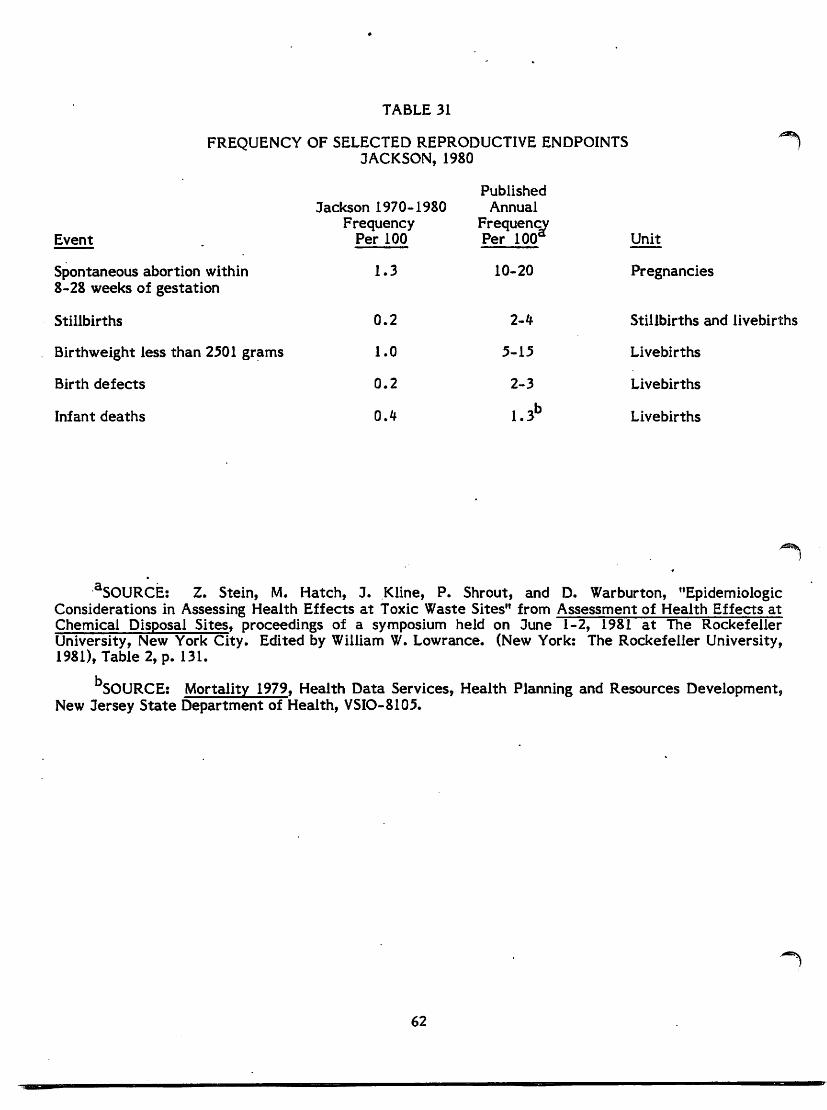
TABLE 31
FREQUENCY OF SELECTED REPRODUCTIVE ENDPOINTS
JACKSON, 1980
aSOURCE: Z. Stein, M. Hatch, J. Kline, P. Shrout, and D. Warburton, "Epidemiologic Considerations in Assessing Health Effects at Toxic Waste Sites" from Assessment of Health Effects at
Chemical Disposal Sites, proceedings of a symposium held on June 1-2, 1981 at The Rockefeller
University, New York City. Edited by William W. Lowrance. (New York: The Rockefeller University,
1981), Table 2, p. 131.
SOURCE: Mortality 1979, Health Data Services, Health Planning and Resources Development,
New Jersey State Department of Health, VSIO-8105.
62
APPENDIX 1
INSTRUCTIONS TO INTERVIEWERS
63
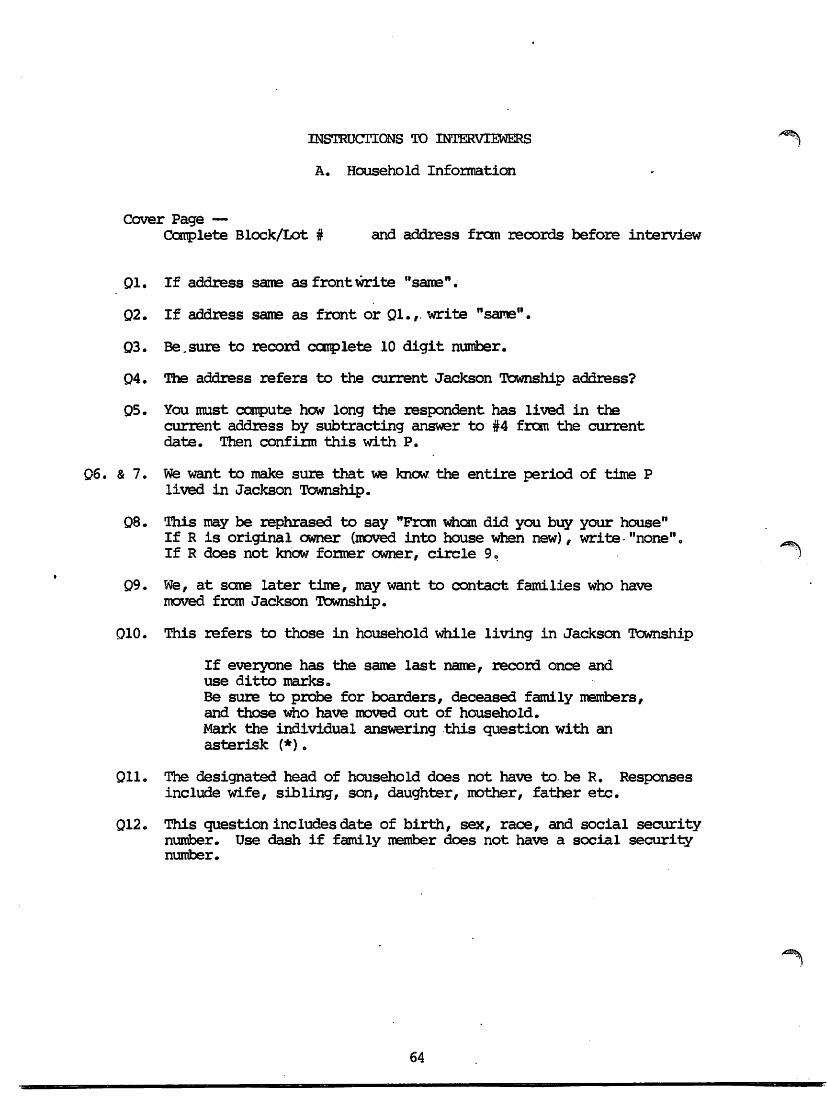
INSTRUCTIONS TO INTERVIEWERS ^
A. Household Information
Cover Page ~
Complete Block/Lot # and address from records before interview
01. If address same as front write "same".
02. If address sane as front or Ql., write "sane".
03. Be.sure to record complete 10 digit number.
04. The address refers to the current Jackson Township address?
05. You must compute how long the respondent has lived in the
current address by subtracting answer to #4 from the current
date. Then confirm this with P.
06. & 7. We want to make sure that we know the entire period of time P
lived in Jackson Township.
08. This may be rephrased to say "From whom did you buy your house"
If R is original owner (moved into house when new), write-"none". ^^
If R does not know former owner, circle 9. 1
09. We, at sate later time, may want to contact families who have
moved from Jackson Township.
010. This refers to those in household while living in Jackson Township
If everyone has the same last name, record once and
use ditto marks.
Be sure to probe for boarders, deceased family members,
and those who have moved out of household.
Mark the individual answering this question with an
asterisk (*).
011. The designated head of household does not have to be R. Responses
include wife, sibling, son, daughter, mother, father etc.
Q12. This question includes date of birth, sex, race, and social security
number. Use dash if family member does not have a social security
number.
64
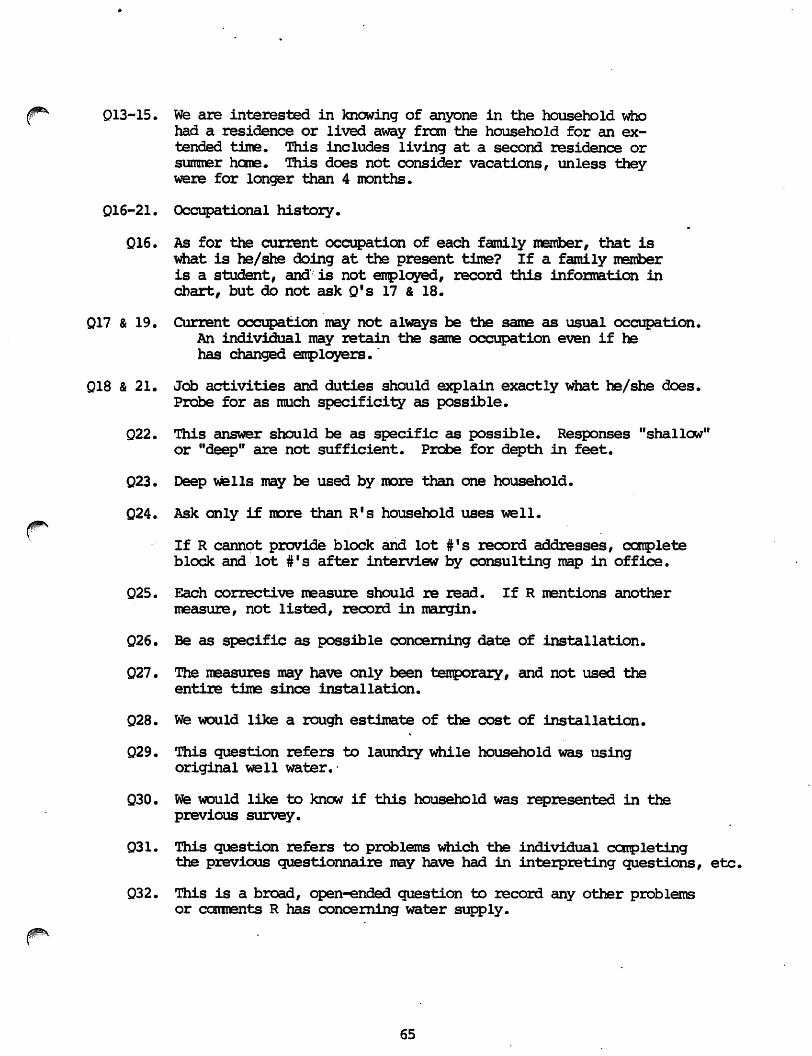
013-15. We are interested in knowing of anyone in the household who
had a residence or lived away from the household for an ex
tended time. This includes living at a second residence or
summer home. This does not consider vacations, unless they
were for longer than 4 months.
016-21. Occupational history.
016. As for the current occupation of each family member, that is
what is he/she doing at the present time? If a family member
is a student, and is not employed, record this information in
chart, but do not ask 0's 17 & 18.
017 & 19. Current occupation may not always be the same as usual occupation.
An individual may retain the same occupation even if he
has changed employers.
018 & 21. Job activities and duties should explain exactly what he/she does.
Probe for as much specificity as possible.
022. This answer should be as specific as possible. Responses "shallow"
or "deep" are not sufficient. Probe for depth in feet.
023. Deep wells may be used by more than one household.
024. Ask only if more than R's household uses well.
If R cannot provide block and lot #'s record addresses, complete
block and lot #'s after interview by consulting map in office.
025. Each corrective measure should re read. If R mentions another
measure, not listed, record in margin.
026. Be as specific as possible concerning date of installation.
027. The measures may have only been temporary, and not used the
entire time since installation.
028. We would like a rough estimate of the cost of installation.
029. This question refers to laundry while household was using
original well water.
030. We would like to know if this household was represented in the
previous survey.
031. This question refers to problems which the individual completing
the previous questionnaire may have had in interpreting questions, etc,
032. This is a broad, open-ended question to record any other problems
or comments R has concerning water supply.
65
B. INDIVIDUAL HEALTH HISTORY
We must have a general consent form signed for each respondent. A
parent or guardian must sign for minors or those otherwise unable to sign.
01. Include full name of respondent. The respondent code is the 2-digit
number of the individual as listed in Section A, 010.
Be sure Section B is completed for all household members listed in
Section A. 010. including deceased and those who are no longer
living there.
02. We are interested in frequent contact, not just using a chemical once
a year. Do not include ordinary household cleaning products, unless
something unusual was used.
This question does also refer to chemical exposure oil the job.
03-6. If R did not smoke cigarettes, 04-6 remain blank.
We are not interested in cigar or pipe smoking.
04. R may tell you his/her age when he/she started smoking. Record this
in the margin, calculate the year, and confirm it with R.
05. If R started and stopped smoking, try to get him/her to estimate the
total number of years smoked.
06. This answer calls for cigarettes per day. Convert packs to # of
cigarettes, i.e., one pack = 20 cigarettes.
07-11. Hospitalizations•
08. Ask R to be as specific as possible concerning diagnosis.
09. If R in New Jersey hospital, record name and city. If out-of-state
hospital, record name, city and state.
012-16. The medical conditions listed are very general. Be sure and probe
for specific diagnosis.
Space is left to record information on 2 conditions per block.
For exanple, if R had 2 kidney diseases, list both and then asks
013-16. for each. Then go on to liver disease, etc.
017-20. We are interested in any medical condition serious enough to
consult a physician at least 3 times. Do not include medical
problems already discussed in 012-16.
66
Q.21-30 These questions all concern conditions or problems during the time
the original well water source was in use. Be sure and emphasize
the appropriate time period. -
Q.21 This should be an average number of times R took a shower in a week.
If R never takes a shower, record 0. If less than once a week,
record in right margin number of times per month.
Q.22 This question refers to the average number of times per week R took
a bath. If less than once a week, record in right margin number of
times per month.
Q.23 This is an average number of times the individual was exposed to
water by washing dishes, by hand. Don't count if R used rubber
gloves, or if a dishwasher was used.
Q.24 This question considers all bathing or showering with water other
than the original Jackson Township well. If showering at someone
else's home involved same water supply, don't consider.
Do" consider using bottled or other water sources in R's own home, or
showering or bathing at someone elseTs home with another water supply.
Q.25 The list of skin problems should be read. Emphasize that this means
problems which occur during or after bathing.or showering with original
well water.
Q.26 R should choose an answer of usually, often or sometimes. If R is
more specific, ask him/her to choose an answer.
Q.27 Read the complete list of responses for time of occurrence after
each problem which occurred.
Q.28 Record specific season, i.e., Winter, Spring, Summer, or Winter, or
record "Year round".
Q.29 This means that when an alternate water source was used, did the
problem improve.
Q.30 Probe to see whether there are any other skin problems which R feels
are due to showering or bathing with well water.
Q. 31-34 This includes only conditions for which R consulted a physician.
Probe for specific diagnosis
Q.35 This refers to health problems occurring while living in Jackson
Township which R feels are serious.
COMPLETE MEDICAL CONSENT FORM
We may want to obtain medical records on some of the health problems
listed. This consent form is different from the general consent form
which is consent to take part in the study.
67
C. REPRODUCTIVE HISTORY
This section is to be completed for any female household member
who has ever been pregnant. This includes pregnancies which ended in
a birth, a miscarriage, or an abortion. We are interested in all preg
nancies whether they occurred before or after R's move into Jackson Township.
01. Record R's full name, first and last.
Obtain R's code # from Section A, 010. and enter in area indicated
R .
02. Again, this refers to all pregnancies including births, miscarriages,
or abortions.
03. Record code letter of outcomes
live birth - LB
miscarriage - N
stillbirth - SB
abortion - A
currently pregnant - P
04. Refers to date of outcome. ^ 1
05. We are interested in whether R lived in Jackson Township ay any time
during pregnancy. If R lived there during the entire time, circle yes.
If R lived there only part of the time, either because she moved in
during the pregnancy or because she spent part of her time while preg
nant at another address.
06. Record duration of pregnancy in weeks.
full term = 36 weeks.
07c Refers only to still births or live births. Record whether the birth
was single, twins, triplets, or more.
08« Birth weight is to be recorded for live births in pounds or ounce se
Probe to be sure we have all pregnancies including children by another
husband or children who are no longer living with R.
09. We need information on any child who may have died since birth.
010. Record # of birth from pregnancy history chart and complete question
questions 11 and 12.
011. Record date of death.
012. Record cause of death. Probe for specific cause. ^*%
013-17. Refers to children with birth defects.
63
014. Record # of birth from pregnancy history chart and complete questions
15 & 17.
015. Probe for specific raedical diagnosis of birth defect.
018. Amniocentesis refers to a surgical procedure to obtain a sample
of amniotic fluid.
019. If procedure performed during more than one pregnancy, record
all dates.
020-21. Probe for R to be as specific as possible.
022-23. If more than 1 physician or hospital involved, record all.
026. Read list and ask R to choose mose appropriate answer.
COMPLETE MEDICAL CONSENT FORM
If no medical consent form was completed earlier, complete one at
this time if there were medical problems involved with birth, any
birth defects reported, or amniocentesis performed.
69
APPENDIX 2
COMMUNITY SURVEY QUESTIONNAIRE:
JACKSON TOWNSHIP 1980
70
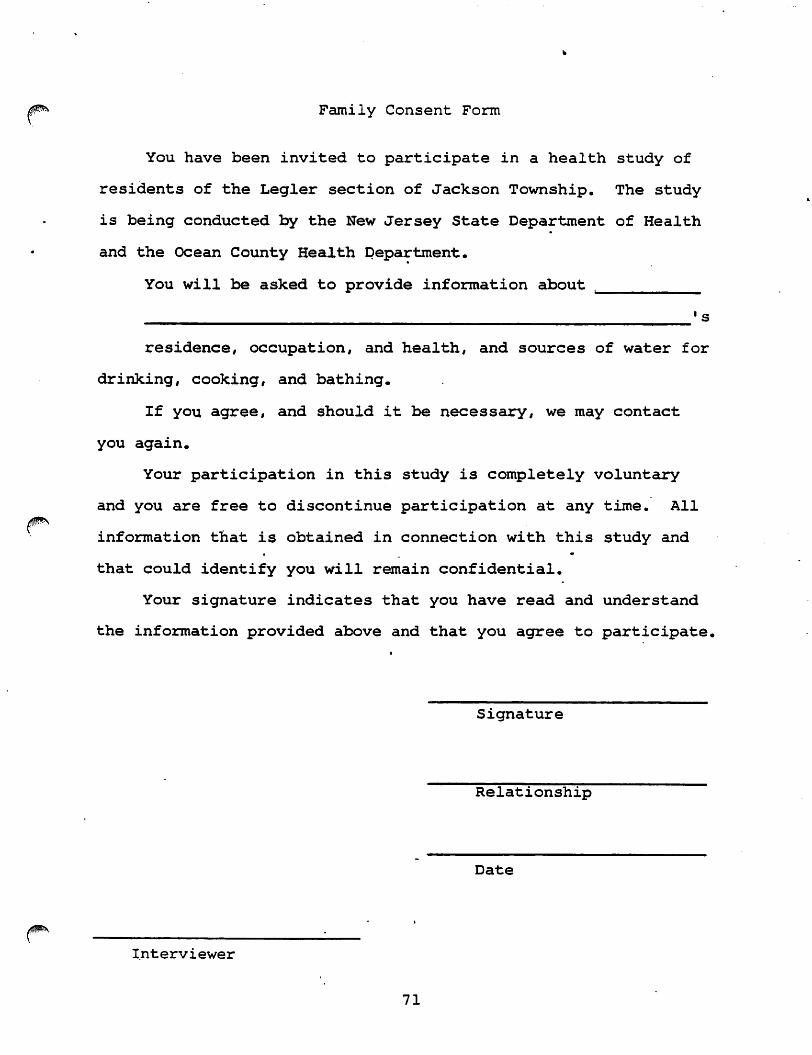
Family Consent Form
You have been invited to participate in a health study of
residents of the Legler section of Jackson Township. The study
is being conducted by the New Jersey State Department of Health
and the Ocean County Health Department.
You will be asked to provide information about s
's
residence, occupation, and health, and sources of water for
drinking, cooking, and bathing.
If you agree, and should it be necessary, we may contact
you again.
Your participation in this study is completely voluntary
and you are free to discontinue participation at any time. All
information that is obtained in connection with this study and
that could identify you will remain confidential.
Your signature indicates that you have read and understand
the information provided above and that you agree to participate.
Signature
Relationship
Date
Interviewer
71
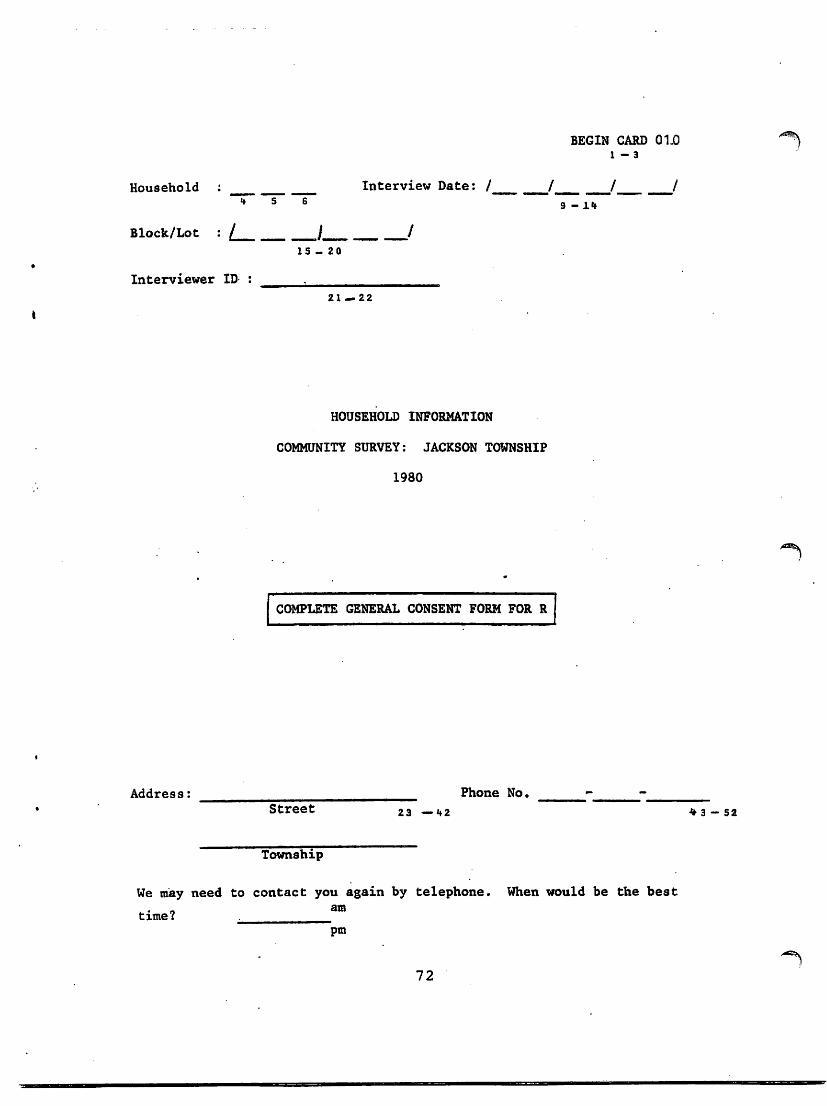
Household ; Interview Date: /
5 6
BEGIN CARD 01.0
l - 3
./ / / 9 - ih
Block/Lot : [ / / 15 - 20
Interviewer ID :
21 — 22
HOUSEHOLD INFORMATION
COMMUNITY SURVEY: JACKSON TOWNSHIP
1980
COMPLETE GENERAL CONSENT FORM FOR R
Address: Phone No.
Street —52
Township
We may need to contact you again by telephone. When would be the best
time? .
pm
72
\
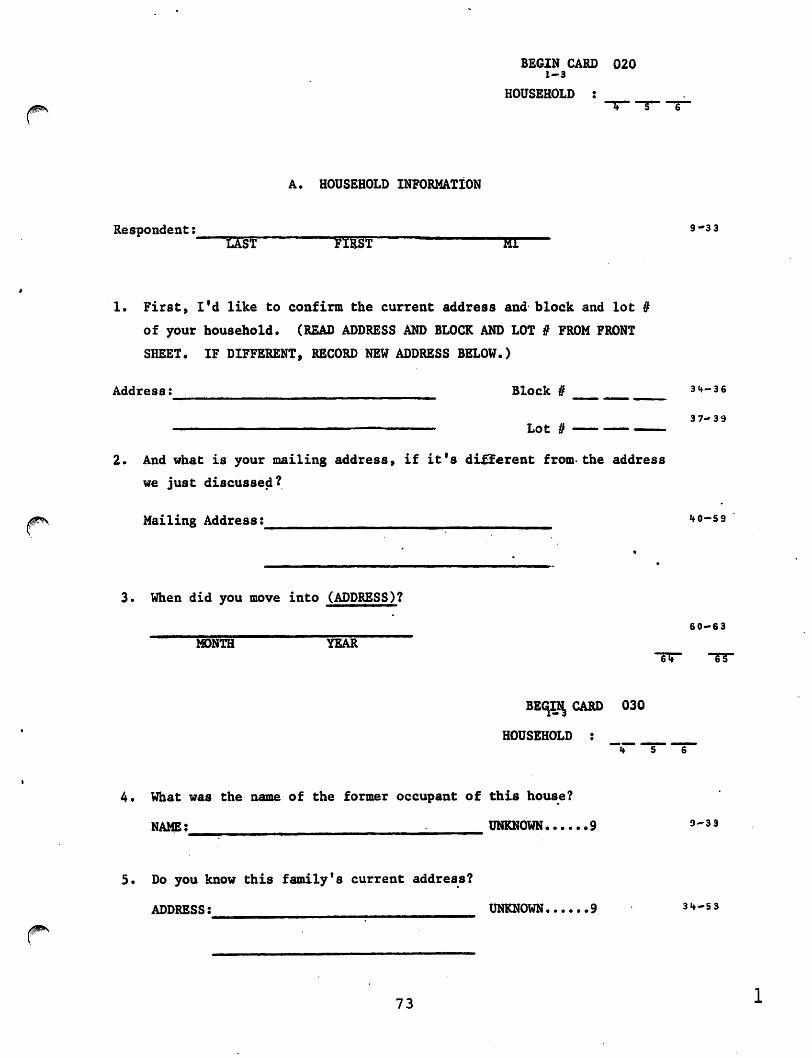
BEGIN CARD 020 1-3
HOUSEHOLD :
A. HOUSEHOLD INFORMATION
Respondent: 9 -3 3
LAST FIRST 111
1. First, I'd like to confirm the current address and block and lot #
of your household. (READ ADDRESS AND BLOCK AND LOT // FROM FRONT
SHEET. IF DIFFERENT, RECORD NEW ADDRESS BELOW.)
Address: Blocks? 3t*-*G
3 7-39
Lot #
2. And what is your mailing address, if it's different from-the address
we just discussed?
Mailing Address: to-59
3. When did you move into (ADDRESS)?
60-63
MONTH YEAR" T5" "T5"
BEqiNj CARD 030
HOUSEHOLD :
<f S 6
4. What was the name of the former occupant of this house?
NAME: UNKNOWN 9 9~33
5. Do you know this family's current address?
ADDRESS: UNKNOWN 9 3«*-5 3
73
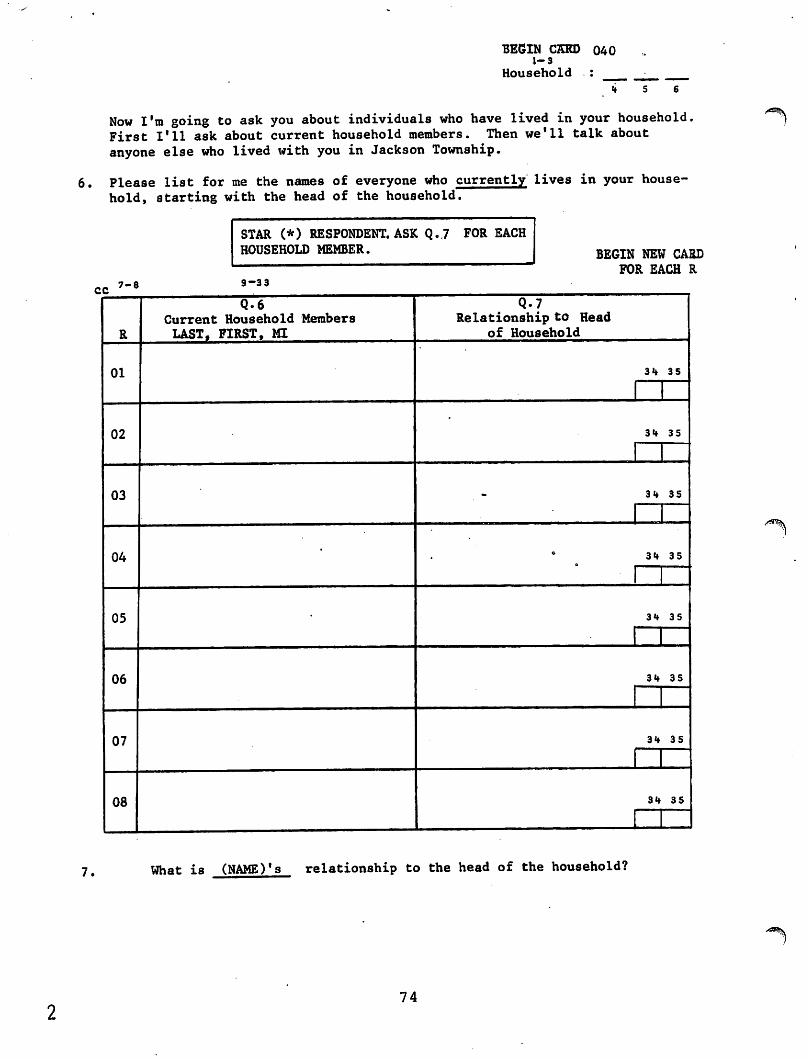
BEGIN CKED 040 1-3
Household :
Now I'm going to ask you about individuals who have lived in your household,
First I'll ask about current household members. Then we'll talk about
anyone else who lived with you in Jackson Township.
6. Please list for me the names of everyone who currently lives in your house
hold, starting with the head of the household.
STAR (*) RESPONDENT. ASK Q.7 FOR EACH
HOUSEHOLD MEMBER. BEGIN NEW CARD
FOR EACH R
7. What is (NAME)'s relationship to the head of the household?
74
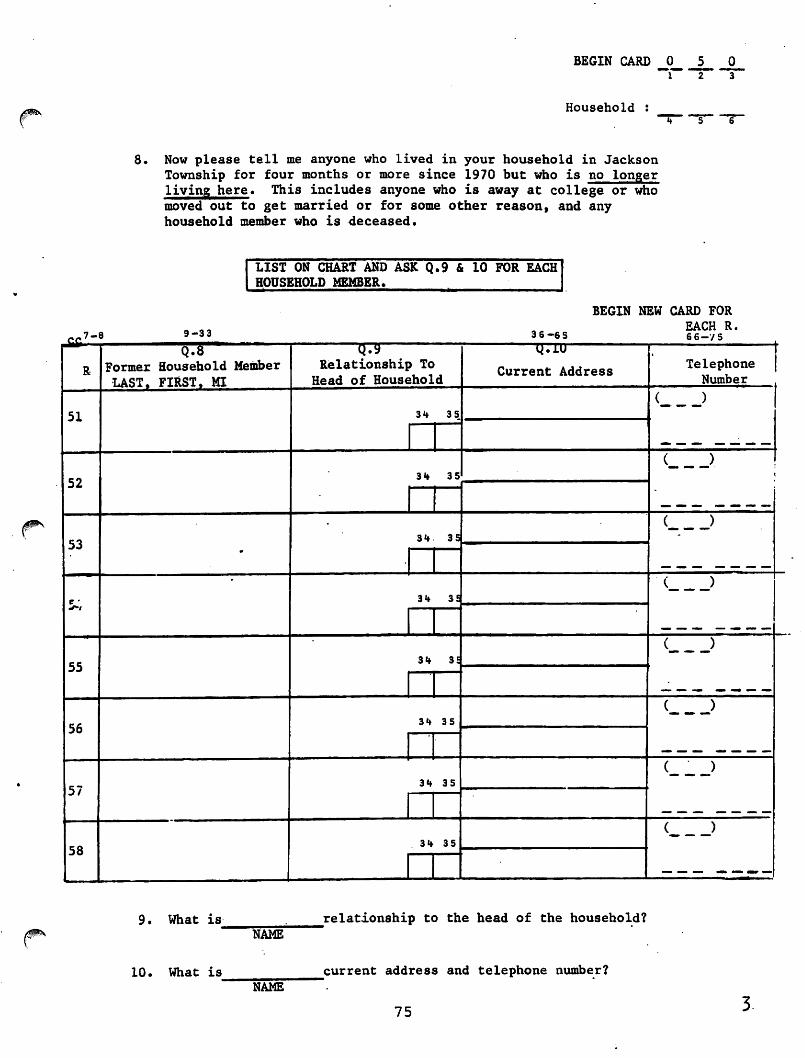
BEGIN CARD J) 5
1 2
Household :
8. Now please tell me anyone who lived in your household in Jackson
Township for four months or more since 1970 but who is no longer
living here. This includes anyone who is away at college or who
moved out to get married or for some other reason, and any
household member who is deceased.
LIST ON CHART AND ASK Q.9 & 10 FOR EACH
HOUSEHOLD MEMBER.
BEGIN NEW CARD FOR
EACH R.
9. What is relationship to the head of the household?
NAME
10. What is
NAME
current address and telephone number?
75
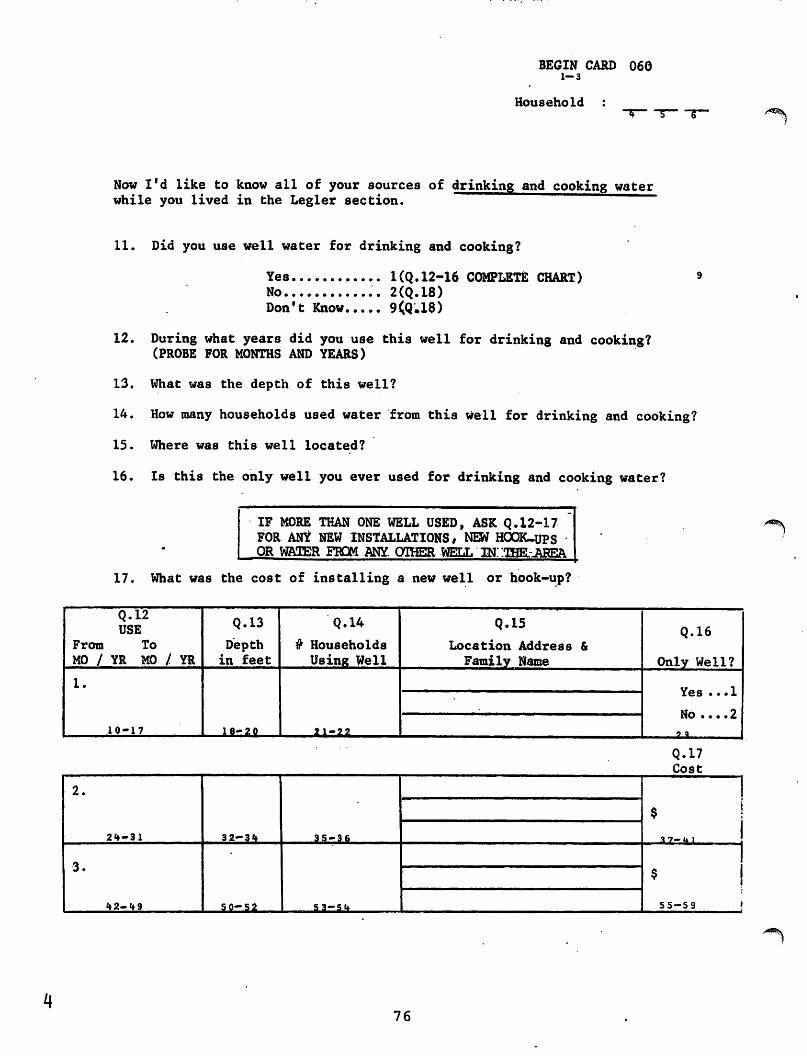
BEGIN CARD 060 1-3
Household :
Now I'd like to know all of your sources of drinking and cooking water
while you lived in the Legler section.
11. Did you use well water for drinking and cooking?
Yes 1(Q.12-16 COMPLETE CHART) a
No .'. 2(Q.18)
Don't Know 9(Q.18)
12. During what years did you use this well for drinking and cooking?
(PROBE FOR MONTHS AND YEARS)
13. What was the depth of this well?
14. How many households used water from this well for drinking and cooking?
15. Where was this well located?
16. Is this the only well you ever used for drinking and cooking water?
IF MORE THAN ONE WELL USED, ASK Q.12-17
FOR ANY NEW INSTALLATIONS, NEW HOOK-UPS
OR WMER FBOM ANY. OMSR WELL "
17. What was the cost of installing a new well or hook-up?
Q.17
Cost
76
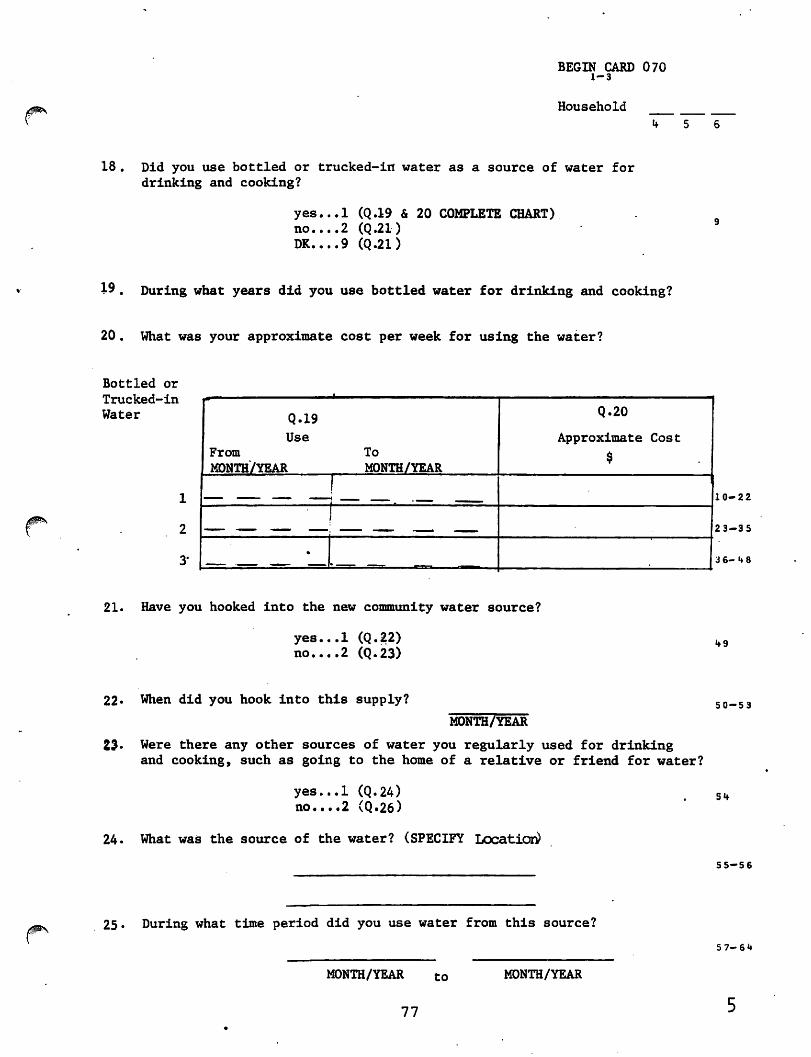
BEGIN CARD 070 1-3
Household
«f 5 6
18. Did you use bottled or trucked-in water as a source of water for
drinking and cooking?
yes...l (Q.19 & 20 COMPLETE CHART)
no....2 (Q.21)
DK 9 (Q.21)
19. During what years did you use bottled water for drinking and cooking?
20. What was your approximate cost per week for using the water?
/s
Bottled or
Trucked-in
Water
1
2
3'
10-22
23-35
3 6-1*8
21. Have you hooked into the new community water source?
yes...l (Q.22)
no....2 (Q.23)
22* When did you hook into this supply?
MONTH/YEAR
50-53
23. Were there any other sources of water you regularly used for drinking
and cooking, such as going to the home of a relative or friend for water?
yes...l (Q.24)
no....2 (Q.26)
24. What was the source of the water? (SPECIFY Location^
5 5-5 6
/jP 25. During what time period did you use water from this source?
MONTH/YEAR to MDNTH/YEAR
5 7-6U
77
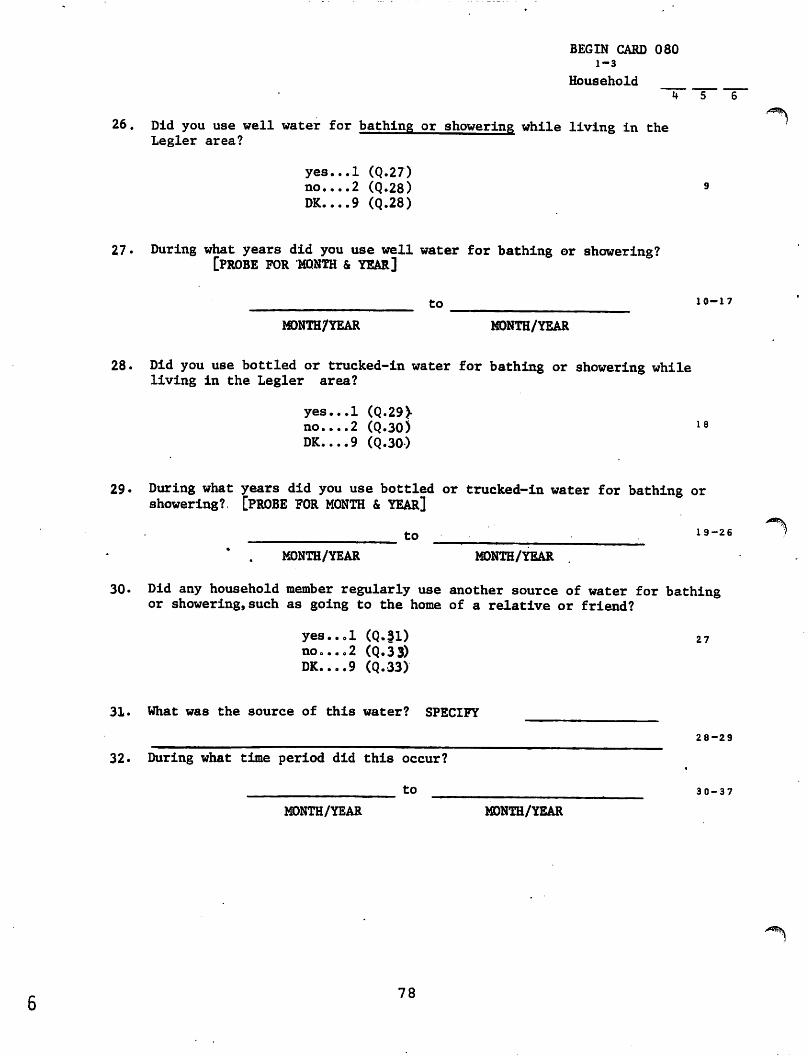
BEGIN CARD 080
1-3
Household
k 5 6
26. Did you use well water for bathing or showering while living in the Legler area?
yes...l (Q.27)
no....2 (Q.28)
DK 9 (Q.28)
27« During what years did you use well water for bathing or showering?
[probe for month & year]
to
MONTH/YEAR MONTH/YEAR
28. Did you use bottled or trucked-in water for bathing or showering while living in the Legler area?
yes...l (Q.29>
no....2 (Q.30) 18
DK. ...9 (Q.30)
29» During what years did you use bottled or trucked-in water for bathing or
showering?. [PROBE FOR MONTH & YEAR]
to 19-26
MONTH/YEAR MONTH/YEAR
30. Did any household member regularly use another source of water for bathing
or showering,such as going to the home of a relative or friend?
yes...l (Q.31) 27
no....2 (Q.33)
DK 9 (Q.33)
31. What was the source of this water? SPECIFY
28-29
32. During what time period did this occur?
to 30-37
MONTH/YEAR MONTH/YEAR
ts
78
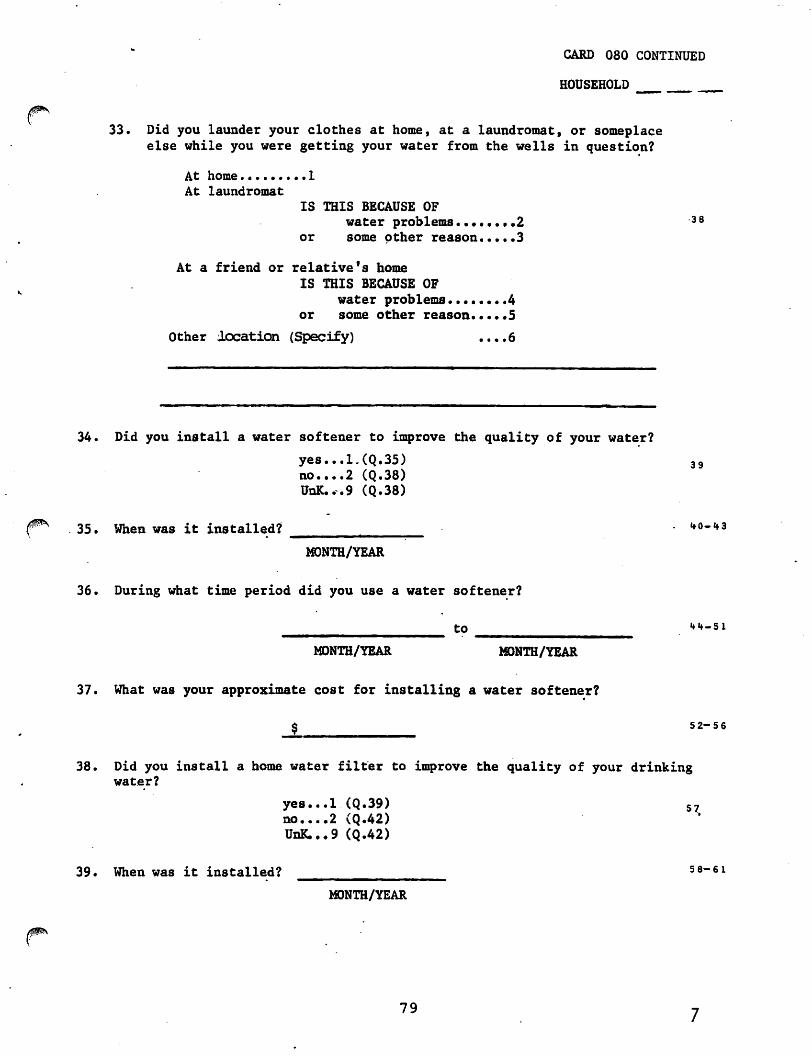
CARD 080 CONTINUED
HOUSEHOLD
33. Did you launder your clothes at home, at a laundromat, or someplace
else while you were getting your water from the wells in question?
At home 1
At laundromat
IS THIS BECAUSE OF
water problems••••••••2 38
or some other reason 3
At a friend or relative's home
IS THIS BECAUSE OF
water problems 4
or some other reason.....5
Other location (Specify) ....6
34. Did you install a water softener to improve the quality of your water?
yes...l.(Q.35) 39
no....2 (Q.38)
UnK...9 (Q.38)
35. When was it installed? - <*o-«f3
MONTH/YEAR
36. During what time period did you use a water softener?
to
MONTH/YEAR MONTH/YEAR
37. What was your approximate cost for installing a water softener?
$ 5 2-56
38. Did you install a home water filter to improve the quality of your drinking
water?
yes...l (Q.39) 5,
no....2 (Q.42) % UnK.,,9 (Q.42)
39. When was it installed? 5B-6i
MONTH/YEAR
79
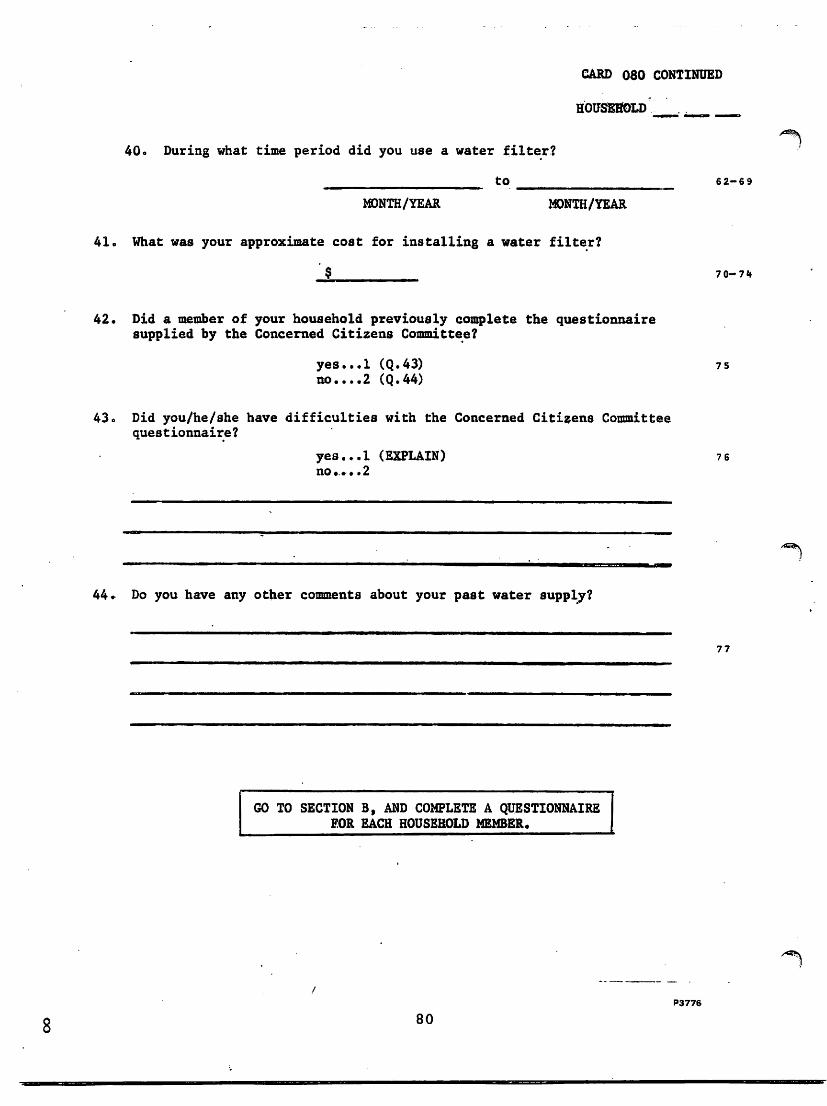
CARD 080 CONTINUED
HOUSEHOLD '.__. ._
40. During what time period did you use a water filter?
tO __^______ 6 2-6 9
MONTH/YEAR MONTH/YEAR
41 o What was your approximate cost for installing a water filter?
$
42. Did a member of your household previously coisplete the questionnaire
supplied by the Concerned Citizens Committee?
yes...l (Q.43) 7 5
no....2 (Q.44)
43. Did you/he/she have difficulties with the Concerned Citizens Committee
questionnaire?
yes...l (EXPLAIN) 7 6
no.• • »2
44♦ Do you have any other comments about your past water supply?
77
GO TO SECTION B, AND COMPLETE A QUESTIONNAIRE
FOR EACH HOUSEHOLD MEMBER.
8
P3776
80
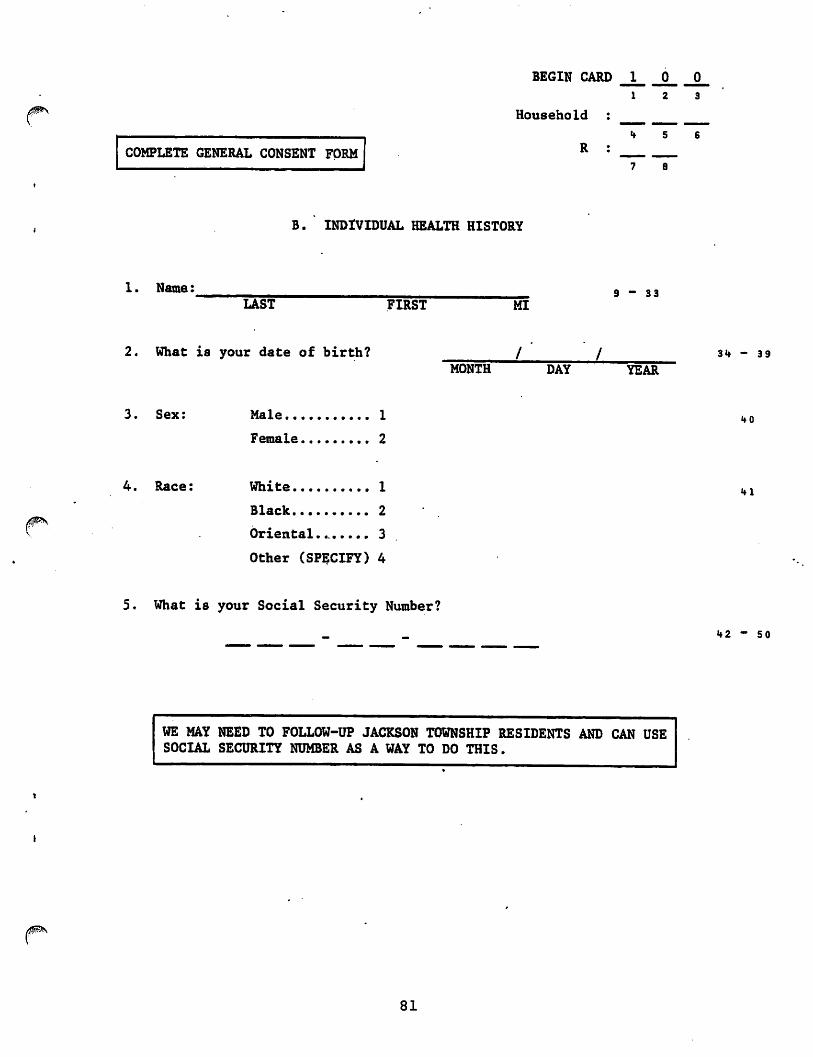
/0^\
COMPLETE GENERAL CONSENT FORM
BEGIN CARD 1
1
Household :
k
0 0
2 3
5 6
8
B. INDIVIDUAL HEALTH HISTORY
1. Name:
LAST FIRST MI
9-33
2. What is your date of birth?
MONTH DAY YEAR
- 39
/5#iP\
3. Sex: Male 1
Female 2
4. Race: White 1
Black 2
Oriental 3
Other (SPECIFY) 4
5. What is your Social Security Number?
>* o
**2 ~ 50
WE MAY NEED TO FOLLOW-UP JACKSON TOWNSHIP RESIDENTS AND CAN USE
SOCIAL SECURITY NUMBER AS A WAY TO DO THIS.
81
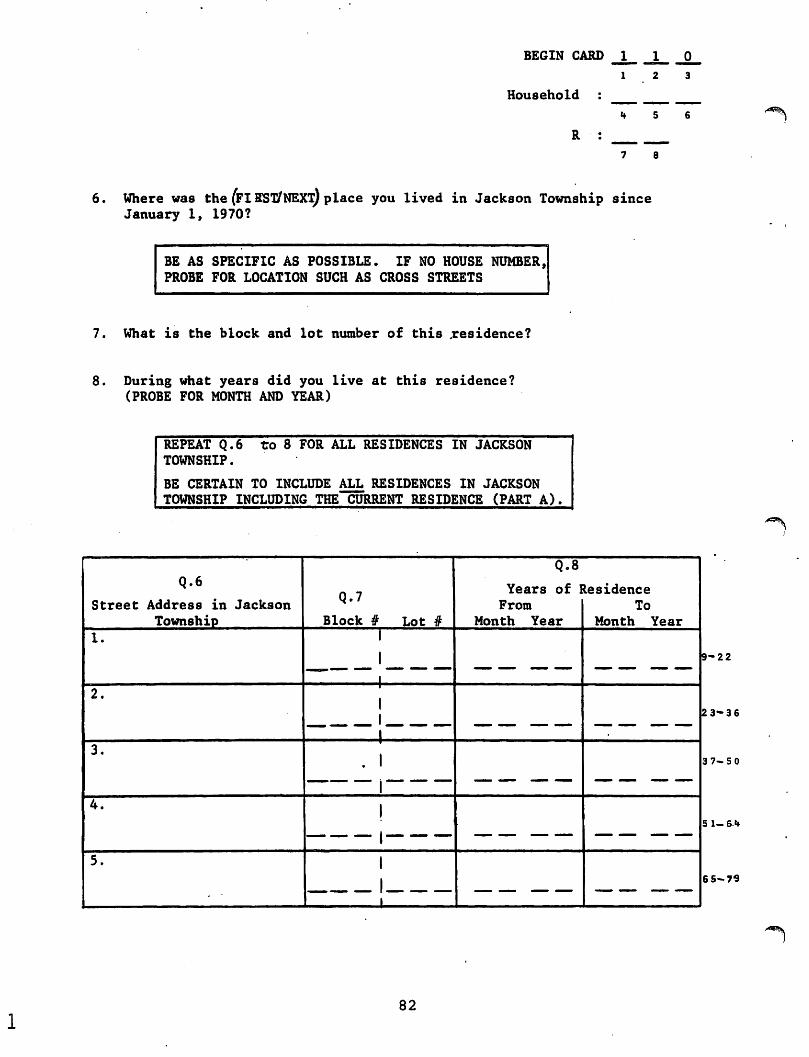
BEGIN CARD JL 1 0_
12 3
Household :
R
6. Where was the (FT ffST/NEXTJ place you lived in Jackson Township since January 1, 1970?
BE AS SPECIFIC AS POSSIBLE. IF NO HOUSE NUMBER,
PROBE FOR LOCATION SUCH AS CROSS STREETS
7. What is the block and lot number of this .residence?
8. During what years did you live at this residence?
(PROBE FOR MONTH AND YEAR)
REPEAT Q.6 to 8 FOR ALL RESIDENCES IN JACKSON
TOWNSHIP.
BE CERTAIN TO INCLUDE ALL RESIDENCES IN JACKSON
TOWNSHIP INCLUDING THE CURRENT RESIDENCE (PART A)
9-22
23-36
3 7-50
5 1- 6M
65-79
82
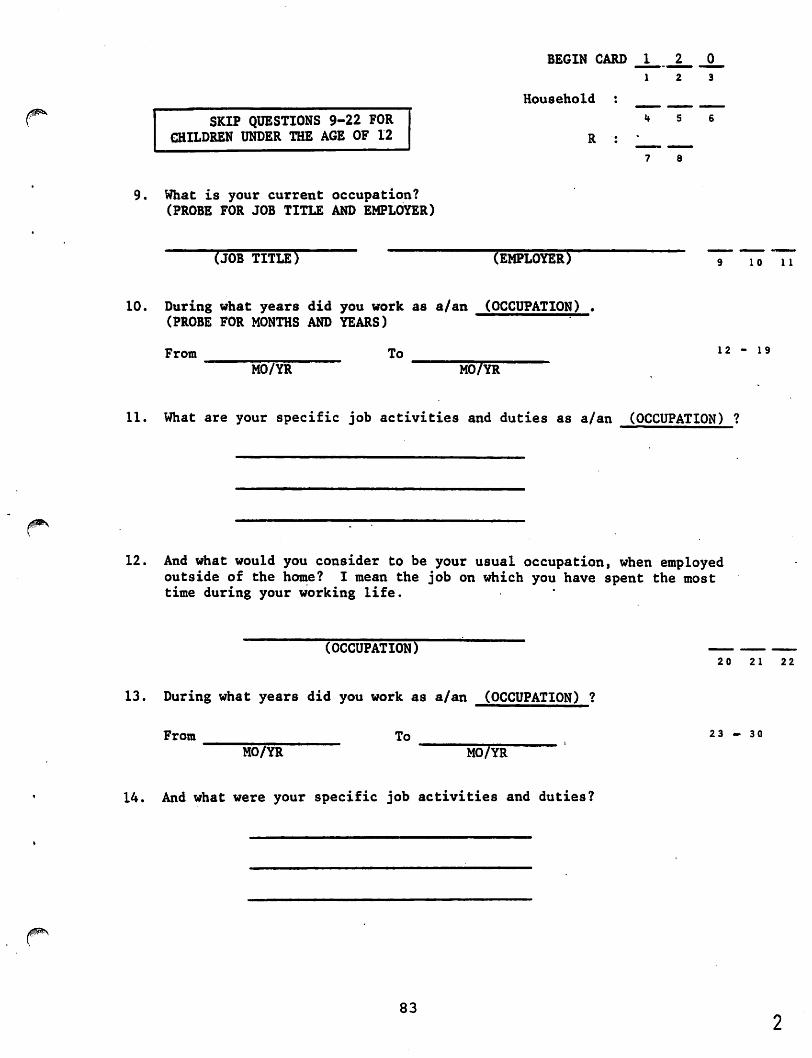
SKIP QUESTIONS 9-22 FOR
CHILDREN UNDER THE AGE OF 12
BEGIN CARD J. 2 0_
12 3
Household :
R : •
7 8
9. What is your current occupation?
(PROBE FOR JOB TITLE AND EMPLOYER)
(JOB TITLE) (EMPLOYER) 9 10 11
10. During what years did you work as a/an (OCCUPATION) «
(PROBE FOR MONTHS AND YEARS)
From To
MO/YR MO/YR
12 - 13
11. What are your specific job activities and duties as a/an (OCCUPATION) ?
12. And what would you consider to be your usual occupation, when employed
outside of the home? I mean the job on which you have spent the most
time during your working life.
(OCCUPATION) 20 21 22
13. During what years did you work as a/an (OCCUPATION) ?
From To
MO/YR MO/YR
23 - 30
14. And what were your specific job activities and duties?
83
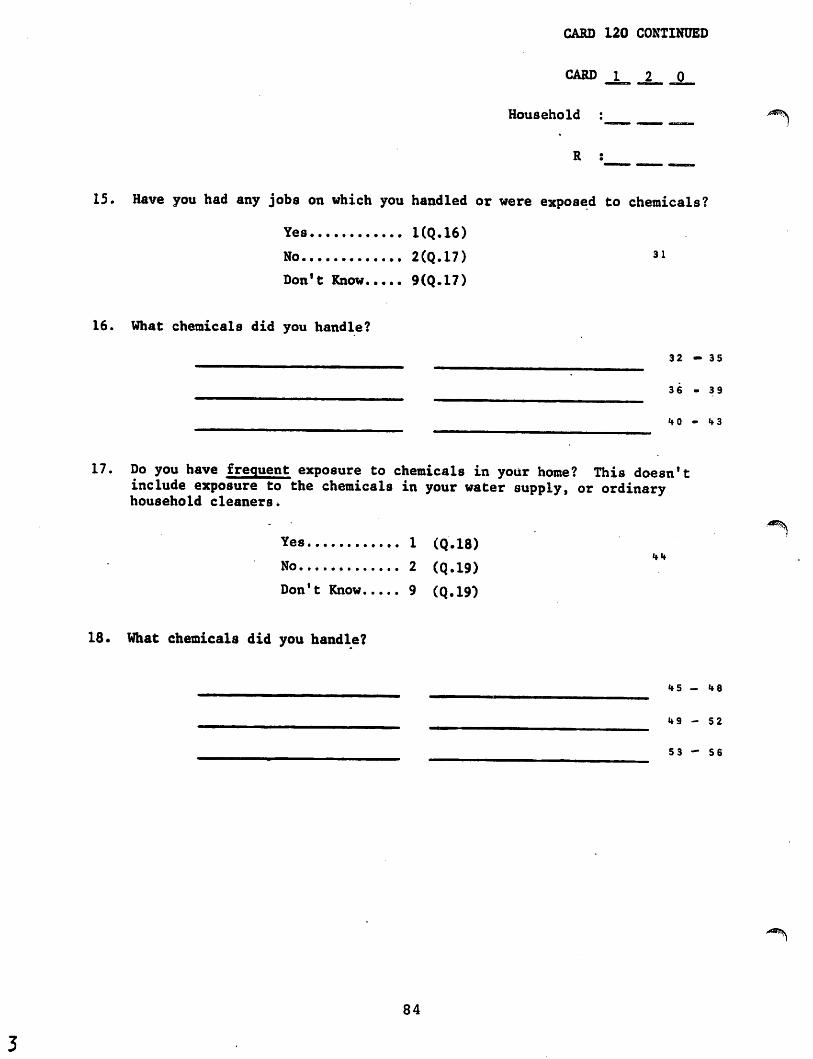
CARD 120 CONTINUED
CARD JL_ _2_ Q
Household ; ___ ̂ _^
R s
15. Have you had any jobs on which you handled or were exposed to chemicals?
Yes KQ.16)
No 2(Q.17) 31
Don't Know 9(Q.17)
16. What chemical8 did you handle?
_^ 32 - 35
36 - 39
17. Do you have frequent exposure to chemicals in your home? This doesn't
include exposure to the chemicals in your water supply, or ordinary household cleaners.
Yes 1 (Q.18)
No 2 (Q.19)
Don't Know 9 (Q.19)
18. What chemicals did you handle?
t*9 - 52
S3 - 56
84
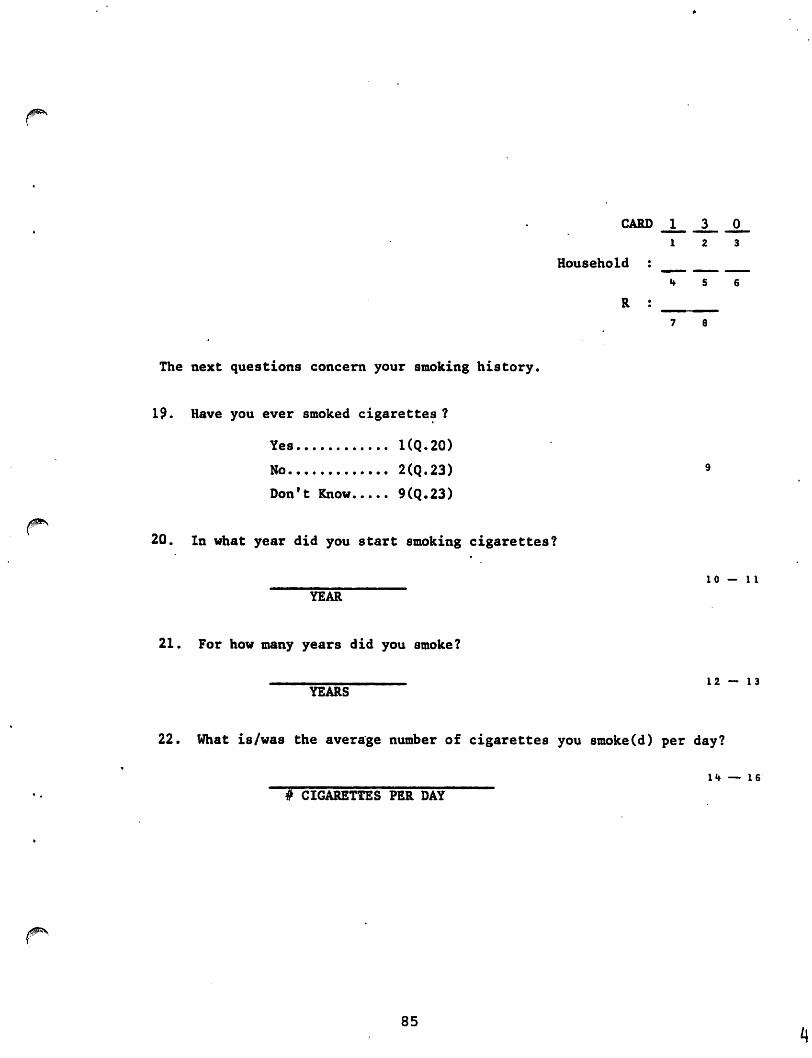
0
/spv
CARD J. 3 0
12 3
Household : __
if S 6
R :
7 8
The next questions concern your smoking history.
19. Have you ever smoked cigarettes ?
Yes KQ.20)
No 2(Q.23)
Don't Know 9(Q.23)
20. In what year did you start smoking cigarettes?
10 — 11
YEAR
21. For how many years did you smoke?
____ 12 — 13
YEARS
22. What is/was the average number of cigarettes you smoke(d) per day?
m — 16
# CIGARETTES PER DAY
85
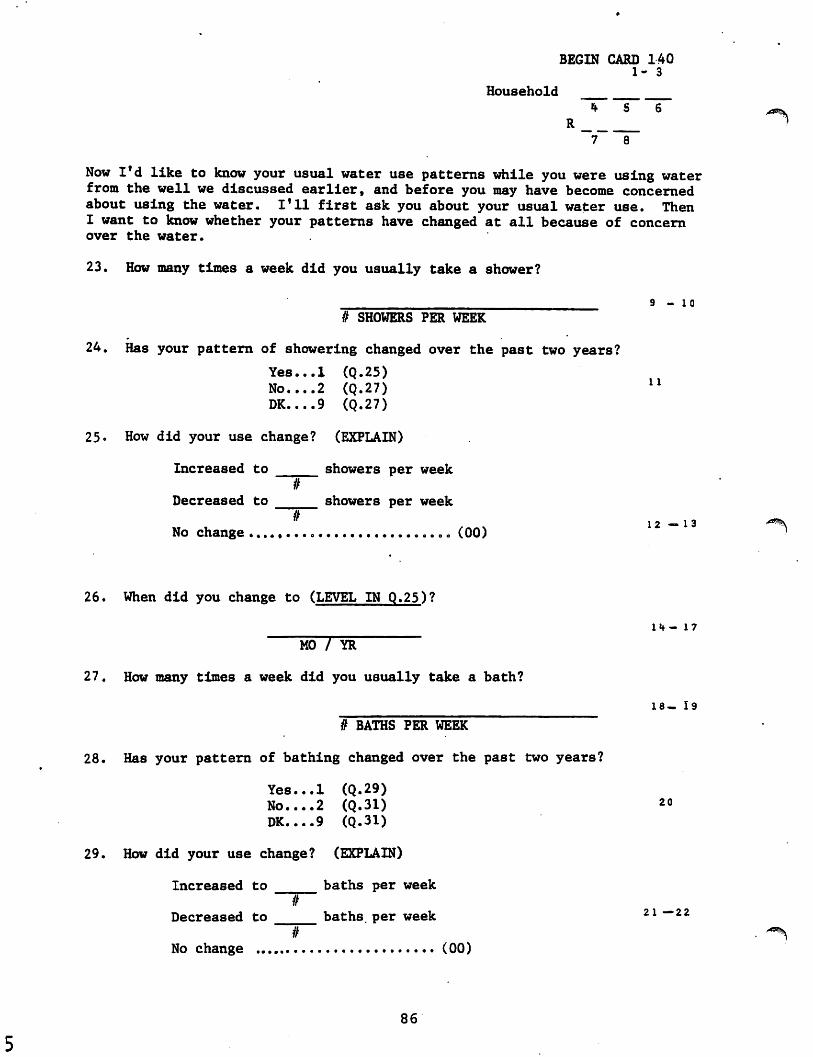
BEGIN CARD 140 1- 3
Household
«f 5 6
R
7 8
Now I'd like to know your usual water use patterns while you were using water from the well we discussed earlier, and before you may have become concerned
about using the water. I'll first ask you about your usual water use. Then
I want to know whether your patterns have changed at all because of concern over the water.
23. How many times a week did you usually take a shower?
9-10
# SHOWERS PER WEEK
24. Has your pattern of showering changed over the past two years?
Yes...l (Q.25)
No 2 (Q.27) ll DK 9 (Q.27)
25• How did your use change? (EXPLAIN)
Increased to showers per week
#
Decreased to showers per week
No change ...., (00) "~
26. When did you change to (LEVEL IN Q.25)?
m- 17
MO / YR
27. How many times a week did you usually take a bath?
18. 19
# BATHS PER WEEK
28. Has your pattern of bathing changed over the past two years?
Yes...l (Q.29)
No 2 (Q.31) 20
DK....9 (Q.31)
29. How did your use change? (EXPLAIN)
Increased to baths per week
#
Decreased to baths per week 21 22
# No change (00)
86
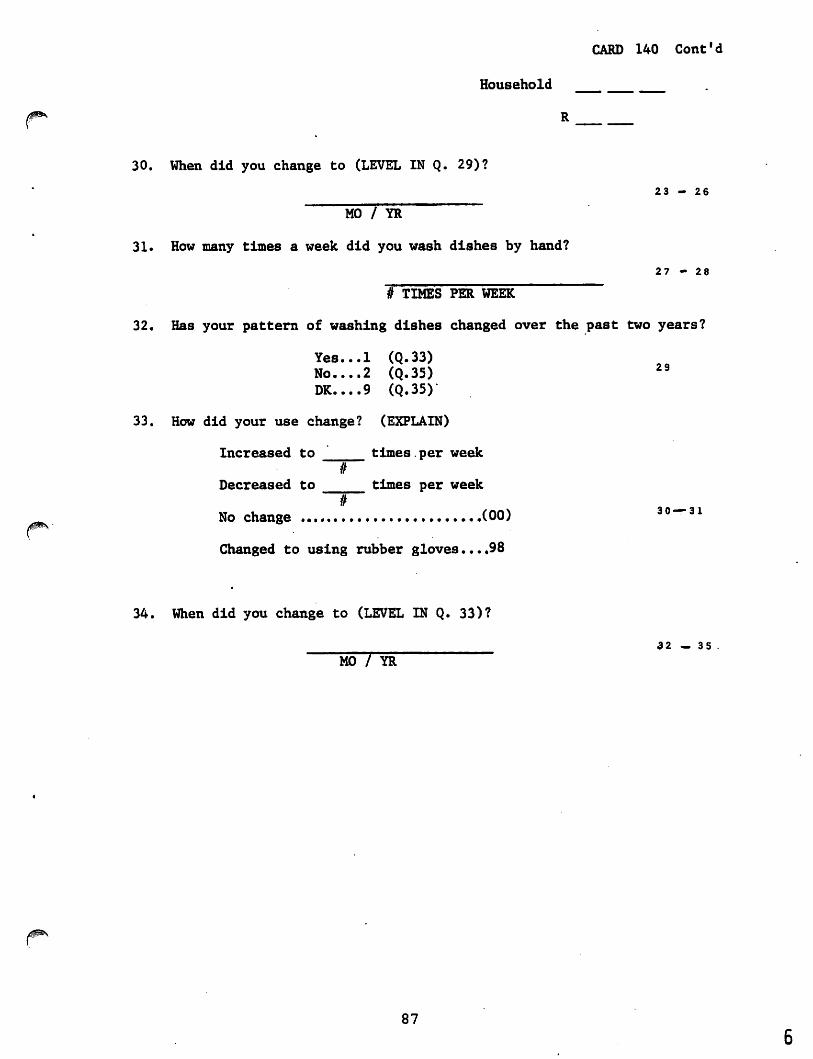
CARD 140 Cont'd
Household
R
30. When did you change to (LEVEL IN Q. 29)?
23 - 26
MO / YR
31. How many times a week did you wash dishes by hand?
27 - 28
# TIMES PER WEEK
32. Has your pattern of washing dishes changed over the past two years?
Yes...l (Q.33)
No 2 (Q.35) 29 DK. ...9 (Q.35)
33. How did your use change? (EXPLAIN)
Increased to times.per week
# Decreased to times per week
# No change (00) 30~31
Changed to using rubber gloves... «98
34. When did you change to (LEVEL IN Q. 33)?
32 - 35
MO / YR
87
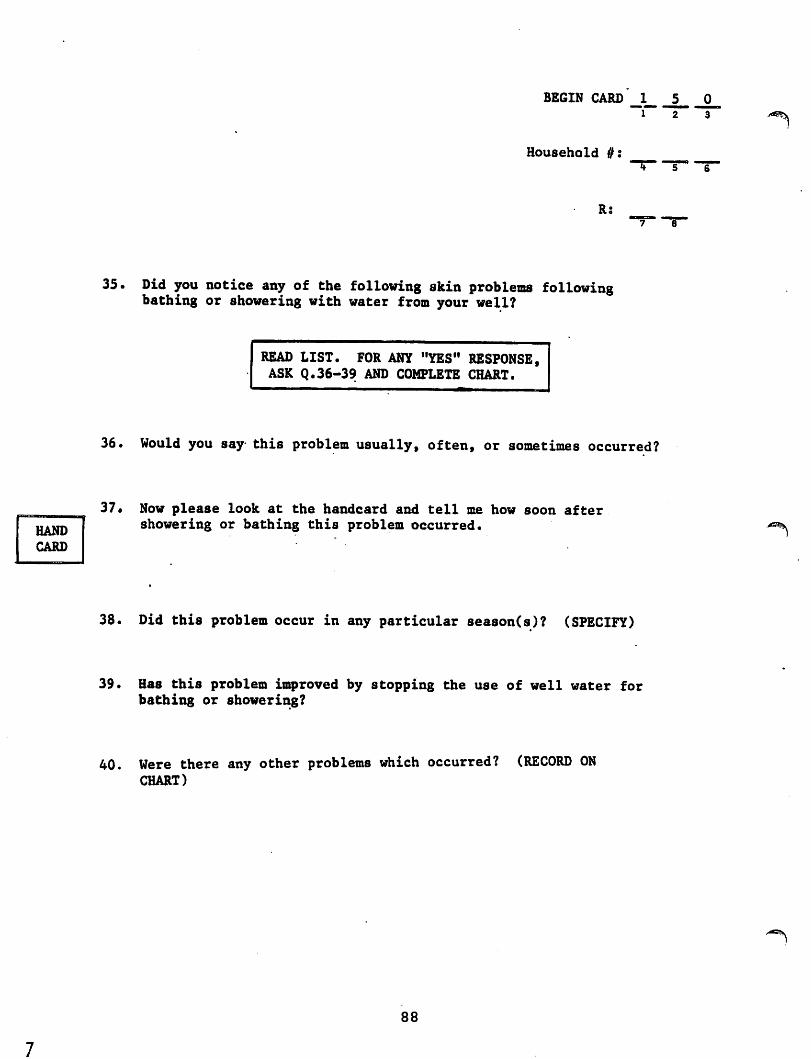
BEGIN CARD 1
Household
5 0
2 3
S 6
R:
35. Did you notice any of the following skin problems following bathing or showering with water from your well?
READ LIST. FOR ANY "YES" RESPONSE,
ASK Q.36-39 AND COMPLETE CHART.
36. Would you say this problem usually, often, or sometimes occurred?
HAND
CARD
37* Now please look at the handcard and tell me how soon after
showering or bathing this problem occurred.
38. Did this problem occur in any particular season(s)? (SPECIFY)
39. Has this problem improved by stopping the use of well water for
bathing or showering?
40. Were there any other problems which occurred? (RECORD ON
CHART)
88
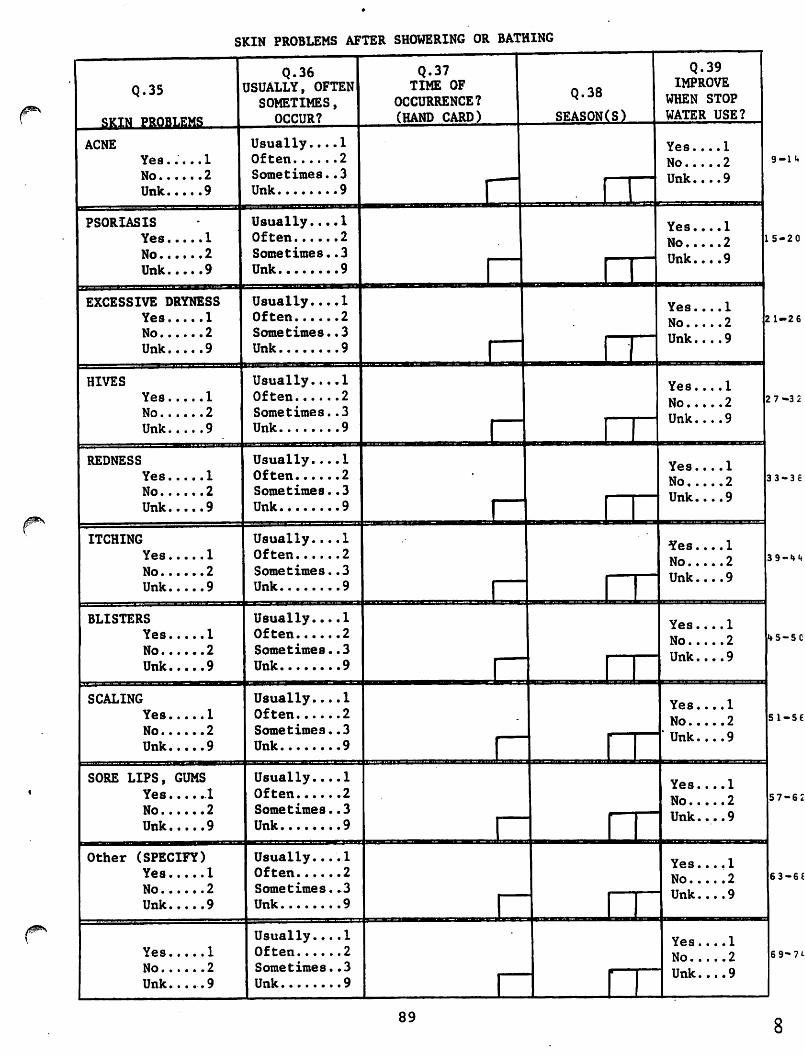
89 8
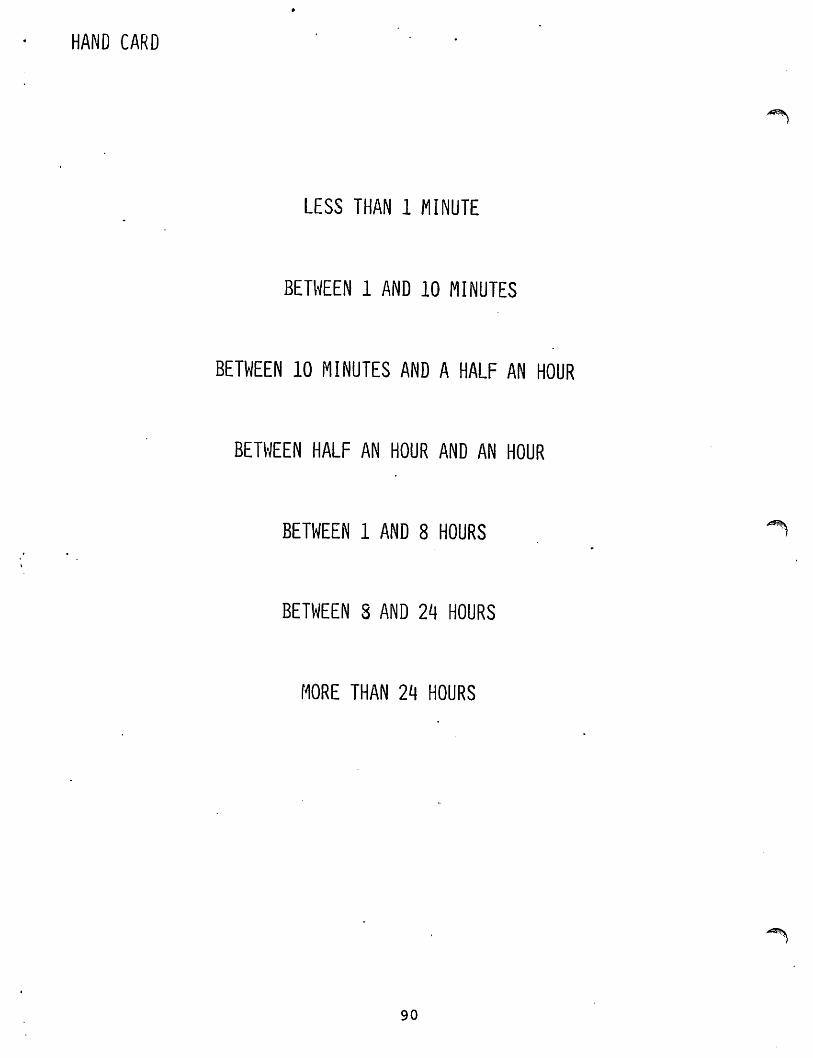
HAND CARD
LESS THAN 1 MINUTE
BETWEEN 1 AND 10 MINUTES
BETWEEN 10 MINUTES AND A HALF AN HOUR
BETWEEN HALF AN HOUR AND AN HOUR
BETWEEN 1 AND 8 HOURS
BETWEEN 8 AND 24 HOURS
MORE THAN 24 HOURS
/?\
90
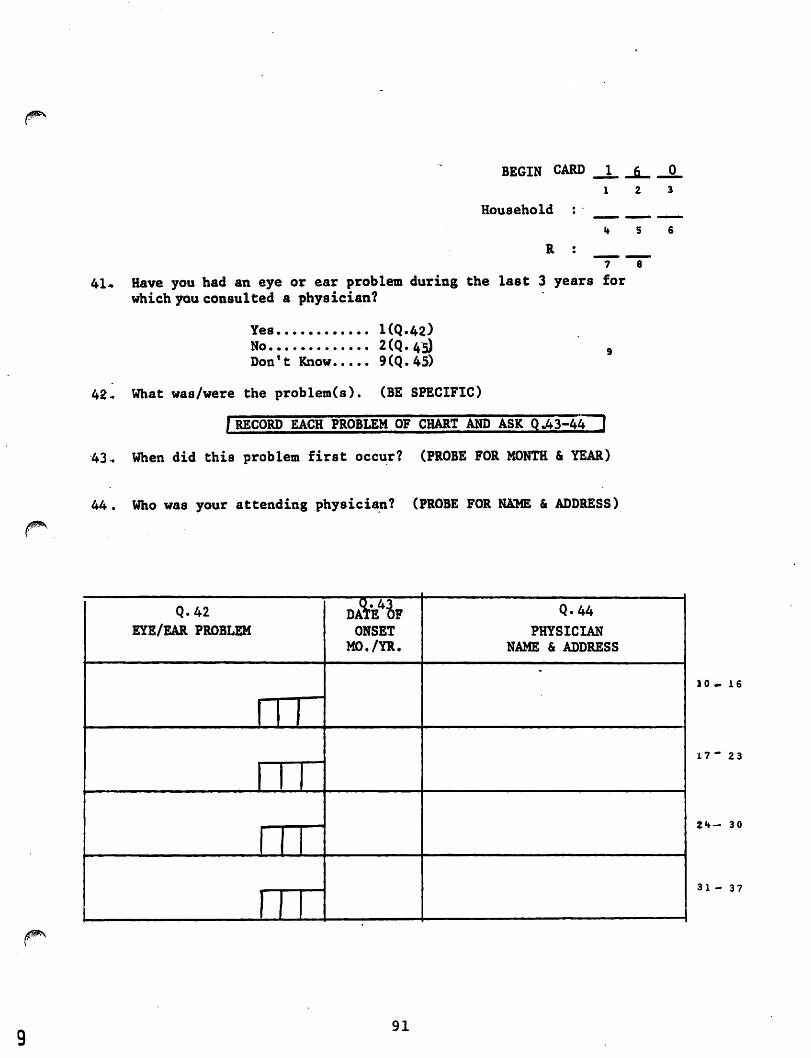
BEGIN CARD _1_ _
l 2
Household : ____ __
>» 5
R :
7 8
41* Have you had an eye or ear problem during the last 3 years for
which you consulted a physician?
Yes KQ.42)
No 2(Q.45) 9
Don't Know 9CQ.45)
42. What was/were the problem(s). (BE SPECIFIC)
f RECORD EACH PROBLEM OF CHART AND ASK Q .43-44 J
43. When did this problem first occur? (PROBE FOR MONTH & YEAR)
44. Who was your attending physician? (PROBE FOR NAME & ADDRESS)
10 - 16
17"" 2 3
2«f- 30
31 - 37
9 91
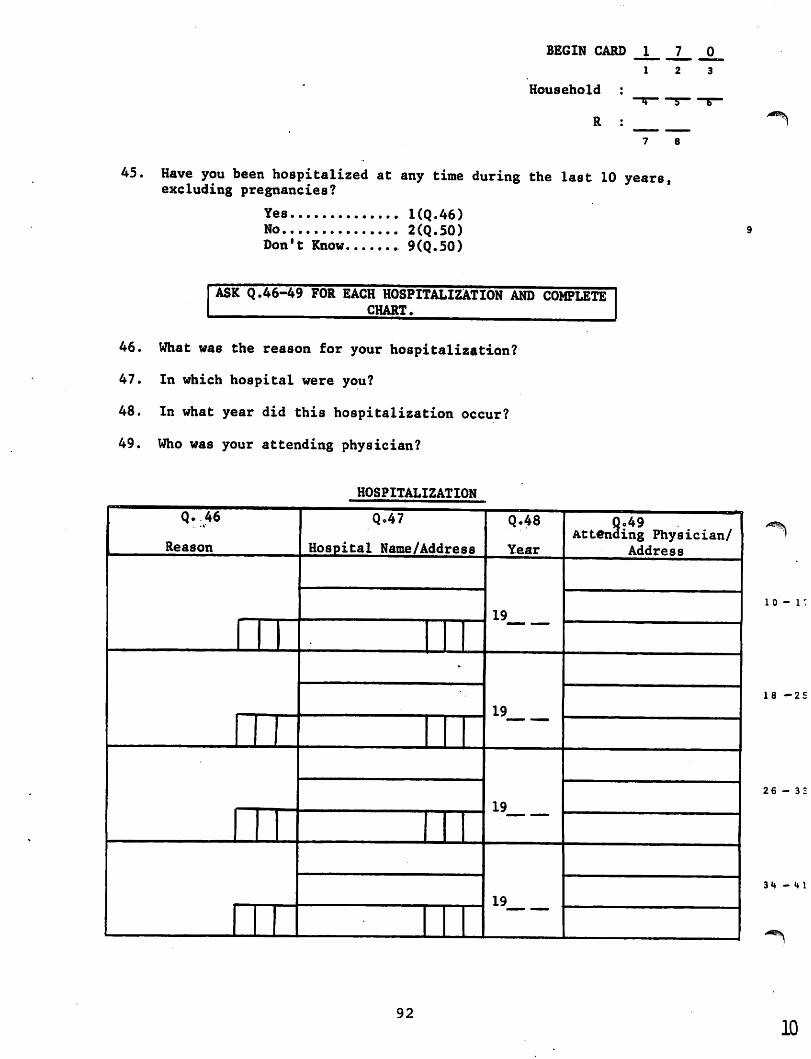
BEGIN CARD 1
1
Household :
R : ^v
45. Have you been hospitalized at any time during the last 10 years, excluding pregnancies?
Yes KQ.46)
No 2(Q.5O)
Don't Know 9(Q.5O)
ASK Q.46-49 FOR EACH HOSPITALIZATION AND COMPLETE
CHART.
46. What was the reason for your hospitalization?
47. In which hospital were you?
48. In what year did this hospitalization occur?
49. Who was your attending physician?
HOSPITALIZATION
10 —
18 —25
26 - 32
3 t* — ** 1
92
10
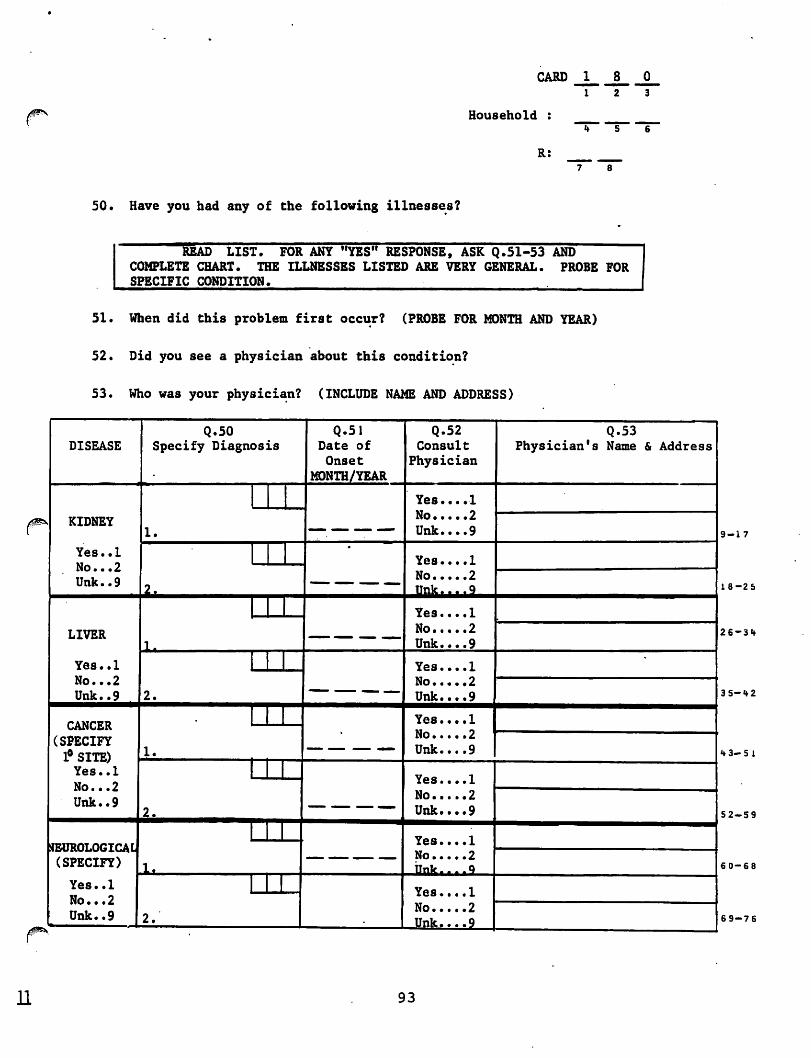
CARD 18 0
12 3
Household :
R:
50. Have you had any of Che following illnesses?
READ LIST. FOR ANY "YES" RESPONSE, ASK Q.51-53 AND
COMPLETE CHART. THE ILLNESSES LISTED ARE VERY GENERAL. PROBE FOR
SPECIFIC CONDITION.
51. When did this problem first occur? (PROBE FOR MONTH AND YEAR)
52. Did you see a physician about this condition?
53. Who was your physician? (INCLUDE NAME AND ADDRESS)
9-17
18-25
4 3-51
52-59
6 0-68
6 9-76
93
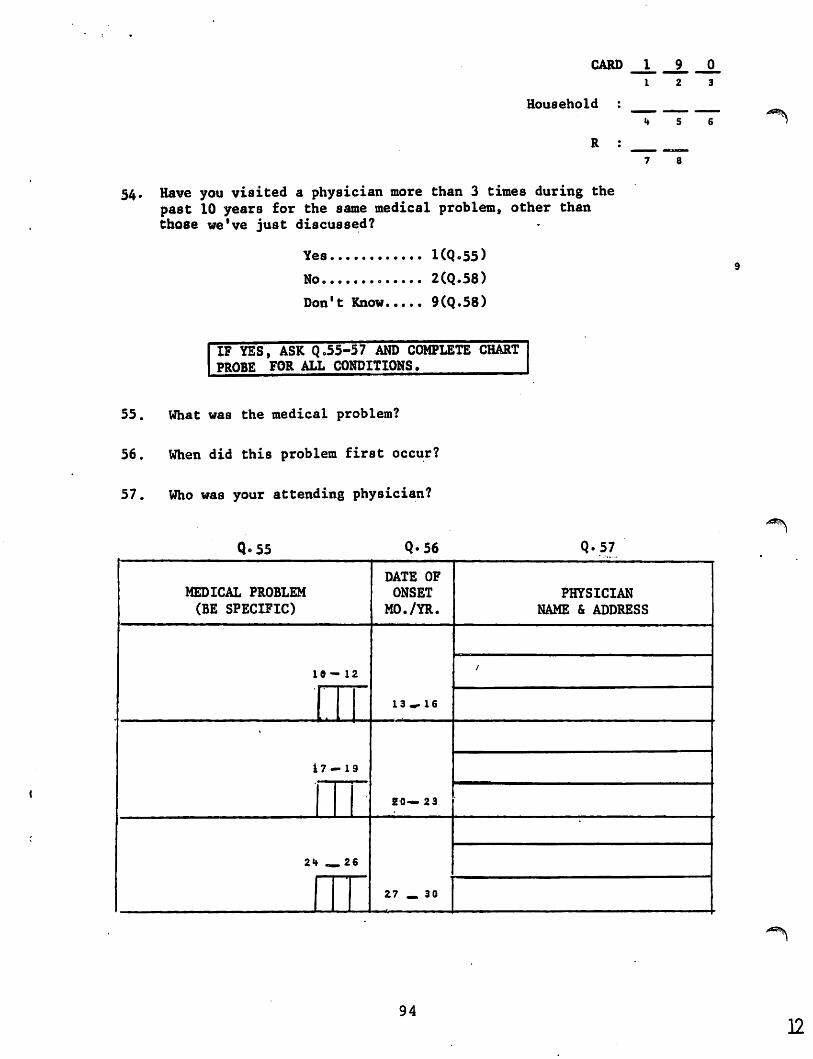
CARD 1
1
Household :
I*
R :
7
54. Have you visited a physician more than 3 times during the
past 10 years for the same medical problem, other than
those we've just discussed?
Yes KQ-55)
No 2(Q.58)
Don't Know 9(Q.58)
9 0
2 3
IF YES, ASK Q.55-57 AND COMPLETE CHART
PROBE FOR ALL CONDITIONS.
55. What was the medical problem?
56. When did this problem first occur?
57. Who was your attending physician?
94
12
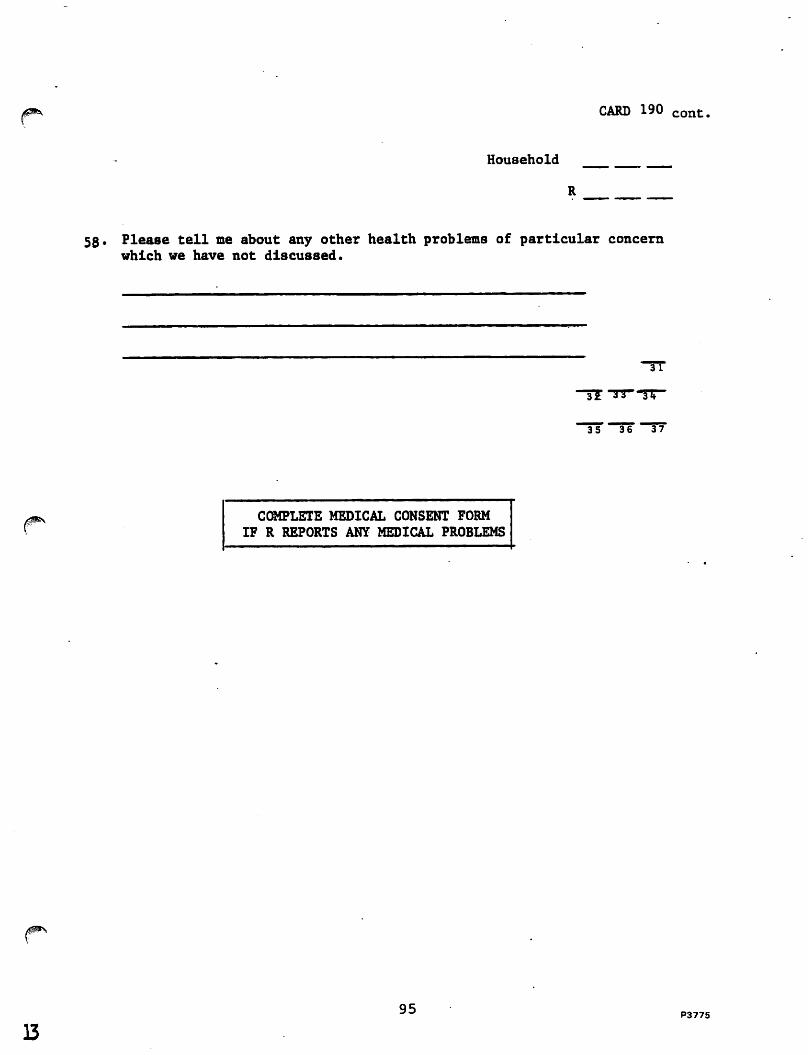
CARD 190 cont,
Household
58. Please tell me about any other health problems of particular concern
which we have not discussed.
35 36
COMPLETE MEDICAL CONSENT FORM
IF R REPORTS ANY MEDICAL PROBLEMS
95
13
P3775
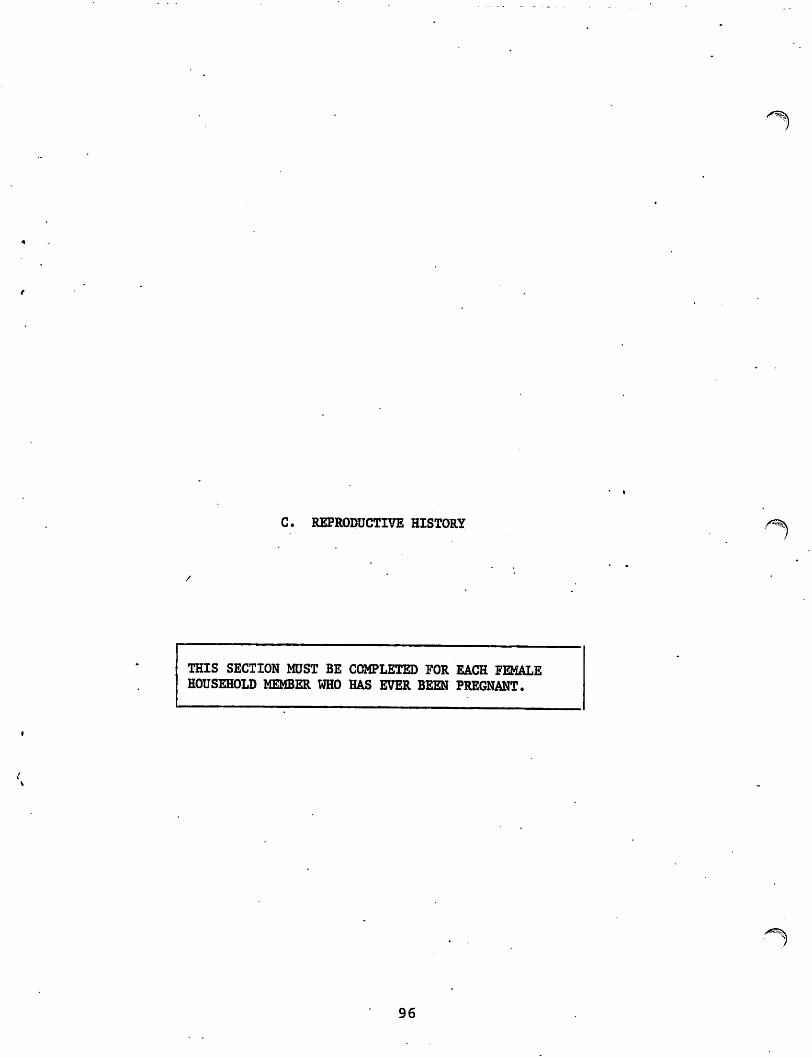
C. REPRODUCTIVE HISTORY
THIS SECTION MUST BE COMPLETED FOR EACH FEMALE
HOUSEHOLD MEMBER WHO HAS EVER BEEN PREGNANT.
96
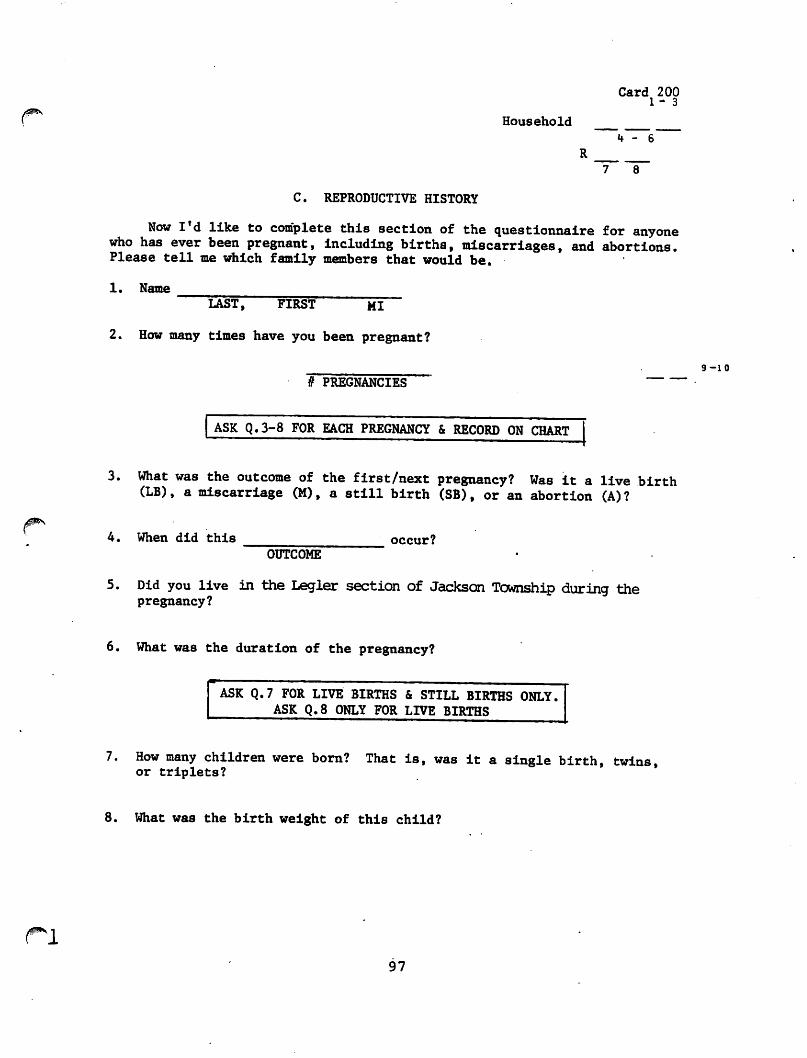
Card 200 1-3
Household
k - S
R
7 8
C. REPRODUCTIVE HISTORY
Now I'd like to complete this section of the questionnaire for anyone who has ever been pregnant, including births, miscarriages, and abortions. Please tell me which family members that would be.
1. Name
LAST, FIRST MI
2. How many times have you been pregnant?
. 9-10
# PREGNANCIES '
ASK Q.3-8 FOR EACH PREGNANCY & RECORD ON CHART
3. What was the outcome of the first/next pregnancy? Was it a live birth (LB), a miscarriage (M), a still birth (SB), or an abortion (A)?
4. When did this occur?
OUTCOME
5. Did you live in the Legler section of Jackson Township during the pregnancy?
6. What was the duration of the pregnancy?
ASK Q.7 FOR LIVE BIRTHS & STILL BIRTHS ONLY.
ASK Q.8 ONLY FOR LIVE BIRTHS
7. How many children were born? That is, was it a single birth, twins, or triplets?
8. What was the birth weight of this child?
97
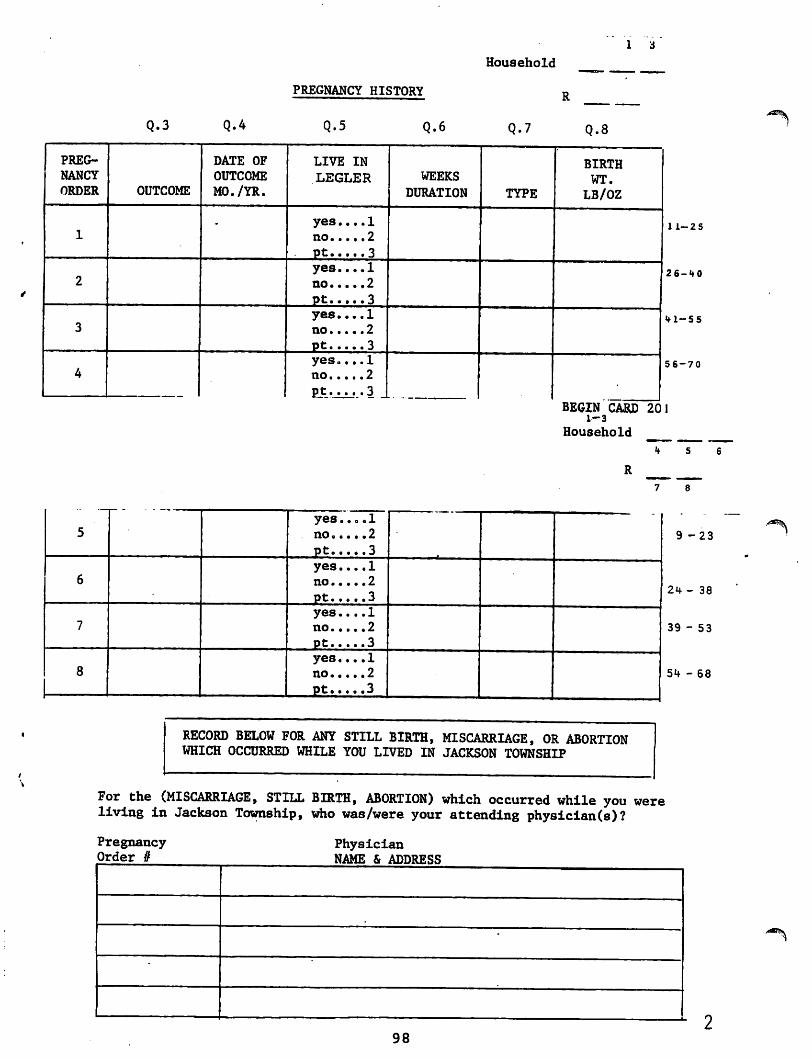
1 3
Household
PREGNANCY HISTORY R
Q.3 <M Q.5 Q.6 Q.7 Q.8
11-2S
26-40
«*l-55
56-70
BEGIN CARD 201 1-3
Household
R
9-23
24- 38
39 - 53
54 -68
^
RECORD BELOW FOR ANY STILL BIRTH, MISCARRIAGE, OR ABORTION WHICH OCCURRED WHILE YOU LIVED IN JACKSON TOWNSHIP
For the (MISCARRIAGE, STILL BIRTH, ABORTION) which occurred while you were living in Jackson Township, who was/were your attending physician(s)?
98
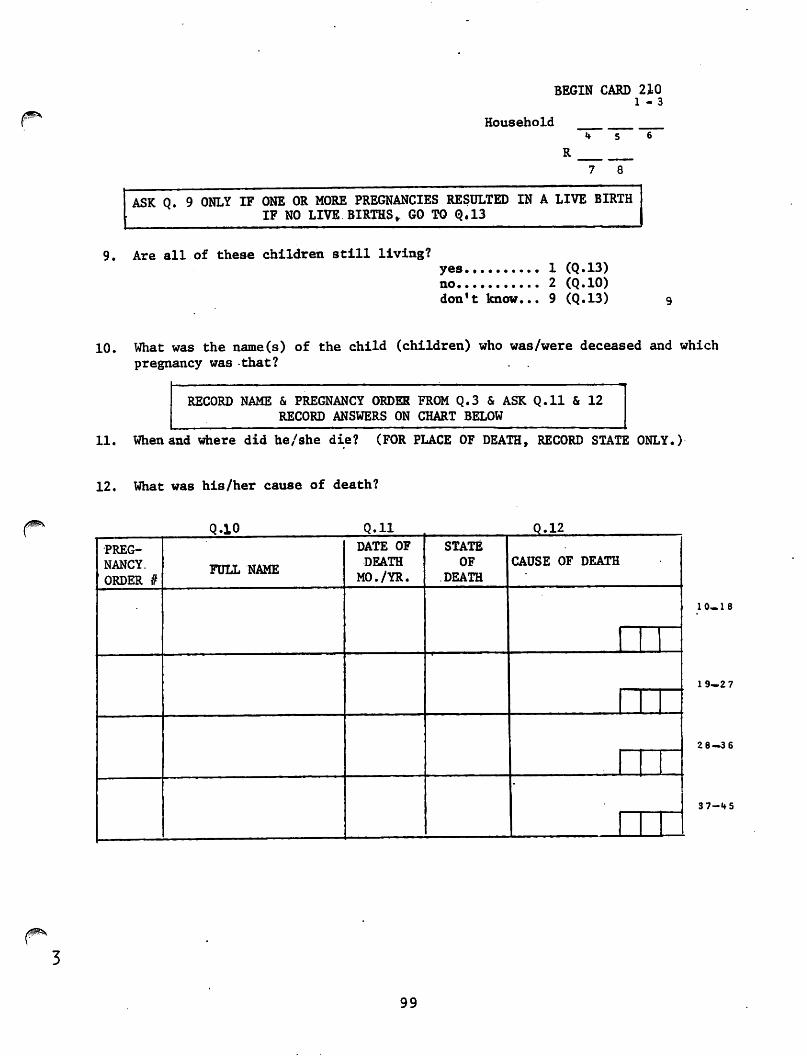
BEGIN CARD 210 1-3
Household
R
«♦ 5
7 8
ASK Q. 9 ONLY IF ONE OR MORE PREGNANCIES RESULTED IN A LIVE BIRTH
IF NO LIVE BIRTHS, GO TO Q.13
9. Are all of these children still living? yes 1 (Q.13)
no 2 (Q.10)
don't know... 9 (Q.13)
10. What was the name(s) of the child (children) who was/were deceased and which
pregnancy was -that?
RECORD NAME & PREGNANCY ORDER FROM Q.3 & ASK Q.ll & 12
RECORD ANSWERS ON CHART BELOW
11. When and where did he/she die? (FOR PLACE OF DEATH, RECORD STATE ONLY.)
12. What was his/her cause of death?
/
10.18
19—2 7
2 8—3 6
37-«fS
99
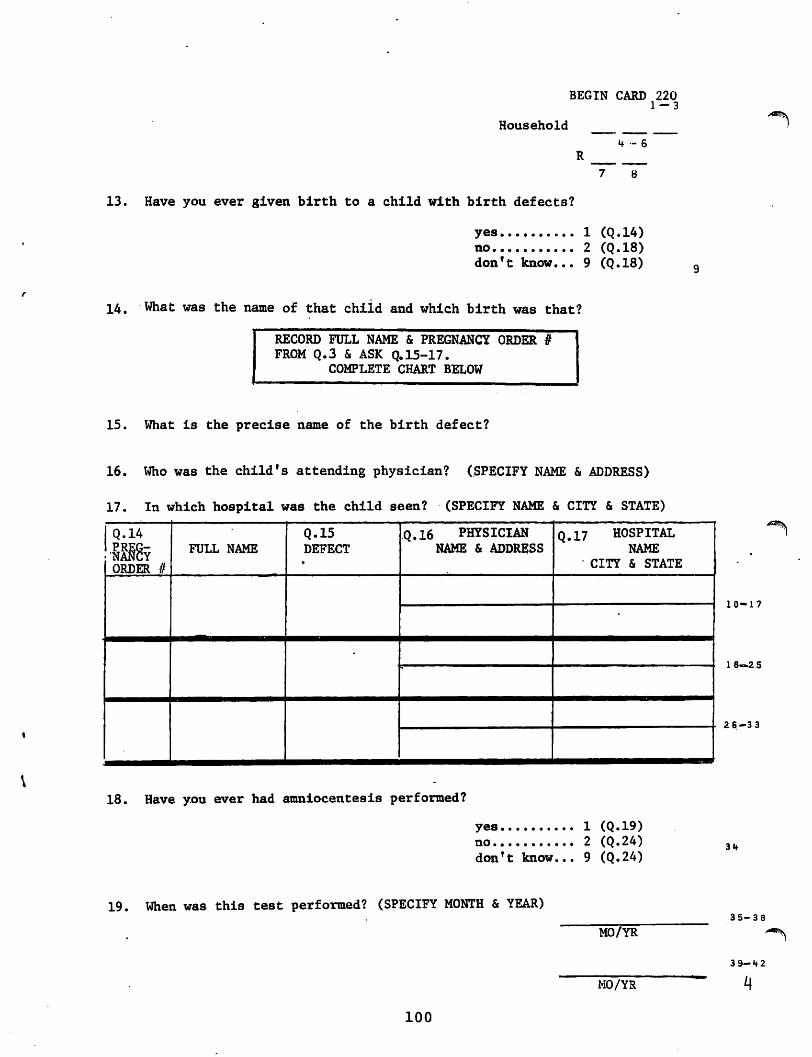
BEGIN CARD 220 1 — 3
Household
- 6
1
13. Have you ever given birth to a child with birth defects?
yes 1 (Q.14)
no 2 (Q.18)
don't know... 9 (Q.18)
14. What was the name of that chiid and which birth was that?
RECORD FULL NAME & PREGNANCY ORDER
FROM Q.3 & ASK Q. 15-17.
COMPLETE CHART BELOW
15. What is the precise name of the birth defect?
16. Who was the child's attending physician? (SPECIFY NAME & ADDRESS)
17. In which hospital was the child seen? (SPECIFY NAME & CITY & STATE)
18. Have you ever had amniocentesis performed?
yes 1 (Q.19)
no 2 (Q.24)
don't know... 9 (Q.24)
19. When was this test performed? (SPECIFY MONTH & YEAR)
MO/YR
MO/YR
10-17
18—2 5
26-33
3 5-38
39-H2
100
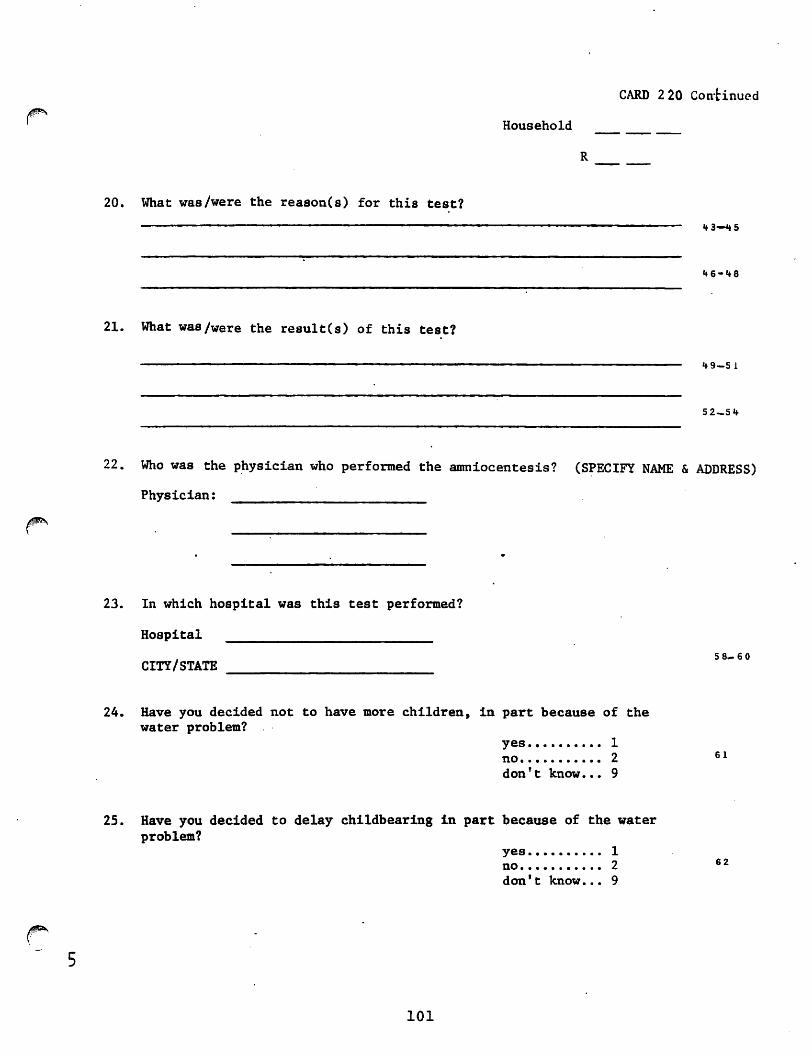
CARD 2 20 Continued
' Household
R
20. What was/were the reason(s) for this test?
21. What was/were the result(s) of this test?
52-5 if
22. Who was the physician who performed the amniocentesis? (SPECIFY NAME & ADDRESS)
Physician:
23. In which hospital was this test performed?
Hospital
. 5 8-60
CITY/STATE
24. Have you decided not to have more children, in part because of the
water problem?
yes 1
no 2 61
don't know... 9
25. Have you decided to delay childbearing in part because of the water
problem?
yes 1
no 2 G2
don't know... 9
101
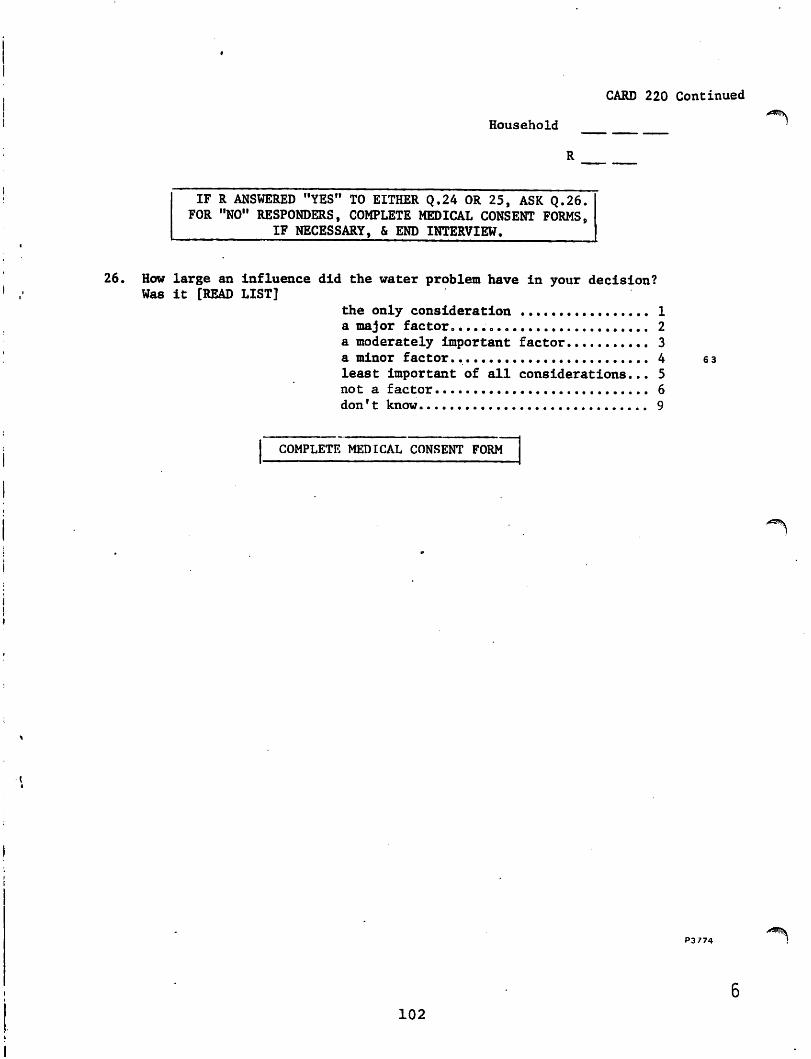
CARD 220 Continued
Household
IF R ANSWERED "YES" TO EITHER Q.24 OR 25, ASK Q.26.
FOR "NO" RESPONDERS, COMPLETE MEDICAL CONSENT FORMS,
IF NECESSARY, & END INTERVIEW,
26. How large an Influence did the water problem have In your decision?
Was It [READ LIST]
the only consideration 1
a major factor. 2
a moderately important factor 3
a minor factor.. 4
least Important of all considerations... 5
not a factor 6
donf t know 9
63
COMPLETE MEDICAL CONSENT FORM
P3 774
%y
102
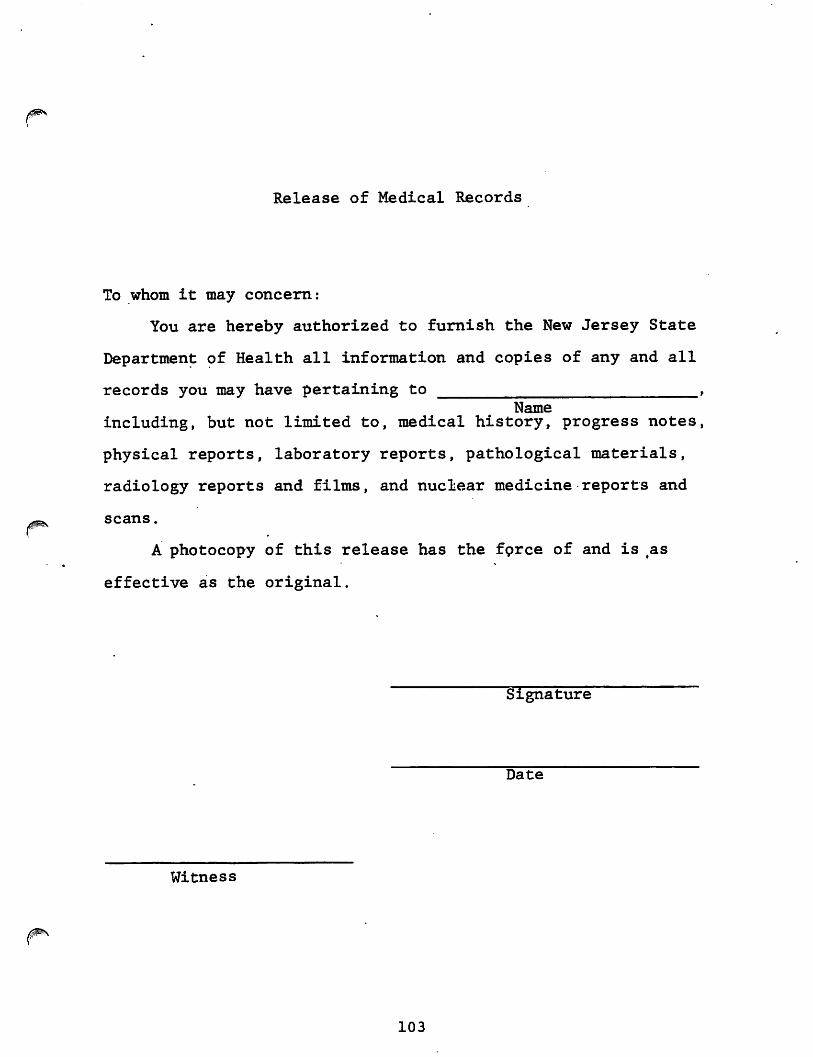
J0
Release of Medical Records
To whom it may concern:
You are hereby authorized to furnish the New Jersey State
Department of Health all information and copies of any and all
records you may have pertaining to ,
Name
including, but not limited to, medical history, progress notes,
physical reports, laboratory reports, pathological materials,
radiology reports and films, and nuclear medicine reports and
scans.
A photocopy of this release has the force of and is §as
effective as the original.
Signature
Date
Witness
103
APPENDIX 3
MEMO ON GROUNDWATER CONTAMINATION
104
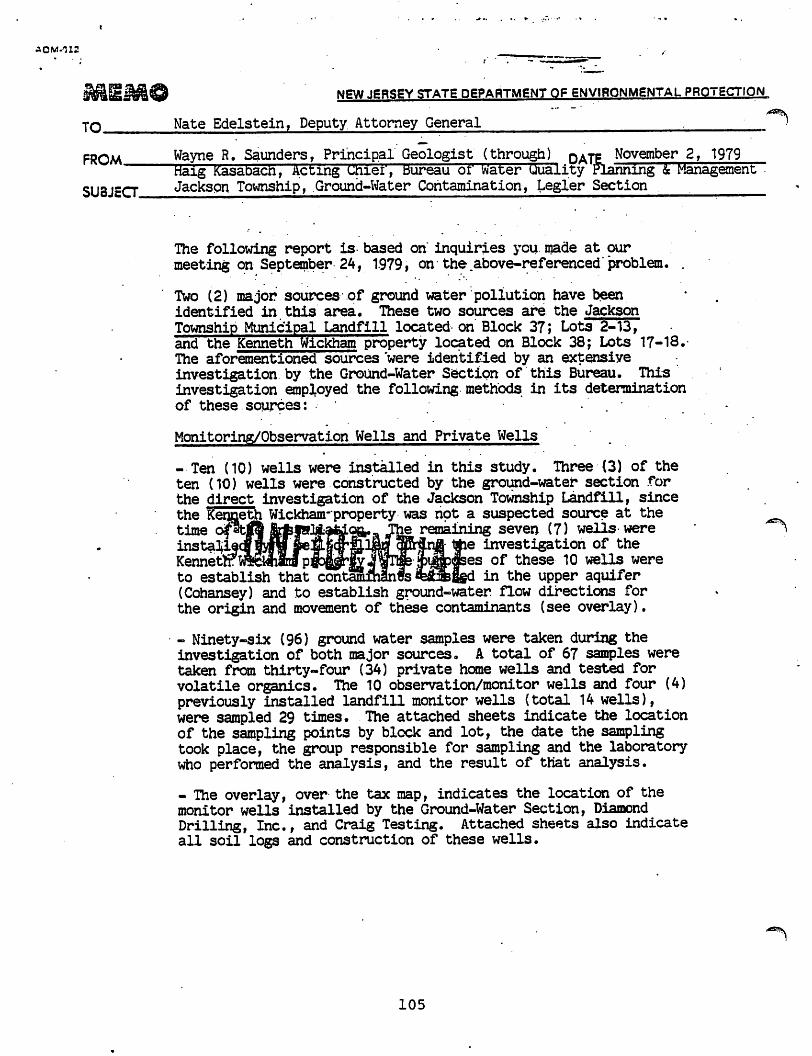
NEW JERSEY STATE DEPARTMENT OF ENVIRONMENTAL PROTECTION
TO Nate Edelstein, Deputy Attorney General .. )
FROM
SUBJECT.
Wayne R. Saunders, Principal Geologist (through) DATE. November 2y 1979 Haig Kasabacn, Acting uiiet, bureau of water uuaiity Planning & Management Jackson Township, Ground-Water Contamination, Legler Section
The following report is based on" inquiries you made at our meeting on September 24, 1979, on the .above-referenced" problem. .
Two (2) major sources of ground water pollution have been identified in this area. These two sources are the Jackson
Township Municipal Landfill located on Block 37; Lots 2-13,
and the Kenneth Wickham property located on Block 38; Lots 17-18.
The aforementioned sources were identified by an extensive
investigation by the Ground-Water Section of this Bureau. This
investigation employed the following methods in its determination
of these sources: • . .
Monitoring/Observation Wells and Private Wells
-Ten (10) wells were installed in this study. Three (3) of the ten (10) wells were constructed by the ground-water section for the direct investigation of the Jackson Township Landfill, since
the Kenneth Wickhanrproperty was hot a suspected source at the
time of«t|8 &t|sIAak.oft., The remaining seven (7) wells were insta3jl9O|fylir|«&§<Jf fPm3^Jnj| fye investigation of the KermetftrW«4«8ap3o|Jr^ of these 10 wells were to establish that contaminants 4l5fcd in the upper aquifer (Cohansey) and to establish ground-water flow directions for the origin and movement of these contaminants (see overlay).
- Ninety-six (96) ground water samples were taken during the
investigation of both major sources« A total of 67 samples were
taken from thirty-four (34) private home wells and tested for
volatile organics. The 10 observation/monitor wells and four (4)
previously installed landfill monitor wells (total 14 wells), were sampled 29 times. The attached sheets indicate the location of the sampling points by block and lot, the date the sampling
took place, the group responsible for sampling and the laboratory
who performed the analysis, and the result of that analysis.
- The overlay, over the tax map, indicates the location of the
monitor wells installed by the Ground-Water Section, Diamond Drilling, Inc., and Craig Testing. Attached sheets also indicate
all soil logs and construction of these wells.
105
/$,
- The ten (10) observation/monitoring wells were surveyed by the Bureau of Geology and Topography to ascertain their elevation for the water table map. Two (2) wells, Monitor Well #3 and Landfill Well #3, were surveyed by the Ground-Water Section of the Bureau of Water Quality Planning and Management. Water levels from the wells were taken by the Ground-Water Section and a contour map
constructed (see overlay). . ' . . . -
- A survey- resistivity survey was initiated in the Legler section to ascertain the viability of this geophysical method for delinea tion of a contaminated area. The basic principal of surface re sistivity is to place an electrical: current through the subsurface and measure, the resistance of the current to flow through the subsurface. The current movement is dependent-on the amount of free ions in.the saturated zone (i.e. clays, low resistance; clean sand and-gravels, high resistance). Varying depths of exploration may be achieved using, different electrode configurations.
The organic contaminants which were found in the landfill monitor ing wells, showed:that the organic chemicals exhibited electrical properties of high resistance, relative to the "natural" (clean) ground water in the area. It was assumed that these contaminants would be in the upBenrfcrtion of the shallow aquifer and would
travel in a plume :thi * 3 i
The resistivity survey' wasJs4M(*j^|ih|l|iSfill, parallel to ine resis&ivx&y survey vws suwcwvw y»*»».y^y*?-***"»—i r— ———— ~~
the assumed ground water flow direction. THese"first measurements exhibited extremely high resistance, as anticipated. (Measurements were attempted on the landfill itself, but the extremely clean, dry material acted as an insulator and would not conduct a current.) A resistivity profile was started on Lakehurst Avenue (see overlay) near Ollie Burke Road and proceeded in a southeasterly direction approximately £ mile past the entrance of the landfill. This pro file revealed that areas of higher resistance occurred just past the Kenneth Wickham property and the landfill entrance. As the profile proceeded toward the southeast, the resistivity readings became significantly lower, therefore, the assumption was made that the ground water in this area was significantly less contaminated
or even clean.
Another resistivity profile was run on Route 571. This profile re vealed that very little change in resistance took place throughout the survey. Readings in the area of the McCarthy and White homes were only slightly higher than the surrounding readings of that profile which may indicate that the contaminant concentration levels have decreased due to the dilution within the aquifer.
Additional surveys were conducted in other areas of the Legler Section (see overlay). These surveys did not reveal any additional
zones of contamination.-
106
- Aerial photographs of the area were examined and- revealed no
obvious areas of pollution. -
- USGS quadrangles (Lakehurst/Cassville) and State Atlas sheets
#28 and 29, showed that the area where the landfill and Wickham
properties are located are within three (3) water sheds. One -.-
drainage area is. north, toward the Long Brook (FW-1) and Maple
Root Branch of the Toms River. The other drainage areas to the
south are controlled by the Ridgeway Branch and an unnamed tributary
to the Ridgeway, which at one time.extended within the landfill area.
The aforementioned watersheds are shown on the attached map (copy
of USGS quadrangel). / ■ • ■ '
Identification of Source(sj: • ../
- The landfill became ah immediate.suspect due to the fact that
since 1972, it had accepted large volumes of septage, and the area
which is used: for disposal was a former mining area (Glidden Corp.). The former mining operation had used a dredging technique where
ilmenite, a titanium bearing mineral, was removed from both above
and below the water table. Included in this removal, was all fines (silts, and.clays, peat?}. The fines, ilmenite and. heavy minerals
were separated from.tiie parent material and the clean quartz sand
was returned to t^.^&yatl8iir) Tfcepegera, ̂ -iguid waste material deposited had a cJiT^P.tt!94t-^^^<3^'.J':3f tpwitjirated zone to the . water table with little ■bl r»i*r^i^c§.a prangs submitted by the township engineer (Ernst, Ernst and Lissiden, Tfecember TO, 1972) to the Solid Waste Administration (SWA) show that intervening
clay layers did exist prior to mining operations-, which do not exist at the present or at the time-of landfilling operations. As data
was collected from the various wells, the analyses were shown to
Dr. Robert Tucker of the Toxic Substances Program. Dr. Tucker notified the Jackson Township Health Department that residents (in the delineated area) should not consume the water and to limit skin
exposure (bathing).
The area for non-use of the shallow aquifer for potable purposes
was defined by using existing surface water boundaries. The entire landfill site was taken into account as the source. Since the land
fill is situated on a drainage divide the area bounded by the Maple
Root, Long Brook and Ridgeway Branch, were used as boundaries to the north, west and south. The unnamed tributary and the mining operation area was used toward the east. The boundary was later extended to the east along the entrance road to the old Glidden opera
tion. This was due to the fact that the Glidden wells were proposed
as a potable water source for the Legler section and it was felt that since the supply line would be adjacent to these homes that they should be included in the potable water system. The assumption was that the surface water would act as a barrier to the contaminants in the water
table which would not flow underneath these streams from the.landfill.
107
/
- The Kenneth Wickham property became involved as another major source
when Mr. Wickham allegedly- dumped wastes on his property at 11:50 PM
on March 1, 1979. A .sample .taken from. Mr. .Wickhara's tank truck by Robert Gogatz, Health Officer, was taken.to the N.J* Department of. Health
for analysis with the following results: . .
Sample #£''11436 ■ Benzene . .67 ppb Toluene. " 40 ppb .
. . ... . Xylene ' .50 ppb. . . • • Butyl-Benzene \20 ppm (off scale)
• ■ . 3-unknown peaks . . ■
On March 8, 1979, this unit investigated the Wickham property, as re
quested by the Office of Hazardous Substance Control. The results of • that investigation are documented in the file. . '. . - •
The site (shown on overlay) was an illegal dump and analyses of the material found- in the excavation by the State Health Department is also documented in the files (see attached memo). The Wickham property
was identified as a major source for contaminants, with the .contaminants continuing to pollute the groundwater.
OTHER SOURCES: . ^ . . . •
- When the two (2) niajor«i««i@M<^lp^iS ̂l<fictain| were identified and the geohydrologic daijp lra|ftje» ScftBi^ifj^om^CTeals vihxcb. were not in the ground water flow^.r^t^rl ol ■ ISeii JrMf Jl JI IHiickham property showed contamination. Therefore, other sources of contamination were
thought to exist. These other possible (minor) sources are as follows:
1) The Jackson Estates (Trajilgjjgnj^- this site has a package treatment plant. The^netno^ofdisposal of treated wastewater is through rapid infiltration beds. (Analysis of Observation Well #5 showed that chloroform existed in the ground water. This chloroform may be due to excessive chlorination of the wastewater.)
2) Promiscuous dumoinj^- when the Jackson Township Municipal Land-
ffflTDeganliiKtingits intake of liquid wastes to 20,000 gallons daily, many haulers were not permitted to use the landfill. These
haulers may have dumped on the many roads in the area. The area was sparsely populated until recently and illegal dumping could
go almost undetected. Residents have noticed numerous tank trucks
throughout the area over a period of years.
. An. example of this problem is that homes located on Bowman Road have (Cole, Cope) had their wells analyzed and have shown various
levels of contamination (see attached sheets). These wells are
not influenced by the two (2) major sources, since ground water
flow direction is away from this area (Bowman Road). This leads
us to suspect .that illegal dumping has taken place in the area at some time. No surface evidence was noticed in regard to illegal
dumping.
108
3) Septic Systems - Except.fop-Jackson Estates and Maple Glenn
EstatesTtnere is no public sewer system in the Legler Section of the township. Private residents employ individual subsur
face disposal systems for treatment of their wastes. Since
the disposal systems rely on the soil medium for treatment,
' the soil matrix becomes clogged, over a period of time if the property septic tank maintenance procedures are not followed.
Individuals will then employ different types of septic system
cleaners to alleviate this problem. These cleaners contain -
different organic chemicals (degreasers). I have enclosed two
reports entitled -"Control of Organic Chemical Contaminants in
Underground Source of Drinking Water, Nassau County, New York", and "Report on Survey of Consumer Products Containing, or Sus pected of Containing Harmful Organic Chemicals and Having the
Potential of Contaminating the Grdundwater of Nassau County,
New York". These two reports indicate that many of the con taminants found in the ground water in the Legler section at
Jackson are contained in several solvent type septic system .
cleaners. These organic chemicals are transmitted to the ground water via the septic system and will, also be present within the
septic tank. As the septic tank cleaner/hauler pumps out the septage, these organic chemicals will be transported to the disposal area, either a licensed landfill or illegal discharge
point. The Legler section tepdAbpfi]! &hjk Ackson Township Land-
contaminant|/lupf^^tlSi^sSwfttlrjarl^from septic system cleaners. Vfv^m&ieneaa. list* of the organic chemicals found in this area with their toxic levels, where applicable,
and their origins and uses.
CONCLUSIONS:
The two" (2) major sources of ground-water contamination in the Legler
section of Jackson Township are:
1) Jackson Township Municipal Landfill
2) Kenneth Wickham Property
Some of the organic chemicals were introduced into the landfill by septage haulers, who dumped septage containing degreasing agents and/or household products. Other chemicals may have been brought in illegally by haulers under the guise of septage.
- The Kenneth Wickham property is an illegal landfill (dump). Many of the liquid materials found on this property are trapped above the water table. The liquid materials contain organic chemicals which are harmful to humans. These materials are in contact with the ground
water.
•- The major ground water flow component rom the landfill and the ?
Wickham property is toward the southeast.
109
V
- Minor sources of contamination^exist in the area,* with individual
septic systems a likely suspect. Other suspects are the Jackson
Estates Trailer Park and promiscuous dumping.
- The geology of the area dictates that the upper aquifer, approxi
mately 65 - 80 feet in thickness, cannot be used for potable purposes.
The next viable (production and potability) aquifer for potable :
purposes is the Mt. Laurel Formation, wh^Lch is approximately
340 feet deep. . ; • : " ' ...
- The landfill area has- been, reworked by mining operations and
contains only clean sands and gravels to the ground water table.
This material has little or no rennovative capacity.
• • RECOMMENDATIONS:' . - ' .. ' •• ■ ' • •' ' " ' -. ' . • '
1). A public supply water system should be installed in the delineated area. (The Jackson Township Municipal Authority has proposed to use
the Glidden Wells, which are 1600 feet deep in the Magothy-Raritan
Formation.) The overlying geology (various formations of clay, marl
or sands) would prevent contamination of these wells from the water or sands) ul p table (•Cohansey) in this area. The individual potable wells should
be sealed to prevent their; jjs.fi> <*• %\'i i\ 'A k i
ETS. Many remedial (clean-up) actions are possible at this site*
These actions range from doing nothing at all, to an entire
decontamination of the aquifer. Since the spectrum of measures
is very broad, I will attempt to discuss major points only:
a) Aquifer Decontamination/Containment
To ascertain what clean-up or containment measures should
be taken, a complete geohydrologic study would have to be undertaken. A study of this magnitude would be best per
formed by a private consultant due to the fact that the
Ground-Water Section does not have the manpower to devote
itself to this case for such an in-depth study. The Ground
Water Section would review any data and recommendations
developed by the consultant. The feasibility study would
entail the following:
1) Measurement of Aquifer Properties
a) hydraulic conductivity
b) transmissivity
c) specific yield
d) storage coefficient
110
2) Flow-System Analysis
a) movement of the contaminant
b) infiltration rate c) surface water interaction
d) saturated and unsaturated flow
This study would entail the installation of large capacity wells (6 - 8") and the performance of several, pump tests. Additional
observation wells- may have to be installed to.perform these
tests. An estimated cost of $150,000.00 would be needed to
perform such a study by a consultant.. This data would then be
integrated with any clean-up of the ground water, such as the number of wells -needed to stop the flow of the contaminant from" the major sources and the proper treatment of the contaminant.
Advantages: This program would devoid the aquifer of most of. the. contaminants and possibly make the aquifer usable
•for potable purposes.
Disadvantages; The cost for such a project could go to the millions
of dollars. The treatment of these contaminants is
unknown by this office. A treatment plan would have
to be built on site to take care of these contaminants
and operate on a 24-hour basis. • ——. M M ■ • ■
_^. ~ ,«.,» • i v. fl r«B B B B . •
!fft>r; the pumpatasi\wf>uld have to be dis-,* »•* •- -^^sisLj£A|^stem neapby> this
)
Since the contaminants appear to be volatile, part of the treatment may be spraying of the wastewater into the
atmosphere. This could cause a major air pollution problem (see attached sheets on contaminants).
CONTAINMENT:
The two (2) major sources could be contained by the use of a cut off wall and covering with an impervious cover. Since the upper
clay layer was removed in the Glidden mining operation, it would
necessitate that the cut-off wall be constructed to a depth of 65 - 80 feet to the Kirwood Formation. This wall would contain
the organics for either treatment or for non-movement.
Advantages: The contaminants would be contained and movement of the contaminants within the aquifer would be almost nil.
The aquifer (where the potable wells are located) would
clean itself naturally. (The contaminants outside the
containment wall would move through the aquifer to the
surface water bodies.) This would speed-up the process
of having the aquifer returned to potable levels since
the source(s) would be cut-off. . )
111
/F
; The cost of
still be. present
■ 112
Recommendations:' • .
The aforementioned remedial actions appear either to be.very
costly or condoning pollution of a viable aquifer. . It is the opinion of; this section that the following minimal action be taken as a first step: .-.."!'.■••
. The landfill, should be thoroughly, investigated- by the • installation of large diameter monitoring wells within the landfill (these wells- may later be used for the extraction of contaminated ground water). These wells would be used to.determine.the exact location and amount of contaminated gr.ound" water at ..the landfill. Grab sampling at strategic depths1 would:; determine "thickness11 of the grossly contaminated- ground water, ;and the wells would also determine the aerial extent of the contaminants. . Additional steps of curtailing the source could be. determined after the amount was determined,,
The Wickham property should be excavated and the contam inated material above the ground table removed. A well should be placed on this property to ascertain its rela tive involvement in the ground-water contamination problem.
This recommendation should be carried out by a private consultant
with data reviewed by this office.' "
The most important aspect is that the public water supply system be constructed immediately for. the health and safety of the
affected people.
113