Embed Size (px)
Citation preview

Jaekwan Shim, Yoon-Jeong Hwang, Yeon-Hee Kim, Kwan-Young Chung
Forecast Research Division,
National Institute of Meteorological Research, KMA
The Experiments of Sensitivity test with 2012 winter special observation data using WRF
model
2012 THORPEX-Asia Workshop

Page 2
Background
West SeaObservation points
of Central area
Observation points
of east coast line
Observation targets
• Observe the weather elements using KMA ground-
based
observation network
• Observe the weather elements over the sea using
Gisang1
• Observe the precipitation and cloud vertical structure
using Radio-sonde and wind-profiler, Radiometeor
The special observation has performed for two years
around
middle area in south Korea
Expectation of bservation effects − initial condition Improve the initial field by assimilation scheme using obs data − cycle run Reduce the forecast error (first guess) by adding observation data continuously − location Verify the optimal locations of Observation that are sensitive to the predictibility

Page 3
INC BOS BOSINCCNTL
Looks like Similar initial conditions for each observation It can make differences in 48-h forecasts!
Background
00 fcst
48fcst

Page 4
Objective
Sensitivity Analysis − Evaluating how observation data affects a forecast − Location for which additional observations may reduce errors or improve the forecast
evaluate the initial increments translated downstream
investigation of observation location are sensitive to the forecast
the precipitation forecast is investigated.

Page 5
Cases
The selected case is the developing cyclone while passing the West sea and Korean peninsula
the cold front was formed over the south korea on 31 January 2012. The relatively plenty of snow fall is recorded along cold front.
The stream line and moisture flux flowed in Korean peninsula between the Siberia high and north Pacific high at least for 24 hours.
1200UTC 31 JAN 20121200UTC 31 JAN 2012
Page 6
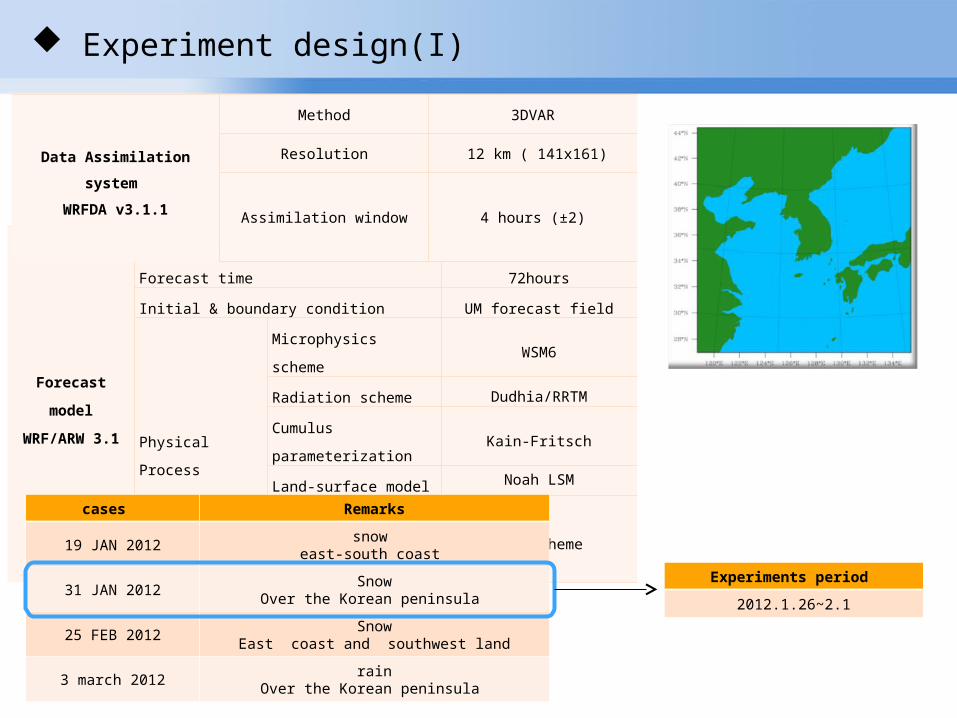
Experiment design(I)
Forecast
model
WRF/ARW 3.1
Resolution 12 km (141 x 161)
Forecast time 72hours
Initial & boundary condition UM forecast field
Physical Process
Microphysics scheme WSM6
Radiation scheme Dudhia/RRTM
Cumulus
parameterizationKain-Fritsch
Land-surface model Noah LSM
PBL scheme YSU Scheme
Data Assimilation
system
WRFDA v3.1.1
Method 3DVAR
Resolution 12 km ( 141x161)
Assimilation window 4 hours (±2)
cases Remarks
19 JAN 2012snow
east-south coast
31 JAN 2012Snow
Over the Korean peninsula
25 FEB 2012Snow
East coast and southwest land
3 march 2012rain
Over the Korean peninsula
Experiments period
2012.1.26~2.1

Page 7
3DVAR data assimilation3DVAR data assimilation
0000 0606 1212 1818 2424UTCUTC
CYCLE run
72-h forecast
72-h forecast
3030 3636
72-h forecast
Experiments Remarks
CNTL Operational observation data (GTS)
INC CNTL + Incheon OBS
BOS CNTL + Boseong OBS
BOSINC CNTL + Incheon + Boseong
Experiment design (II)

Page 8
Increments (A-B) on 0600UTC 26 JAN 2012Increments (A-B) on 0600UTC 26 JAN 2012INC BOS BOSINCCNTL
Increments (A-B) on 1200UTC 26 JAN 2012Increments (A-B) on 1200UTC 26 JAN 2012
Sensitivity Experiment : ResultsSensitivity Experiment : Results

Page 9
Increments (A-B) on 1200UTC 30 JAN 2012Increments (A-B) on 1200UTC 30 JAN 2012
Increments (A-B) on 1200UTC 31 JAN 2012Increments (A-B) on 1200UTC 31 JAN 2012
INC BOS BOSINCCNTL
Sensitivity Experiment : ResultsSensitivity Experiment : Results

Page 10
CNTCNTLL
AWSAWS Difference (experiments-Difference (experiments-CNTL)CNTL)
12 hr accumulated precipitation and difference (1200UTC 31 12 hr accumulated precipitation and difference (1200UTC 31 JAN 2012)JAN 2012)
BOSBOSINCINC BOSINBOSINCC
TMPTMPAA
Sensitivity Experiment : ResultsSensitivity Experiment : Results

Page 11
Difference of 850 hPa Mixing ratio (exp-ctl) on 0600 UTC 31 JAN 2012 at 12hr fcst
Difference of 850 hPa Mixing ratio (exp-ctl) on 0600 UTC 31 JAN 2012 at initial
Sensitivity Experiment : ResultsSensitivity Experiment : Results
Exps - CTN

Page 12
F00
F12
F24
BOSINC BOSINC
Sensitivity Experiment : ResultsSensitivity Experiment : Results
Increments of 850 relative humidity
850 wind vectors

Page 13
Increments of 500 height from -6 to 6
850 equivalent potentialTemperature
BOSINC BOSINC
Sensitivity Experiment : ResultsSensitivity Experiment : Results
F00
F12
F24

Page 14
Exp. BOS INC BOS+INC
rate (2.5 mm)
34% 1% 27%
2.5mm/12hr ETS (2012012600~2012020118)
12hr ETS (2012013112)
Sensitivity Experiment : ResultsSensitivity Experiment : Results
ETS for 12 hours accumulated prec. On 31 ETS for 12 hours accumulated prec. On 31 January 2012January 2012

Page 15
Geopotential height Temperature
At low altitude, RMSE of height of all experiments show small difference. Otherwise, CNTL and INC have the largest RMSE than BOS and BOSINC
at upper altitude. RMSE of temperature is similar with RMSE of height except for low levels. The observation data of Boseong reduced the RMSE in this case.
RMSE of height and Temperature
Sensitivity Experiment : ResultsSensitivity Experiment : Results

observation data is used to identify sensitivity regions of winter 2012 over south Korea. Sensitivity test is conducted using two points of observation data
initial increments in experiments were introduced near the observing points.
These increments damped as they translated downstream.
Predictability of BOS and BOSINC are better than INC and CNTL(noDA).
The moisture adjustment contribute the improvement of predictability
To improve predictability of south Korea, observation of the south is important in land. If supplementary observation is needed, it must be conducted over the south of the Korean Peninsula.
Summary and Conclusion