Embed Size (px)
Citation preview

SECTOR PLAN
2009 - 2030
WATER

1
VISION 2030 JAMAICA: NATIONAL DEVELOPMENT PLAN
WATER SECTOR PLAN
Prepared by the Water Task Force
June 2009

2
Table of Contents
Page Numbers
List of Acronyms
Chapter 1: Setting the Context 3
Chapter 2: Situational Analysis 6
Chapter 3: SWOT Analysis of the Water Sector 34
Chapter 4: Strategic Vision and Planning Framework 35
Water Indicators and Targets 37
Chapter 5: Implementation Framework and Action Plan 38
Long Term Action Plan 2009 – 2030 41

3
Introduction Water is the most important and probably the most widely known substance on earth. The
availability of and access to water are basic aspects of human existence. Approximately
70% of the Earth’s surface is covered by water however, only 2.5% is freshwater. Of this
only a fraction, approximately less than 1% is accessible groundwater or surface water
available for drinking. Ultimately, the freshwater available to a region depends upon the
amounts of rainfall, local hydrology and the geology of a given area.
Freshwater is available for our use from two sources. Water that collects on the surface of
the Earth in rivers and streams is referred to as surface water, while water that collects
beneath the ground is called groundwater. Worldwide, groundwater is 40 times more
abundant than fresh water, and is the primary source of drinking water for most people in
the world.1 And although groundwater is a renewable resource, its reserves replenish
relatively slowly.
About 2 billion people, approximately one-third of the world’s population, depend on
groundwater supplies, withdrawing about 20 percent of global water (600- 700 km3)
annually — much of it from shallow aquifers (UNDP and others 2000). Many rural
dwellers depend entirely on groundwater.
On a global average, drinking and sanitation require approximately 10 percent of the
fresh water supplies, while industry, recreation, and other uses comprise about 20
percent. Irrigation, which accounts for 70 percent of all the water extracted from rivers,
lakes, and aquifers, is by far the most intensive use of the world’s fresh water resources.
In certain countries, especially in sub-Saharan and Sahelian Africa, irrigation comprises
90 percent of the water uses.2
1 “Groundwater & Surface Water Backgrounder,” <http://www.lehigh.edu >
2 Svadlenka, Robert, op cit.
Chapter 1: Setting the Context

4
The availability of and access to freshwater are basic aspects of human existence.
According to Chapter 18 of Agenda 21 “all social and economic activities rely heavily
on the supply and quality of freshwater.” A limited resource with no substitute, water
affects food supply, health, habitats, hygiene, transportation, climate, energy supplies,
and industry. Poor water management can lead to disease, malnutrition, reduced
economic growth, social instability, and war. Therefore, the conservation and proper use
of freshwater are fundamental in order to assure the continuance of life on our planet.
This Sector Plan for Water is premised on a vision shared by key stakeholders in the
water sector (both in the public and private), and state the important roles they
collectively have to play in shaping the planning process to 2030.
Vision 2030 Sector Plan Planning Process
It is one of twenty-eight chapters that would form the foundation for the development of
Jamaica 2030 – a 25-year plan designed to put Jamaica in a position to achieve developed
country status by 2030. Jamaica 2030 is based on a fundamental vision Jamaica, the
place of choice to raise families, live, work and do business,’ and on guiding principles
which put ‘people’ at the centre of Jamaica’s transformation.
The preparation of the Plan is supported by a quantitative systems dynamics model –
Threshold 21 (T21) – which supports comprehensive, integrated planning that would
enable the consideration of a broad range of interconnected factors along economic,
social and environmental considerations and will be used to project future consequences
Figure – Worldwide Water Use
Source: http://www.unesco.org/science/waterday2000/water_use_in_the_world.htm

5
of different strategies across a whole range of indicators. In addition, it enables planners
to trace causes of changes in any variable or indicator back to the assumptions.
The sector plan was developed using the following processes:
Task Force Meetings3 workshops and working group meetings that were used to
solicit ideas and views from members4 on water issues and challenges facing
Jamaica , identify a vision for the water sector in Jamaica, and determine key
goals, outcomes strategies and actions for the sector from 2009 to 2030
Research on international best practices related to water that could be adopted in
the Jamaican context
Strategic meetings between the Chair of the Task Force, the technical secretaries
and the consultant of the PIOJ
This document is structured in the following chapters as follows:
Chapter 1: Setting the Context
Chapter 2: Situational Analysis
Chapter 3: SWOT Analysis
Chapter 4: Strategic Vision and Planning Framework for the Natural Resources &
Environmental Management and Hazard Risk Reduction and Climate Change
Sector Plans
Chapter 5: Implementation Framework and Action Plan for the Natural Resources
& Environmental Management and Hazard Risk Reduction & Climate Change
Sectors
Appendices
3 See Appendix 2 for Listing of Task Force Meetings
4 See Appendix 1 for List of Members of the Urban Planning and Regional Development Task Force

6
Situational Analysis – Brief Overview Rainfall is the sole source of water across Jamaica, yielding three basic water resource
types, namely:
Surface Water – rivers and streams;
Groundwater – wells and springs; and
Direct rainwater – evapotranspiration and rainwater harvesting,
Jamaica’s water resources are quite extensive and support diverse ecosystems. However,
despite having excellent and relatively abundant water sources, the areas of high water
demand are often far away from the required water resources. This is because the demand
for water and the exploitable water resources of the island are unevenly distributed, with
the greatest demand for water occurring in the south and most of the available water
being in the north. Seasonal variability of the rainfall is also high, creating additional
water supply problems. However, despite the uneven and
seasonal rainfall distribution, the water resources are
adequate to supply the needs of the island for the
foreseeable future. Yet, under the pressures of human
development, many of these waters have had to be
abandoned as sources of potable water, or are being
threatened by pollution for various sources.
Also, there is growing awareness and concern for the
issues and problems in the water sector, which threaten
the nation’s health and which demand considerable sums
for their resolution. Some of these issues include the
deterioration and malfunction of municipal supply and
sewage treatment infrastructure, management of
industrial and toxic waste and its effect on water
resources, rapidly increasing demand in water deficit
areas, and the adverse effects of deforestation.
Notwithstanding the above, Jamaica has made significant progress in providing water to
the population. Across the country as a whole, the percentage of households with piped
water has risen from 61% in 1990 and 71% in 2001 to 67.8% in 2006. Over the period
2001 to 2006, the percentage of households relying on water from standpipes decreased
Chapter 2: Situational Analysis

7
from 13.1% to 6.7%. Unfortunately though, the poorest quintile or the poorest 20% of the
population has not shared in many of the improvements, with 26.8% relying on the
outdoor private tap as their most important source of water, followed by indoor tap
(15.8%) and public standpipe (13.4%).
ECONOMIC, SOCIAL AND ENVIRONMENTAL ISSUES ASSOCIATED WITH
FRESHWATER MANAGEMENT
Jamaica’s Water Resource Types
Rainfall is the sole source of water across Jamaica, yielding three basic water resource
types, namely:
Surface Water – rivers and streams;
Groundwater – wells and springs; and,
Direct rainwater – evapotranspiration and harvested rainwater.
The water resource type is dependent on the hydrostratigraphy (type rocks) and the
classification as aquifers or aquicludes. The oldest rocks, the volcanics and
volcanoclastics, are impermeable and are classified as aquicludes (do not readily yield
water to wells and springs) and the water resource type is surface water. The limestones
of the White Limestone Group are permeable with a high degree of karstification that has
significantly increased permeability. They are classified as aquifers (readily yield water
to wells and springs) and the main water resource type is groundwater. Groundwater is
tapped by the drilling and construction of tube wells.
Agencies with Responsibilities
Since April 1996, the Water Resources Authority (WRA) has had responsibility for
regulation, control and management of the nation’s water resources. The National Water
Commission (NWC) on the other hand has responsibility for the public supply of
drinking water and sewage treatment. The NWC operates within the policy context of the
Government of Jamaica's goal of universal access to potable water by the year 2010 and
the establishment of sewerage systems in all major towns by 2020. The National
Irrigation Commission (NIC) has responsibility for the supply of water for agricultural
and irrigation uses while the Rural Water Supply Company has the responsibility for the
execution of small rural projects.
The Water Resources Act (1995) established the Water Resources authority (WRA) as the

8
sole agency with responsibility for the regulation of water resources availability,
including inter alia, the collection of water resources data (except rainfall), assessment,
allocation, planning and management. Its main instrument of control is the issue of well
drilling permits and abstraction licenses for both surface and ground water sources.
Nationally the provision of domestic water supply to the public is shared between the
following institutions: -
National Water Commission - Islandwide (urban and rural) by Statue
Parish Councils - Rural areas by Statute
GoJ Enterprises - Specific supply areas by License
Private Enterprises - Specific supply areas by License
ODPEM - Islandwide under conditions of disaster
The National Water Commission Act (1980) gave the NWC authority over the water
supply districts prescribed by the Minister under the National Water Authority Act (1963)
and those of the Kingston and St. Andrew Water Commission. However in practise the
NWC has interpreted its mandate to extend beyond those areas specified by Statute, to all
areas except those supplied by the Parish Councils.
The liberalisation of the Water Services Sub-sector to include the participation of Private
Enterprises as set out in the National Water Policy (1999) has resulted in housing
developers who develop their own water supply system to support their respective
housing developments opting to operate private water supply systems rather than handing
them over to the NWC, as was previously required. The OUR has licensed five such
private water utilities across the island – Four Rivers Ltd, Dairy Springs Ltd, Runaway
Bay Water Company, Can-Cara Environment Ltd and Dynamic Environmental
Management Ltd. Nationally the NWC Act (1980) authorizes the NWC to provide
sewerage services to areas specified by the Minister.
The National Irrigation Commission (NIC) is mandated by Statute to provide irrigation
water nationally. Across the island it operates the Rio Cobre, St. Dorothy, Mid-
Clarendon, Hounslow, Pedro Plains, Braco and Yallahs irrigation systems providing
irrigation to 8,222 and 4,562 ha of land on the St. Catherine and Clarendon Plains
respectively. The NIC is presently promoting the handover of these systems to Water

9
Users Associations (i.e. the farmers themselves). It also supplies untreated water to the
NWC for the Spanish Town Water Treatment Plant.
Several large farms operate their own well sources, irrigating 1,498 and 6,239 ha of land
in St. Catherine and Clarendon, respectively and also to supplement the water obtained
from the NIC whenever there is a shortfall in the public supply. Most of these large farms
are Government owned/operated (i.e. Caymanas Estate, Bernard Lodge Estate, Innswood
Estate and Frome/Monymusk) although there are large private farms with their own well
sources, such as the stud farms on the Grange Estate in St. Catherine and New Yarmouth
Estate in Clarendon.
Large scale industrial enterprises all provide their own independent water supply
services, including the bauxite/alumina plants at Halse Hall, Ewarton, Kirkvine and Nain;
the Red Stripe Brewery; Seprod Ltd; the sugar factories at Bernard Lodge, Worthy Park,
Appleton, Frome and Monymusk and the JPSCo. They all rely on ground or surface
water sources to meet their demend.
Water Supply
Reliable and safe yields5 of freshwater in Jamaica have been estimated at 4085 million
cubic metres per year, with groundwater accounting for 84 percent and surface water 16
percent. In 1999, 92 percent of the National Water Commission’s (NWC) annual water
production came from groundwater sources.6
Table - Exploitable Water Resources (Million cubic
metres per year)
Source: WRA [online], “Exploitable Water,”
www.wra-ja.org
Volume Percentage
Exploitable surface water
runoff (reliable yield) 666 16 %
5 The reliable yield or exploitable surface water is the daily water flow that is exceeded 90 percent of the time. The safe yield or
exploitable groundwater is the quantity of groundwater that can be withdrawn over a long period without impairing the aquifer as a
water source. WRA, [online], Glossary, <www.wra-ja.org> 6 STATIN and NEPA, 2002, Jamaica’s Environment 2001.

10
Table - Exploitable Water Resources (Million cubic
metres per year)
Source: WRA [online], “Exploitable Water,”
www.wra-ja.org
Volume Percentage
Exploitable groundwater
(safe yield) 3,419 84 %
Total exploitable water 4,085 100 %
Present production from both ground and surface water resources totals 920 million cubic
metres per year – 22.5 percent of the current reliable safe yield. This leaves a balance of
3163 million cubic metres per year (over 77 percent of the total) available for
development.
The Demand for Water
Worldwide, 54 percent of the annual available freshwater is being used.7 If consumption
per person remains steady, by 2025 the demand for water could be 70 percent of the total
water available because of population growth alone. However if per capita consumption
reaches the level of more developed countries, water demand could be 90 percent of the
available water by 2025, making the supply of this vital resource a problem. It is
imperative that water conservation be implemented as a matter of priority.
As populations and economic activities grow, many countries are rapidly reaching
conditions of water scarcity.8 Water scare countries have fewer than 1,000 cubic metres
per year and at this level, there may not be enough water to provide adequate food.9
Global population has tripled over the past 70 years and water consumption has grown
six-fold because of industrial development and increased irrigation.
For example, in 2000, more than 8 percent of the world’s population was living in
countries affected by water stress or scarcity. It is expected that by 2050, over 45 percent
of the global population will be living in countries that cannot meet the requirement of 50
7 Brown, et al., The State of the World Population 2001.
8 Water stress is defined as areas where water consumption is more than 10 percent of renewable freshwater resources. Mayell, op.
cit. 9 Brown, et al., op. cit.

11
litres of water per person per day to meet basic human needs. Thus, population size and
growth rate, as well as its consumption patterns, will determine the onset and severity of
water scarcity.
In Jamaica 75 percent of the total volume of water currently produced is used for
agricultural purposes, with 17 percent being used for domestic consumption.
Table - Estimated Water Use in Jamaica (Million cubic
metres per year)
Source: WRA [online], “Water Use (Present & Future),”
www.wra-ja.org
Sectors Present
(1990)
Future
(2015)
% Change
Non-agricultural 231 (25%) 346 (21%) 50%
Agricultural 682 (75%) 1,338 (79 %) 96%
TOTAL 913 (100%) 1,684 (100%) 85%
New water required for the year 2015 has been estimated at 790 million cubic metres per
year by the Water Resources Authority (WRA). Of this total, 172 million cubic metres is
required for non-agricultural purposes and 618 million cubic metres for agricultural
purposes. Though water demand for domestic and commercial purposes is rising, the
expansion of the water supply is occurring at a slower rate.
If the above predictions hold true, Jamaica would be using over 41 percent of its reliable
safe yield of freshwater in 12 years, meaning that an additional 20 percent of current
water sources would need to be developed to meet this demand. In essence, the utilities
would have to almost double the amount of water that is supplied between 2003 and
2015.
Problems Affecting Water Availability
Several problems affect water availability in Jamaica. First, the levels of non-revenue
water are high due to aging infrastructure and the under metering for 15 percent of the

12
population, who therefore have no incentive to conserve water or repair internal leaks.10
While the NWC has a programme to discover the destination of water that is normally
listed as non-revenue water (NRW), NRW still stands at 60 percent of the total amount of
water distributed.11
Second, there is inadequate storage capacity in many parishes to increase the reliable
yield and to ensure that there are sufficient supplies of water during the dry season. For
example, in St. Mary, the absence of raw water storage makes the entire output
susceptible to wide fluctuations during the year.
Third, the infrastructure to move water to the areas where it is needed is inadequate in
some parts of the country. For example:
In Trelawny, inadequate transfer facilities to sections of the parish result in these
areas being poorly served; and,
In St. Ann, the level of service outside of the parish capital varies markedly as a
result of the inadequacy of source and transmission facilities.
Significant investment and operational improvements are needed in these areas.
Urban Water and Sewage
The National Water Commission is responsible for urban water supply throughout the
island. It is also the largest provider of sewerage services. Other major sewerage
providers include the Urban Development Corporation, and private and public housing
developers. The great majority of urban residents have access to safe piped potable water.
In the KMA around 97% of households have piped water, and in other towns 79% of
households have this facility.
While coverage is good, reliability of supply to urban households and industrial users is
often erratic. As stated in the introduction, sufficient water exists on the island to meet all
water demands, but the water resources are not necessarily located close to the major
centers of water demand. The infrastructure to move the water to the areas where it is
needed is absent or inadequate.
10
National Water Commission [online], “Water Distribution,” <http://www.nwcjamaica.com > 11
Ministry of Water and Housing [online], <http://www.mwh.gov.jm>

13
Sanitation services exist in most major urban areas, and are being improved. In the KMA,
92% of households have flush toilets, while in other towns 60% of households have this
facility. In the KMA, 60% (check this figure) of households are linked to sewer systems,
while in other towns the figure is 11% (check this as not many towns have a sewer
system). The great majority of urban households without flush toilets use pit latrines.
While sanitation services has increased significantly in recent years, it is less extensive
than the coverage of water services. Sewage disposal practices are also often inadequate.
Significant investments and operational improvements are needed in this area.
The average household in the KMA spends 1.9% of its income on water services, while
in other towns the figure is 2.3%. For most households, their expenditure on water is
about half their expenditure on electricity.
Rural Water & Sewage
In rural areas, 39% of households have piped water. A quarter of rural households get
water from stand-pipes, and 22% use rain-water tanks. Eight percent of rural households
obtain water from rivers, streams and ponds. Of those rural households which rely on
standpipes, more than half have to travel over 50 yards, and 13% need to go more than
1000 yards. The NWC and the Parish Councils trucks water to its customers when
systems breakdown or supply is intermittent. Both parties contract with the Rapid
Response Unit of the Ministry of Water and Housing which provides the trucks and
water.
Sewerage is not generally provided in rural areas, except in housing developments. In
total, 9% of rural households are connected to a sewer system. The percentage of rural
households with flush toilets has increased from 28% in 1990 to 31% in 1991. The
commonest form of rural sanitation is the pit latrine, used by 68% of rural households.
Septic tanks, pit latrines and other types of onsite sanitation systems can be effective and
safe. However if not constructed, used and maintained properly they can pose a threat to
health and the quality of ground and surface waters.
Lower population densities mean that the cost of water provision in rural areas is often
higher than in urban areas, while lower incomes in many rural areas make it hard for

14
some customers to meet the full cost of high quality services.
Threats to Freshwater Resources
Water is not only becoming scarce because of increased demand, but also because of
higher pollution levels and habitat degradation. Global freshwater resources are
threatened by various factors, including:
Overexploitation
Poor Management
Watershed degradation
Pollution
The Water Resources Authority (WRA) reports that about 10 percent of the island’s
water resources has been lost as a result of pollution, saline intrusion (from
overexploitation), and watershed degradation.
Overexploitation
In many regions of the world, freshwater, both ground and surface water, is being used
faster than it can be replaced. In the United States, 400 million m3 of groundwater is
being removed from aquifers annually – about double the amount being replaced by
recharge from rainfall. In Spain, more than half of the nearly 100 aquifers are
overexploited.12 While water is a renewable resource, if exploited beyond its capacity to
replenish itself, future water availability may be jeopardized.
In Jamaica, water quality in some areas is compromised by excessive chloride levels due
to saltwater intrusion. The intrusion is caused by over-pumping in many wells,
particularly in coastal aquifers which are in direct hydraulic continuity with the sea.
Over-pumping from coastal aquifers in the Liguanea Plain and the lower reaches of the
Rio Cobre, Rio Minho, Black River and Montego River Basins has caused saltwater
intrusion both localized (upconing) and frontal. A number of wells in the Kingston area
have been shut down due to poor water quality resulting in high nitrates from sewage
infiltration from soakaway absorption pits
12 Mayell, Hillary 2003, “UN Highlights World Water Crisis,” <http://news.nationalgeographic.com/>

15
Poor Management13
“The water crisis is one of water governance, essentially caused by the ways in which we
mismanage water,” conclude the authors of the UN’s World Water Development Report
(WWDR). Freshwater resources are being squandered due to pollution and the way in
which water is used.
Water quality problems can often be as severe as those of water availability but less
attention has been paid to them, particularly in developing regions. Some two million
tonnes of waste per day are disposed of in receiving waters, including industrial wastes
and chemicals, human and agricultural wastes, according to the report. World Watch
Institute (WWI) estimates that every minute, 1.1 million litres (300,000 gallons) of raw
sewage are dumped into the Ganges River, the primary source of water for many Indians.
More than half of the world’s major rivers are “seriously depleted and polluted, degrading
and poisoning the surrounding ecosystems, threatening the health and livelihood of
people who depend on them” (World Commission on Water 1999).
Agriculture accounts for over 70 percent of world water consumption, and yet around 60
percent of the water used for irrigation is wasted, lost to leaky canals, evaporation, and
mismanagement. Fertilizer and pesticide residues from agricultural activities also
contribute to contamination of fresh water resources. In large cities of developing
countries, the percentage of non-revenue water is also very high, around 40 percent. Poor
water management has led to water availability and pollution problems, and can
jeopardize future water availability as much as overexploitation.
Pollution
The main sources of water pollution in Jamaica are:
Inadequate sewage disposal
Soil erosion
Agricultural and industrial discharges
13 ibid.

16
Ground and surface waters in Jamaica are generally of a high quality However mans
influence affects the quality of the water resources. Surface water is more susceptible to
contamination and is used to transport waste from industrial complexes and human
settlements.. The absence of sewage treatment facilities and the onsite disposal of wastes
lead to contamination of groundwater In some instances the sewage treatment facility
discharges the poorly treated waste into the river. Slightly less than two thirds (61.8
percent) of households have access to flush toilets; however, of this number, only 18.9
percent of these are linked to a sewer system12
About 33 percent of Jamaicans use pit latrines, this is about 4 percent lower than in 2000.
People building on flood plains using this disposal method increase the amount of waste
entering the stream. Generally, surface water quality is poor around and downstream of
industrial and populated centres. The nutrient-rich industrial and sewage effluent
encourages the growth of algae and other plants, and increases faecal coliform levels.
This is evident in the Black River which is contaminated by the discharge of dunder from
Appleton sugar factory and distillery.14
Ground water near soak-away pits may also have
high coliform levels. For example, several supply wells in the Liguanea Plain that
supplied water for Kingston have been abandoned due to nutrient (nitrate and phosphate)
contamination, which results from seepages from sewage soak-away pits
Soil Erosion and Siltation
Jamaica is divided into 26 watershed management units, each of which are being
degraded and are in critical condition to different extents. High erosion rates continue to
be experienced in 19 of the 26 watershed management units. In these degraded
watersheds, higher levels of soil erosion are experienced, increasing siltation and
turbidity, and reducing the quality of water.15
Jamaica continues to experience the direct
impacts of forest loss on water availability and quality. For example, siltation due to
reduced tree cover has caused storage losses of 85 million gallons (22 percent of reservoir
12 U.S. Army Corps of Engineers, 2001op. cit.
15 The function of trees/forests in maintaining water quality is discussed in “Freshwater Management – Economic, Social, and
Environmental Issues.”

17
capacity) in Kingston.16
Islandwide, about 10 out of the 15 reservoirs in the country are
significantly silted.17
Agricultural, Industrial, and Mining Discharges
Discharges from the agricultural, industrial, and mining sectors contribute significantly to
water pollution. Most of the industrial wastewater generated in Jamaica is from agro-
based industries – breweries, coffee and sugar processing, distilleries, dairy producers
and slaughterhouses. Effluent from these sources contains high concentrations of nitrates
and phosphates, which can cause eutrophication when discharged into surface water
bodies.18
These industries account for the generation of over 50 million m3 of wastewater
per annum.19
Table - Discharges to Water from Selected Economic Activities
Emissions and Discharges to Water Sectors
BO
D
Phosph
orus
Nitro
gen
Suspende
d particles
Chlorinat
ed
organic
compoun
ds
Oil and
fat
Metals Activity
Agriculture and Forestry
Fishing
Food, beverages, tobacco
Petroleum products
Cement, concrete
Mining and Quarrying
In terms of mining, the bauxite/alumina industry (the largest subsector) in the early days
of the industry disposed of residues, which contain caustic soda and sodium carbonate,
into mined out pits. The ponding of these caustic “red mud” wastes has leached sodium
16
PIOJ and STATIN, 2002, Jamaica Survey of Living Condition 2001. 17
U.S. Army Corps of Engineers, 2001, op. cit. 18
Eutrophication can be defined as the disruption of ecological processes caused by an excess of nutrients. 19
PIOJ and STATIN, 2002, Jamaica Survey of Living Condition 2001.

18
into the underground water system and has contaminated ground water resources. For
example, groundwater near Moneague and Nain has been contaminated by leachate from
red mud ponds used to store sodium-rich waste from bauxite refining20
However, new
attempts are being made to reduce the extent of contamination of underground and
surface water caused by these “mud lakes.” New thickened mud and dry stacking
disposal systems have led to reductions of sodium leaching to the water table and there
has been improvements in water quality around the bauxite/alumina plants
Watershed Degradation
Watershed conditions affect both the quantity and quality of underground and surface
water sources in Jamaica. Deforestation and increased turbidity of streams are a major
cause and indicator of watershed degradation. Deforestation originates from four major
actions: improper infrastructure development; charcoal burning; bauxite mining; and,
unsustainable agricultural practices. Natural forests are usually located within the upper
reaches of watersheds, therefore, loss of forest cover has had severe impacts on low-lying
areas resulting in an increase in sedimentation, rapid runoff, flooding and altering of river
courses. The rapid runoff reduces the infiltration into the aquifers leading to a reduction
in recharge and available water resources. Forest cover loss can also lead to reduced dry
season flow of many rivers, as is evident in some parishes in Jamaica.21
In recent years, deforestation has led to the deterioration of more than a third of Jamaica’s
watersheds, significantly affecting the ability to supply reliable and high quality water to
some towns across the island..
There is significant degradation of forests and watersheds in mining areas in the parishes
of Trelawny and St. Ann on the island’s north coast and St. Elizabeth, Manchester,
Clarendon, and St. Catherine on the south coast.
Freshwater Management
Freshwater management has four aspects:
20 ibid.
21 STATIN and NEPA. Jamaica’s Environment 2001.

19
Water Conservation – activities geared towards reducing water demand and
wastewater generation;
Pollution Prevention and Control – including the proper treatment and disposal of
potential water contaminants, regulating discharge of pollutants through the
issuance of permits, setting standards, etc.;
Integrated Watershed Management – protection of water resources by preventing
deforestation, soil erosion, etc; and,
Sustainable Abstraction – ensuring that production and agricultural practices are
sustainable.
Water Conservation
Due to the constantly increasing levels of water consumption and the requisite generation
of wastewater, for which wastewater treatment systems cannot be developed at a pace
consistent with its production, it is necessary to put in place water conservation measures
to complement the development and strengthening of present water management
practices. Water conservation can positively affect the economy, the environment, and
the society as a whole, including:
Reduced water demand – generally faster, cheaper, and easier than supply-side
programmes;
Water and wastewater treatment savings – reduces cost and defers plant
expansion and new source development costs;
Less environmental impact – due to less surface and subsurface withdrawals; and,
Sustained water quality – reduces groundwater contaminant intrusion and curtails
demand for new supplies that are of lower quality.
Pollution Prevention and Control
Pollution may make water unsuitable for human consumption, recreation, agriculture, and
industry and it may eventually diminish the aesthetic quality of lakes and rivers.
Contaminated water can destroy aquatic life and threaten human health. The
contamination of water resources may also affect economic activity by increasing the cost
of treating water and reducing the quality and quantity of water available for domestic,
agricultural and industrial use. By preventing and controlling water pollution, we can
ensure that we have clean water available to adequately support economic and social
activities of present and future generations, and sustain the natural environment.
Watershed Management
Watershed management is an iterative process of integrated decision-making regarding
sustainable uses and modifications of lands and waters within a watershed. It
20
encompasses the entire watershed system, and focuses on the processing of energy and
materials. Integrated watershed management must also address the sources of pollution
affecting the watershed and the practices within the watershed, such as farming, housing,
fertilizer and pesticide use, as well as all of the other stressors that adversely affect water
quality. While water conservation and pollution prevention and control may be done
independent of a watershed management plan, any integrated system of watershed
management must include these aspects.
Freshwater Management – Economic Issues
The availability of freshwater is a prerequisite for most socioeconomic development,
including agriculture, industry, infrastructure, aquaculture, and power generation. The
quality and quantity of freshwater available to a country affects the economy by affecting
water supply and treatment costs, public healthcare costs, and the viability of those
economic activities dependent upon freshwater, such as agriculture, food and beverage
processing, and tourism.
Commercial Uses of Freshwater
The availability of freshwater is a prerequisite for economic development and is
necessary for agriculture and industry – including food and beverage processing and
power generation. Water scarcity and pollution would adversely affect production and
productivity in all sectors of the Jamaican economy. Three major industries that stand to
lose heavily if water supplies become scarce or polluted are bauxite/alumina, agriculture
and tourism. The health industry also has to incur major costs as a result of treating
illness due to water pollution.
Importance to Industry
Industry, a category that includes energy production, uses approximately 21 percent of
the world’s freshwater for cooling, processing, cleaning, and removing industrial wastes.
Industries are inevitably affected by any decrease in water quality. This is manifested in a
change in productivity or output of activities that use environmental resources, resulting
from a change in environmental conditions or quality. Water scarcity and water pollution
would, therefore, adversely affect production and productivity in these industrial sectors.
21
Figure 2 – Sources of Water Contamination
Source: World Energy Council
Economic growth in territories such as China, India, and Indonesia is constrained by the
prevailing water conditions. For example, the impact of China’s dual problem of water
scarcity and water pollution exacts a costly toll on productivity. Water shortages in
China’s cities cause a loss of an estimated US$11.2 billion in industrial output each
year.22
Productivity losses of this magnitude can stifle an economy, and cost the society
more than implementing pollution prevention and water conservation measures.
Importance to Agriculture
Agriculture is the single largest user of freshwater resources in the world (see Figure
below). Globally, some 70 percent of all
water resources are used for agriculture, and
the bulk of global food production depends
on water. 23
However, over the next 30
years, water for agriculture will come under
increasing pressure from the highly
profitable household and industrial sectors,
which will increase their share in water
use.24
The value of world agricultural trade, including fishery and forestry products, has more
than doubled since 1980, reaching close to US$661 billion in 1995-99. The share of farm
products in merchandise trade has fallen over time and currently stands at about 12
percent at the world level. However, this average conceals the much greater dependence
on agricultural trade of many individual developing countries, both as exporters and as
importers. Given the important role of agriculture and trade in agricultural products for
many developing countries, proper management of freshwater resources is essential to
ensure the sustainability of agriculture, and thus the sustainability of many developing
economies.25
22
World Resources Institute, “ China’s Health and the Environment: Water Scarcity, Water Pollution, and Health,”
<http://www.wri.org> 23
The Right to Water, 2003. 24
“Water: Source of Food Security (WSFS): Enhancing Productivity of Water in Agriculture.” 25
FAO, 2002, “The State of Food and Agriculture 2002,” <http://www.fao.org>

22
In 2006, the Agriculture, Forestry, and Fishing sector of the economy accounted for 33
percent of Jamaica’s GDP.26
Agricultural use currently accounts for 75 percent of the
freshwater used in Jamaica, and is set to increase its use to 79 percent of the total by
2015. Any decrease in the quality and quantity of water available for this sector would
have serious adverse effects on the Jamaican economy. It is ironic that agriculture has
been a major culprit in the reduction of quality and quantity of the resource upon which it
is so dependent.
Fisheries
Both aquaculture and freshwater fisheries depend on a steady supply of high quality
freshwater to make them viable. These activities can only be sustained if there is an
adequate supply of clean water. Commercial fish farming in Jamaica has grown
significantly, producing more than 25,000 metric tonnes in 1997, three times the amount
landed from the sea. Aquaculture can only continue to increase if there is access to clean
freshwater.
At the same time, it has the potential to be a major pollutant of this essential commodity.
Aquaculture is on the increase and has grown significantly since it begun in Jamaica in
1976. It is a major consumer of freshwater. Nutrient rich effluent from aquaculture
facilities increases the potential for surface water pollution and eutrophication. However
wise use of the discharges from aquaculture ponds, such as for irrigation, can be
beneficial to agriculture by reducing the demand for freshwater and fertilizers.
Tourism
Many Caribbean islands are highly dependent on the tourism industry, which requires
reliable supplies of water for a number of purposes, such as golf courses, which absorb
considerable amounts. In Jamaica, the Hotels, Restaurants, and Clubs sub-sector
accounted for 11 percent of GDP in 2000. Many tourists are attracted to countries where
there is access to clean water for drinking and recreational/aesthetic purposes.
In addition, cruise ships may also favour ports where they have access to clean water. In
port cities and embarkation points throughout the Caribbean, there is a competition for
26
PIOJ, 2006, Economic and Social Survey Jamaica.

23
access to water resources. Cruise ships must use a large quantity of fresh water to process
wastes. The amount and availability of drinking water and water used in a sanitary
procedure to dispose of human waste could be a literal “drain” for some Caribbean
nations, especially those with more arid climates that are subject to periods of water
scarcity.
According to NWC, most cruise lines and cargo ships travelling the region only take
water in Jamaica because of the high quality standard. Letters of commendation on the
quality and availability of freshwater has been sent to the NWC by the shipping By
virtue of the quality and quantity of water that Jamaica possesses, we are in a better
position than many of our Caribbean counterparts to supply cruise ships with water.
However, it is only by keeping both the quality and quantity high that the cruise ship
industry in Jamaica can continue to compete successfully.
Healthcare Industry
The lack of adequate water and sanitation services has led to health problems in several
parts of the island, especially in the rural areas where water is sometimes drawn directly
from rivers and streams. Even worse, when these streams are the recipients of sewage and
other pollutants, the probability of the spread of disease is increased. Over twenty-five
thousand cases of gastroenteritis were reported in 2000, up from 16,369 cases in 1998.
There were also 289 cases of food-borne illness, up from 12 in the previous year.27
In St. Catherine, public health authorities have declared the Rio Cobre a health hazard.
Diseases such as gastroenteritis are on the increase in the parish because of the pollution
of the river. A growing number of people who live in the vicinity of the Rio Cobre are
being treated at health centres in the parish after drinking river water without boiling it
first. According to the Chief Public Health Inspector for the parish, Samuel Cameron, the
river is the only source of water for many residents.28
These water-related illnesses are costly to the Government as they are a burden on the
public healthcare sector. Jamaica currently spends roughly 3 percent of GDP on public
27 PIOJ and STATIN, 2002, Jamaica Survey of Living Condition 2001.
28 Jamaica Observer [online], 2001, “Rio Cobre Health Hazard,” <http://www.jamaica-gleaner.com>

24
healthcare.29
The incidence of these preventable illnesses can be minimized by providing
clean water and proper sanitation to the population, which would decrease the amount of
money spent in this area of the healthcare budget.
Water Supply and Treatment Costs
In many countries around the world, people get their water from water treatment
facilities, which are usually served by one or more sources. Due to a multiplicity of
factors, these sources may be at risk of contamination.
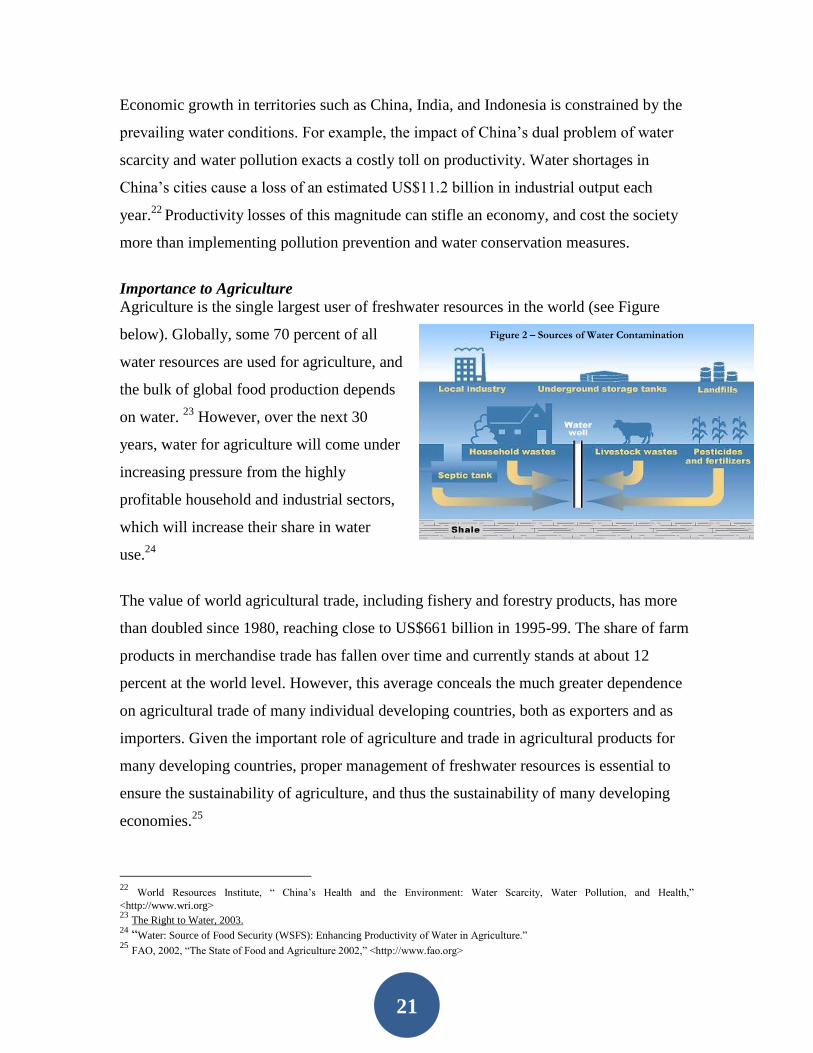
Water contamination occurs when products such as gasoline, oil, sewage, animal waste,
and chemicals get into the water and may cause it to become unsafe and unfit for human
use. Water pollution originates from both point and non-point sources. Some of the major
sources of these contaminants are storage tanks, septic systems, hazardous waste sites,
and landfills (see Figure below).
If the water sources are contaminated, then the cost of treating that water to make it safe
for human consumption escalates. In São Paulo, the Bilings and Guarapiranga reservoirs,
which account for 21 percent of the water in the metropolitan region of Brazil’s largest
city, are becoming more and more polluted. As a result, the cost of water treatment
chemicals rocketed from US$11.7 million in 1998 to US$20.5 million in 2002.30
While
water production increased by 8 percent in the four years, the volume of chemicals used
in the water treatment process increased 40 percent, hitting 170,000 tonnes per year – the
equivalent of 17,000 truckloads – just to make it safe to drink.31
There are several other costs associated with the supply and treatment of water. The more
apparent costs relate to accessing, treating (purification), and pumping water, including
source development and energy costs.
While enough water exists on the island to meet Jamaica’s demands, the country’s water
resources are not necessarily located close to the major centres of water use. Currently,
29
PIOJ and STATIN, 2002, Jamaica Survey of Living Condition 2001. 30
Galvão, Luís Eduardo, 2003, “A Water Pollution Crisis in the Americas,” in Habitat Debate, vol. 9, no. 3, 10.
31 ibid.

25
the NWC pays between $270-$320 million a month to Jamaica Public Service Company
(JPSCo.) in energy for the pumping and treatment of water. However, as water sources
become more polluted and less accessible, the NWC will have to incur higher costs for
pumping and treatment. These costs can only be avoided by implementing freshwater
management programmes that deal with water conservation, pollution prevention and
control, and watershed management.
Energy Costs
Pumping and transporting water from its source and treating water for use often require
significant amounts of energy. It is estimated that 2-3 percent of the world’s energy is
used to pump and treat water for consumption. In developing countries, the cost of energy
to supply water may easily consume half a municipality’s total budget.32
By conserving
water, less energy would be consumed in its treatment and distribution.
In addition, the burning of fossil fuel to generate the energy used to supply water
contributes to global climate change. Global climate change has the potential to reduce
recharge to aquifers, reduce river flows and disrupt water supplies in many areas, making
water even more costly and energy intensive to obtain in the future. This is another
compelling reason for us to conserve on our use of water.
Water Purification and Wastewater Treatment Costs
Wetlands help maintain and improve the water quality of streams, rivers, lakes, and
estuaries. As runoff and surface water pass through, wetlands remove or transform
pollutants through physical, chemical, and biological processes. The pollution and
destruction of these wetlands means that their water purification and wastewater
treatment functions are affected and may not be available in the future. Replacing these
services would prove to be very expensive. For example, the Congareee Bottomland
Hardwood Swamp in South Carolina removes a quantity of pollutants from water sources
equivalent to that which would be removed by a US$5 million water treatment plant.
In another case, scientists estimate that a 2,500-acre wetland in Georgia saves US$1
million in water pollution control costs annually. Thus, by maintaining the integrity of
32 “Water: Exploring and Developing the Relationship Between Water and Energy Efficiency,”< www.ase.org>

26
these wetland areas, we can decrease the amount of money spent on water purification
and wastewater treatment.
The cost of providing safe water affects productivity, and water shortages constrain
economic activity. Degradation of water quality and water sources has direct economic
costs, one of which is that households must spend time and energy to boil water for
drinking or retrieve water from distant standpipes. In Jakarta, more than US$50 million is
spent annual to boil water – an amount equal to 1 percent of the city’s GDP.
Pollution Costs
In addition to increased water purification and energy costs, water pollution may make
some water sources unsuitable for human use to the extent that new sources have to be
developed, including expensive desalination technologies. Additionally, pollution may
impose costs on a society by way of increased healthcare expenditures resulting from
increased waterborne illnesses.
Funding for New/Alternative Sources
As the most productive aquifers and surface sources become polluted or are
overexploited, new sources of water will have to be found. These sources are likely to be
less accessible and less desirable, making water more costly to access and treat. A World
Bank report states that, “Anecdotal evidence suggests that deep wells [drilled] around
Beijing now have to reach 1,000 metres (more than half a mile) to tap fresh water, adding
dramatically to the cost of supply.”33 Water conservation is a viable alternative to
developing new water supplies and expanding treatment facilities, and often a far less
expensive one.
Many water scarce nations have had to turn to desalination as a means of supplementing
their supplies of freshwater. The single greatest impact of this alternative is the energy
required for desalination. The cost of this energy, plus the cost of the desalination
infrastructure, makes desalination very expensive. For example, in 1994, a Southern
California water district, using local groundwater spent about US$78 an acre-foot.
33 Brown, Lester R., 2001, “Worsening Water Shortages Threaten China’s Food Security,” <http://www.earth-policy.org>

27
Desalinated seawater cost from US$1,200 to US$2,000 an acre-foot. In addition, a 2
million gallons-per-day facility was estimated to cost US$50-US$70 million to construct.
Over a decade, the price of desalinated water has fallen by more than 100 percent, to
between US$700 and US$1,100 making it much more affordable. And as desalination
technologies become more efficient and cost effective, it may become an option for even
more nations. However, freshwater from ground and surface sources will continue to be
the least expensive option.
On many Caribbean islands, desalinated water has become the main source of drinking
water. However, the expansion of this technology remains limited due to the high energy
costs involved. In Barbados, the St Michael plant contributes around 20 percent of the
country’s total water supply. This new plant has a capacity of about 30,000 cubic metres
per day, apparently making it one of the biggest desalination plants of its kind in the
world. The plant itself cost an estimated US$15 million, and a further US$5.5 million
was needed to connect it with the rest of the island’s water supply system.
Costs vary from island to island and depend on the location, plant size, and type of water
being desalinated (seawater being the most expensive). Other major costs, apart from the
high initial capital investment, include energy, replacement parts, treatment materials and
skilled labour to operate the plants. In the Bahamas, production cost ranges between
US$4.60 per cubic metre and US$5.10 per cubic metre. In The Netherlands Antilles,
production costs are roughly US$4.31 per cubic metre.
Given its high cost, desalination should only be considered an option by countries that
have historically been plagued with water shortages. Nations that currently have little or
no problem obtaining water from freshwater sources will not have to incur the costs of
infrastructure and energy if they ensure that their water management practices are
sustainable.
New Source Development Costs in Jamaica
With the projected increase in water demand, required new water to the year 2015 is
estimated at 790 million m3 per year. Related expenditure to expand water supply is
28
estimated at US$2.2 billion: the non-agricultural sector is estimated to require US$1.3
billion; the agricultural sector US$0.3 billion; and sewage systems US$0.6 billion. To
avoid incurring these costs, a programme of water conservation needs to be launched
throughout the entire island.
New sources have also had to be developed as sources are abandoned due to pollution,
saline intrusion, and watershed degradation. In addition to the estimated 104.3 million m3
of underground water has been abandoned in the past 40 years, 40 percent of
groundwater sources are currently at risk of contamination. In the Kingston Metropolitan
Area (KMA), over 60 percent of available groundwater is contaminated by high nitrate
concentrations. If these trends continue, more of our currently available water sources
will be unavailable in the future, meaning additional costs must be incurred for the
development of new sources.
Ferry Desalination Plant34
NWC is looking at converting brackish, salty river water to potable supply for the
Kingston Metropolitan Area, under a multi-million dollar plan for a desalination plant.
The short-term plan involves adding an initial 5 imperial million gallons more of daily
supply to the 11-12 imgd that is now fed to the KMA from the Rio Cobre and its
supporting systems. The virgin supply will be tapped at Ferry Spring, a source that before
now had been discounted because of the high salt content. (The Ferry Spring was used by
the NWC in the past through mixing with fresher NWC water at Ferry station and
pumped into Kingston.)
The desalination programme represents new ground for NWC, even though some private
sector entities, one of the first being Beaches Negril, have installed small plants for
private use. If it works, it would ease the yearly water shortages, and lock-offs faced by
the capital. It is also contemplated as a source of new water for housing schemes coming
up in St. Catherine.
34 Clarke, Lavern D., 2001, Jamaica Gleaner [online], “Breaking the Back of Kingston’s Water Shortage,” <http://www.jamaica-
gleaner.coml>

29
Public Healthcare Costs
In many developing countries, water scarcity has been exacerbated and human health
gravely damaged by accelerating contamination of usable water supplies, especially in
rapidly urbanizing areas. The most serious immediate challenge is the fact that more than
1 billion people lack access to safe drinking water. In many developing countries, rivers
downstream from large cities are little cleaner than open sewers. The health impact is
devastating. Unsafe water and poor sanitation cause an estimated 80 percent of all
diseases in the developing world. No single measure would do more to reduce disease
and save lives in the developing world than bringing safe water and adequate sanitation to
all.
Countries spend anywhere between 0.2 percent (Myanmar) and 9.5 percent (Croatia) of
their GDP on public healthcare.35
Given that many waterborne illnesses can be easily
avoided if clean water and proper sanitation services are available, nations could save on
public healthcare expenditure, funds which could be channeled in other functions. And
the cost of public healthcare is only a fraction of the total cost to a nation. Other direct
and indirect costs include the cost of private treatment, the loss of workdays – leading to
productivity losses – and the loss of life due to water-related diseases.
Benefits of Water Conservation
The treatment and distribution of water is costly, therefore wise water use is good
business. Even when pursued on an individual basis, water conservation can add up to
major savings in water, energy, and money. For the average household, reductions in
water use as high as 40 percent or more are feasible. In addition, by reducing water
intake, we reduce wastewater pre- and post-treatment expenses that can be many times
the water’s original cost. The American government, for example, spends as much as
US $1 billion per year on water and sewage costs. However, almost US$40 million of
that amount could be saved every year, simply by using more water-conserving products
and practices.36
35 Demographic, Economic, and Social Indicators, <Demographic, Social and Economic Indicators.pdf>
36 “Federal Energy Management Programme: Using Effective Water Conservation Measures can Save Millions of Taxpayer Dollars,”
<http://www.eere.energy.gov>

30
Water conservation will also result in municipal water plants reducing the amount of
water they have to pump to homes and businesses and on the amount of wastewater that
has to be treated at sewage treatment plants. Water conservation can therefore extend the
useful life of municipal water supply and treatment plants, and will benefit the operating
efficiency and life expectancy of sewage disposal systems. The importance of water
conservation should therefore be an integral part of the management of freshwater
resources and needs to be given prominence in freshwater resources planning.
Costs of Overexploitation of Water Resources
Water is a renewable resource. However, these resources will not be available
indefinitely if they are not used sustainably. Water, too, can be “mined,” and there are
costs attendant to its overexploitation, as are outlined below.
Over-extraction of Groundwater
Groundwater is said to be “mined” when water is removed from an underground
reservoir at a rate faster than it is naturally being replenished. Groundwater mining is a
significant problem because it causes the decline of water tables as well as saltwater
intrusion, which result in land subsidence and desertification.
When use exceeds natural recharge over a long period, groundwater levels drop. Parts of
India, China, West Asia, the former Soviet Union, the western United States, and the
Arabian Peninsula are experiencing declining water tables, limiting the amount of water
that can be used and raising the costs of pumping to farmers (Postel 1997, UNEP 1999).
Over-pumping of groundwater can also lead to saltwater intrusion in coastal areas. In
Madras, India, for example, saltwater intrusion has moved 10 km inland, contaminating
wells (UNEP 1996). Over-extraction of groundwater is most acute in the Near East,
where it is leading to saltwater intrusions that ultimately make the water unsuitable for
crop production. But it is also a problem in large areas of South Asia, where food security
is heavily dependent on irrigation. Over-pumping in these areas is causing water levels to

31
fall beyond the reach of shallow tube wells37
with the risk that irrigation may eventually
become too expensive or physically impractical.38
In Arizona, USA, land subsidence due to groundwater over-pumping is a serious problem
because the water supporting the land is being mined. Land subsidence in Arizona has
resulted in more than 75 cracks in the earth, and some fissures have been measured to as
much as 25 ft wide and 60 ft deep. The picture to the right shows a crack in the earth in
Arizona caused by the overdraft of groundwater. This crack is at least 50 feet deep.39
The mining of groundwater will eventually result in the abandonment of irrigated
cropland when the water runs out, resulting in desertification. Abandoned fields lack any
natural ground cover, and soil erosion on abandoned fields is a very common problem.
Saline intrusion may also cause desertification when salinity becomes high enough.
David Sheridan in his book Desertification of the United States calls soil salinization one
of the “deadliest” forms of desertification. The United States Bureau of Reclamation
estimates that salinity caused US$91 million in total damages in 1983 and predicts a
US$267 million annual loss by 2010.40
The Cost of Diversion/Damming
Water, the most highly demanded resource on earth, is unequally distributed around the
globe, both among and within countries. Water is often diverted from one are where it is
in abundant supply to other areas where supply is inadequate (or nonexistent). One of the
major reasons dams and reservoirs are built is to facilitate the diversion of water for
irrigation.
However, water diversion and damming projects often fail to value fully other watershed
services. For example, an intact Nigerian floodplain supports tens of thousands of people
through fishing, agriculture, fuelwood and fodder production, livestock, and tourism, and
recharges groundwater supplies. When the floodplain’s current uses were compared with
37
A tube well is a well made by driving a tube into the earth to a water-bearing level. 38
“Pressures on the Environment from Agriculture,”< http://www.fao.org> 39
“The Impacts of Irrigated Agriculture in the Southwestern United States,” <http://www.earlham.edu> 40
ibid.
32
the alternative of a water diversion plan, the value of water maintained in the floodplain
for those existing uses was worth US$45 per 1,000 cubic metres while the value of
diverted water for increasing crop output was only US$0.04. As this example clearly
shows, the value of an intact watershed can greatly outweigh the value of any water
diversion scheme.
Unfortunately, oftentimes the value of an intact watershed or a water body is not fully
appreciated until that value is lost. The withdrawal or diversion of water from surface and
ground water sources for agriculture, industry, and municipal use has costs, which are
usually borne by other industries, in particular fisheries. The amount of freshwater
withdrawn has risen 35-fold in the past 300 years; over half of that increase has occurred
since 1950. In many areas, groundwater is now withdrawn far faster than it can be
recharged – mining what was once a renewable resource.
Central Asia’s Aral Sea is one of the most graphic examples of excess diversion of inland
waters. Since 1960, this massive lake (once the fourth largest) has lost three-fourths of its
volume. Today, 94 percent of the river flow that once fed the Aral Sea is diverted to
irrigate thirsty crops such as cotton in this arid region. The sea’s salinity levels have
tripled and 20 of its 24 fish species have disappeared. The fish catch, which once
measured 44,000 tons and supported 60,000 jobs, is now nonexistent. By reducing our
water use in all sectors, we can reduce the need to divert water from its original uses,
preserving plant and animal life, as well as livelihoods. Water management must involve
sustainable practices for distributing water among different sources.
Urban Drainage
In urban areas, the high proportion of land space covered with hard nonabsorbent materials such
as asphalt and concrete means that rain water cannot soak into the ground. The runoff from these
areas increase as the area of pavement increases leading to flooding and overtopping of natural
drainage systems. Special systems are needed to collect, channel and dispose of rainwater in
urban areas. This is referred to as urban drainage.
Up to now in Jamaica responsibility for provision of urban drainage has been shared in a fairly
ill-defined way between the Ministry of Works and Parish Councils. It has been treated largely as
33
an adjunct to road construction. The Water Resources Authority is seeking to take responsibility
for the regulation of floodwater control while the NWA will retain the implementation of works
associated with drainage. The Ministry of Works is involved in planning to ensure that drainage is
sufficient to prevent flooding, and taking remedial action when flooding occurs.
The Government is aware of a number of problems and missed opportunities in the area of urban
drainage. Institutional responsibilities are poorly defined, and co-ordination between institutions
is often less than optimal. Provision for drainage, and maintenance of drainage systems, is often
inadequate. This results in deterioration of road surfaces and flooding in some cases. The impact
of drainage on the quality of the receiving waters is often over-looked, while at the same time
opportunities to re-use drainage water, for example for aquifer recharge, are seldom considered.

34
STRENGTHS
Adequate and surplus water resources
Good quality water (WHO standard)
High access to potable water (>71%)
Recognition of the link between sanitation and water supply
Sector Policy and Framework focusing on all aspects of water (WRMP/NIDP/RWMP/WSP)
WEAKNESSES
Poorly maintained parish council water systems
Fragmentation of water supplies especially for the rural population
Lack of adequate funding
Lack of understanding of the pivotal role of water in planning and development
Lack of strong leadership in the coordination of the work of the sector
Lack of coordination of water and sanitation programmes, human settlements development and urban and regional planning
Poor enforcement of regulatory framework
Attrition of professional staff
Aged Infrastructure and high non revenue water
High inefficiencies in transmission and use
OPPORTUNITIES
A water policy exists which needs to be updated, improved and expanded
Stated commitment to local government reform can rationalize water supplies
International funding to deal with adaptation to climate change for water resources and water supplies
High Global attention to water and sanitation
New modalities for rural water management involving communities
Inclusion of IWRM in national development plansIncreased PSP in water and sanitation services
Increased conservation of water (reuse, recycle)
Implement demand management
THREATS
Deforestation and increased runoff/erosion
Climate Change - impacts on natural hazards (flood, drought, hurricanes) and coastal aquifers
Informal Settlements and poor waste practices
Safety/Social Pressures
Old infrastructure and impact on water quality
Expanding urbanization into upper watershed areas
Poor agricultural practices and contamination of water
Rising energy costs
SWOT Analysis
Chapter 3: SWOT Analysis of the Water Sector

35
Chapter 4:
Strategic Vision and Planning Framework for Water Sector
Vision Statement Integrated and sustainable water resources management and development; adequate
and safe water supply and sanitation to support the social and economic development
of Jamaica.
To ensure the provision of adequate and safe water supply and sanitation services,
Vision 2030 Jamaica will strengthen the nation’s infrastructure for storage, treatment,
distribution and disposal of water. This will be achieved through a range of strategies
including strengthening national capacities to make decisions among competing demands
for the allocation of limited water resources; increasing financing for infrastructural
development; and the creation of an institutional framework to allow for efficient and
effective water resources management.
Strengthening the country’s infrastructure is particularly important as new water required
by the country by the year 2015 has been estimated at 790 million cubic metres per year
by the Water Resources Authority (WRA), with 172 million cubic metres for non-
agricultural purposes and 618 million cubic metres for agricultural purposes.
Based on these estimates, Jamaica will be using more than 41 per cent of its reliable safe
yield of freshwater by 2015, and the water supply system would have to almost double its
delivery between 2003 and 2015. Currently, reliable and safe yields168 of freshwater in
Jamaica are estimated at 4,085 million cubic metres per year, with groundwater
accounting for 84 per cent and surface water 16 per cent. Present production from both
ground and 6surface water resources totals 920 million cubic metres per year – 22.5 per
cent of the current reliable safe yield.
Chapter 4: Strategic Vision and Planning Framework

36
This leaves a balance of 3,165 million cubic metres per year (over 77% of the total)
available for development. Under Vision 2030 Jamaica, water, sanitation and hygiene
will be linked to support human health, protect ecosystems and reduce poverty. We will
provide stronger coordination between the planning and development of water supply,
sanitation services and human settlements.
Goals and Outcomes
Adequate and safe water supply and sanitation to support the social and economic development of Jamaica
• All water and sanitation needs are met using modalities that are safe and sustainable
• Capabilities to address hazards and climate change improved
• Stakeholders participate in the planning and managing of the development and use of the island’s water resources
• Capacity enhanced to effectively plan and manage the development and use of the island’s water resources
• The financial base for future water and sanitation needs strengthened
37
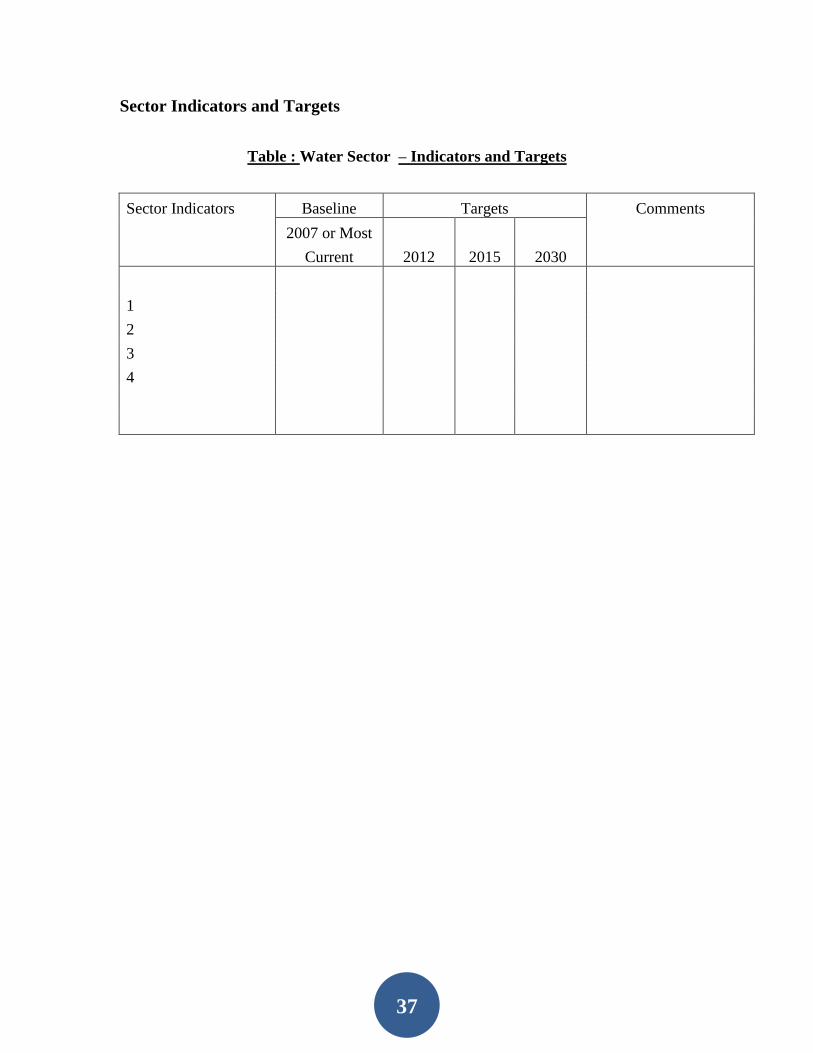
Sector Indicators and Targets
Table : Water Sector – Indicators and Targets
Sector Indicators Baseline Targets Comments
2007 or Most
Current 2012 2015 2030
1
2
3
4

38
Implementation Framework and Action Plan
for the
Water Sector
Implementation Framework The implementation of the Water Sector Plan is an essential
component of the implementation, monitoring and evaluation
framework for the Vision 2030 Jamaica – National
Development Plan. The Plan is implemented at the sectoral
level by ministries, departments and agencies (MDAs) of
Government as well as non-state stakeholders including the
private sector, NGOs and CBOs. The involvement of
stakeholders is fundamental to the successful implementation
of the National Development Plan and Water Sector Plan.
Accountability for Implementation and Coordination
The Cabinet, as the principal body with responsibility for
policy and the direction of the Government, has ultimate
responsibility for implementation of the National
Development Plan. Each ministry and agency will be
accountable for implementing the National Development Plan
(NDP) through various policies, programmes and
interventions that are aligned with the strategies and actions
of the NDP and the sector plans. A robust results-based
Components of Vision 2030
Jamaica: National
Development Plan The Vision 2030 Jamaica National
Development Plan has three (3)
components:
1. Integrated National Development Plan:
The integrated National Development
Plan presents the overall plan for
Vision 2030 Jamaica, integrating all
31 sector plans into a single
comprehensive plan for long-term
national development. The integrated
National Development Plan presents
the National Vision, the four National
Goals and fifteen National Outcomes,
and the National Strategies required to
achieve the national goals and
outcomes.
2. Medium Term Socio-Economic Policy Framework (MTF):
The Medium Term Socio-Economic
Policy Framework (MTF), is a 3-
yearly plan which summarizes the
national priorities and targets for the
country and identifies the key actions
to achieve those targets over each 3-
year period from FY2009/2010 to
FY2029/2030.
3. Thirty-one (31) Sector Plans:
At the sectoral level Vision 2030
Jamaica will be implemented through
the strategic frameworks and action
plans for each sector as contained in
the respective sector plans. Vision
2030 Jamaica includes a total of
thirty-one (31) sector plans covering
the main economic, social,
environmental and governance sectors
relevant to national development.
Chapter 5: Implementation Framework and Action Plan

39
monitoring and evaluation system will be established to ensure that goals and outcomes
of the Plan are achieved. This system will build on existing national and sectoral
monitoring and evaluation frameworks and will be highly participatory.
Resource Allocation for Implementation
Vision 2030 Jamaica places great emphasis on ensuring that resource allocation
mechanisms are successfully aligned and integrated with the implementation phase of the
National Development Plan and sector plans. The requirements to ensure resource
allocation for implementation will include alignment of organizational plans in the public
sector, private sector and civil society with the National Development Plan, MTF and
sector plans; coherence between the various agency plans with the National Budget;
rationalization of the prioritisation process for public sector expenditure; and increased
coordination between corporate planners, project managers and financial officers across
ministries and agencies.
Action Plan
The Action Plan represents the main framework for the implementation of the Water
Sector Plan for Vision 2030 Jamaica. The tracking of implementation of the Water Sector
Plan will take place through the Action Plan as well as the framework of sector indicators
and targets.
The Action Plan contains the following elements:
i. Sector Goals
ii. Sector Outcomes
iii. Sector Strategies
iv. Sector Actions
v. Responsible Agencies
vi. Timeframe

40

41
LONG TERM ACTION PLAN
2009 – 2030
Goal # 1 - Adequate and safe water supply and sanitation to
support the social and economic development of Jamaica
STRATEGIES SPECIFIC
ACTIONS
TIMEFRAME RESPONSIBILITY
All water and sanitation needs are met using modalities that are safe and
sustainable
Implementation of IWRM in an
established institutional
framework anchored in the
Dublin and other related
principles and informed by
regional and national research
findings
Promulgate and
implement the National
Water Resources Master
Plan
2009 onwards WRA, MoWH, NIC,
NWC, RWSL
Review mandates of
agencies involved in
water resources
management with a view
to creating an
institutional framework
that will allow more
effective coordination
for efficient and
effective water resources
management
2010 onwards Ministry of Water and
Housing
Establish a process for
inclusion, consultation
and training with
stakeholders to develop
IWRM plans and
policies
2011 - 2014 WRA, MoWH, NIC,
NWC, RWSL
Improve timely access to
and sharing of available
data and research on
water resources
management and the
dissemination &
implementation of good
practice guidelines for
2009 Ministry of Water and
Housing, STATIN,
PIOJ, WRA,
Meteorology Dept
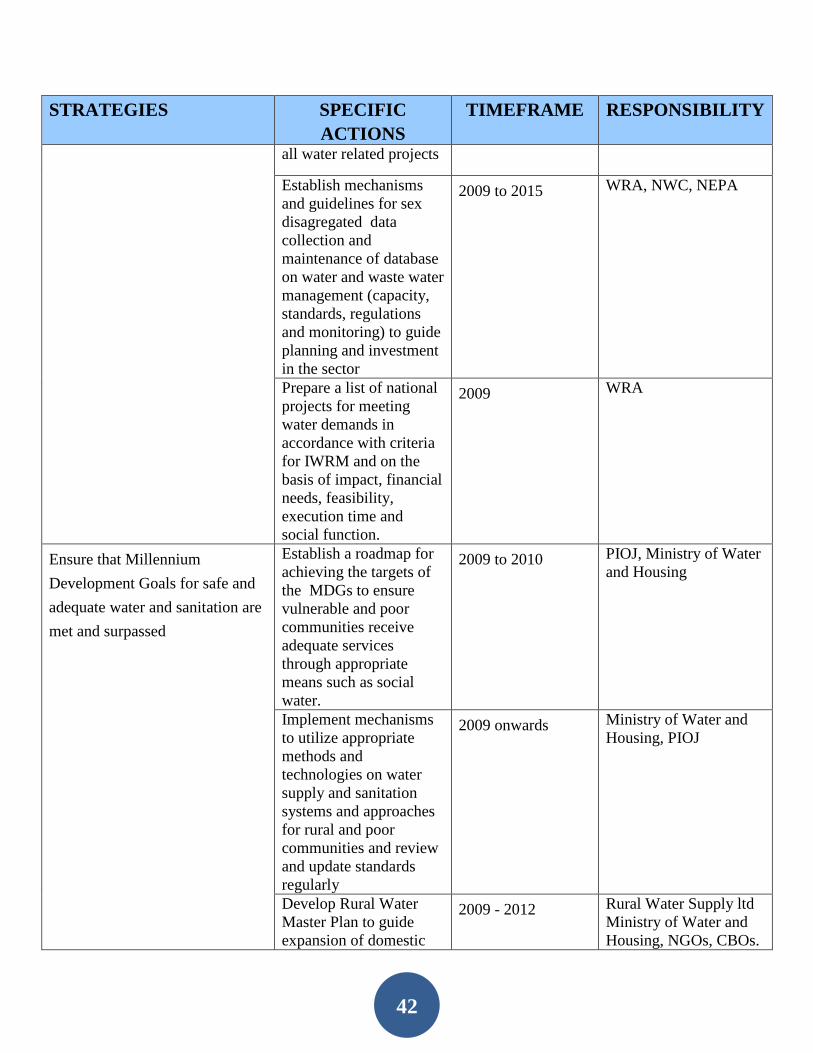
42
STRATEGIES SPECIFIC
ACTIONS
TIMEFRAME RESPONSIBILITY
all water related projects
Establish mechanisms
and guidelines for sex
disagregated data
collection and
maintenance of database
on water and waste water
management (capacity,
standards, regulations
and monitoring) to guide
planning and investment
in the sector
2009 to 2015 WRA, NWC, NEPA
Prepare a list of national
projects for meeting
water demands in
accordance with criteria
for IWRM and on the
basis of impact, financial
needs, feasibility,
execution time and
social function.
2009 WRA
Ensure that Millennium
Development Goals for safe and
adequate water and sanitation are
met and surpassed
Establish a roadmap for
achieving the targets of
the MDGs to ensure
vulnerable and poor
communities receive
adequate services
through appropriate
means such as social
water.
2009 to 2010 PIOJ, Ministry of Water
and Housing
Implement mechanisms
to utilize appropriate
methods and
technologies on water
supply and sanitation
systems and approaches
for rural and poor
communities and review
and update standards
regularly
2009 onwards Ministry of Water and
Housing, PIOJ
Develop Rural Water
Master Plan to guide
expansion of domestic
2009 - 2012 Rural Water Supply ltd
Ministry of Water and
Housing, NGOs, CBOs.

43
STRATEGIES SPECIFIC
ACTIONS
TIMEFRAME RESPONSIBILITY
water access and
management.
Local Government
Ensure equitable allocation of
water resources in each
hydrological basin
Ensure all hydrological
basin plans give due
consideration to the
sustainable allocation of
water for environmental
management. This may
include the establishment
of watershed
management, protection
and buffer zones
2009 to 2015 WRA, Ministry of
Water and Housing,
Local, Regional and
International bodies,
CBOs and NGOs
Conduct effective water
resources planning and
implement sustainable
water resources
development taking into
consideration technical,
economic, social and
environmental factors
2009 to 2015 WRA, Ministry of
Water and Housing,
Local, Regional and
International bodies,
CBOs and NGOs
Review and implement
guidelines for
conducting water
resources assessment and
monitoring in each
hydrological basin on a
continuous basis to guide
allocation
2009 to 2015 WRA, Ministry of
Water and Housing,
Local, Regional and
International bodies,
CBOs and NGOs
1.1.4 Institute efficient water use
all sub-sectors-irrigation,
domestic, hydropower, industry,
environment and tourism
Implement measures to
ensure multi-purpose use
of water resources
2009-onwards NIC, WRA, RADA,
Ministry of Agriculture
Utilize extensions
services and appropriate
technology to improve
water efficiency in the
agricultural and domestic
water sub-sectors
2009-onwards NIC, WRA, RADA,
Ministry of Agriculture
Establish appropriate
guidelines and systems
for key agencies to
report on water
management (capacity,
standards, regulation
2009 OPM, MDAs,
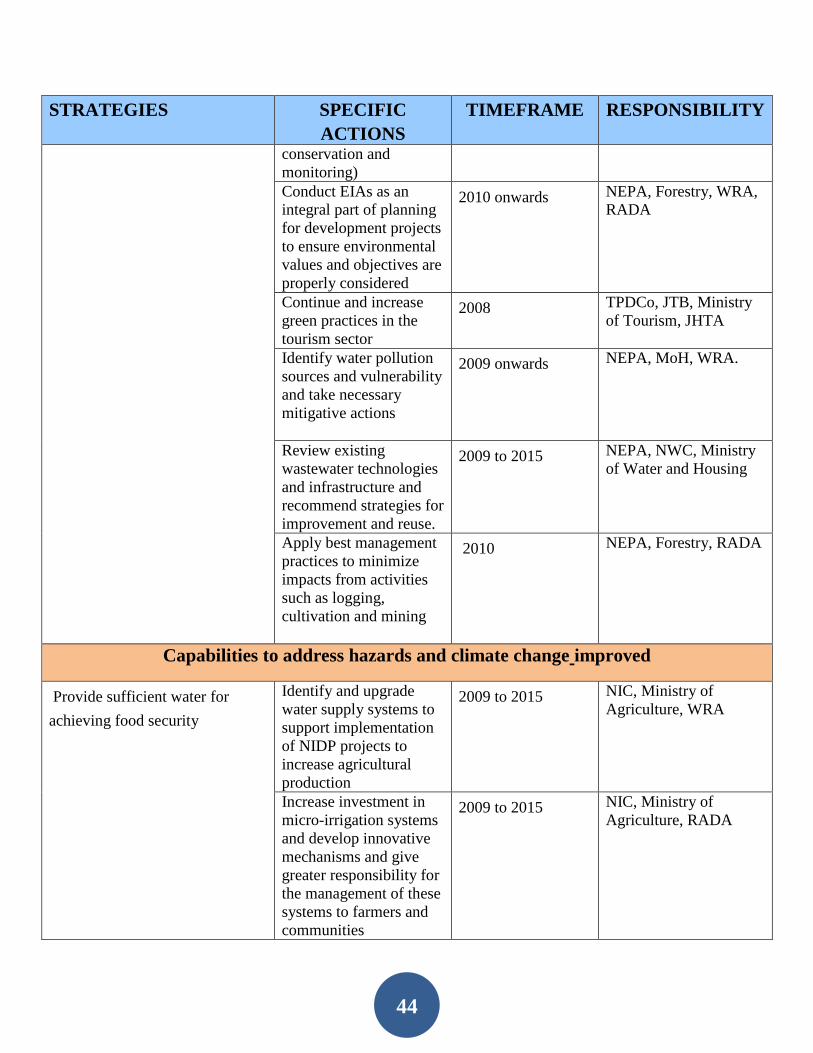
44
STRATEGIES SPECIFIC
ACTIONS
TIMEFRAME RESPONSIBILITY
conservation and
monitoring)
Conduct EIAs as an
integral part of planning
for development projects
to ensure environmental
values and objectives are
properly considered
2010 onwards NEPA, Forestry, WRA,
RADA
Continue and increase
green practices in the
tourism sector
2008 TPDCo, JTB, Ministry
of Tourism, JHTA
Identify water pollution
sources and vulnerability
and take necessary
mitigative actions
2009 onwards NEPA, MoH, WRA.
Review existing
wastewater technologies
and infrastructure and
recommend strategies for
improvement and reuse.
2009 to 2015 NEPA, NWC, Ministry
of Water and Housing
Apply best management
practices to minimize
impacts from activities
such as logging,
cultivation and mining
2010 NEPA, Forestry, RADA
Capabilities to address hazards and climate change improved
Provide sufficient water for
achieving food security
Identify and upgrade
water supply systems to
support implementation
of NIDP projects to
increase agricultural
production
2009 to 2015 NIC, Ministry of
Agriculture, WRA
Increase investment in
micro-irrigation systems
and develop innovative
mechanisms and give
greater responsibility for
the management of these
systems to farmers and
communities
2009 to 2015 NIC, Ministry of
Agriculture, RADA
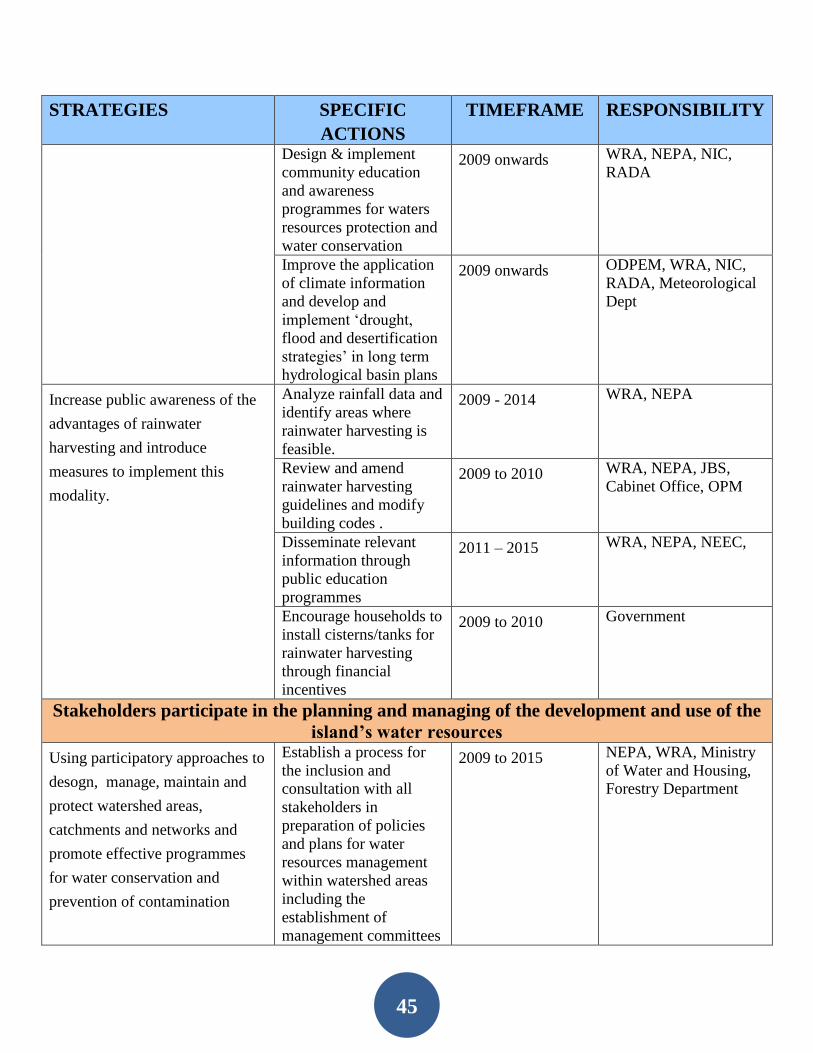
45
STRATEGIES SPECIFIC
ACTIONS
TIMEFRAME RESPONSIBILITY
Design & implement
community education
and awareness
programmes for waters
resources protection and
water conservation
2009 onwards WRA, NEPA, NIC,
RADA
Improve the application
of climate information
and develop and
implement ‘drought,
flood and desertification
strategies’ in long term
hydrological basin plans
2009 onwards ODPEM, WRA, NIC,
RADA, Meteorological
Dept
Increase public awareness of the
advantages of rainwater
harvesting and introduce
measures to implement this
modality.
Analyze rainfall data and
identify areas where
rainwater harvesting is
feasible.
2009 - 2014 WRA, NEPA
Review and amend
rainwater harvesting
guidelines and modify
building codes .
2009 to 2010 WRA, NEPA, JBS,
Cabinet Office, OPM
Disseminate relevant
information through
public education
programmes
2011 – 2015 WRA, NEPA, NEEC,
Encourage households to
install cisterns/tanks for
rainwater harvesting
through financial
incentives
2009 to 2010 Government
Stakeholders participate in the planning and managing of the development and use of the
island’s water resources
Using participatory approaches to
desogn, manage, maintain and
protect watershed areas,
catchments and networks and
promote effective programmes
for water conservation and
prevention of contamination
Establish a process for
the inclusion and
consultation with all
stakeholders in
preparation of policies
and plans for water
resources management
within watershed areas
including the
establishment of
management committees
2009 to 2015 NEPA, WRA, Ministry
of Water and Housing,
Forestry Department

46
STRATEGIES SPECIFIC
ACTIONS
TIMEFRAME RESPONSIBILITY
Implement community
education and awareness
programmes for
watershed protection and
water conservation
2009 onwards WRA, NEPA, Forestry,
NIC, RADA
Improve education and
training to ensure
effective community
participation in
sustainable water
management
2009 NEPA, MIND, Ministry
of Water and Housing,
Local, Regional and
International bodies,
CBOs and NGOs
Support community
participation in
appropriate water quality
monitoring programmes
targeted at
environmental education
and awareness of
communities
WRA, NEPA, MoH,
Rural Water Supply,
SDC, JSIF, CBOs, EFJ,
NGOs.
Continue multi-
stakeholders discussions
and dialogues on
relevant solutions for
water supply
NWC, NIC, Rural Water
Supply
Foster the protection of the
natural resources of the basin as a
means of conserving water
resources
Strengthen community
based institutions and
resource user groups for
the management of
common property
resources and instilling a
stewardship ethic
2009 to 2015 Government
Address land tenure
systems in order to
provide incentives for
the sustainable
management of natural
resources & investments
in land improvements
2009 to 2015 Government
Adopt and implement
measures that guarantee
access to technology and
research, in particular
women, disadvantaged
groups and people living
2009 to 2015 Government

47
STRATEGIES SPECIFIC
ACTIONS
TIMEFRAME RESPONSIBILITY
in poverty in order to
ensure sustainable use of
land and water resources
Build capacity for community
management and for
mainstreaming gender into water
resources management
Strengthen PDCs, CBOs
and NGOs to undertake
participatory and
community-based
development processes
for infrastructure
management
2009 to 2015 Government
Strengthen the capacity
of CBOs and NGOs and
government agencies to
disseminate information
on sustainable water
management
2009 Ministry of Water and
Housing, Local,
Regional and
International bodies,
CBOs and NGOs
Establish multi-level
partnerships between
central and local
governments, NGOs,
CBOs and communities
in the provision of water
2009 to 2015 Government
Support the concept of
subsidiarity with regard
to the delivery of
infrastructure services
2009 to 2015 Government
Develop and Implement
training modules on
gender in IWRM in
tertiary institutions
Ministries, WRA,
UNESCO, Teachers
Colleges
Capacity enhanced to effectively plan and manage the development and use of the
island’s water resources
Strengthen national capacities to
achieve effective integrated water
resources management
Review and update
National Water Sector
Policy and water
legislation and
guidelines
2009 to 2015 Ministry of Water and
Housing
Improve awareness of
water resources
management and supply
issues among all
stakeholders

48
STRATEGIES SPECIFIC
ACTIONS
TIMEFRAME RESPONSIBILITY
Define responsibilities
for all stakeholder
organizations in water
and wastewater
management to eliminate
fragmented and
uncoordinated plans and
actions and improve
linkages to other sectors
Enhance education and
career development
opportunities in the
water sector with special
emphasis on women and
communities, including:
Scholarships for
advanced training
courses;
Local and regional
training workshops;
Applied research and
implementation projects
Technology transfer
2009-2030 Ministries, CBOs,
NGOs,
Strengthen and enhance
communication and
information exchange
between national
agencies involved in
meteorology, hydrology
and water supply
2009 onwards WRA, NIC, RADA,
Meteorological Dept,
NWC, NEPA
Improve regulatory
oversight and sector
governance
2009 onwards Ministries involved in
the water sector
Design and use gender
sensitive indicators to
monitor impacts of water
and sanitation policies
and programmes
Increase sector and
community capacity to
implement appropriate
water quality testing and
associated activities
2009 onwards WRA, Ministry of
Water and Housing,
Local, Regional and
International bodies,
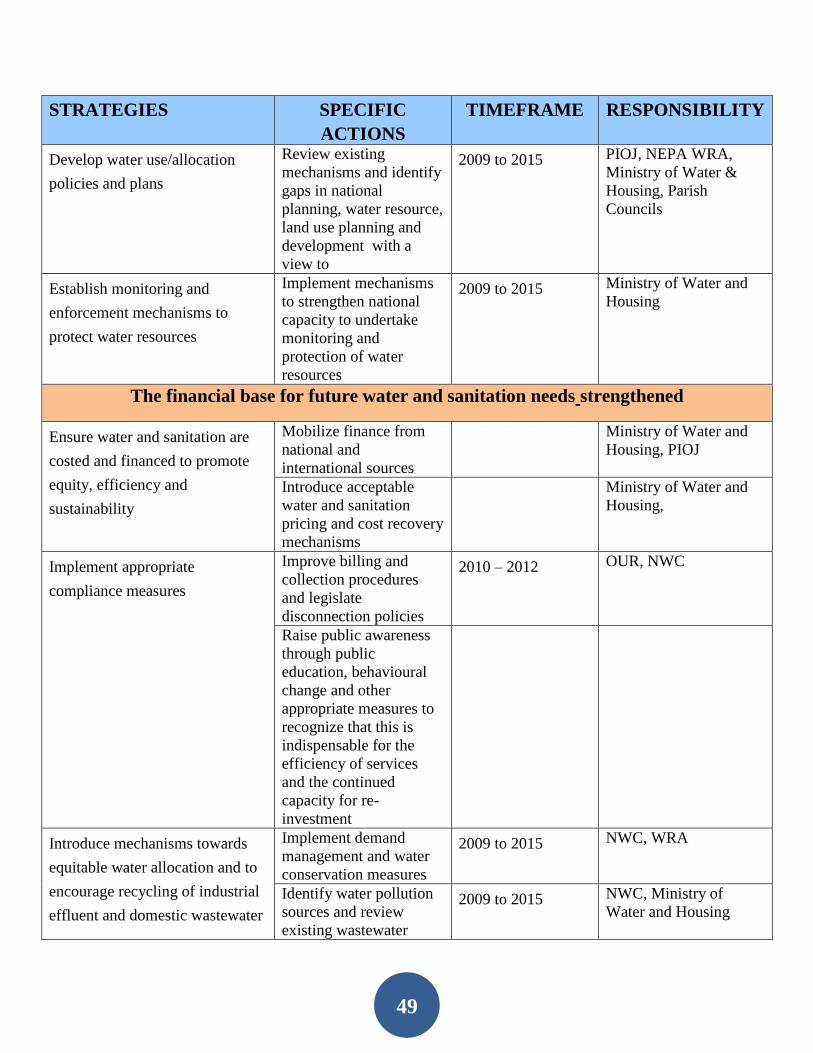
49
STRATEGIES SPECIFIC
ACTIONS
TIMEFRAME RESPONSIBILITY
Develop water use/allocation
policies and plans
Review existing
mechanisms and identify
gaps in national
planning, water resource,
land use planning and
development with a
view to
2009 to 2015 PIOJ, NEPA WRA,
Ministry of Water &
Housing, Parish
Councils
Establish monitoring and
enforcement mechanisms to
protect water resources
Implement mechanisms
to strengthen national
capacity to undertake
monitoring and
protection of water
resources
2009 to 2015 Ministry of Water and
Housing
The financial base for future water and sanitation needs strengthened
Ensure water and sanitation are
costed and financed to promote
equity, efficiency and
sustainability
Mobilize finance from
national and
international sources
Ministry of Water and
Housing, PIOJ
Introduce acceptable
water and sanitation
pricing and cost recovery
mechanisms
Ministry of Water and
Housing,
Implement appropriate
compliance measures
Improve billing and
collection procedures
and legislate
disconnection policies
2010 – 2012 OUR, NWC
Raise public awareness
through public
education, behavioural
change and other
appropriate measures to
recognize that this is
indispensable for the
efficiency of services
and the continued
capacity for re-
investment
Introduce mechanisms towards
equitable water allocation and to
encourage recycling of industrial
effluent and domestic wastewater
Implement demand
management and water
conservation measures
2009 to 2015 NWC, WRA
Identify water pollution
sources and review
existing wastewater
2009 to 2015 NWC, Ministry of
Water and Housing

50
STRATEGIES SPECIFIC
ACTIONS
TIMEFRAME RESPONSIBILITY
technologies and
infrastructure and
recommend strategies for
improvement through
incentive schemes
Develop national
guidelines on best
practice approaches to
managing industrial
effluent and domestic
wastewater that
incorporate tax
incentives for
compliance
2009 to 2015 NWC, Ministry of
Water and Housing
Review current subsidies for
water services from the social
standpoint establishing subsidies
in the sphere of demand rather
than supply and making water
available to the weakest sectors
of society.
Develop and implement
policy for transparent,
sustainable and targeted
subsidies
2009 Government
Consider Trust funds,
cess and community
contributions as sources
of finance for
community and rural
water supply and
establish clear
framework for
participation by the poor
2009 Government
Allow for increased
private/public sector partnership
preferably in denser populated
areas and leave low density areas
for government systems
Encourage partnerships
or project-based joint
ventures from the
outsourcing of design
and construction to the
granting of operating
concessions
2009 to 2015 Government
Create public-private
partnerships for
financing infrastructure
by developing strategic
plans that identify
funding and cost
recovery requirements
and benefits in terms of
improved health and
poverty alleviation.
2009 to 2015 Government

51
STRATEGIES SPECIFIC
ACTIONS
TIMEFRAME RESPONSIBILITY

52


![JAMPRO - National Export Strategy [Jamaica]](https://img.pdfslide.net/doc/110x75/554ad2e1b4c905b5238b51b4/jampro-national-export-strategy-jamaica.jpg)


