Embed Size (px)
Citation preview
James Nowotarski
04 May 2004
IS 553Advanced Systems
Development Practices

2
Course Map
Underpinnings. Introduction. Essentials
Content. Rational Unified Process. Agile
Implementation. Metrics. CMM. Distributed development. Tools & training
Briefings (Term Papers)
1 2 3 4 6 7 8 9 10 115
Assignments
Quizzes
Week
(RUP) (Agile) (CMM) (Distr. Dev.)
3
Background on Continuous Improvement Understand basics of Software Metrics
ObjectivesDefining MetricsMetrics ProgramsMarket Players, Products, GurusSources/Links
Today’s Objectives
4
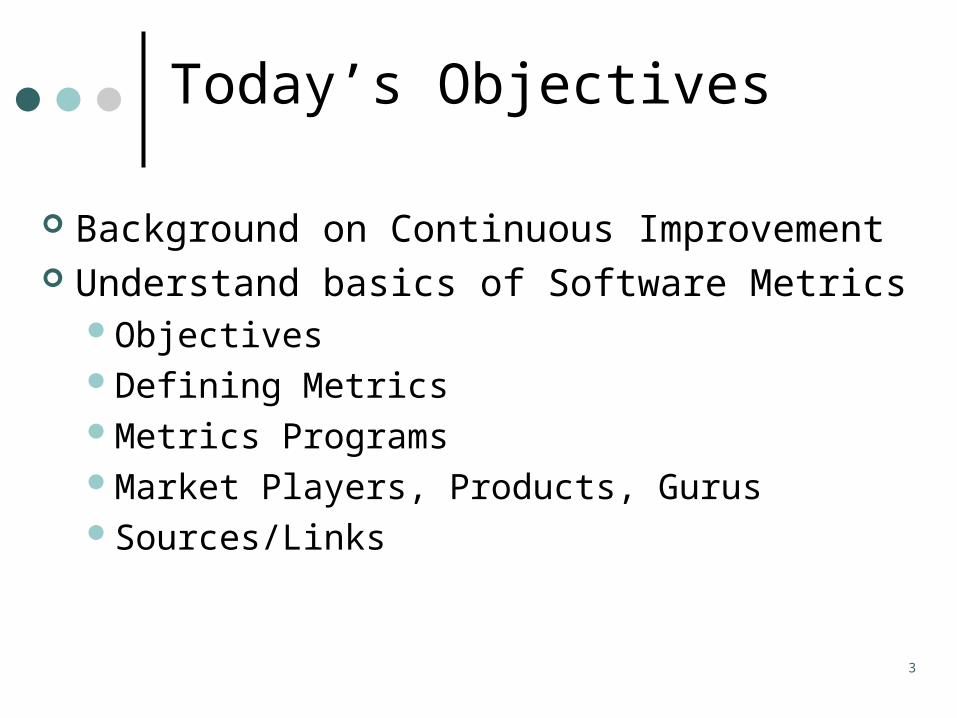
Topic Duration
Quiz 2 and Agile Recap 15 minutes
Software Metrics 60 minutes
*** Break 15 minutes
Current Event Reports 30 minutes
Software Metrics (cont.) 60 minutes
Today’s Agenda
5
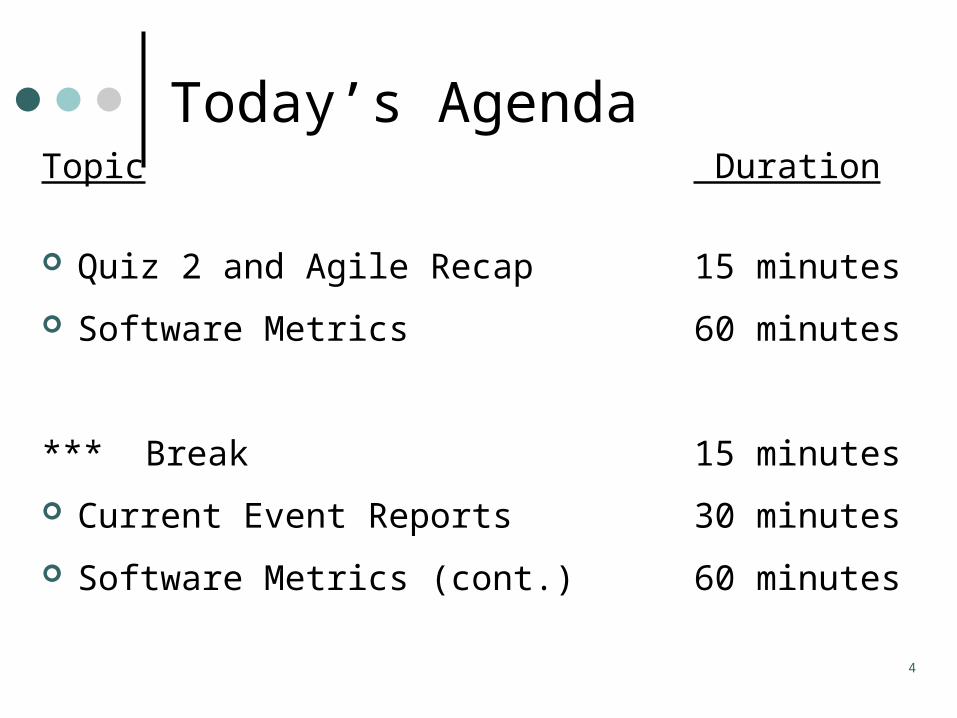
Topic Duration
Quiz 2 and Agile Recap 15 minutes
Software Metrics 60 minutes
*** Break 15 minutes
Current Event Reports 30 minutes
Software Metrics (cont.) 60 minutes
Today’s Agenda

6
Approach References
XP www.extremeprogramming.org
www.xprogramming.com
M. Marchesi et al, Extreme Programming Perspectives, Addison-Wesley, 2002.
Crystal A. Cockburn, Agile Software Development, Addison-Wesley, 2001
SCRUM K. Schwaber and M. Beedle, Agile Software Development with Scrum, Prentice Hall, 2001.
Adaptive Software Development
J. Highsmith, Adaptive Software Development, Dorset House, 2000.
FDD S. Palmer, A Practical Guide to Feature-Driven Development, Prentice Hall, 2002.
Agile - General http://www.agilealliance.org/home
http://www.agilemodeling.com
Agile/Lightweight Methods

7
Topic Duration
Quiz 2 and Agile Recap 15 minutes
Software Metrics 60 minutes
*** Break 15 minutes
Current Event Reports 30 minutes
Software Metrics (cont.) 60 minutes
Today’s Agenda

8
Why Measure?
“You can’t control what you can’t measure” (Tom Demarco) “You can’t understand . . . “You can’t improve . . .
“Show me how you will measure me, and I will show you how I will perform” (Eli Goldratt)

9
Scope of our discussion
Director - IS/IT
Manager, Systems Development &
Maintenance
Manager,Computer Operations
FinancialSystems
ManufacturingSystems
Customer FulfillmentSystems
Our
focu
s
Sample IT Organization
10
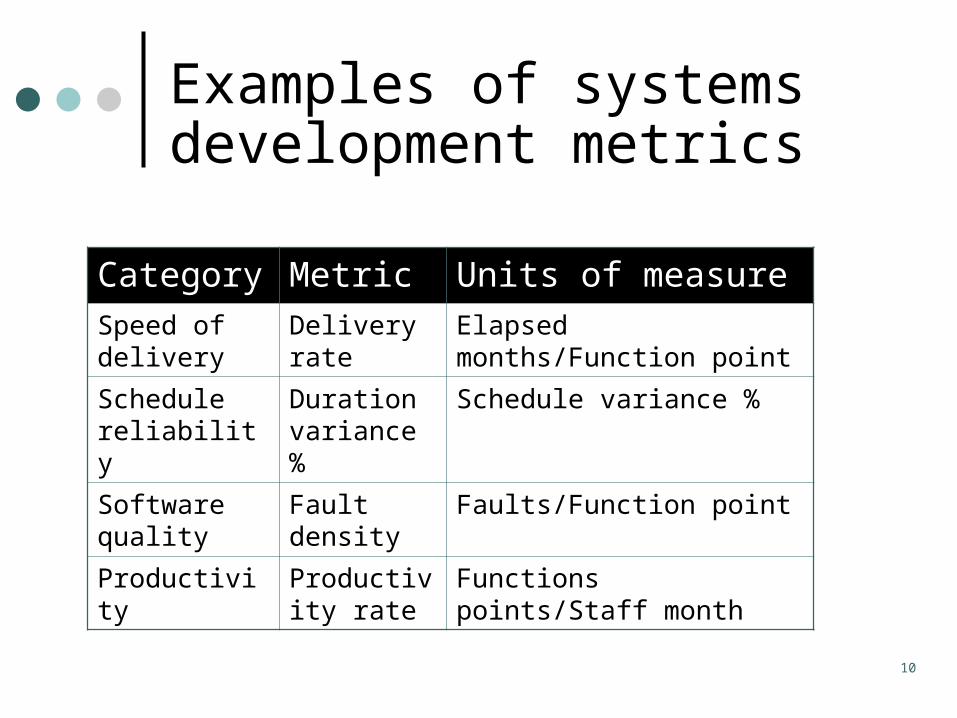
Examples of systems development metrics
Category Metric Units of measureSpeed of delivery
Delivery rate
Elapsed months/Function point
Schedule reliability
Duration variance %
Schedule variance %
Software quality
Fault density
Faults/Function point
Productivity Productivity rate
Functions points/Staff month
11
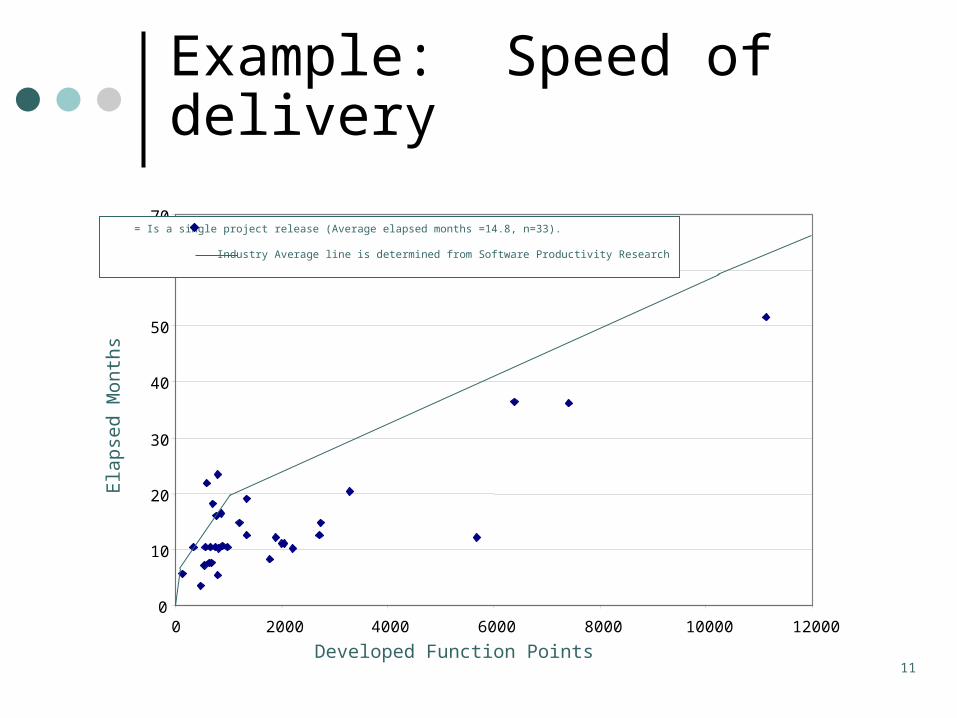
Example: Speed of delivery
0
10
20
30
40
50
60
70
0 2000 4000 6000 8000 10000 12000
Developed Function Points
Ela
pse
d M
onth
s
= Is a single project release (Average elapsed months =14.8, n=33).
Industry Average line is determined from Software Productivity Research

12
Function Points
Function Points (FP) are a language- and technology-independent measure of application size
Two flavors: Delivered size = total application size delivered, including
packages, assets, etc. Developed size = portion built for the release
Takes into account: Inputs Outputs Inquiries Table updates External interfaces
1 Function Point ≈ 100 lines of Cobol

13
Example: Schedule reliability
0%
10%
20%
30%
40%
50%
60%
2000 4000 6000 8000 10000 12000
Developed Function Points
Sch
edu
le V
aria
nce
abo
ve c
omm
itmen
t
= Is a single project release (n=33).
Industry Average line is determined from Software Productivity Research

14
Example: Software quality
0
1000
2000
3000
4000
5000
6000
7000
0 2000 4000 6000 8000 10000 12000
Developed Function Points
Fau
lts (
3 m
onth
s)
Faults reported over the first three months in operations (n=27) An estimated industry average for faults found in the first three months of operations. The assumption is that half the total faults are found in the first three months in operation. This average is one half of the industry average of the total faults from C. Jones, Applied Software Measurement, 1996, p.232.
15
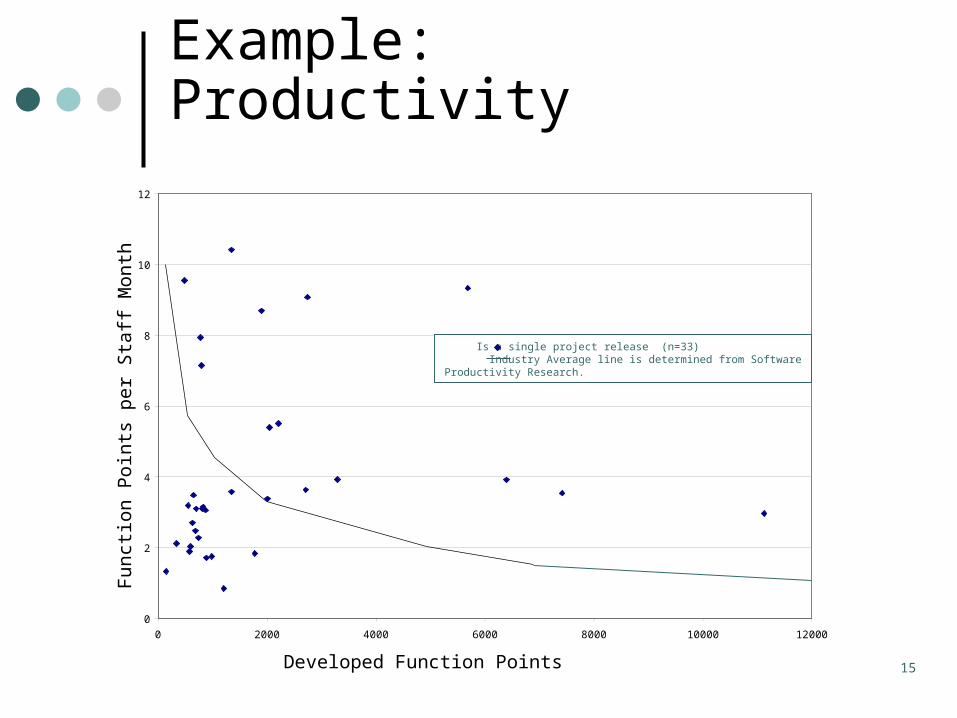
Example: Productivity
0
2
4
6
8
10
12
0 2000 4000 6000 8000 10000 12000
Developed Function Points
Fun
ctio
n P
oint
s pe
r S
taff
Mon
th
Is a single project release (n=33) Industry Average line is determined from SoftwareProductivity Research.

16
Objectives of Software Measurement

17
Hawthorne Effect
Famous study conducted in the Hawthorne plant of General Electric Corporation
Plant managers implemented changes in working conditions and recorded data on the plant’s production output
They found that production increased no matter what changes in working conditions they implemented!
What does this example reveal about how people act when they know that an experiment is being conducted?

18
Goal Question Metric
Goal 1 Goal 2
Question QuestionQuestion Question Question
Metric MetricMetric Metric Metric Metric

19
Goal Question Metric
Technique for identifying suitable measurements to collect Assumption: It is only worthwhile measuring
things to satisfy goals Goals are desired end states Questions identify the information needs
associated with goals, help determine whether or not goals are being met
Metrics are specific items that can be measured to answer the questions

20
GQM Example (High Level)
Improve systems delivery performanceGoal
What is the qualityof our deliverable? How predictable is
our process?How quickly do we deliver?
How efficient are we?
Question
MetricFault density Delivery rate Productivity rate Duration variance
percentage

21
Topic Duration
Quiz 2 and Agile Recap 15 minutes
Software Metrics 60 minutes
*** Break 15 minutes
Current Event Reports 30 minutes
Software Metrics (cont.) 60 minutes
Today’s Agenda

22
Topic Duration
Quiz 2 and Agile Recap 15 minutes
Software Metrics 60 minutes
*** Break 15 minutes
Current Event Reports 30 minutes
Software Metrics (cont.) 60 minutes
Today’s Agenda
23
Topic Duration
Quiz 2 and Agile Recap 15 minutes
Software Metrics 60 minutes
*** Break 15 minutes
Current Event Reports 30 minutes
Software Metrics (cont.) 60 minutes
Today’s Agenda

24
Measurement and Continuous Improvement
Continuous Improvement Measurement
Focuses program objectives Enables tracking of improvement
progress Enables communication of program
benefit
Clarifies measurement’s purpose and role Clarifies which measures to collect Provides a mechanism for acting on
findings Enables top-to-bottom organizational
support

25
Continuous Process Improvement
Approach to Quality and Measurement
Plan
Do
Check
Act
1. Identify performance standards and goals
2. Measure project performance
3. Compare metrics against goals
4. Eliminate causes of deficient performance- fix defects- fix root causes

26
Metrics Program Change Plan
QUALITY MANAGEMENT
Enable
Change
Technology
Process
People
Metrics Awareness Education
Metrics Network
Vital Few Metrics Definitions Vital Few Metrics Implementation
Technology Strategy
KM Support for Measurement Community of Practice
Measurement Process Improvement
Large Project Network
Metrics Strategy Commitment / Ownership
Distributed Support Units
Metrics Repository and tools
Measurement Process Definition
Roles & Responsibilities
PROGRAM MANAGEMENT
Achieve-1
Change
Sustain
Change
Achieve-2
Change
Metrics Rollout Education/Training
Pilot Project Group
Ongoing Metrics Education / Training
System Building Improvement Goals
Metrics Definition & Implementation for Delivery Centers
Metrics Embedded in System Building Methods
Dashboard metrics Implementation
Pilot Selected Projectsand Selected Delivery Centers
Enable Large Projectsand Remaining Centers

27
Measurement Program Mortality
Most programs fail, usually within 2 years
Number of companies
400
350
300
250
200
150
100
50
0
1980 1981 1982 1983 1984 1985 1986 1987 1988 1989 1990 1991
Year
Cumulative startsCumulative successes
28
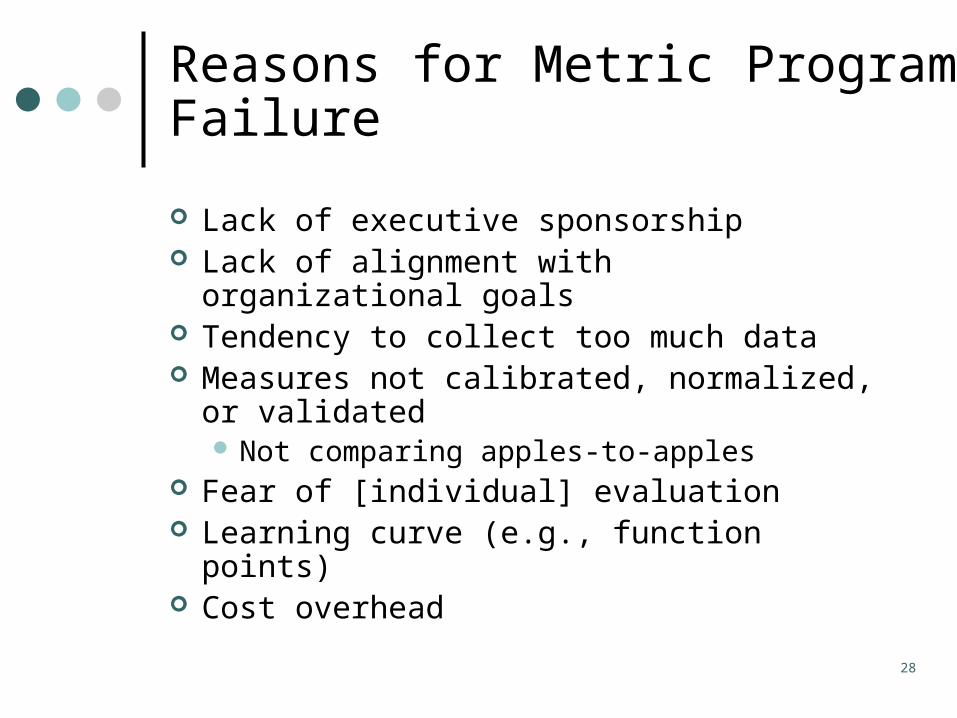
Reasons for Metric Program Failure
Lack of executive sponsorship Lack of alignment with organizational goals Tendency to collect too much data Measures not calibrated, normalized, or
validated Not comparing apples-to-apples
Fear of [individual] evaluation Learning curve (e.g., function points) Cost overhead

29
Key Success Factors
Ensure that measurement is part of something larger, typically performance improvement “Trojan Horse” strategy Ensure alignment with organizational goals
Start small, iterate Strongly recommend doing a pilot test
Automate capture of metrics data Rigorously define a limited, balanced set of metrics
“Vital Few” Portfolio approach Comparability
Aggregate appropriately Focus should be on processes, not individuals
Obtain [visible] executive sponsorship Understand and address the behavioral implications
30
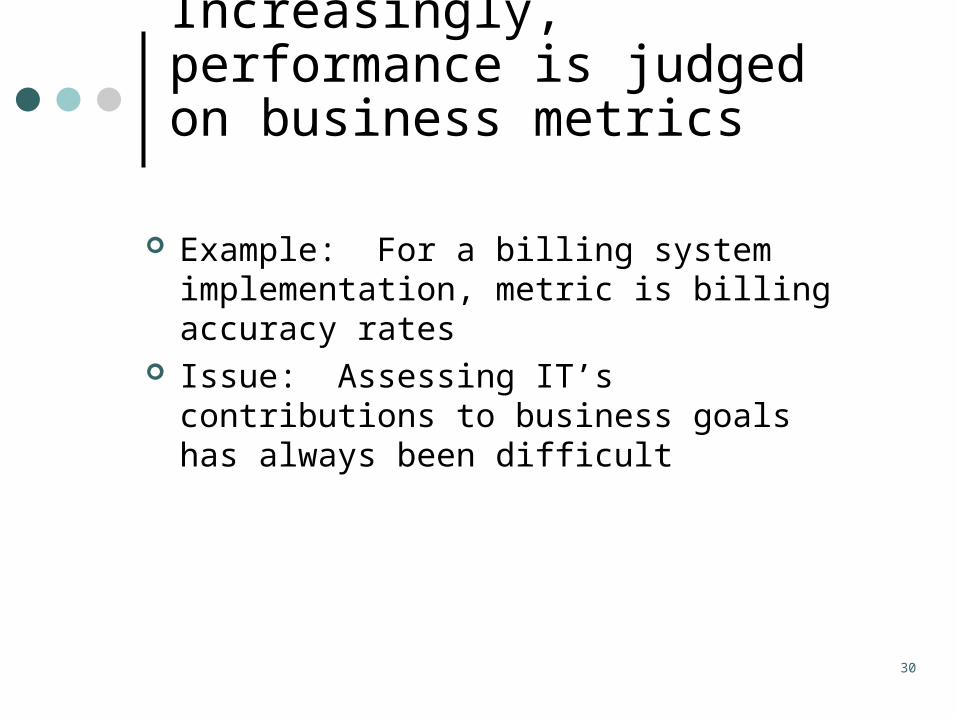
Increasingly, performance is judged on business metrics
Example: For a billing system implementation, metric is billing accuracy rates
Issue: Assessing IT’s contributions to business goals has always been difficult
31
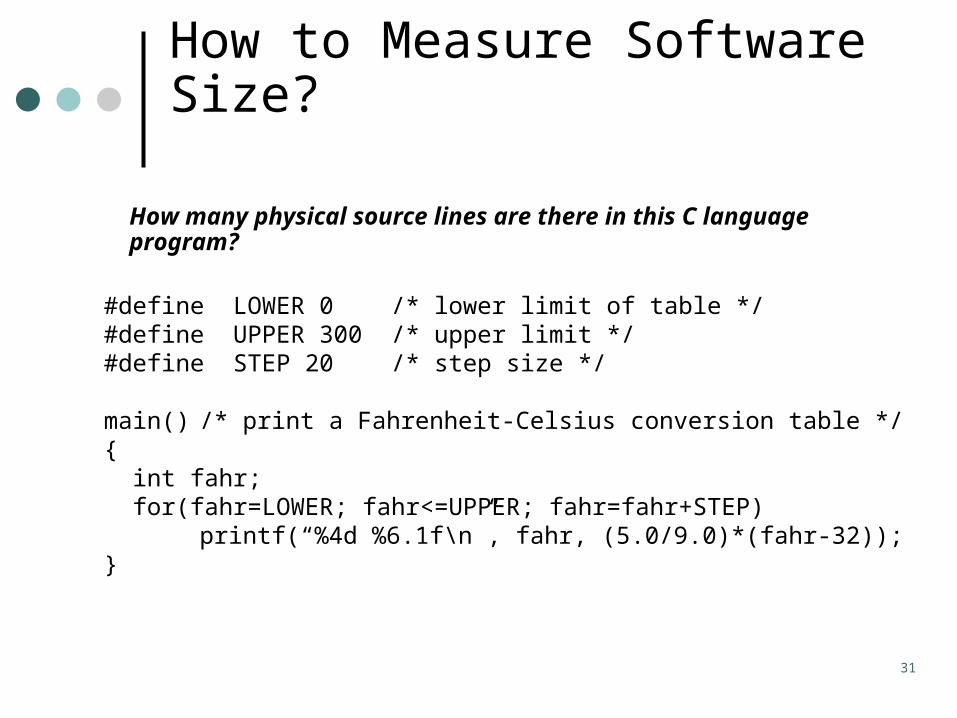
How to Measure Software Size?
How many physical source lines are there in this C language program?
#define LOWER 0 /* lower limit of table */#define UPPER 300 /* upper limit */#define STEP 20 /* step size */
main() /* print a Fahrenheit-Celsius conversion table */{ int fahr; for(fahr=LOWER; fahr<=UPPER; fahr=fahr+STEP)
printf(“%4d %6.1f\n”, fahr, (5.0/9.0)*(fahr-32));}
32
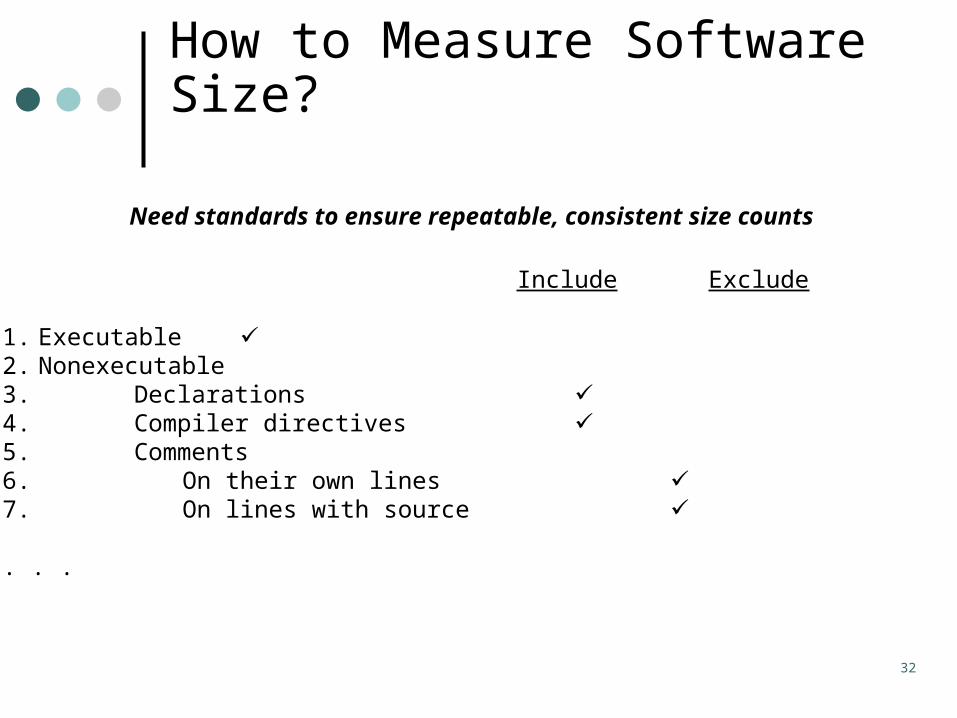
How to Measure Software Size?
Need standards to ensure repeatable, consistent size counts
Include Exclude
1. Executable 2. Nonexecutable3. Declarations 4. Compiler directives 5. Comments6. On their own lines 7. On lines with source
. . .

33
How to Measure Software Size?
“Lines of code is a useless measurement in the face of code that shrinks when we learn better ways of programming” (Beck, p.42)

34
How to Measure Hours?
Include Exclude
OvertimeCompensated (paid)Uncompensated (unpaid)
ContractTemporary employees SubcontractorConsultant
ManagementTest personnelSoftware quality assurance
. . .

35
Other Quotes
“Count what is countable, measure what is measurable, and what is not measurable,
make measurable”
Galileo

36
Other Quotes
“Anything that can’t be measured doesn’t exist”
Locke, Berkeley, Hume (Beck, p.45)

37
Other Quotes
“In God we trust – All others must bring data”
W. Edwards Deming

38
Measurement and CMM
Measurement supports each maturity level
Pro
cess
mat
uri
ty l
eve
l
Pro
jec
tfo
cu
s
Pro
du
ct
foc
us
Pro
ce
ss
foc
us
Pro
ce
ss
imp
rov
em
en
tfo
cu
s
Optimizing
Managed
Defined
Repeatable
Initial