Embed Size (px)
Citation preview
James T. Bond
Ellen Galinsky
Stacy S. Kim
Erin Brownfield
Funded by
the Alfred P. S loan Foundat ion
Corporate Benefactors$15,000 or moreCeridianGlaxoSmithKlineIBM CorporationJohnson & JohnsonJPMorgan Chase
KPMG LLPMerck & Co., Inc.Morgan StanleyPfizer Inc
Families and Work Institute’s
Corporate Patrons$10,000–$14,999CitigroupDeloitte & Touche, LLP
Eli Lilly and Company
Corporate Sponsors$5,000–$9,999AccentureAetna Inc.Allstate Insurance CompanyAT&TBright Horizons Family SolutionsChevronTexaco CorporationCIGNA CorporationCIT Group Inc.Discovery Communications, Inc.Ernst & Young LLPFord Motor Company
Goldman, Sachs & Co.Hallmark Cards, Inc.Knowledge Learning CorporationLehman Brothers Inc.Marriott InternationalPricewaterhouseCoopersProvidian FinancialPrudential FinancialTime WarnerVerizon CommunicationsXerox Corporation
Corporate Friends$3,000–$4,999Baxter Healthcare CorporationCisco Systems, Inc.Eileen Fisher, Inc.First Horizon National CorporationHilton Hotels Corporation
RBC Financial GroupTexas InstrumentsViacom Inc.WFD Consulting
As of September 6, 2005
INTRODUCTION
Families and Work Institute’s 2005 National Study of Employers (NSE) is one of the mostcomprehensive and far-reaching study of the practices, policies, programs and benefits pro-vided by U.S. employers to address the changing needs of today’s workforce and workplace.Because this study was designed to build on the Institute’s landmark 1998 Business Work-Life Study (BWLS), it is therefore able to provide trend data on changes that have occurredover the past seven years.
The 1998 BWLS was one of the first and most complete studies of how U.S. organizations areresponding to the changing needs of the nation’s workforce and workplace. It surveyed anationally representative group of employers with 100 or more employees.1
The National Study of Employers, funded by the Alfred P. Sloan Foundation, will provideongoing measurements of employer work life benefits, policies, and practices. In 2005, it wasredesigned to include a nationally representative sample of employers with 50 or moreemployees and will be repeated next in 2007. The 2005 NSE sample included 1,092 employerswith 50 or more employees—66 percent are for-profit companies and 34 percent are non-profit organizations; 44 percent operate at only one location, while 56 percent have opera-tions at more than one location.2
Although there are similar surveys by employer membership organizations, consulting firms,nonprofits and government agencies, the NSE is notable in that it is the only study of employ-ers in the United States that comprehensively assesses work life issues for a nationally repre-sentative group of employers and that can compare these findings with similar questionsasked of employers. Both the 1998 BWLS and 2005 NSE were developed to complementFamilies and Work Institute’s ongoing National Study of the Changing Workforce (NSCW),which interviews large representative samples of employees in the U.S. labor force. In both
1
1 The BWLS surveyed a representative national sample of 1,057 for-profit (84 percent of the sample) and not-for-profitcompanies (16 percent of the sample) with 100 or more employees by telephone interviews with human resource direc-tors. Harris Interactive staff conducted the interviews. Employers were selected from Dun & Bradstreet lists, using a stratified random sampling procedure in which selection was proportional to the number of people employed by eachcompany to ensure a large enough sample of large organizations. The response rate was 45 percent, based on the per-centage of all companies on the call-list that completed interviews. When analyzing data to make generalizations aboutthe universe of organizations with 100 or more employees in the U.S., the sample was weighted to the distribution ofcompanies of different sizes in the U.S. The questionnaire was developed to complement the Families and WorkInstitute's 1997 National Study of the Changing Workforce (NSCW), which surveyed a representative national sample of employees in the U.S. labor force.
2 The 2005 NSE surveyed a representative national sample of 1,092 for-profit and not-for-profit companies with 50 ormore employees using telephone interviews with human resource directors. Harris Interactive staff conducted the inter-views from September 23, 2004 to April 5, 2005. Employers were selected from Dun & Bradstreet lists, using a stratifiedrandom sampling procedure in which selection was proportional to the number of people employed by each company toensure a large enough sample of large organizations. The response rate was 38 percent, based on the percentage of allcompanies on the call-list that completed interviews. Considerable effort was made to achieve a response rate equal toor better than that obtained in 1998 (45%) that included offering a $50 incentive to company representatives, many callbacks over an extended interview period, and special efforts to convert refusals and complete partial interviews. Despitethese efforts, we were unable to achieve the 1998 response level. The problem of relatively low response rates is growingin survey research involving both individuals and organizations However, because of our efforts, we have achieved a muchbetter response rate that the 10 – 20 percent rate that is typical of organizational research today. When analyzing data tomake generalizations about the universe of organizations with 50 or more employees in the U.S., the sample was weight-ed to the distribution of companies of different sizes in the U.S. The questionnaire was developed to complement theFamilies and Work Institute's 2002 National Study of the Changing Workforce (NSCW), which surveyed a representativenational sample of employees in the U.S. labor force.
the 1997 and 2002 NSCW, we found that, among other things, employees in more effectiveand flexible workplaces are more likely than other workers to have:
• greater engagement in their jobs;
• higher levels of job satisfaction;
• stronger intentions to remain with their companies;
• less negative and stressful spillover from job to home;
• less negative spillover from home to job; and
• better mental health.
These findings reveal that both employers and employees can benefit from effective and flexible workplaces. Employees benefit from having higher quality jobs and more supportiveworkplaces that are less likely to negatively affect their personal and family lives, whileemployers benefit from having more engaged employees, higher retention, and potentiallylower health care costs.
The 2005 NSE enables us to assess the extent to which businesses are addressing a numberof the factors we have identified as predictive of workers’ productivity and well-being. In thisreport, we address three questions:
1. Prevalence: What practices, policies, programs and benefits do employers provide toaddress the personal and family needs of employees? It is important to note that thisstudy does not ask employers to report on whether they have “written policies” butrather whether their organization “allows employees to…” or “provides the followingbenefits or programs…” This wording is used for two reasons. First, employers may havewritten policies but not “allow” employees to use them. Second, smaller employers areless likely to have written policies than larger ones. Thus, this wording enables the NSEto obtain the most realistic picture of how employers are addressing the needs of thechanging work force and workplace today, because it includes formal policies for workingflexibly as well as a culture of flexibility where employers address their needs andemployees’ needs.
2. Small vs. Large Employers: How do small employers (those with 50 – 99 employeesnationwide) compare with large employers (those with 1,000 or more employees nation-wide) in providing these benefits, policies, and practices? To simplify the presentationand interpretation of employer-size comparisons, we exclude medium-size employers(100 – 999 employees nationwide) from the comparisons reported below. Supplementalanalyses indicate that in almost every case, the responses of medium-size employers fallbetween those of small and large employers.3
3. Trends from 1998 to 2005: To what extent have employers changed between 1998 and2005 in the provision of select practices, policies, programs and benefits?
2
3 This is to say that the relationships between employer size and the provision of particular benefits, policies, andpractices are almost always linear.
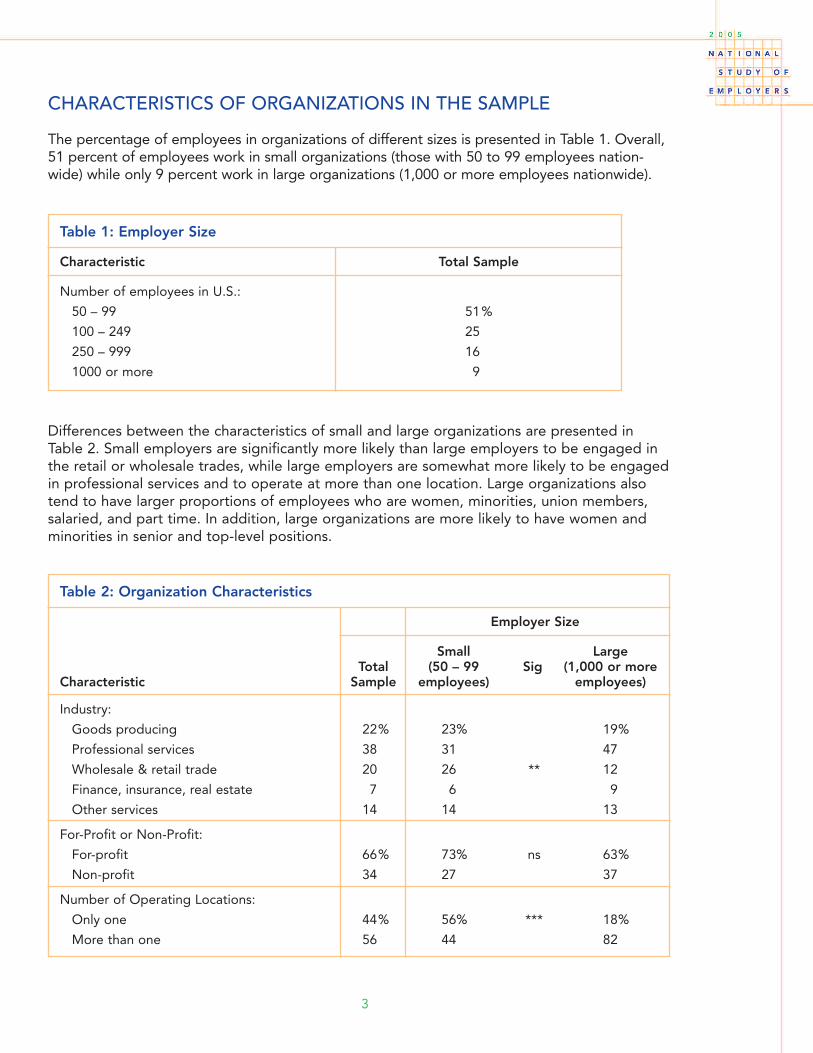
CHARACTERISTICS OF ORGANIZATIONS IN THE SAMPLE
The percentage of employees in organizations of different sizes is presented in Table 1. Overall,51 percent of employees work in small organizations (those with 50 to 99 employees nation-wide) while only 9 percent work in large organizations (1,000 or more employees nationwide).
3
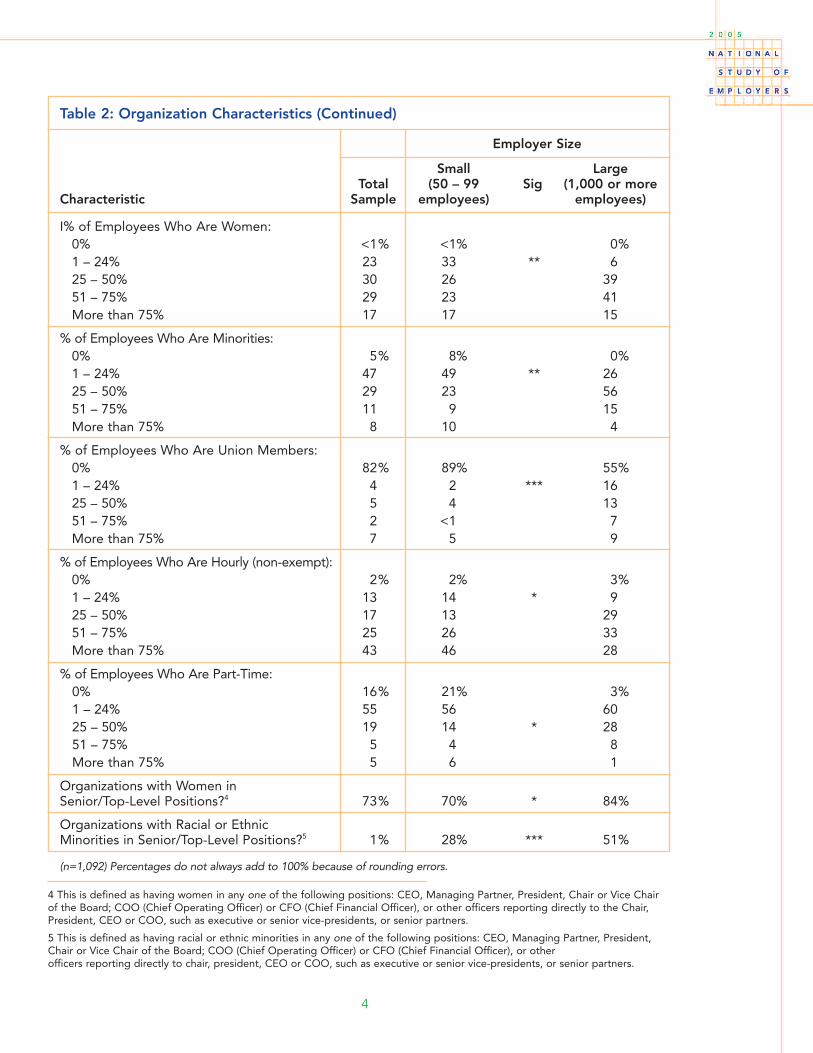
Differences between the characteristics of small and large organizations are presented inTable 2. Small employers are significantly more likely than large employers to be engaged inthe retail or wholesale trades, while large employers are somewhat more likely to be engagedin professional services and to operate at more than one location. Large organizations alsotend to have larger proportions of employees who are women, minorities, union members,salaried, and part time. In addition, large organizations are more likely to have women andminorities in senior and top-level positions.
Table 1: Employer Size
Characteristic Total Sample
Number of employees in U.S.:
50 – 99 51%
100 – 249 25
250 – 999 16
1000 or more 9
Table 2: Organization Characteristics
Employer Size
Small LargeTotal (50 – 99 Sig (1,000 or more
Characteristic Sample employees) employees)
Industry:
Goods producing 22% 23% 19%
Professional services 38 31 47
Wholesale & retail trade 20 26 ** 12
Finance, insurance, real estate 7 6 9
Other services 14 14 13
For-Profit or Non-Profit:
For-profit 66% 73% ns 63%
Non-profit 34 27 37
Number of Operating Locations:
Only one 44% 56% *** 18%
More than one 56 44 82
4
Table 2: Organization Characteristics (Continued)
Employer Size
Small LargeTotal (50 – 99 Sig (1,000 or more
Characteristic Sample employees) employees)
I% of Employees Who Are Women:0% <1% <1% 0%1 – 24% 23 33 ** 625 – 50% 30 26 3951 – 75% 29 23 41More than 75% 17 17 15
% of Employees Who Are Minorities:0% 5% 8% 0%1 – 24% 47 49 ** 2625 – 50% 29 23 5651 – 75% 11 9 15More than 75% 8 10 4
% of Employees Who Are Union Members:0% 82% 89% 55%1 – 24% 4 2 *** 1625 – 50% 5 4 1351 – 75% 2 <1 7More than 75% 7 5 9
% of Employees Who Are Hourly (non-exempt):0% 2% 2% 3%1 – 24% 13 14 * 925 – 50% 17 13 2951 – 75% 25 26 33More than 75% 43 46 28
% of Employees Who Are Part-Time:0% 16% 21% 3%1 – 24% 55 56 6025 – 50% 19 14 * 2851 – 75% 5 4 8More than 75% 5 6 1
Organizations with Women in Senior/Top-Level Positions?4 73% 70% * 84%
Organizations with Racial or Ethnic Minorities in Senior/Top-Level Positions?5 1% 28% *** 51%
4 This is defined as having women in any one of the following positions: CEO, Managing Partner, President, Chair or Vice Chairof the Board; COO (Chief Operating Officer) or CFO (Chief Financial Officer), or other officers reporting directly to the Chair,President, CEO or COO, such as executive or senior vice-presidents, or senior partners.
5 This is defined as having racial or ethnic minorities in any one of the following positions: CEO, Managing Partner, President,Chair or Vice Chair of the Board; COO (Chief Operating Officer) or CFO (Chief Financial Officer), or other officers reporting directly to chair, president, CEO or COO, such as executive or senior vice-presidents, or senior partners.
(n=1,092) Percentages do not always add to 100% because of rounding errors.
TO WHAT EXTENT DO EMPLOYERS PROVIDE IMPORTANT SUPPORTSTO EMPLOYEES AND THEIR FAMILIES, AND HOW DO THESE DIFFERBY EMPLOYER SIZE AND OVER TIME?
Flexibility
In some other surveys, flexibility is defined primarily as flextime: allowing employees tochange their daily arrival and departure times. That was a relevant definition in the late 20thcentury, but not in the 21st century. Furthermore, this limited definition has sometimes led to the erroneous conclusion that flexibility is decreasing, when, in fact, our studies show theopposite. The NSE is notable for defining flexibility in ways that reflect the growing diversityof working flexibly in companies today.
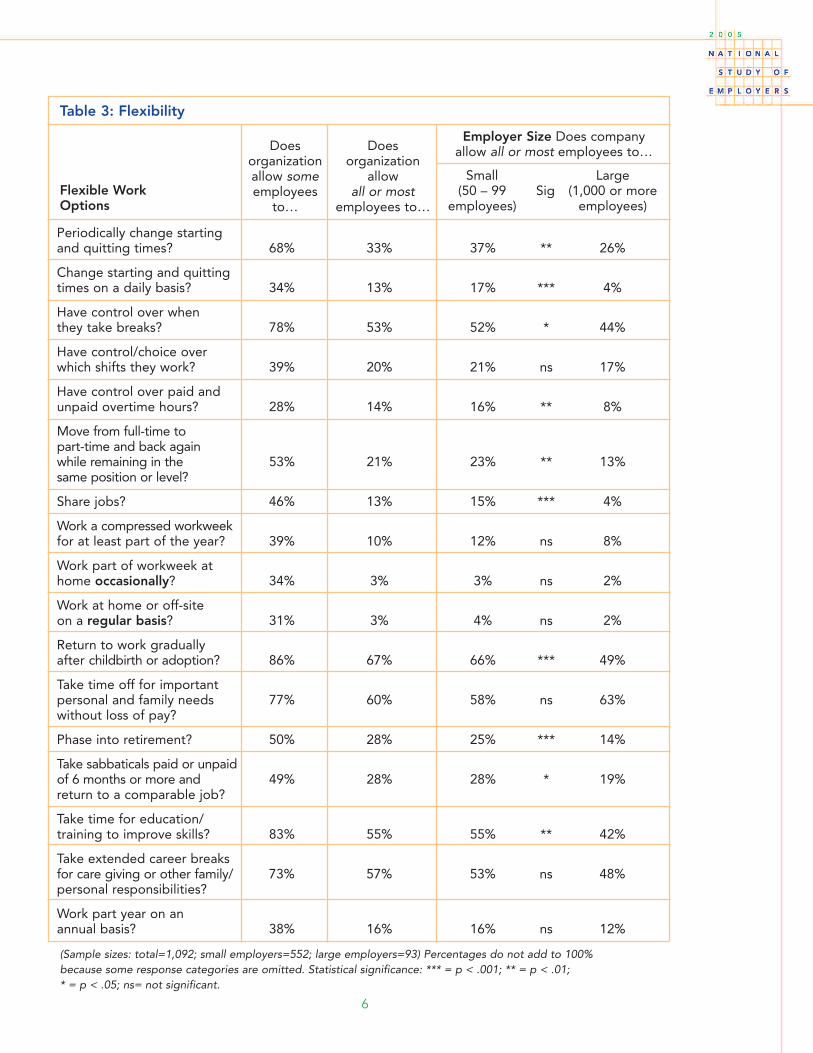
Prevalence: Of the 17 options for working flexibly we consider in this report (Table 3),employers with 50 or more employees most frequently allow at least some workers to returnto work gradually after leaves for childbirth and adoption (86%) and to take time off for edu-cation or training to improve job skills (83%). They are next most likely to allow at least someemployees to have control over when they take breaks (78%), take time off for important family and personal needs without loss of pay (77%), and take extended career breaks forcare giving or other family and personal responsibilities (73%).
The proportion of employers offering these same options for working flexibly to all or mostworkers is significantly lower—from 67 to 3 percent. On average, the proportion of employersoffering flexible work options to all or most employees is 24 percentage points lower than theproportion who offer the same options to some employees. Again, a gradual return to workafter childbirth or adoption is the most prevalent option (67%), while work-at-home optionsare least likely to be offered to all or most workers (3%).
Small vs. Large Employers: As stated earlier, we define small employers as those with 50 – 99 employees nationwide and large employers as those with 1,000 or more employeesnationwide. Medium-size employers with 100 – 999 employees nationwide are excluded from these analyses as discussed on page 2 of the Introduction to this report. The rightmostcolumns in Table 3 show the percentages of small and large employers that offer various waysof working flexibly to all or most of their employees. Tests of statistical significance for thecomparisons are reported in the center column, between the percentages for the two groups.
Perhaps quite surprisingly, in most instances, small employers are significantly more likely tooffer flexibility to all or most employees than employers of other sizes, and in no instance arethey significantly less likely to offer these options. This is, in our view, a very important find-ing. Much attention is paid to the progressive actions of very large employers in the U.S. This study provides new and refreshing evidence that the small employers in our economymay, in fact, provide more flexibility than their large counterparts, presumably out of a first-hand understanding of the effectiveness of doing so in order to make work “work” for boththe employer and the employees.
5
6
Periodically change starting and quitting times? 68% 33% 37% ** 26%
Change starting and quitting times on a daily basis? 34% 13% 17% *** 4%
Have control over when they take breaks? 78% 53% 52% * 44%
Have control/choice over which shifts they work? 39% 20% 21% ns 17%
Have control over paid and unpaid overtime hours? 28% 14% 16% ** 8%
Move from full-time to part-time and back again while remaining in the 53% 21% 23% ** 13%same position or level?
Share jobs? 46% 13% 15% *** 4%
Work a compressed workweekfor at least part of the year? 39% 10% 12% ns 8%
Work part of workweek athome occasionally? 34% 3% 3% ns 2%
Work at home or off-site on a regular basis? 31% 3% 4% ns 2%
Return to work gradually after childbirth or adoption? 86% 67% 66% *** 49%
Take time off for important personal and family needs 77% 60% 58% ns 63%without loss of pay?
Phase into retirement? 50% 28% 25% *** 14%
Take sabbaticals paid or unpaid of 6 months or more and 49% 28% 28% * 19%return to a comparable job?
Take time for education/training to improve skills? 83% 55% 55% ** 42%
Take extended career breaks for care giving or other family/ 73% 57% 53% ns 48%personal responsibilities?
Work part year on an annual basis? 38% 16% 16% ns 12%
Table 3: Flexibility
Flexible WorkOptions
Does organizationallow someemployees
to…
Does organization
allow all or most
employees to…
Employer Size Does companyallow all or most employees to…
Small Large(50 – 99 Sig (1,000 or more
employees) employees)
(Sample sizes: total=1,092; small employers=552; large employers=93) Percentages do not add to 100%because some response categories are omitted. Statistical significance: *** = p < .001; ** = p < .01; * = p < .05; ns= not significant.
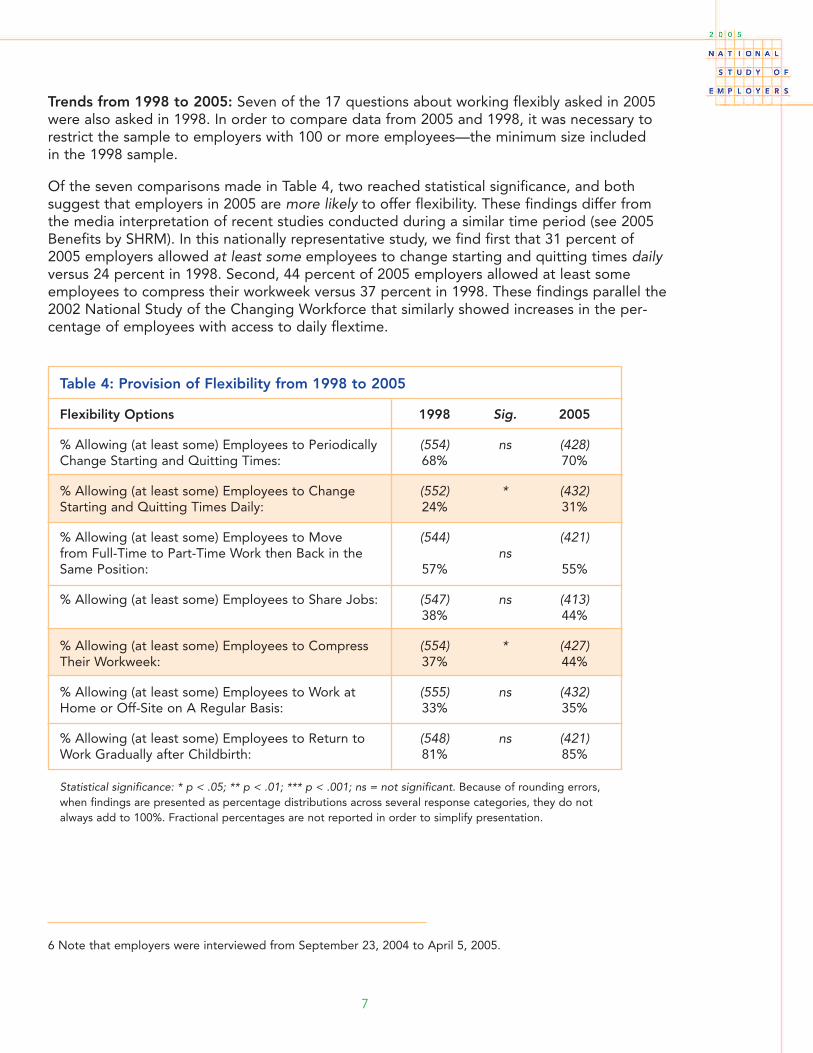
Trends from 1998 to 2005: Seven of the 17 questions about working flexibly asked in 2005were also asked in 1998. In order to compare data from 2005 and 1998, it was necessary torestrict the sample to employers with 100 or more employees—the minimum size included in the 1998 sample.
Of the seven comparisons made in Table 4, two reached statistical significance, and both suggest that employers in 2005 are more likely to offer flexibility. These findings differ fromthe media interpretation of recent studies conducted during a similar time period (see 2005Benefits by SHRM). In this nationally representative study, we find first that 31 percent of2005 employers allowed at least some employees to change starting and quitting times dailyversus 24 percent in 1998. Second, 44 percent of 2005 employers allowed at least someemployees to compress their workweek versus 37 percent in 1998. These findings parallel the2002 National Study of the Changing Workforce that similarly showed increases in the per-centage of employees with access to daily flextime.
7
6 Note that employers were interviewed from September 23, 2004 to April 5, 2005.
Table 4: Provision of Flexibility from 1998 to 2005
Flexibility Options 1998 Sig. 2005
% Allowing (at least some) Employees to Periodically (554) ns (428)Change Starting and Quitting Times: 68% 70%
% Allowing (at least some) Employees to Change (552) * (432)Starting and Quitting Times Daily: 24% 31%
% Allowing (at least some) Employees to Move (544) (421)from Full-Time to Part-Time Work then Back in the nsSame Position: 57% 55%
% Allowing (at least some) Employees to Share Jobs: (547) ns (413)38% 44%
% Allowing (at least some) Employees to Compress (554) * (427)Their Workweek: 37% 44%
% Allowing (at least some) Employees to Work at (555) ns (432)Home or Off-Site on A Regular Basis: 33% 35%
% Allowing (at least some) Employees to Return to (548) ns (421)Work Gradually after Childbirth: 81% 85%
Statistical significance: * p < .05; ** p < .01; *** p < .001; ns = not significant. Because of rounding errors,when findings are presented as percentage distributions across several response categories, they do notalways add to 100%. Fractional percentages are not reported in order to simplify presentation.
Discussion: Because of the importance of the finding that small organizations were more likely to provide flexibility, we decided to look at data from our nationally representativestudy of employees, conducted three years ago in 2002, the National Study of the ChangingWorkforce. Surprisingly, we did not find employees who worked for small organizationsreporting that they were any more likely to have access to flexibility than those who workedfor larger organizations except in two cases—taking breaks and working a compressed work-week—where employees in large organizations were slightly more likely to have access. When we constructed an overall scale of access to various kinds of flexibility, there were no differences for employees in different-sized organizations.
We wondered why there is an apparent discrepancy between what employers and employeesreport. Perhaps things have changed in the several years since we conducted the NSCW. Orperhaps employees in smaller organizations have greater access to what we term a culture offlexibility, meaning that their supervisors are more supportive when work life issues arise andthey also see the workplace as more supportive of having a job and having a life.
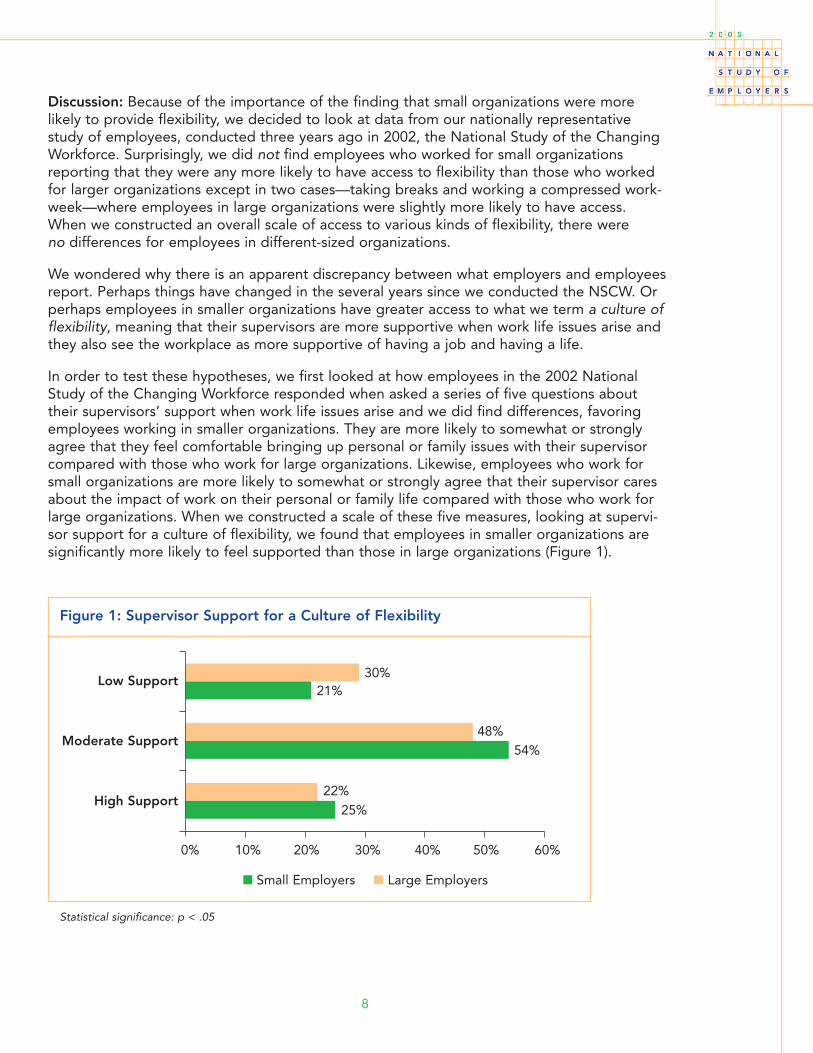
In order to test these hypotheses, we first looked at how employees in the 2002 NationalStudy of the Changing Workforce responded when asked a series of five questions abouttheir supervisors’ support when work life issues arise and we did find differences, favoringemployees working in smaller organizations. They are more likely to somewhat or stronglyagree that they feel comfortable bringing up personal or family issues with their supervisorcompared with those who work for large organizations. Likewise, employees who work forsmall organizations are more likely to somewhat or strongly agree that their supervisor caresabout the impact of work on their personal or family life compared with those who work forlarge organizations. When we constructed a scale of these five measures, looking at supervi-sor support for a culture of flexibility, we found that employees in smaller organizations aresignificantly more likely to feel supported than those in large organizations (Figure 1).
8
Statistical significance: p < .05
Small Employers Large Employers
Figure 1: Supervisor Support for a Culture of Flexibility
Low Support
Moderate Support
High Support
0% 10% 20% 30% 40% 50% 60%
21%
54%
25%
48%
30%
22%
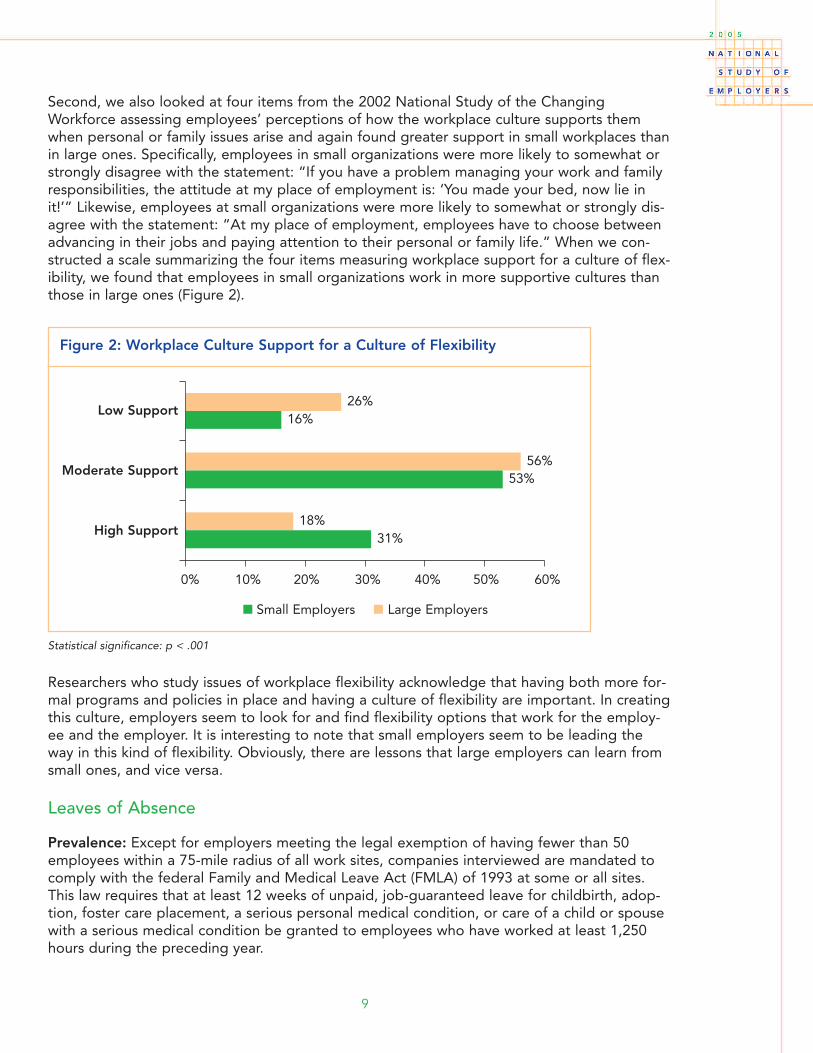
Second, we also looked at four items from the 2002 National Study of the ChangingWorkforce assessing employees’ perceptions of how the workplace culture supports themwhen personal or family issues arise and again found greater support in small workplaces thanin large ones. Specifically, employees in small organizations were more likely to somewhat orstrongly disagree with the statement: “If you have a problem managing your work and familyresponsibilities, the attitude at my place of employment is: ‘You made your bed, now lie init!’” Likewise, employees at small organizations were more likely to somewhat or strongly dis-agree with the statement: “At my place of employment, employees have to choose betweenadvancing in their jobs and paying attention to their personal or family life.” When we con-structed a scale summarizing the four items measuring workplace support for a culture of flex-ibility, we found that employees in small organizations work in more supportive cultures thanthose in large ones (Figure 2).
9
Statistical significance: p < .001
Researchers who study issues of workplace flexibility acknowledge that having both more for-mal programs and policies in place and having a culture of flexibility are important. In creatingthis culture, employers seem to look for and find flexibility options that work for the employ-ee and the employer. It is interesting to note that small employers seem to be leading theway in this kind of flexibility. Obviously, there are lessons that large employers can learn fromsmall ones, and vice versa.
Leaves of Absence
Prevalence: Except for employers meeting the legal exemption of having fewer than 50employees within a 75-mile radius of all work sites, companies interviewed are mandated tocomply with the federal Family and Medical Leave Act (FMLA) of 1993 at some or all sites.This law requires that at least 12 weeks of unpaid, job-guaranteed leave for childbirth, adop-tion, foster care placement, a serious personal medical condition, or care of a child or spousewith a serious medical condition be granted to employees who have worked at least 1,250hours during the preceding year.
Small Employers Large Employers
Figure 2: Workplace Culture Support for a Culture of Flexibility
Low Support
Moderate Support
High Support
0% 10% 20% 30% 40% 50% 60%
16%
53%
31%
56%
26%
18%
Small vs. Large Employers: Small employers are significantly less likely—31 percent— to pro-vide at least 12 weeks of family and medical leave than others. Of course, some proportion ofsmall employers (a proportion that unfortunately cannot be calculated from NSE data) isexempt from provisions of the FMLA by virtue of having fewer than 50 employees at any onelocation within a 75-mile radius. However, it is surprising that 30 percent of employers thathave 50 – 99 employees at a single location, and are therefore covered by the FMLA, reportoffering fewer than 12 weeks of family leave. Perhaps some of these employers are simplyunaware of their responsibilities under the federal FMLA, while others may deliberately vio-late the law. NSE data do not enable us to further address this issue.
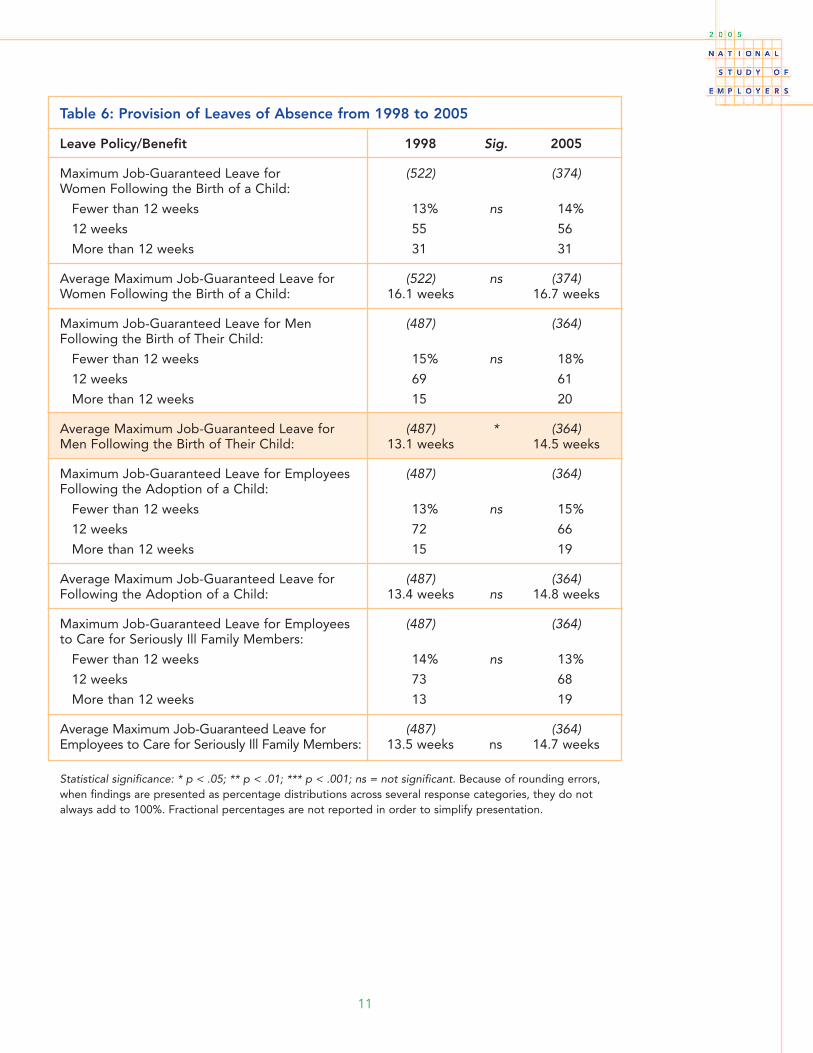
Trends from 1998 to 2005: When we compare the provision of leaves by employers with 100or more employees in 1998 and 2005, we find only one change (Table 6). Despite a morevolatile economy, employers have not cut back on providing leaves to employees—probablybecause the federal Family and Medical Leave Act sets a minimum requirement for mostemployers in our sample. The one significant change concerns men, where the average maxi-mum job-guaranteed leave has increased somewhat from 13.1 weeks in 1998 to 14.5 weeks in2005. Data from the NSE do not reveal whether fathers are actually taking more leave forpaternity today than in 1998. However, we do know from the 2002 National Study of theChanging Workforce that fathers, particularly young fathers, are spending more time withtheir children than fathers did in the past. The observed increase in paternity leave might be a response to changes in the attitudes and behaviors of male employees as caregivers.
10
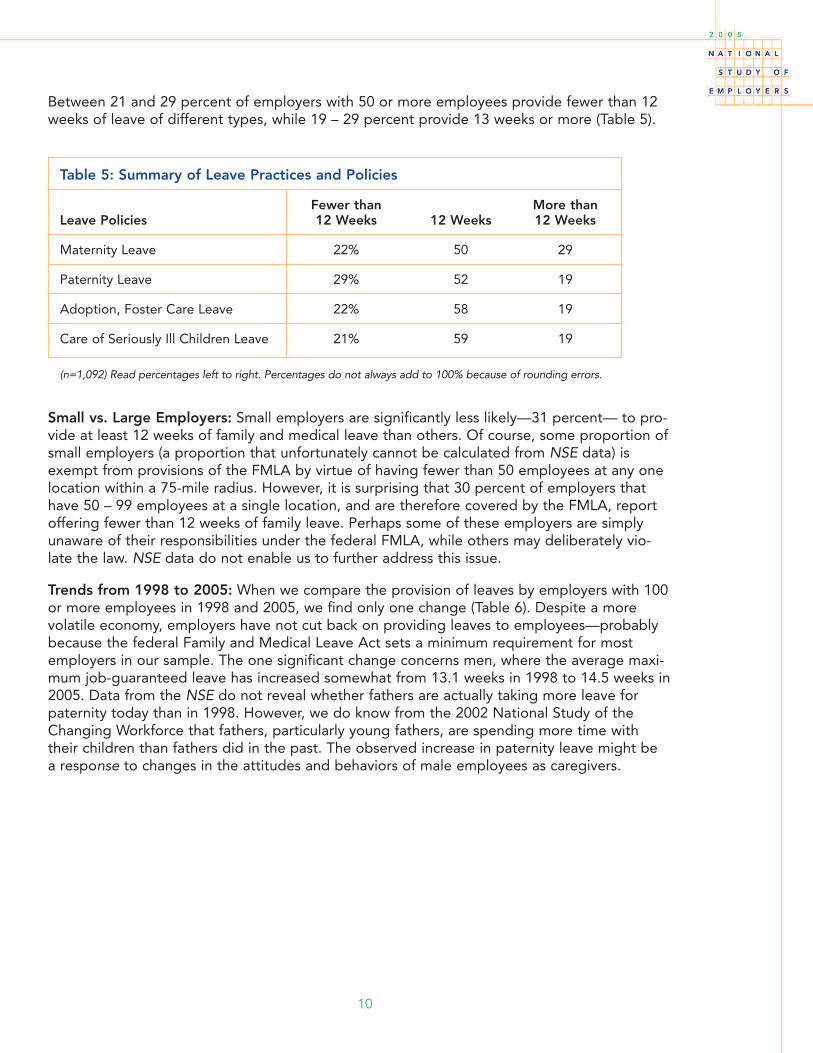
Table 5: Summary of Leave Practices and Policies
Fewer than More than Leave Policies 12 Weeks 12 Weeks 12 Weeks
Maternity Leave 22% 50 29
Paternity Leave 29% 52 19
Adoption, Foster Care Leave 22% 58 19
Care of Seriously Ill Children Leave 21% 59 19
(n=1,092) Read percentages left to right. Percentages do not always add to 100% because of rounding errors.
Between 21 and 29 percent of employers with 50 or more employees provide fewer than 12weeks of leave of different types, while 19 – 29 percent provide 13 weeks or more (Table 5).
11
Table 6: Provision of Leaves of Absence from 1998 to 2005
Leave Policy/Benefit 1998 Sig. 2005
Maximum Job-Guaranteed Leave for (522) (374)Women Following the Birth of a Child:
Fewer than 12 weeks 13% ns 14%
12 weeks 55 56
More than 12 weeks 31 31
Average Maximum Job-Guaranteed Leave for (522) ns (374)Women Following the Birth of a Child: 16.1 weeks 16.7 weeks
Maximum Job-Guaranteed Leave for Men (487) (364)Following the Birth of Their Child:
Fewer than 12 weeks 15% ns 18%
12 weeks 69 61
More than 12 weeks 15 20
Average Maximum Job-Guaranteed Leave for (487) * (364)Men Following the Birth of Their Child: 13.1 weeks 14.5 weeks
Maximum Job-Guaranteed Leave for Employees (487) (364)Following the Adoption of a Child:
Fewer than 12 weeks 13% ns 15%
12 weeks 72 66
More than 12 weeks 15 19
Average Maximum Job-Guaranteed Leave for (487) (364)Following the Adoption of a Child: 13.4 weeks ns 14.8 weeks
Maximum Job-Guaranteed Leave for Employees (487) (364)to Care for Seriously Ill Family Members:
Fewer than 12 weeks 14% ns 13%
12 weeks 73 68
More than 12 weeks 13 19
Average Maximum Job-Guaranteed Leave for (487) (364)Employees to Care for Seriously Ill Family Members: 13.5 weeks ns 14.7 weeks
Statistical significance: * p < .05; ** p < .01; *** p < .001; ns = not significant. Because of rounding errors,when findings are presented as percentage distributions across several response categories, they do notalways add to 100%. Fractional percentages are not reported in order to simplify presentation.
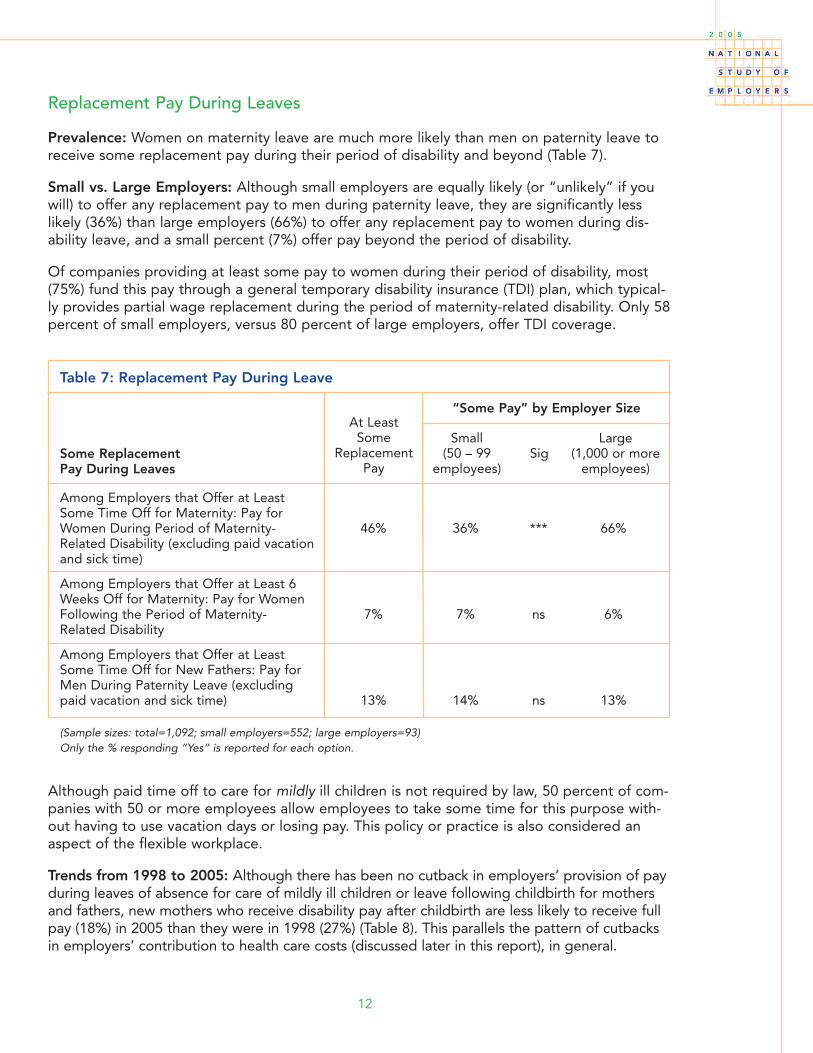
Replacement Pay During Leaves
Prevalence: Women on maternity leave are much more likely than men on paternity leave toreceive some replacement pay during their period of disability and beyond (Table 7).
Small vs. Large Employers: Although small employers are equally likely (or “unlikely” if youwill) to offer any replacement pay to men during paternity leave, they are significantly lesslikely (36%) than large employers (66%) to offer any replacement pay to women during dis-ability leave, and a small percent (7%) offer pay beyond the period of disability.
Of companies providing at least some pay to women during their period of disability, most(75%) fund this pay through a general temporary disability insurance (TDI) plan, which typical-ly provides partial wage replacement during the period of maternity-related disability. Only 58percent of small employers, versus 80 percent of large employers, offer TDI coverage.
12
Although paid time off to care for mildly ill children is not required by law, 50 percent of com-panies with 50 or more employees allow employees to take some time for this purpose with-out having to use vacation days or losing pay. This policy or practice is also considered anaspect of the flexible workplace.
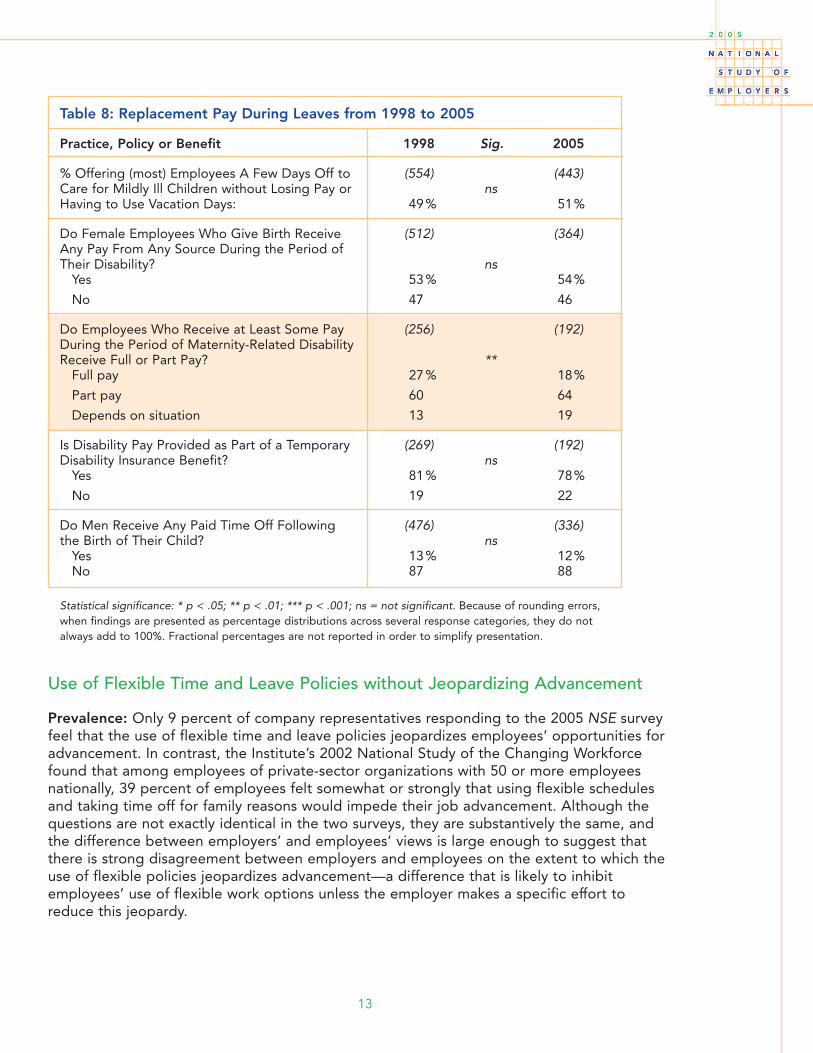
Trends from 1998 to 2005: Although there has been no cutback in employers’ provision of payduring leaves of absence for care of mildly ill children or leave following childbirth for mothersand fathers, new mothers who receive disability pay after childbirth are less likely to receive fullpay (18%) in 2005 than they were in 1998 (27%) (Table 8). This parallels the pattern of cutbacksin employers’ contribution to health care costs (discussed later in this report), in general.
Table 7: Replacement Pay During Leave
Some Replacement Pay During Leaves
At Least Some
Replacement Pay
“Some Pay” by Employer Size
Small Large(50 – 99 Sig (1,000 or more
employees) employees)
Among Employers that Offer at Least Some Time Off for Maternity: Pay for Women During Period of Maternity- 46% 36% *** 66%Related Disability (excluding paid vacation and sick time)
Among Employers that Offer at Least 6Weeks Off for Maternity: Pay for Women Following the Period of Maternity- 7% 7% ns 6%Related Disability
Among Employers that Offer at LeastSome Time Off for New Fathers: Pay forMen During Paternity Leave (excludingpaid vacation and sick time) 13% 14% ns 13%
(Sample sizes: total=1,092; small employers=552; large employers=93) Only the % responding “Yes” is reported for each option.
Use of Flexible Time and Leave Policies without Jeopardizing Advancement
Prevalence: Only 9 percent of company representatives responding to the 2005 NSE surveyfeel that the use of flexible time and leave policies jeopardizes employees’ opportunities foradvancement. In contrast, the Institute’s 2002 National Study of the Changing Workforcefound that among employees of private-sector organizations with 50 or more employeesnationally, 39 percent of employees felt somewhat or strongly that using flexible schedulesand taking time off for family reasons would impede their job advancement. Although thequestions are not exactly identical in the two surveys, they are substantively the same, andthe difference between employers’ and employees’ views is large enough to suggest thatthere is strong disagreement between employers and employees on the extent to which theuse of flexible policies jeopardizes advancement—a difference that is likely to inhibitemployees’ use of flexible work options unless the employer makes a specific effort toreduce this jeopardy.
13
Table 8: Replacement Pay During Leaves from 1998 to 2005
Practice, Policy or Benefit 1998 Sig. 2005
% Offering (most) Employees A Few Days Off to (554) (443)Care for Mildly Ill Children without Losing Pay or nsHaving to Use Vacation Days: 49% 51%
Do Female Employees Who Give Birth Receive (512) (364)Any Pay From Any Source During the Period of Their Disability? ns
Yes 53% 54%
No 47 46
Do Employees Who Receive at Least Some Pay (256) (192)During the Period of Maternity-Related DisabilityReceive Full or Part Pay? **
Full pay 27% 18%
Part pay 60 64
Depends on situation 13 19
Is Disability Pay Provided as Part of a Temporary (269) (192)Disability Insurance Benefit? ns
Yes 81% 78%
No 19 22
Do Men Receive Any Paid Time Off Following (476) (336)the Birth of Their Child? ns
Yes 13% 12%No 87 88
Statistical significance: * p < .05; ** p < .01; *** p < .001; ns = not significant. Because of rounding errors,when findings are presented as percentage distributions across several response categories, they do notalways add to 100%. Fractional percentages are not reported in order to simplify presentation.
Small vs. Large Employers: We found no significant difference between small and largeemployers in 2005. Moreover, we found no difference between large and small employerswhen we compared responses from employees in the 2002 National Study of the Changing Workforce.
Trends from 1998 to 2005: We found no significant difference between the responses ofemployers in 1998 and 2005.
Child Care Assistance
Prevalence: Not unexpectedly, employers are more likely to provide low- or no-cost childcare options—such as Dependent Care Assistance Plans (45%) and Child Care Resource andReferral (34%)—than those that are more costly (Table 9). Among employers with 50 or moreemployees, only 7 percent provide child care at or near the worksite.
Small vs. Large Employers: Large employers are significantly more likely to offer five of the 10child care options considered. In the case of financial assistance for child care and vacation childcare for school-age children, the differences are very small and the incidence very low. However,in the case of Child Care Resource and Referral, Dependent Care Assistance Plans, and on- ornear-site child care services the differences are not only statistically significant, but fairly large.Only the latter option—on- or near-site child care—has significant direct costs for employersand might be expected to be more common among large employers that have greaterresources and enough employee demand to justify an investment in on- or near-site child care.The other two options—Child Care Resource and Referral and Dependent Care AssistancePlans—mainly require awareness of community resources and some administrative attention,which may well challenge small organizations that do not have human resource (HR) personnel.
14
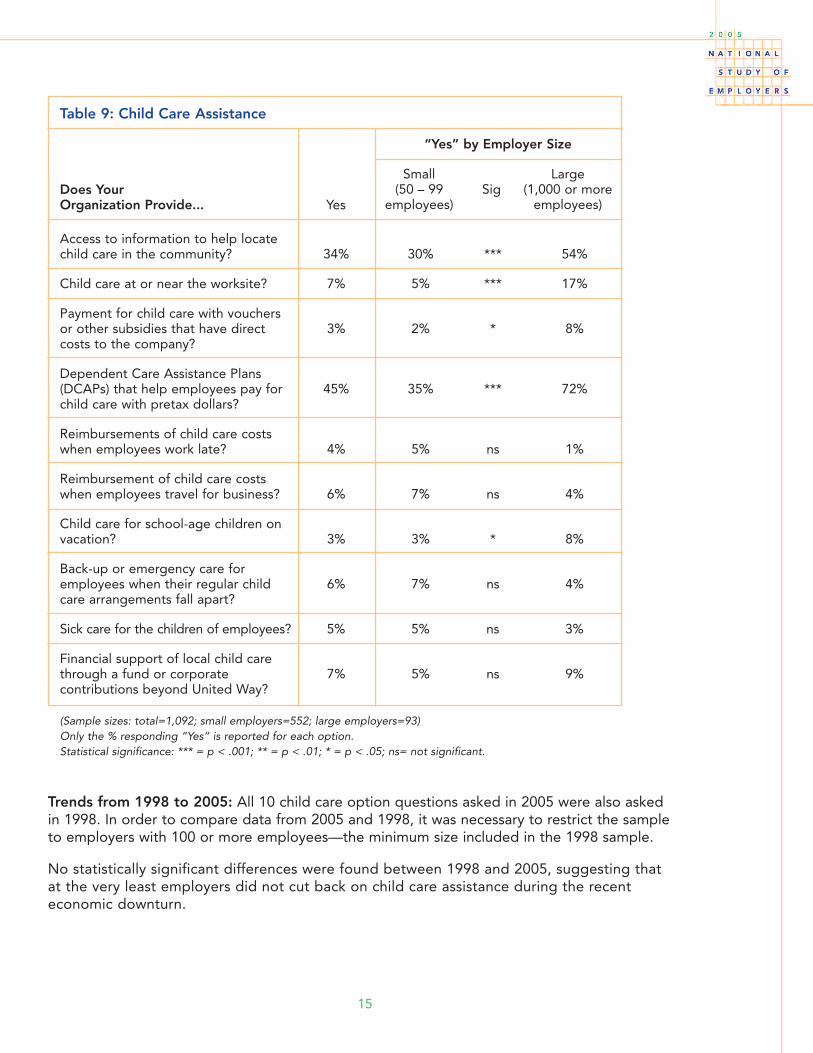
Trends from 1998 to 2005: All 10 child care option questions asked in 2005 were also askedin 1998. In order to compare data from 2005 and 1998, it was necessary to restrict the sampleto employers with 100 or more employees—the minimum size included in the 1998 sample.
No statistically significant differences were found between 1998 and 2005, suggesting thatat the very least employers did not cut back on child care assistance during the recent economic downturn.
15
Access to information to help locate child care in the community? 34% 30% *** 54%
Child care at or near the worksite? 7% 5% *** 17%
Payment for child care with vouchers or other subsidies that have direct 3% 2% * 8%costs to the company?
Dependent Care Assistance Plans (DCAPs) that help employees pay for 45% 35% *** 72%child care with pretax dollars?
Reimbursements of child care costs when employees work late? 4% 5% ns 1%
Reimbursement of child care costs when employees travel for business? 6% 7% ns 4%
Child care for school-age children on vacation? 3% 3% * 8%
Back-up or emergency care for employees when their regular child 6% 7% ns 4%care arrangements fall apart?
Sick care for the children of employees? 5% 5% ns 3%
Financial support of local child care through a fund or corporate 7% 5% ns 9%contributions beyond United Way?
Table 9: Child Care Assistance
Does Your Organization Provide... Yes
“Yes” by Employer Size
Small Large(50 – 99 Sig (1,000 or more
employees) employees)
(Sample sizes: total=1,092; small employers=552; large employers=93) Only the % responding “Yes” is reported for each option. Statistical significance: *** = p < .001; ** = p < .01; * = p < .05; ns= not significant.
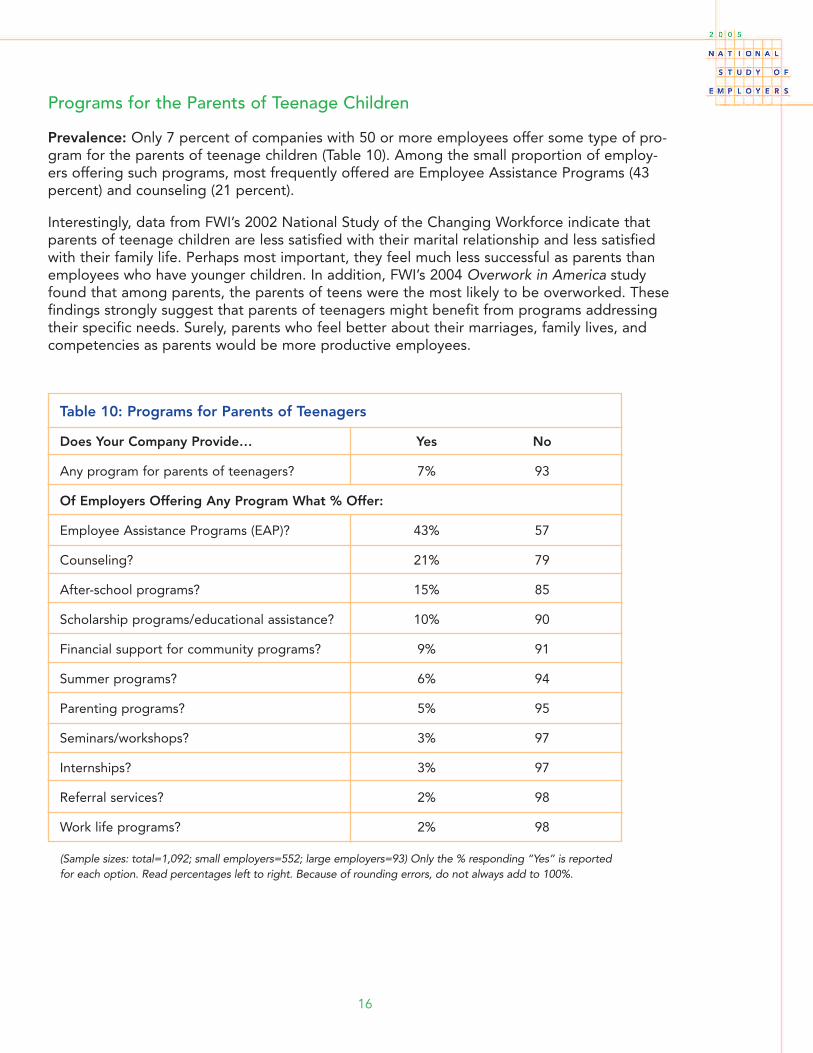
Programs for the Parents of Teenage Children
Prevalence: Only 7 percent of companies with 50 or more employees offer some type of pro-gram for the parents of teenage children (Table 10). Among the small proportion of employ-ers offering such programs, most frequently offered are Employee Assistance Programs (43percent) and counseling (21 percent).
Interestingly, data from FWI’s 2002 National Study of the Changing Workforce indicate thatparents of teenage children are less satisfied with their marital relationship and less satisfiedwith their family life. Perhaps most important, they feel much less successful as parents thanemployees who have younger children. In addition, FWI’s 2004 Overwork in America studyfound that among parents, the parents of teens were the most likely to be overworked. Thesefindings strongly suggest that parents of teenagers might benefit from programs addressingtheir specific needs. Surely, parents who feel better about their marriages, family lives, andcompetencies as parents would be more productive employees.
16
Table 10: Programs for Parents of Teenagers
Does Your Company Provide… Yes No
Any program for parents of teenagers? 7% 93
Of Employers Offering Any Program What % Offer:
Employee Assistance Programs (EAP)? 43% 57
Counseling? 21% 79
After-school programs? 15% 85
Scholarship programs/educational assistance? 10% 90
Financial support for community programs? 9% 91
Summer programs? 6% 94
Parenting programs? 5% 95
Seminars/workshops? 3% 97
Internships? 3% 97
Referral services? 2% 98
Work life programs? 2% 98
(Sample sizes: total=1,092; small employers=552; large employers=93) Only the % responding “Yes” is reportedfor each option. Read percentages left to right. Because of rounding errors, do not always add to 100%.
Employer Size and Trends: We found few differences for employers of different sizes andfrom 1998 to 2005. Only one bears discussion: there has been an increase in the number oforganizations offering EAP programs specifically geared to parents of teens. The main find-ing, however, is that very few employers of any size in 1998 or 2005 offer any programs toparents of teenage children.
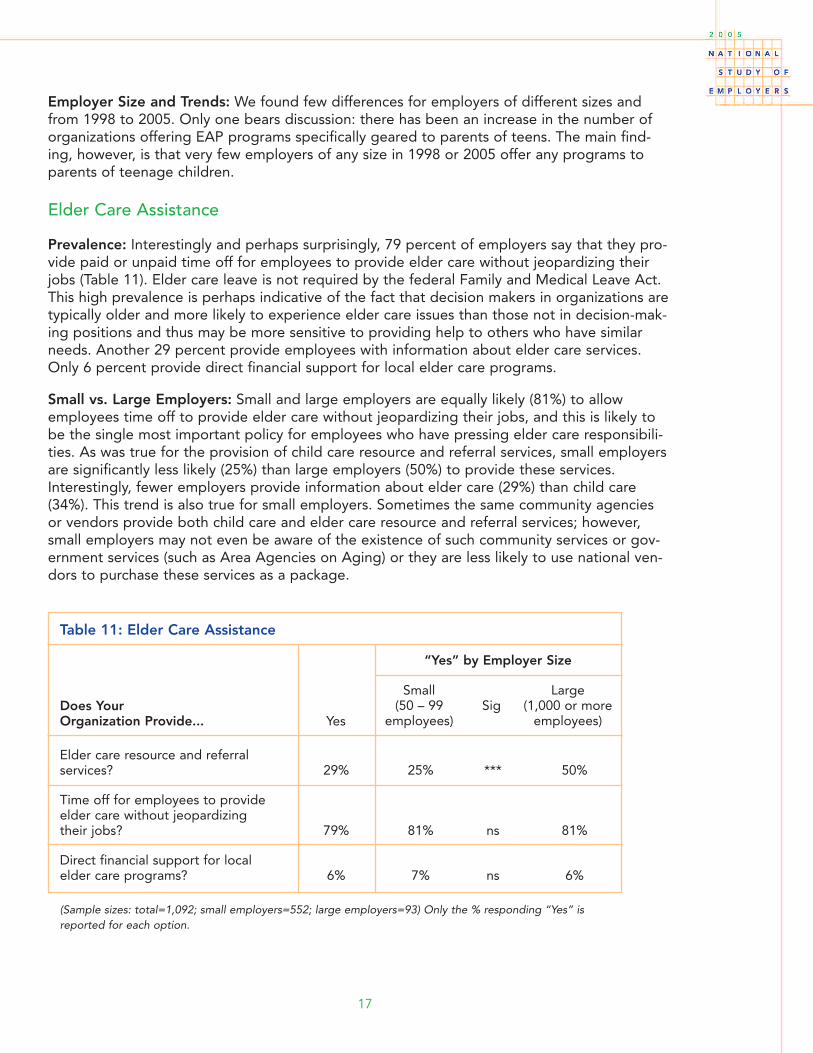
Elder Care Assistance
Prevalence: Interestingly and perhaps surprisingly, 79 percent of employers say that they pro-vide paid or unpaid time off for employees to provide elder care without jeopardizing theirjobs (Table 11). Elder care leave is not required by the federal Family and Medical Leave Act.This high prevalence is perhaps indicative of the fact that decision makers in organizations aretypically older and more likely to experience elder care issues than those not in decision-mak-ing positions and thus may be more sensitive to providing help to others who have similarneeds. Another 29 percent provide employees with information about elder care services.Only 6 percent provide direct financial support for local elder care programs.
Small vs. Large Employers: Small and large employers are equally likely (81%) to allowemployees time off to provide elder care without jeopardizing their jobs, and this is likely tobe the single most important policy for employees who have pressing elder care responsibili-ties. As was true for the provision of child care resource and referral services, small employersare significantly less likely (25%) than large employers (50%) to provide these services.Interestingly, fewer employers provide information about elder care (29%) than child care(34%). This trend is also true for small employers. Sometimes the same community agenciesor vendors provide both child care and elder care resource and referral services; however,small employers may not even be aware of the existence of such community services or gov-ernment services (such as Area Agencies on Aging) or they are less likely to use national ven-dors to purchase these services as a package.
17
Elder care resource and referral services? 29% 25% *** 50%
Time off for employees to provideelder care without jeopardizing their jobs? 79% 81% ns 81%
Direct financial support for local elder care programs? 6% 7% ns 6%
Table 11: Elder Care Assistance
Does Your Organization Provide... Yes
“Yes” by Employer Size
Small Large(50 – 99 Sig (1,000 or more
employees) employees)
(Sample sizes: total=1,092; small employers=552; large employers=93) Only the % responding “Yes” isreported for each option.
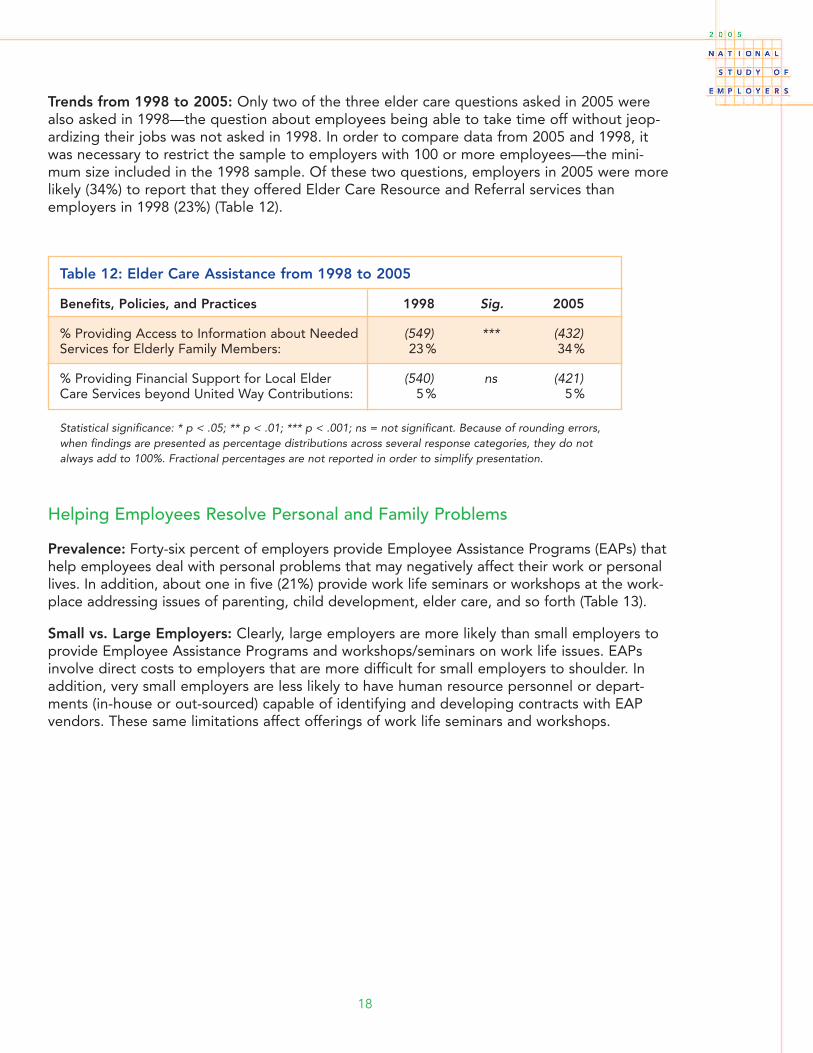
Trends from 1998 to 2005: Only two of the three elder care questions asked in 2005 werealso asked in 1998—the question about employees being able to take time off without jeop-ardizing their jobs was not asked in 1998. In order to compare data from 2005 and 1998, itwas necessary to restrict the sample to employers with 100 or more employees—the mini-mum size included in the 1998 sample. Of these two questions, employers in 2005 were morelikely (34%) to report that they offered Elder Care Resource and Referral services thanemployers in 1998 (23%) (Table 12).
18
Table 12: Elder Care Assistance from 1998 to 2005
Benefits, Policies, and Practices 1998 Sig. 2005
% Providing Access to Information about Needed (549) *** (432)Services for Elderly Family Members: 23% 34%
% Providing Financial Support for Local Elder (540) ns (421)Care Services beyond United Way Contributions: 5% 5%
Statistical significance: * p < .05; ** p < .01; *** p < .001; ns = not significant. Because of rounding errors,when findings are presented as percentage distributions across several response categories, they do notalways add to 100%. Fractional percentages are not reported in order to simplify presentation.
Helping Employees Resolve Personal and Family Problems
Prevalence: Forty-six percent of employers provide Employee Assistance Programs (EAPs) thathelp employees deal with personal problems that may negatively affect their work or personallives. In addition, about one in five (21%) provide work life seminars or workshops at the work-place addressing issues of parenting, child development, elder care, and so forth (Table 13).
Small vs. Large Employers: Clearly, large employers are more likely than small employers toprovide Employee Assistance Programs and workshops/seminars on work life issues. EAPsinvolve direct costs to employers that are more difficult for small employers to shoulder. Inaddition, very small employers are less likely to have human resource personnel or depart-ments (in-house or out-sourced) capable of identifying and developing contracts with EAPvendors. These same limitations affect offerings of work life seminars and workshops.
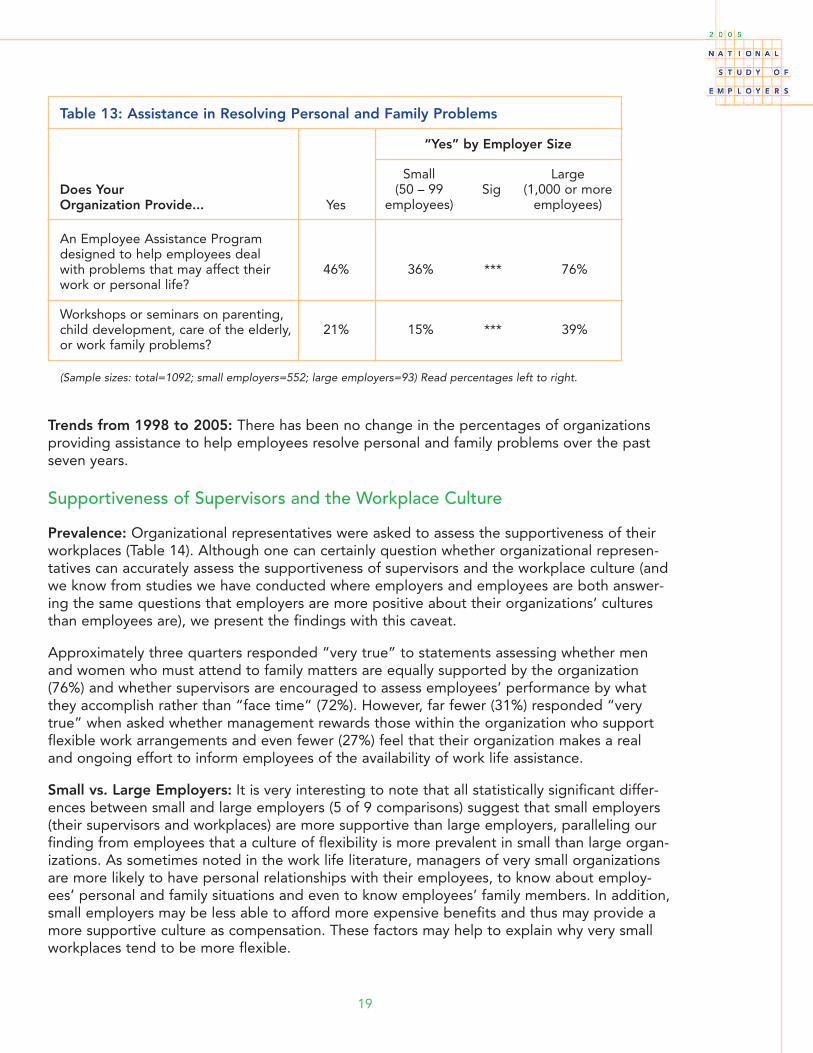
Trends from 1998 to 2005: There has been no change in the percentages of organizationsproviding assistance to help employees resolve personal and family problems over the pastseven years.
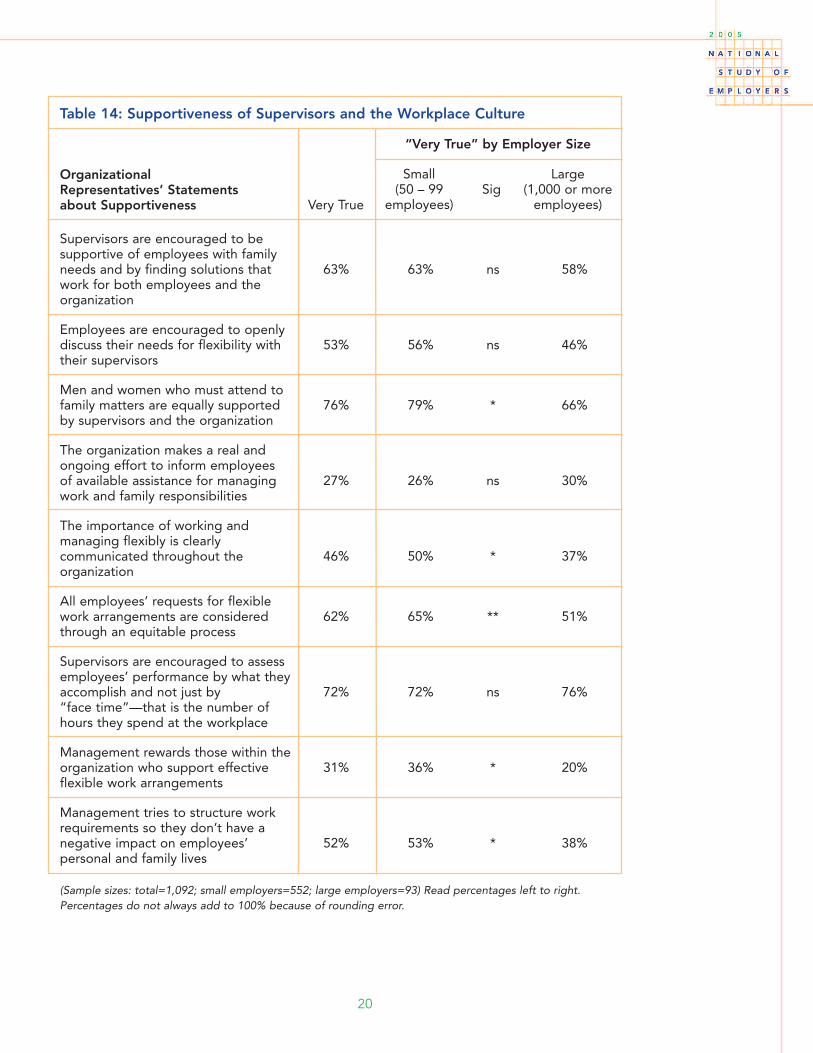
Supportiveness of Supervisors and the Workplace Culture
Prevalence: Organizational representatives were asked to assess the supportiveness of theirworkplaces (Table 14). Although one can certainly question whether organizational represen-tatives can accurately assess the supportiveness of supervisors and the workplace culture (andwe know from studies we have conducted where employers and employees are both answer-ing the same questions that employers are more positive about their organizations’ culturesthan employees are), we present the findings with this caveat.
Approximately three quarters responded “very true” to statements assessing whether menand women who must attend to family matters are equally supported by the organization(76%) and whether supervisors are encouraged to assess employees’ performance by whatthey accomplish rather than “face time” (72%). However, far fewer (31%) responded “verytrue” when asked whether management rewards those within the organization who supportflexible work arrangements and even fewer (27%) feel that their organization makes a realand ongoing effort to inform employees of the availability of work life assistance.
Small vs. Large Employers: It is very interesting to note that all statistically significant differ-ences between small and large employers (5 of 9 comparisons) suggest that small employers(their supervisors and workplaces) are more supportive than large employers, paralleling ourfinding from employees that a culture of flexibility is more prevalent in small than large organ-izations. As sometimes noted in the work life literature, managers of very small organizationsare more likely to have personal relationships with their employees, to know about employ-ees’ personal and family situations and even to know employees’ family members. In addition,small employers may be less able to afford more expensive benefits and thus may provide amore supportive culture as compensation. These factors may help to explain why very smallworkplaces tend to be more flexible.
19
An Employee Assistance Program designed to help employees deal with problems that may affect their 46% 36% *** 76%work or personal life?
Workshops or seminars on parenting, child development, care of the elderly, 21% 15% *** 39%or work family problems?
Table 13: Assistance in Resolving Personal and Family Problems
Does Your Organization Provide... Yes
“Yes” by Employer Size
Small Large(50 – 99 Sig (1,000 or more
employees) employees)
(Sample sizes: total=1092; small employers=552; large employers=93) Read percentages left to right.
20
Supervisors are encouraged to be supportive of employees with family needs and by finding solutions that 63% 63% ns 58%work for both employees and the organization
Employees are encouraged to openly discuss their needs for flexibility with 53% 56% ns 46%their supervisors
Men and women who must attend to family matters are equally supported 76% 79% * 66%by supervisors and the organization
The organization makes a real and ongoing effort to inform employees of available assistance for managing 27% 26% ns 30%work and family responsibilities
The importance of working and managing flexibly is clearly communicated throughout the 46% 50% * 37%organization
All employees’ requests for flexible work arrangements are considered 62% 65% ** 51%through an equitable process
Supervisors are encouraged to assess employees’ performance by what they accomplish and not just by 72% 72% ns 76%“face time”—that is the number of hours they spend at the workplace
Management rewards those within the organization who support effective 31% 36% * 20%flexible work arrangements
Management tries to structure work requirements so they don’t have a negative impact on employees’ 52% 53% * 38%personal and family lives
Table 14: Supportiveness of Supervisors and the Workplace Culture
Organizational Representatives’ Statementsabout Supportiveness Very True
“Very True” by Employer Size
Small Large(50 – 99 Sig (1,000 or more
employees) employees)
(Sample sizes: total=1,092; small employers=552; large employers=93) Read percentages left to right.Percentages do not always add to 100% because of rounding error.
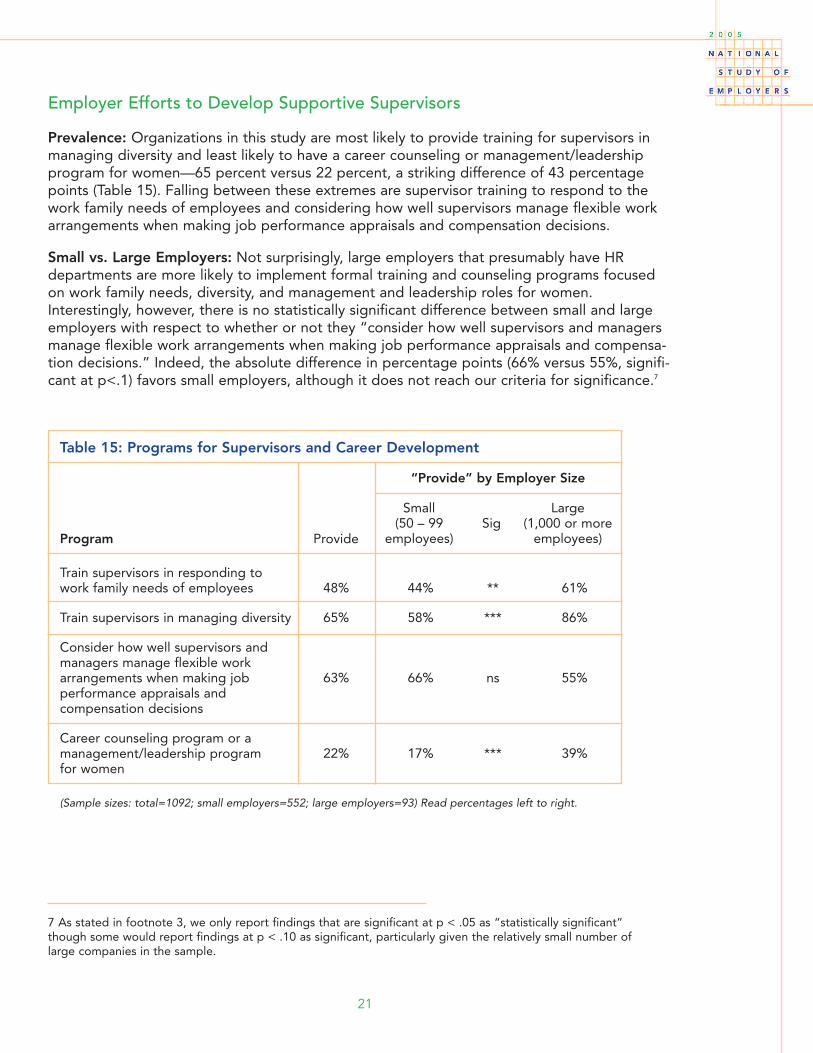
Employer Efforts to Develop Supportive Supervisors
Prevalence: Organizations in this study are most likely to provide training for supervisors inmanaging diversity and least likely to have a career counseling or management/leadershipprogram for women—65 percent versus 22 percent, a striking difference of 43 percentagepoints (Table 15). Falling between these extremes are supervisor training to respond to thework family needs of employees and considering how well supervisors manage flexible workarrangements when making job performance appraisals and compensation decisions.
Small vs. Large Employers: Not surprisingly, large employers that presumably have HRdepartments are more likely to implement formal training and counseling programs focusedon work family needs, diversity, and management and leadership roles for women.Interestingly, however, there is no statistically significant difference between small and largeemployers with respect to whether or not they “consider how well supervisors and managersmanage flexible work arrangements when making job performance appraisals and compensa-tion decisions.” Indeed, the absolute difference in percentage points (66% versus 55%, signifi-cant at p<.1) favors small employers, although it does not reach our criteria for significance.7
21
7 As stated in footnote 3, we only report findings that are significant at p < .05 as “statistically significant” though some would report findings at p < .10 as significant, particularly given the relatively small number of large companies in the sample.
Train supervisors in responding to work family needs of employees 48% 44% ** 61%
Train supervisors in managing diversity 65% 58% *** 86%
Consider how well supervisors and managers manage flexible work arrangements when making job 63% 66% ns 55%performance appraisals and compensation decisions
Career counseling program or a management/leadership program 22% 17% *** 39%for women
Table 15: Programs for Supervisors and Career Development
Program Provide
“Provide” by Employer Size
Small Large(50 – 99 Sig (1,000 or more
employees) employees)
(Sample sizes: total=1092; small employers=552; large employers=93) Read percentages left to right.
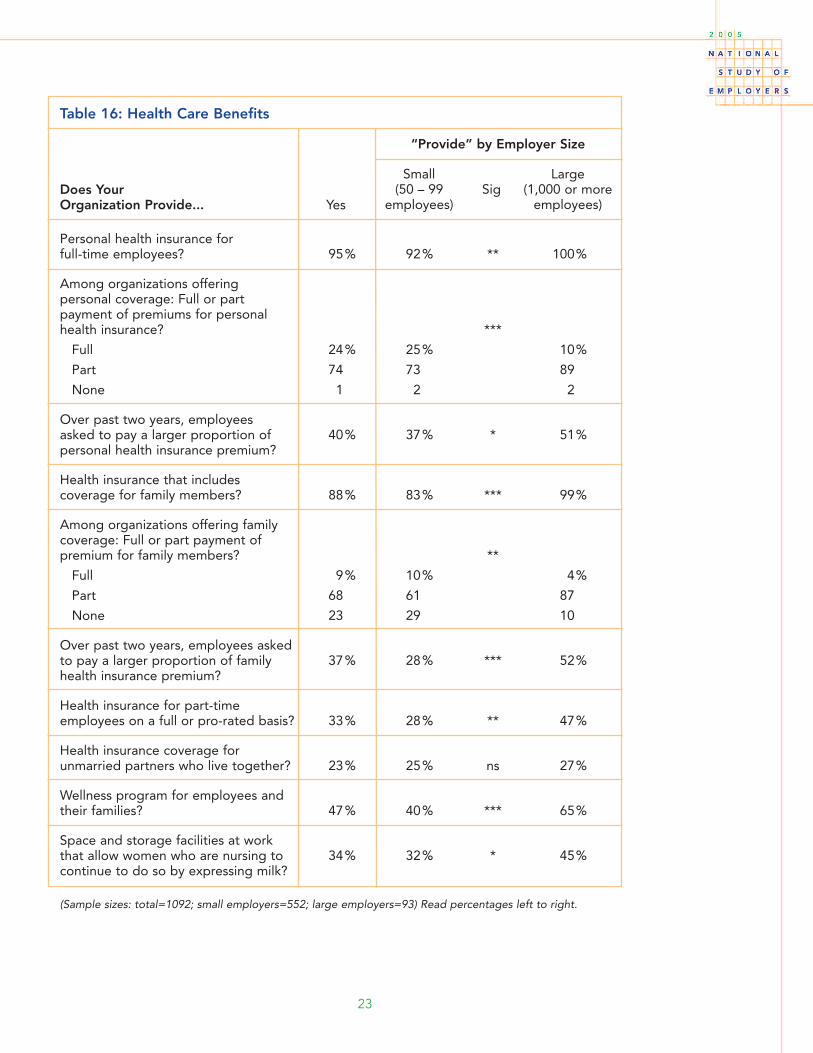
Health Care Benefits
Prevalence: Health insurance coverage for oneself and one’s family is the single most impor-tant benefit to U.S. workers and their families, who rely almost exclusively on employers forcoverage. Ninety-five percent of companies with 50 or more employees offer personal healthinsurance coverage for full-time employees (Table 16). Among organizations offering personalhealth insurance, 24 percent pay all of the premium, 74 percent pay some of the premium,and 2 percent pay none of the premium. Among companies offering personal health insur-ance, 40 percent increased employees’ premium co-pay during the preceding two years.
Eighty-eight percent of companies offer family coverage, with only 9 percent of these payingall of the premium for family members, another 68 percent paying part of the premium, and23 percent paying none of the premium. Among companies offering family health insurance,37 percent increased employees’ premium co-pay during the preceding 2 years.
Only 33 percent of companies offer full or pro-rated benefits to part-time workers, while 23percent offer health insurance coverage for unmarried partners who live with the employee.Forty-seven percent of companies offer wellness programs for employees and their families,and 34 percent provide space and milk storage facilities that allow mothers who are nursingto continue to do so by expressing milk.
Small vs. Mid-Sized vs. Large Employers: Small employers with 50 – 99 employees arealmost as likely (92%) to offer personal health insurance coverage as large employers (100%),and when they do, small employers are more likely (25%) than large employers (10%) to payall of the premium. In recent years, as health care costs have risen dramatically, employershave begun to shift the costs of premiums to employees. Interestingly and perhaps very sur-prisingly, small employers are also less likely (37%) than large employers (51%) to haverequired employees to pay a larger proportion of their personal health insurance premiumover the past two years.
On the other hand, small employers are significantly less likely (83%) than large employers(99%) to offer family health insurance coverage, and they are more likely (29%) than largeemployers (10%) to pay none of the premium. When small employers do offer partly or fullypaid family coverage, however, they are less likely (28%) than large employers (52%) to haverequired employees to pay a higher proportion of their family insurance premium over thepast two years. Small employers are also less likely than large employers to provide healthinsurance to part-time employees on a full or pro-rated basis, to provide wellness programsfor employees and their families, and to provide space and storage facilities at work to allowwomen who are nursing to continue doing so by expressing milk. Interestingly, small employ-ers are just as likely as large employers to offer health insurance coverage for unmarried part-ners living with employees.
22
23
Personal health insurance for full-time employees? 95% 92% ** 100%
Among organizations offering personal coverage: Full or part payment of premiums for personal health insurance? ***
Full 24% 25% 10%
Part 74 73 89
None 1 2 2
Over past two years, employees asked to pay a larger proportion of 40% 37% * 51%personal health insurance premium?
Health insurance that includes coverage for family members? 88% 83% *** 99%
Among organizations offering family coverage: Full or part payment of premium for family members? **
Full 9% 10% 4%
Part 68 61 87
None 23 29 10
Over past two years, employees asked to pay a larger proportion of family 37% 28% *** 52%health insurance premium?
Health insurance for part-time employees on a full or pro-rated basis? 33% 28% ** 47%
Health insurance coverage for unmarried partners who live together? 23% 25% ns 27%
Wellness program for employees and their families? 47% 40% *** 65%
Space and storage facilities at workthat allow women who are nursing to 34% 32% * 45%continue to do so by expressing milk?
Table 16: Health Care Benefits
Does Your Organization Provide... Yes
“Provide” by Employer Size
Small Large(50 – 99 Sig (1,000 or more
employees) employees)
(Sample sizes: total=1092; small employers=552; large employers=93) Read percentages left to right.
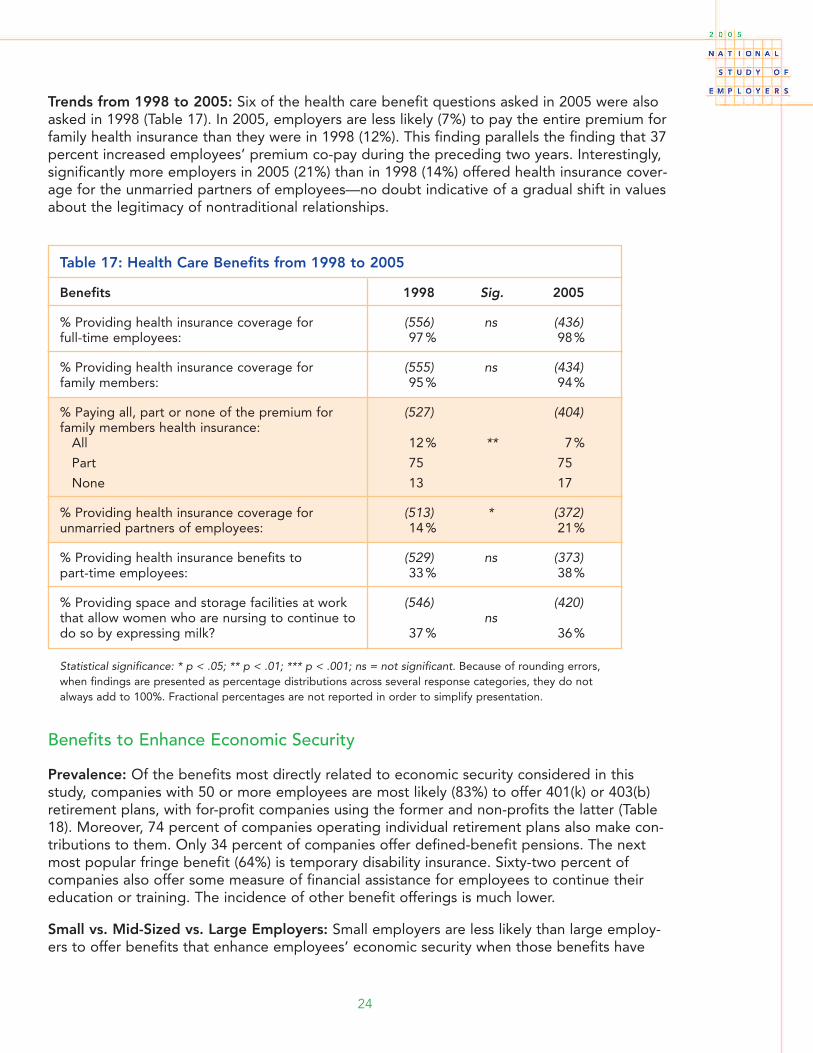
Trends from 1998 to 2005: Six of the health care benefit questions asked in 2005 were alsoasked in 1998 (Table 17). In 2005, employers are less likely (7%) to pay the entire premium forfamily health insurance than they were in 1998 (12%). This finding parallels the finding that 37percent increased employees’ premium co-pay during the preceding two years. Interestingly,significantly more employers in 2005 (21%) than in 1998 (14%) offered health insurance cover-age for the unmarried partners of employees—no doubt indicative of a gradual shift in valuesabout the legitimacy of nontraditional relationships.
24
Table 17: Health Care Benefits from 1998 to 2005
Benefits 1998 Sig. 2005
% Providing health insurance coverage for (556) ns (436)full-time employees: 97% 98%
% Providing health insurance coverage for (555) ns (434)family members: 95% 94%
% Paying all, part or none of the premium for (527) (404)family members health insurance:
All 12% ** 7%
Part 75 75
None 13 17
% Providing health insurance coverage for (513) * (372)unmarried partners of employees: 14% 21%
% Providing health insurance benefits to (529) ns (373)part-time employees: 33% 38%
% Providing space and storage facilities at work (546) (420)that allow women who are nursing to continue to nsdo so by expressing milk? 37% 36%
Statistical significance: * p < .05; ** p < .01; *** p < .001; ns = not significant. Because of rounding errors,when findings are presented as percentage distributions across several response categories, they do notalways add to 100%. Fractional percentages are not reported in order to simplify presentation.
Benefits to Enhance Economic Security
Prevalence: Of the benefits most directly related to economic security considered in thisstudy, companies with 50 or more employees are most likely (83%) to offer 401(k) or 403(b)retirement plans, with for-profit companies using the former and non-profits the latter (Table18). Moreover, 74 percent of companies operating individual retirement plans also make con-tributions to them. Only 34 percent of companies offer defined-benefit pensions. The nextmost popular fringe benefit (64%) is temporary disability insurance. Sixty-two percent ofcompanies also offer some measure of financial assistance for employees to continue theireducation or training. The incidence of other benefit offerings is much lower.
Small vs. Mid-Sized vs. Large Employers: Small employers are less likely than large employ-ers to offer benefits that enhance employees’ economic security when those benefits have
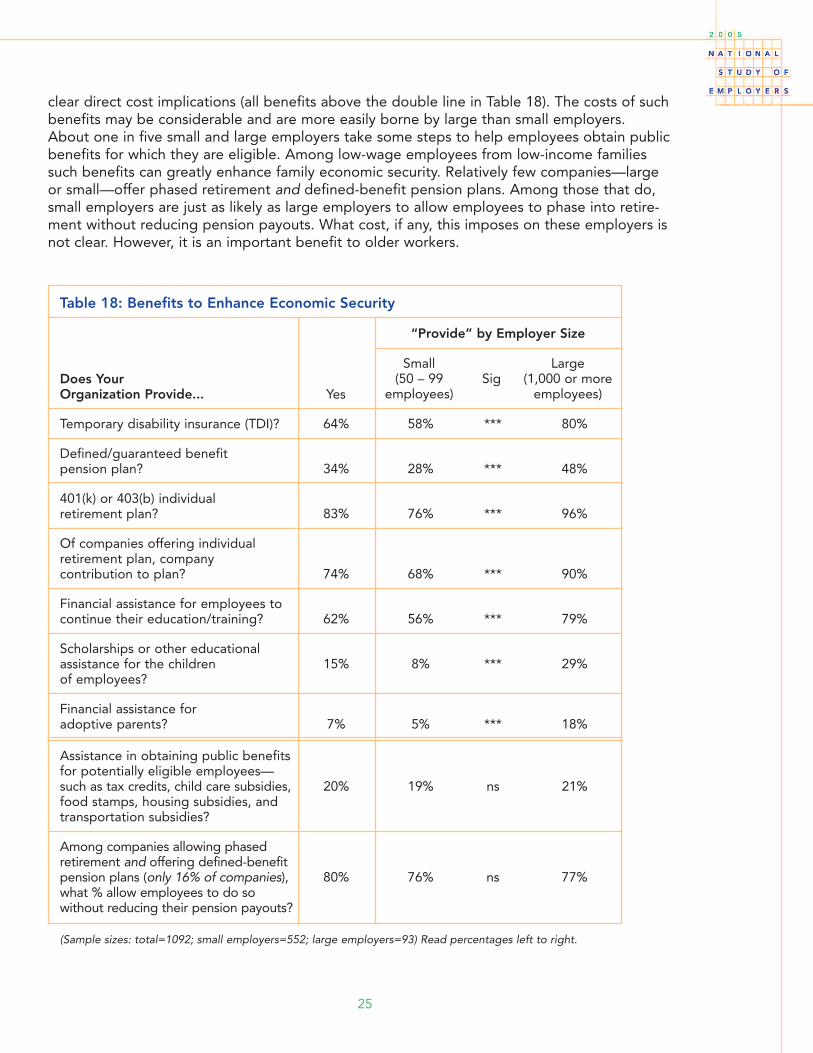
clear direct cost implications (all benefits above the double line in Table 18). The costs of suchbenefits may be considerable and are more easily borne by large than small employers.About one in five small and large employers take some steps to help employees obtain publicbenefits for which they are eligible. Among low-wage employees from low-income familiessuch benefits can greatly enhance family economic security. Relatively few companies—largeor small—offer phased retirement and defined-benefit pension plans. Among those that do,small employers are just as likely as large employers to allow employees to phase into retire-ment without reducing pension payouts. What cost, if any, this imposes on these employers isnot clear. However, it is an important benefit to older workers.
25
Temporary disability insurance (TDI)? 64% 58% *** 80%
Defined/guaranteed benefit pension plan? 34% 28% *** 48%
401(k) or 403(b) individual retirement plan? 83% 76% *** 96%
Of companies offering individual retirement plan, company contribution to plan? 74% 68% *** 90%
Financial assistance for employees to continue their education/training? 62% 56% *** 79%
Scholarships or other educational assistance for the children 15% 8% *** 29%of employees?
Financial assistance for adoptive parents? 7% 5% *** 18%
Assistance in obtaining public benefits for potentially eligible employees—such as tax credits, child care subsidies, 20% 19% ns 21%food stamps, housing subsidies, and transportation subsidies?
Among companies allowing phased retirement and offering defined-benefit pension plans (only 16% of companies), 80% 76% ns 77%what % allow employees to do so without reducing their pension payouts?
Table 18: Benefits to Enhance Economic Security
Does Your Organization Provide... Yes
“Provide” by Employer Size
Small Large(50 – 99 Sig (1,000 or more
employees) employees)
(Sample sizes: total=1092; small employers=552; large employers=93) Read percentages left to right.
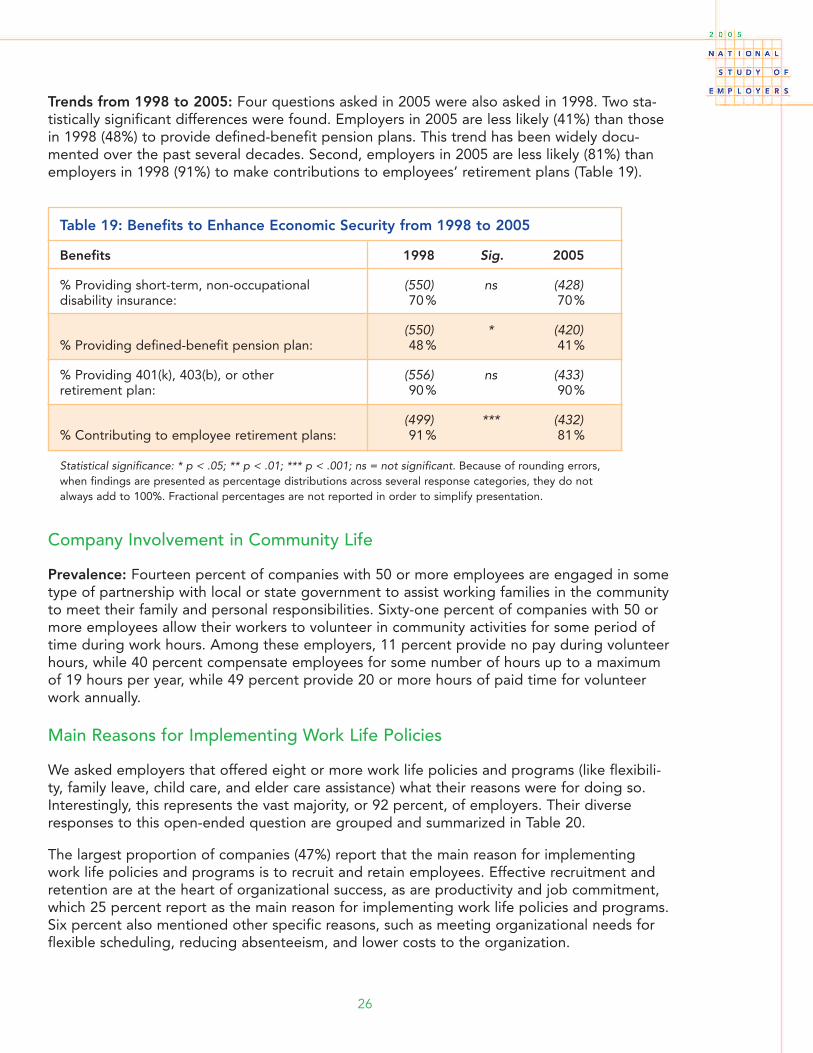
Trends from 1998 to 2005: Four questions asked in 2005 were also asked in 1998. Two sta-tistically significant differences were found. Employers in 2005 are less likely (41%) than thosein 1998 (48%) to provide defined-benefit pension plans. This trend has been widely docu-mented over the past several decades. Second, employers in 2005 are less likely (81%) thanemployers in 1998 (91%) to make contributions to employees’ retirement plans (Table 19).
26
Table 19: Benefits to Enhance Economic Security from 1998 to 2005
Benefits 1998 Sig. 2005
% Providing short-term, non-occupational (550) ns (428)disability insurance: 70% 70%
(550) * (420)% Providing defined-benefit pension plan: 48% 41%
% Providing 401(k), 403(b), or other (556) ns (433)retirement plan: 90% 90%
(499) *** (432)% Contributing to employee retirement plans: 91% 81%
Statistical significance: * p < .05; ** p < .01; *** p < .001; ns = not significant. Because of rounding errors,when findings are presented as percentage distributions across several response categories, they do notalways add to 100%. Fractional percentages are not reported in order to simplify presentation.
Company Involvement in Community Life
Prevalence: Fourteen percent of companies with 50 or more employees are engaged in sometype of partnership with local or state government to assist working families in the communityto meet their family and personal responsibilities. Sixty-one percent of companies with 50 ormore employees allow their workers to volunteer in community activities for some period oftime during work hours. Among these employers, 11 percent provide no pay during volunteerhours, while 40 percent compensate employees for some number of hours up to a maximumof 19 hours per year, while 49 percent provide 20 or more hours of paid time for volunteerwork annually.
Main Reasons for Implementing Work Life Policies
We asked employers that offered eight or more work life policies and programs (like flexibili-ty, family leave, child care, and elder care assistance) what their reasons were for doing so.Interestingly, this represents the vast majority, or 92 percent, of employers. Their diverseresponses to this open-ended question are grouped and summarized in Table 20.
The largest proportion of companies (47%) report that the main reason for implementingwork life policies and programs is to recruit and retain employees. Effective recruitment andretention are at the heart of organizational success, as are productivity and job commitment,which 25 percent report as the main reason for implementing work life policies and programs.Six percent also mentioned other specific reasons, such as meeting organizational needs forflexible scheduling, reducing absenteeism, and lower costs to the organization.
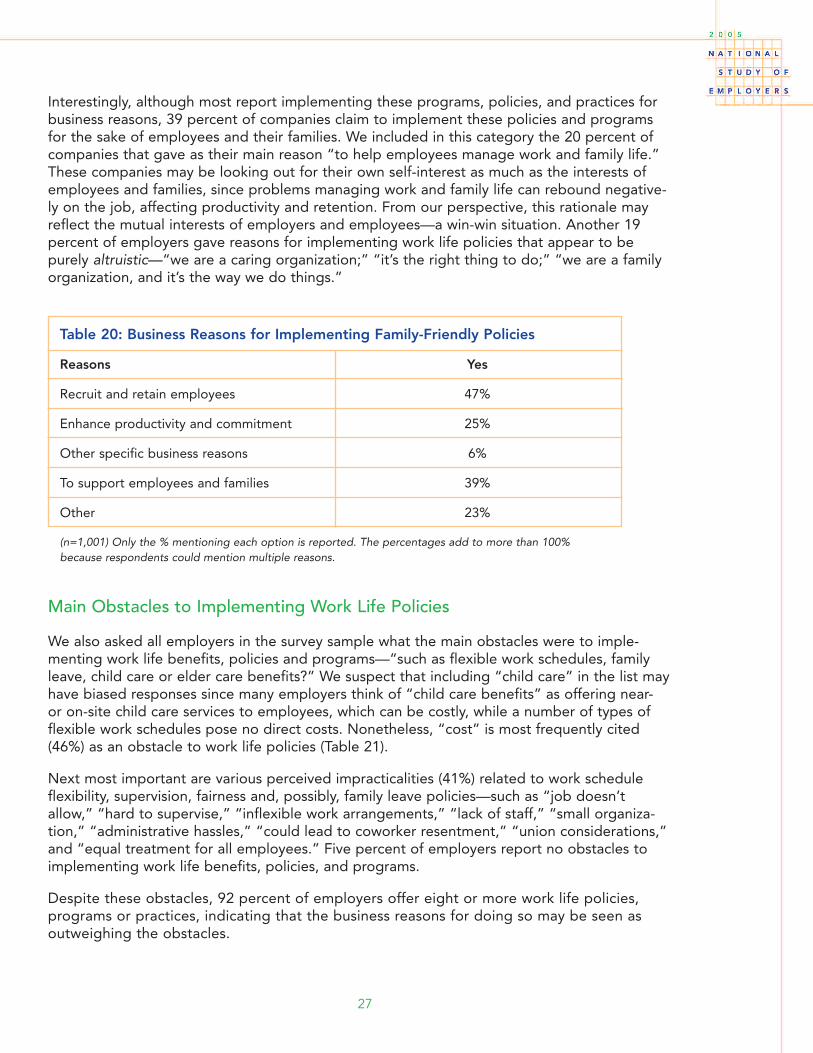
Interestingly, although most report implementing these programs, policies, and practices forbusiness reasons, 39 percent of companies claim to implement these policies and programsfor the sake of employees and their families. We included in this category the 20 percent ofcompanies that gave as their main reason “to help employees manage work and family life.”These companies may be looking out for their own self-interest as much as the interests ofemployees and families, since problems managing work and family life can rebound negative-ly on the job, affecting productivity and retention. From our perspective, this rationale mayreflect the mutual interests of employers and employees—a win-win situation. Another 19percent of employers gave reasons for implementing work life policies that appear to bepurely altruistic—“we are a caring organization;” “it’s the right thing to do;” “we are a familyorganization, and it’s the way we do things.”
27
Table 20: Business Reasons for Implementing Family-Friendly Policies
Reasons Yes
Recruit and retain employees 47%
Enhance productivity and commitment 25%
Other specific business reasons 6%
To support employees and families 39%
Other 23%
(n=1,001) Only the % mentioning each option is reported. The percentages add to more than 100%because respondents could mention multiple reasons.
Main Obstacles to Implementing Work Life Policies
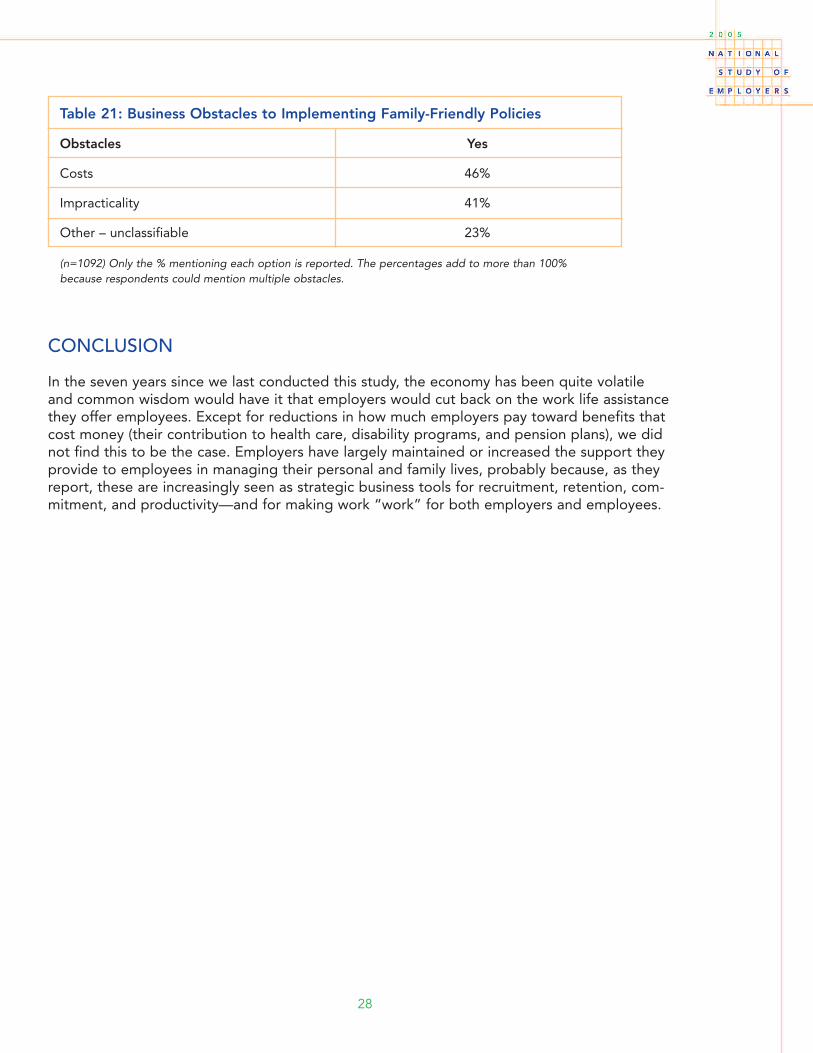
We also asked all employers in the survey sample what the main obstacles were to imple-menting work life benefits, policies and programs—“such as flexible work schedules, familyleave, child care or elder care benefits?” We suspect that including “child care” in the list mayhave biased responses since many employers think of “child care benefits” as offering near-or on-site child care services to employees, which can be costly, while a number of types offlexible work schedules pose no direct costs. Nonetheless, “cost” is most frequently cited(46%) as an obstacle to work life policies (Table 21).
Next most important are various perceived impracticalities (41%) related to work scheduleflexibility, supervision, fairness and, possibly, family leave policies—such as “job doesn’tallow,” “hard to supervise,” “inflexible work arrangements,” “lack of staff,” “small organiza-tion,” “administrative hassles,” “could lead to coworker resentment,” “union considerations,”and “equal treatment for all employees.” Five percent of employers report no obstacles toimplementing work life benefits, policies, and programs.
Despite these obstacles, 92 percent of employers offer eight or more work life policies,programs or practices, indicating that the business reasons for doing so may be seen asoutweighing the obstacles.
CONCLUSION
In the seven years since we last conducted this study, the economy has been quite volatileand common wisdom would have it that employers would cut back on the work life assistancethey offer employees. Except for reductions in how much employers pay toward benefits thatcost money (their contribution to health care, disability programs, and pension plans), we didnot find this to be the case. Employers have largely maintained or increased the support theyprovide to employees in managing their personal and family lives, probably because, as theyreport, these are increasingly seen as strategic business tools for recruitment, retention, com-mitment, and productivity—and for making work “work” for both employers and employees.
28
Table 21: Business Obstacles to Implementing Family-Friendly Policies
Obstacles Yes
Costs 46%
Impracticality 41%
Other – unclassifiable 23%
(n=1092) Only the % mentioning each option is reported. The percentages add to more than 100%because respondents could mention multiple obstacles.