Embed Size (px)
Citation preview
Janet Eary1, Janet O'Sullivan3, Finbarr O'Sullivan3, E. U. Conrad2
1. Nuclear Medicine/Radiology, University of Washington, Seattle, WA, United States.
2. Orthopedics, University of Washington, Seattle, WA, United States. 3. Statistics, University College Cork, Cork, Ireland
STATISTICAL RISK ANLAYSIS FOR CLINICAL OUTCOMES USING MID-
THERAPY FDG PET IN SARCOMA PATIENTS
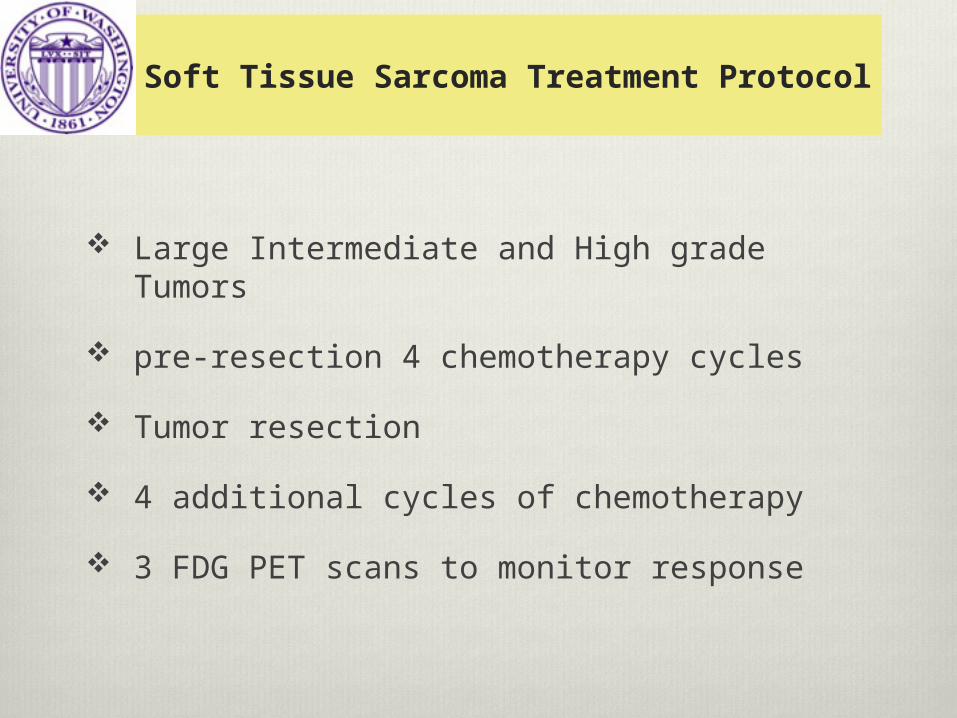
UW Soft Tissue Sarcoma Treatment Protocol
Large Intermediate and High grade Tumors
pre-resection 4 chemotherapy cycles
Tumor resection
4 additional cycles of chemotherapy
3 FDG PET scans to monitor response
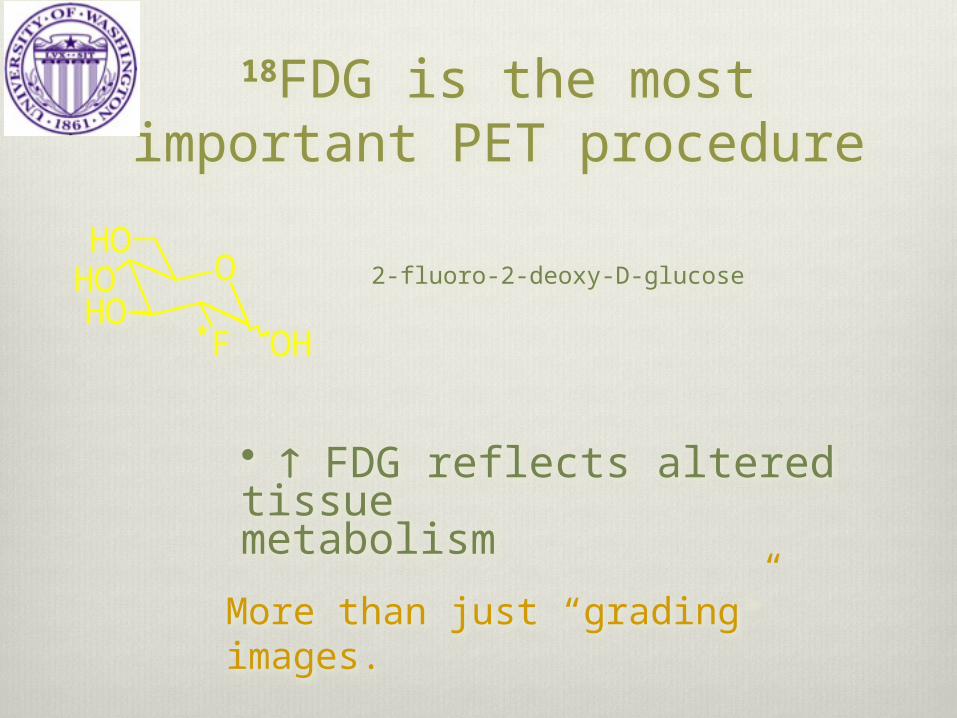
18FDG is the most important PET procedure
2-fluoro-2-deoxy-D-glucose
• FDG reflects altered tissue metabolism
More than just “grading” images.
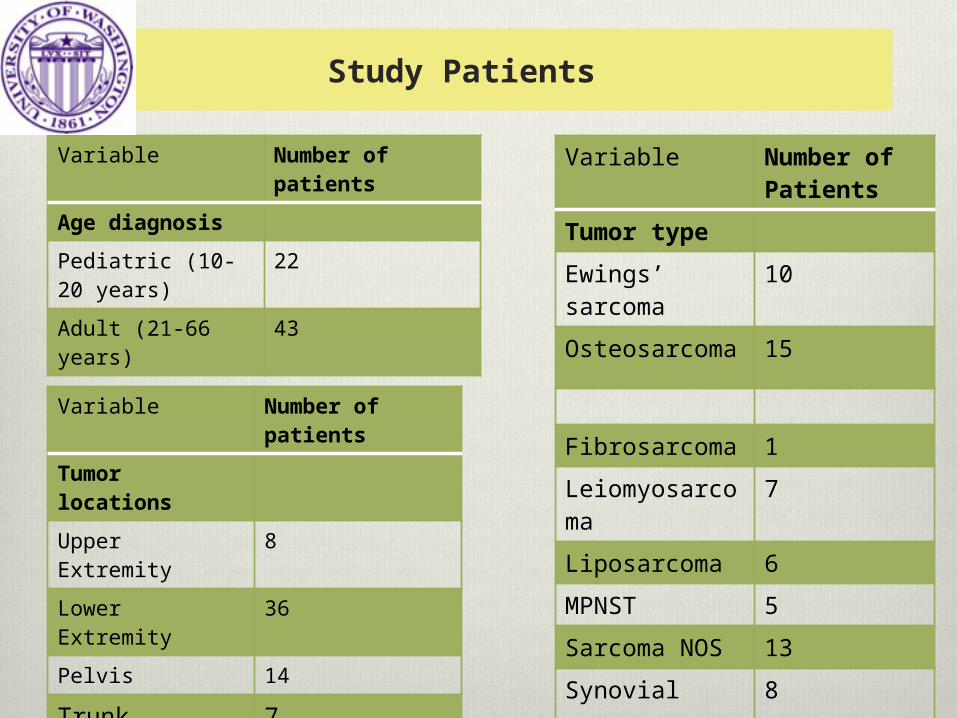
Study Patients
Variable Number of patients
Age diagnosis
Pediatric (10-20 years)
22
Adult (21-66 years)
43
Variable Number of patients
Tumor locations
Upper Extremity 8
Lower Extremity 36
Pelvis 14
Trunk 7
Variable Number of Patients
Tumor type
Ewings’ sarcoma
10
Osteosarcoma 15
Fibrosarcoma 1
Leiomyosarcoma
7
Liposarcoma 6
MPNST 5
Sarcoma NOS 13
Synovial sarcoma
8
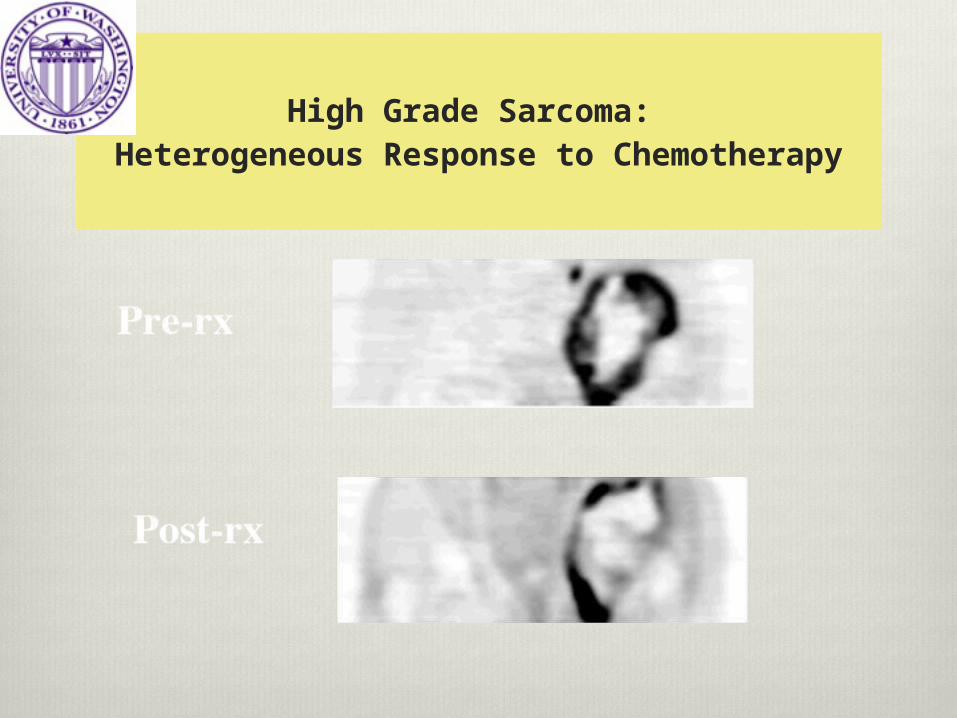
High Grade Sarcoma: Heterogeneous Response to Chemotherapy
: Study : Design : Analysis :
Aims: determine the value of the mid-therapy FDG PET scan for risk assessment for outcome
Hypothesis: the mid-therapy FDG PET scan will add predictive value to outcome prediction
Methods:
Prospective study
Univariate, and multivariate analyses with Cox proportional Hazards analysis, and models for variables for data reduction
Creation of clinical risk scenarios for different sets of clinical variable combinations
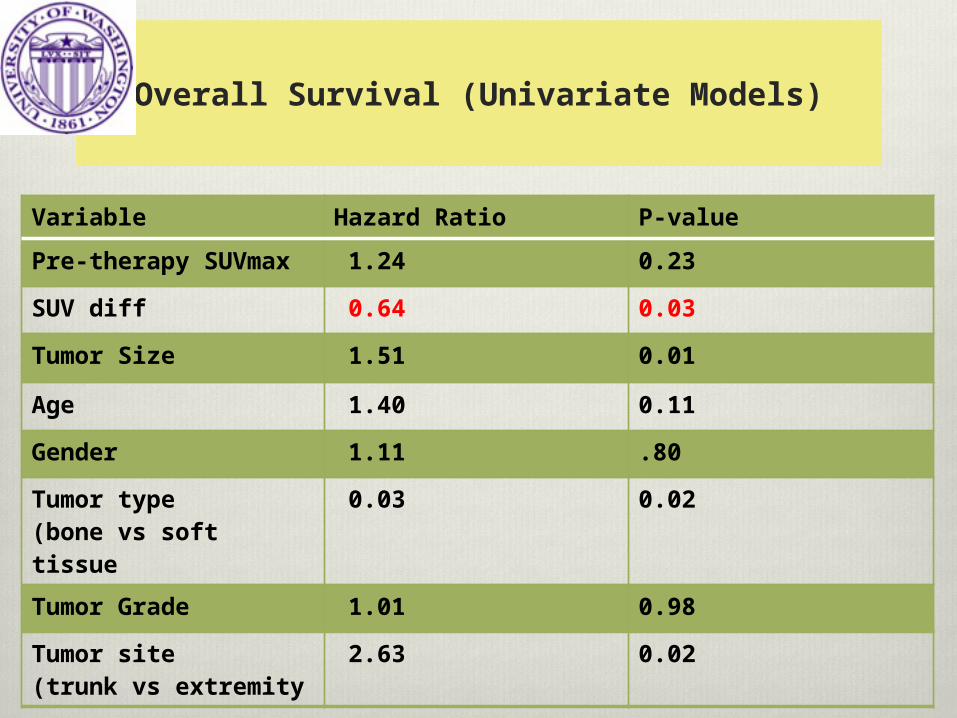
Overall Survival (Univariate Models)
Variable Hazard Ratio P-value
Pre-therapy SUVmax 1.24 0.23
SUV diff 0.64 0.03
Tumor Size 1.51 0.01
Age 1.40 0.11
Gender 1.11 .80
Tumor type (bone vs soft tissue
0.03 0.02
Tumor Grade 1.01 0.98
Tumor site (trunk vs extremity
2.63 0.02
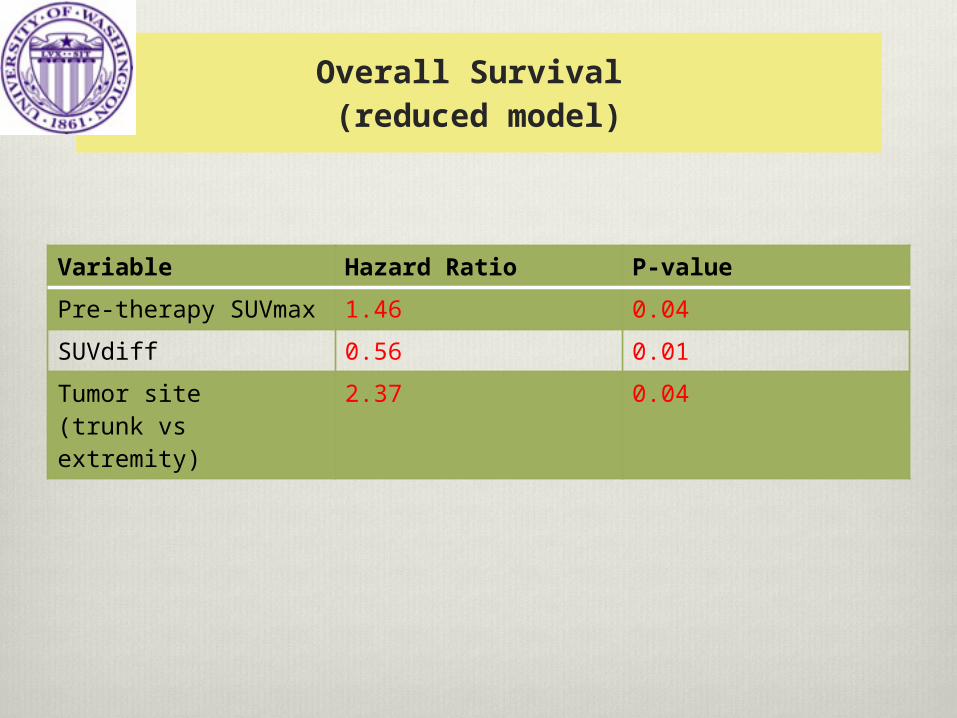
Overall Survival (reduced model)
Variable Hazard Ratio P-value
Pre-therapy SUVmax 1.46 0.04
SUVdiff 0.56 0.01
Tumor site(trunk vs extremity)
2.37 0.04
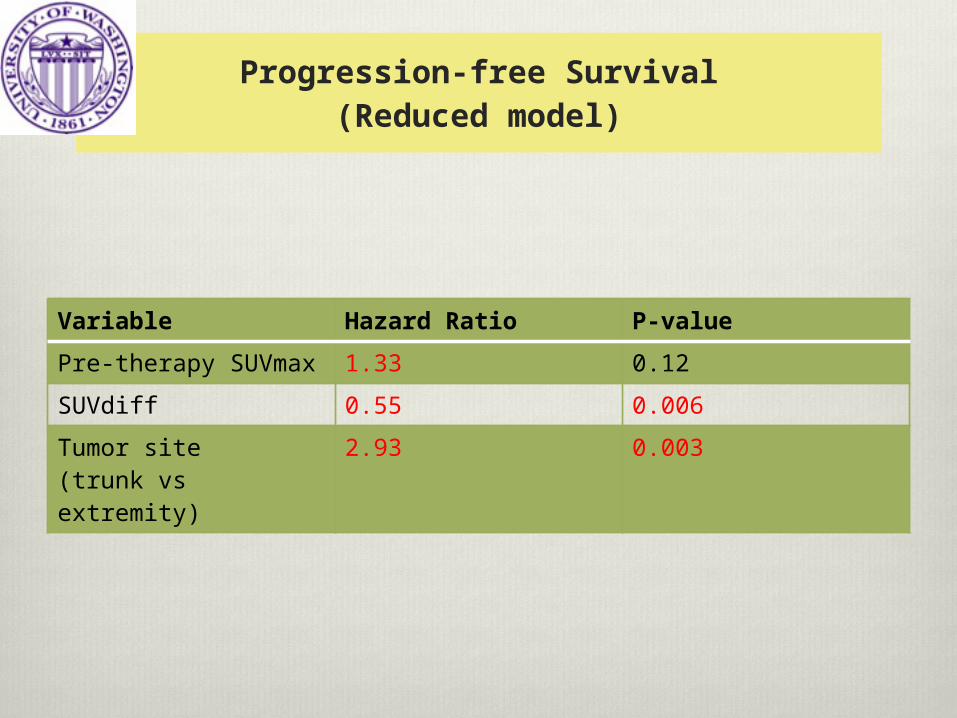
Progression-free Survival(Reduced model)
Variable Hazard Ratio P-value
Pre-therapy SUVmax 1.33 0.12
SUVdiff 0.55 0.006
Tumor site(trunk vs extremity)
2.93 0.003
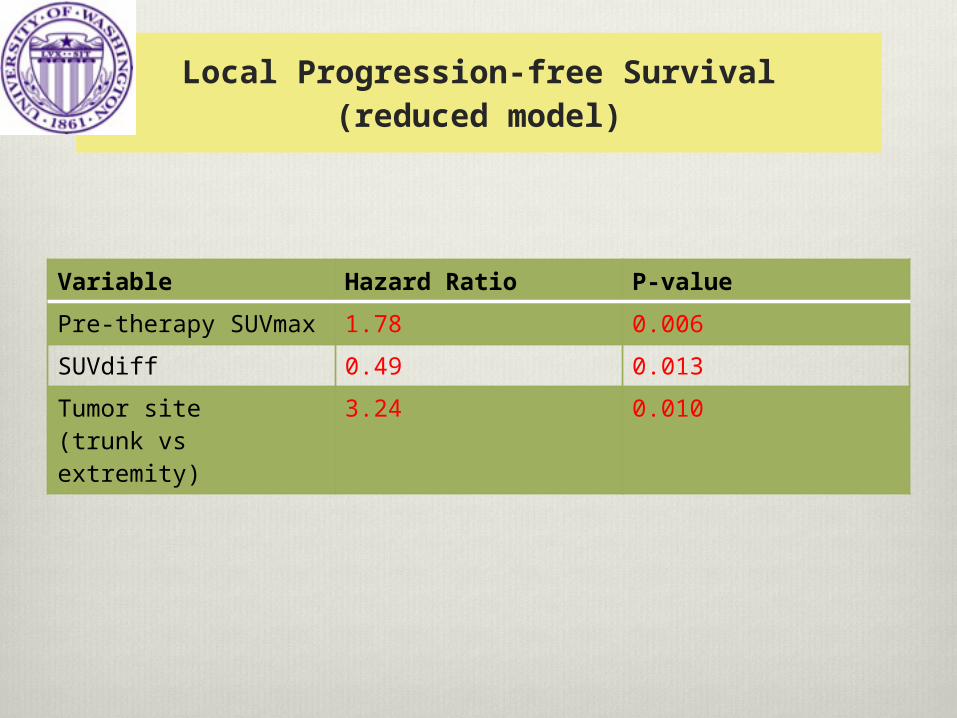
Local Progression-free Survival(reduced model)
Variable Hazard Ratio P-value
Pre-therapy SUVmax 1.78 0.006
SUVdiff 0.49 0.013
Tumor site(trunk vs extremity)
3.24 0.010
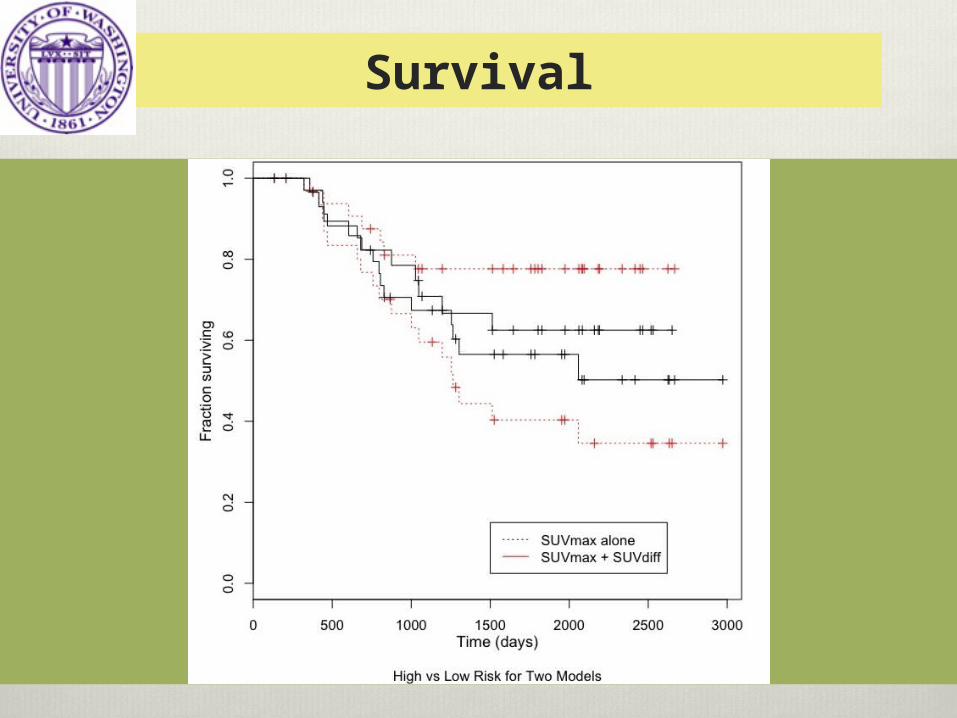
Survival
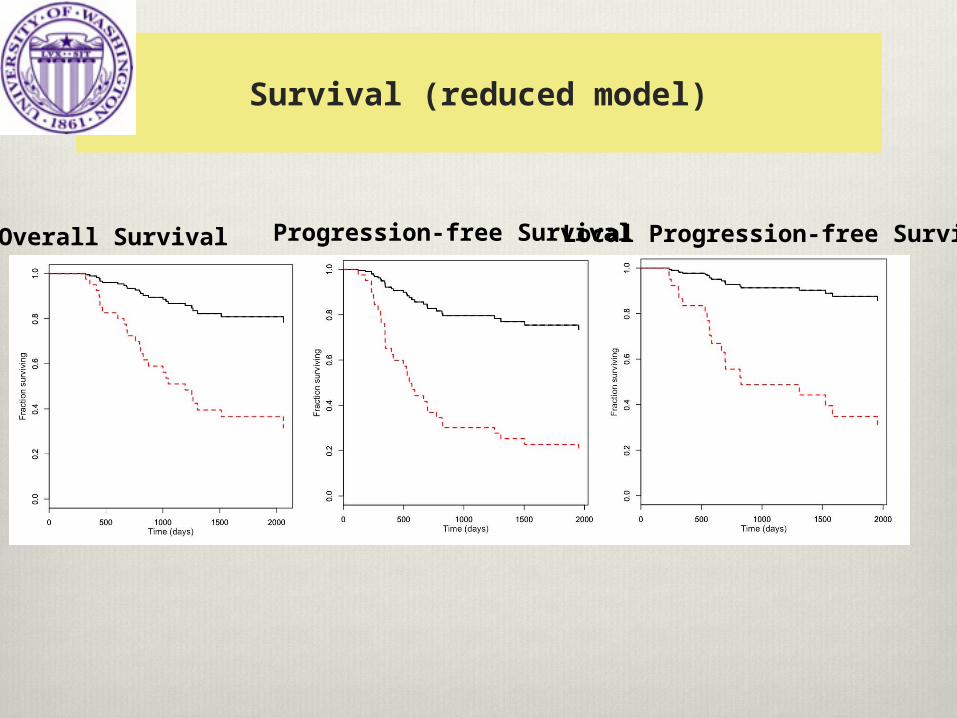
Survival (reduced model)
Overall Survival Progression-free SurvivalLocal Progression-free Survival
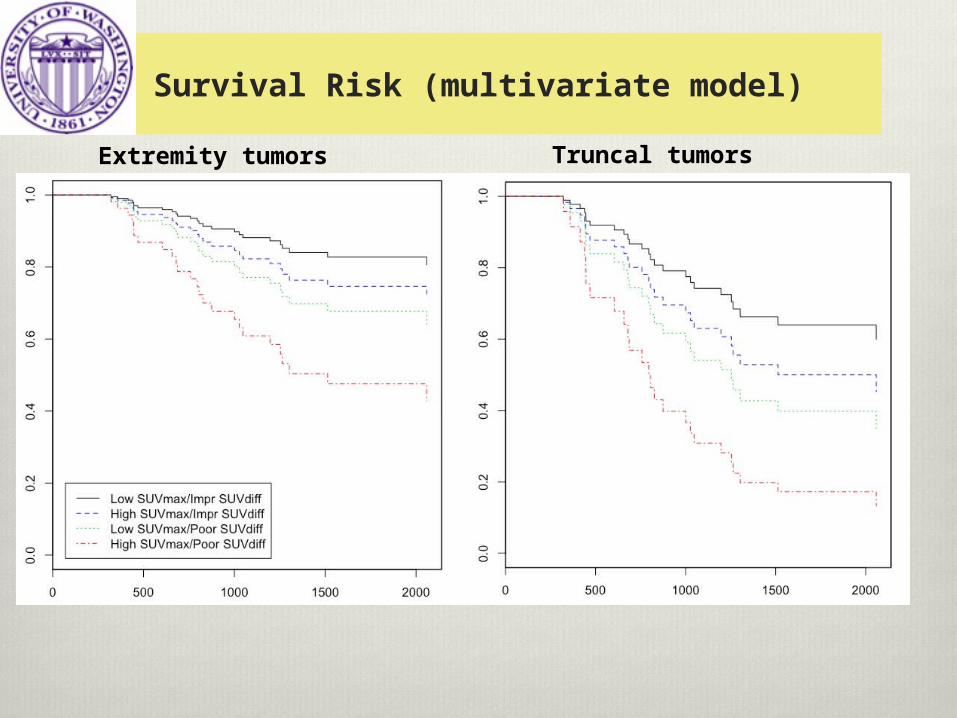
Survival Risk (multivariate model)
Extremity tumors Truncal tumors
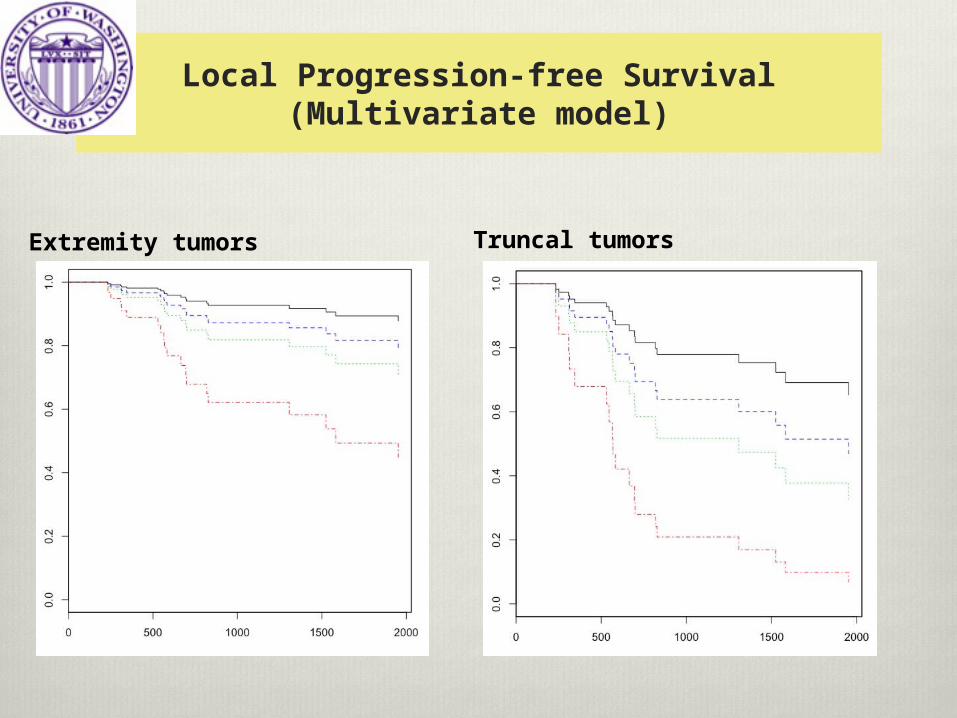
Local Progression-free Survival(Multivariate model)
Extremity tumors Truncal tumors
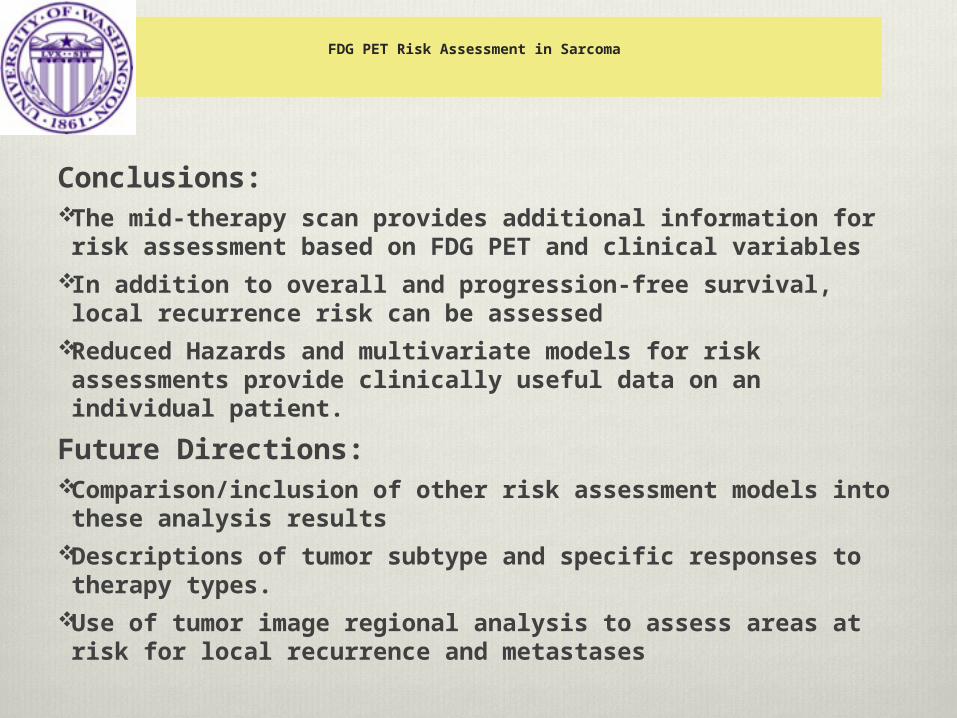
FDG PET Risk Assessment in Sarcoma
Conclusions: The mid-therapy scan provides additional information
for risk assessment based on FDG PET and clinical variables
In addition to overall and progression-free survival, local recurrence risk can be assessed
Reduced Hazards and multivariate models for risk assessments provide clinically useful data on an individual patient.
Future Directions: Comparison/inclusion of other risk assessment models
into these analysis results Descriptions of tumor subtype and specific responses to
therapy types. Use of tumor image regional analysis to assess areas at
risk for local recurrence and metastases
Support your local Molecular
Imaging Center !(thanks.)

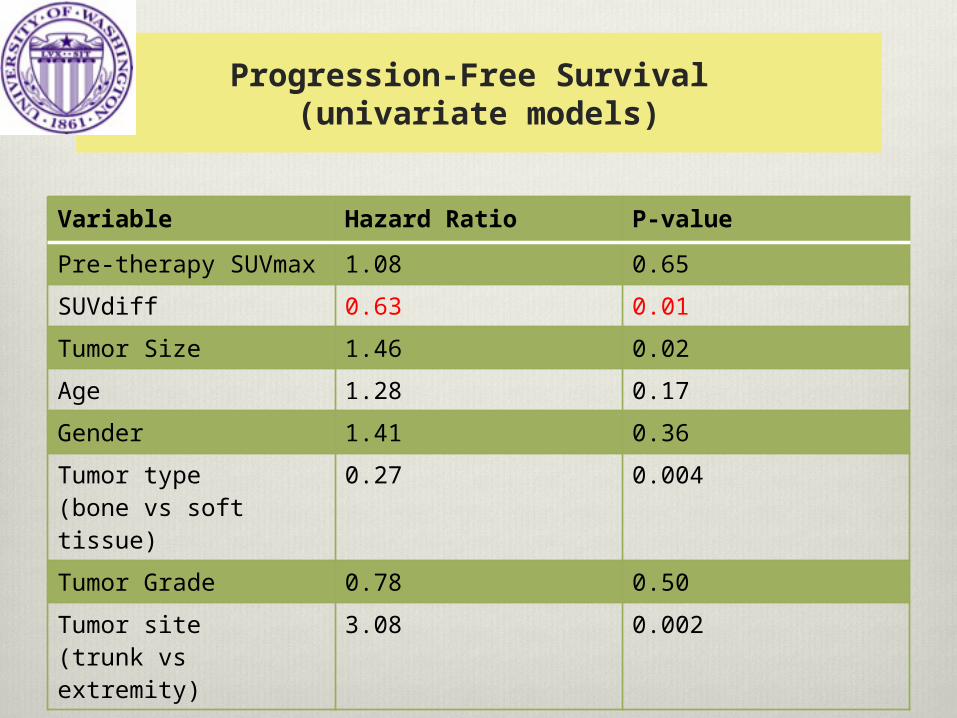
Progression-Free Survival (univariate models)
Variable Hazard Ratio P-value
Pre-therapy SUVmax 1.08 0.65
SUVdiff 0.63 0.01
Tumor Size 1.46 0.02
Age 1.28 0.17
Gender 1.41 0.36
Tumor type(bone vs soft tissue)
0.27 0.004
Tumor Grade 0.78 0.50
Tumor site(trunk vs extremity)
3.08 0.002
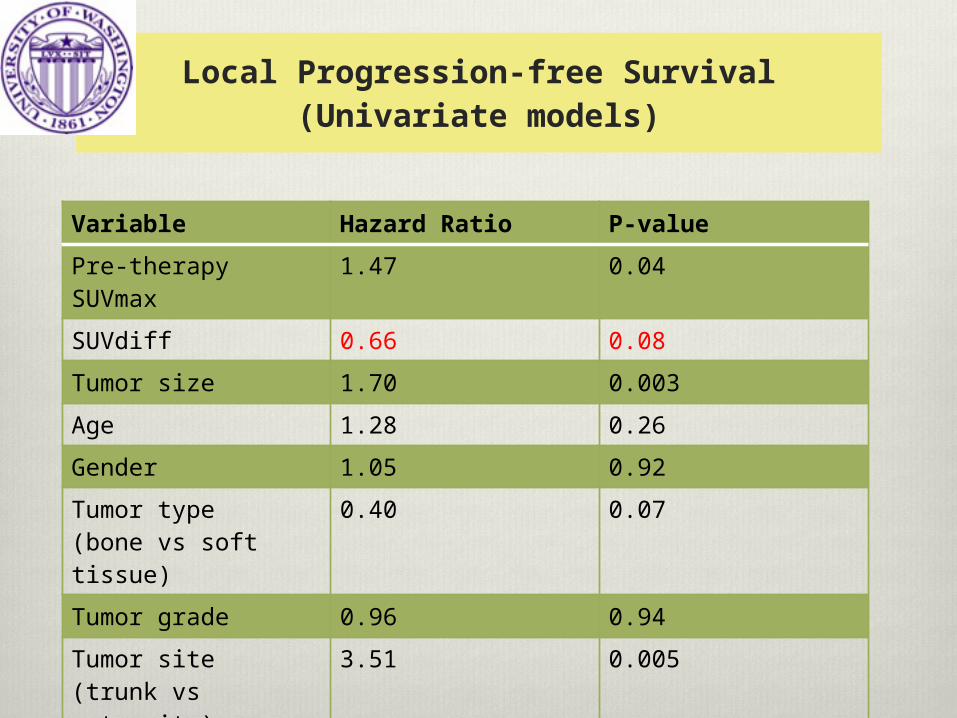
Local Progression-free Survival(Univariate models)
Variable Hazard Ratio P-value
Pre-therapy SUVmax 1.47 0.04
SUVdiff 0.66 0.08
Tumor size 1.70 0.003
Age 1.28 0.26
Gender 1.05 0.92
Tumor type(bone vs soft tissue)
0.40 0.07
Tumor grade 0.96 0.94
Tumor site(trunk vs extremity)
3.51 0.005
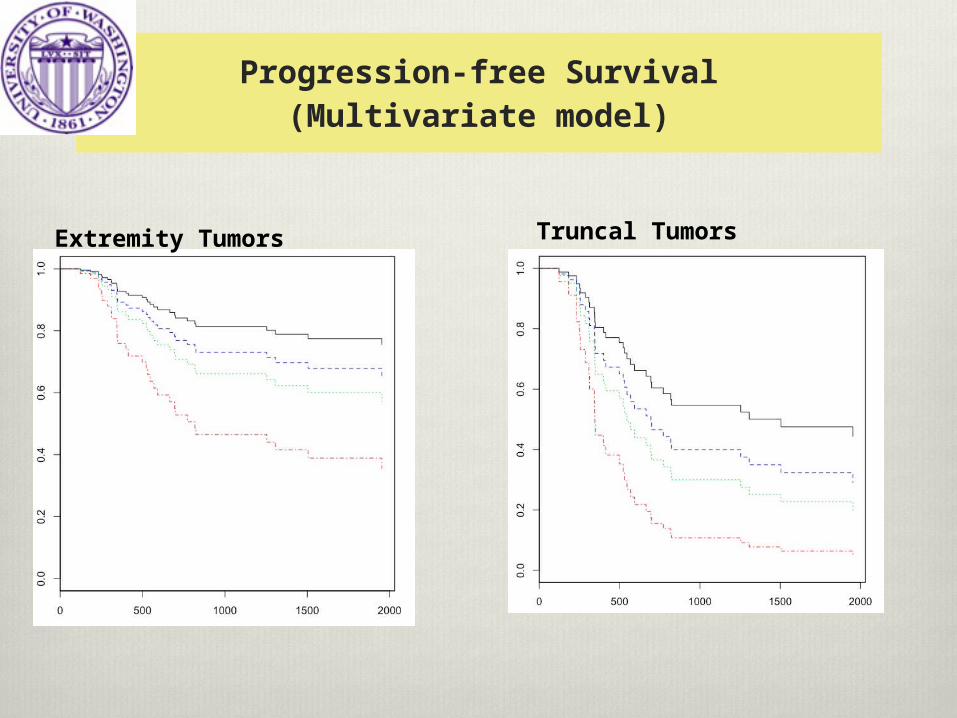
Progression-free Survival(Multivariate model)
Extremity Tumors Truncal Tumors
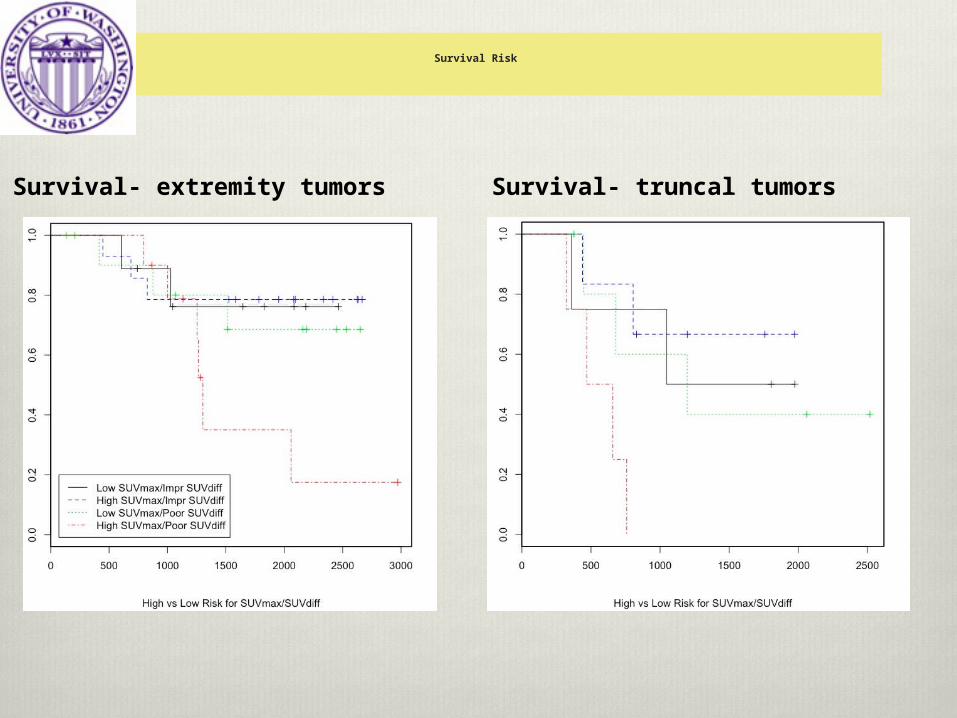
Survival Risk
Survival- extremity tumors Survival- truncal tumors


![Agile Working - what it is and why it matters [John Eary]](https://img.pdfslide.net/doc/110x75/55a50c3f1a28abdf588b46c3/agile-working-what-it-is-and-why-it-matters-john-eary.jpg)