Embed Size (px)
Citation preview
Saudi Equities Outlook Time to go long on the Saudi Reform Story
January 01, 2018
Research Team
+966 11 2036807
Economic and Market Outlook 2
Riyad Capital Research Team
Muhammad Faisal Potrik
Head of Research
+966 11 2036807
Santhosh Balakrishnan
Senior Research Analyst
+966 11 2036809
Mansour A. Al-Ammari
Asst. Research Analyst
Abdullah A. Al-Rayes
Asst. Research Analyst
Aiyaz M Hassan
Senior Technical Analyst
Fahad K. Al-Asgah
Asst. Research Analyst
Seham M. Al-Zayed
Asst. Research Analyst
Alanoud K. Al-Moammar
Asst. Research Analyst
Shaykhah A. Al-Dosari
Asst. Research Analyst
Economic and Market Outlook 3
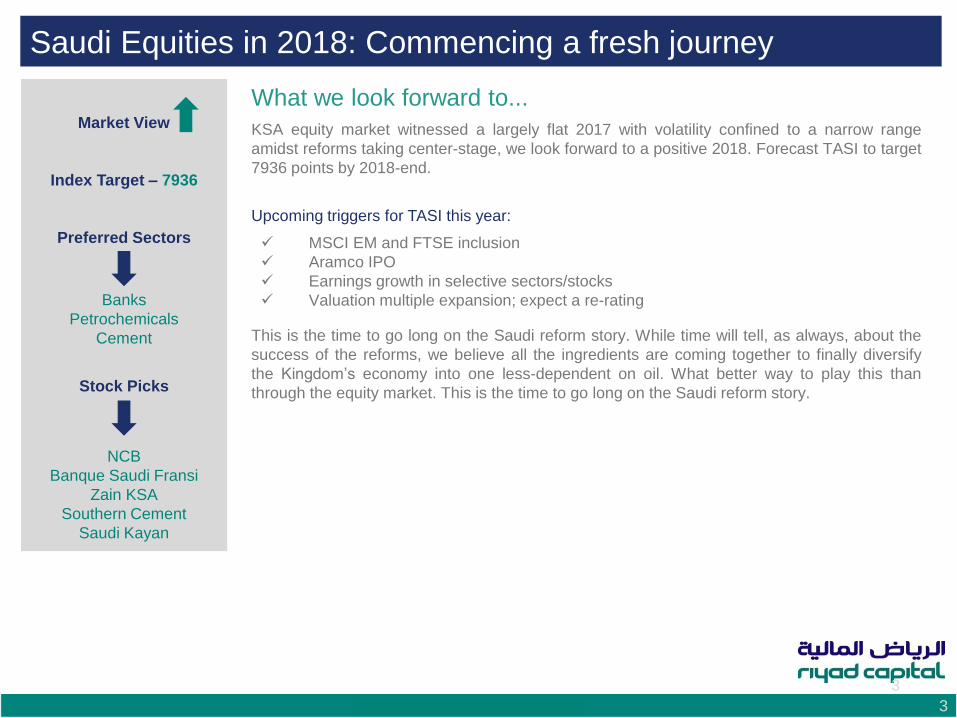
Saudi Equities in 2018: Commencing a fresh journey
3
KSA equity market witnessed a largely flat 2017 with volatility confined to a narrow range
amidst reforms taking center-stage, we look forward to a positive 2018. Forecast TASI to target
7936 points by 2018-end.
Upcoming triggers for TASI this year:
MSCI EM and FTSE inclusion
Aramco IPO
Earnings growth in selective sectors/stocks
Valuation multiple expansion; expect a re-rating
This is the time to go long on the Saudi reform story. While time will tell, as always, about the
success of the reforms, we believe all the ingredients are coming together to finally diversify
the Kingdom’s economy into one less-dependent on oil. What better way to play this than
through the equity market. This is the time to go long on the Saudi reform story.
What we look forward to...
Market View
Index Target – 7936
Preferred Sectors
Banks
Petrochemicals
Cement
Stock Picks
NCB
Banque Saudi Fransi
Zain KSA
Southern Cement
Saudi Kayan
Economic and Market Outlook 4
2017 in Review and Outlook for 2018
We view 2018 as a year of restarting economic growth pushed by revenue diversification and prudent expenditures.
Expected government spending would be a key determinant of economic growth.
TASI remained in a very tight range in 2017, registering only a 500 points difference between the high and low.
2017 was a year of economic consolidation as the government rolled out reform plans and implemented key revenue
measures such as the so-called ‘sin tax’, ‘expat dependent fees’ etc.
Recently announced 2018 budget gives an achievable roadmap for 2019-23 to reignite economic growth.
Fundamentally, major sectors such as Banks and Petrochemicals achieved substantial (and unexpected) earnings
growth, which has yet to be reflected in stock prices, in our view.
Concurrently, the Kingdom was in global headlines for social reforms such as lifting the ban on women driving, re-
opening of cinemas, amongst others. This has projected a much-needed soft image of the Kingdom.
Commencement of cash transfer payments through the ‘Citizens Account’ puts a social net for low and middle-income
families against higher energy prices.
Tadawul would be influenced by two main events this year: decision on MSCI inclusion and the Aramco IPO, both of
which have the potential to bring much-awaited material foreign investment into the market.
However, energy price reforms and VAT coupled with expat fees may be a short-term dampener for corporate earnings
and retail purchasing power.
All in all, we are positive on the TASI year-on-year with a target of 7936 points by Dec 2018.
Economic and Market Outlook 5
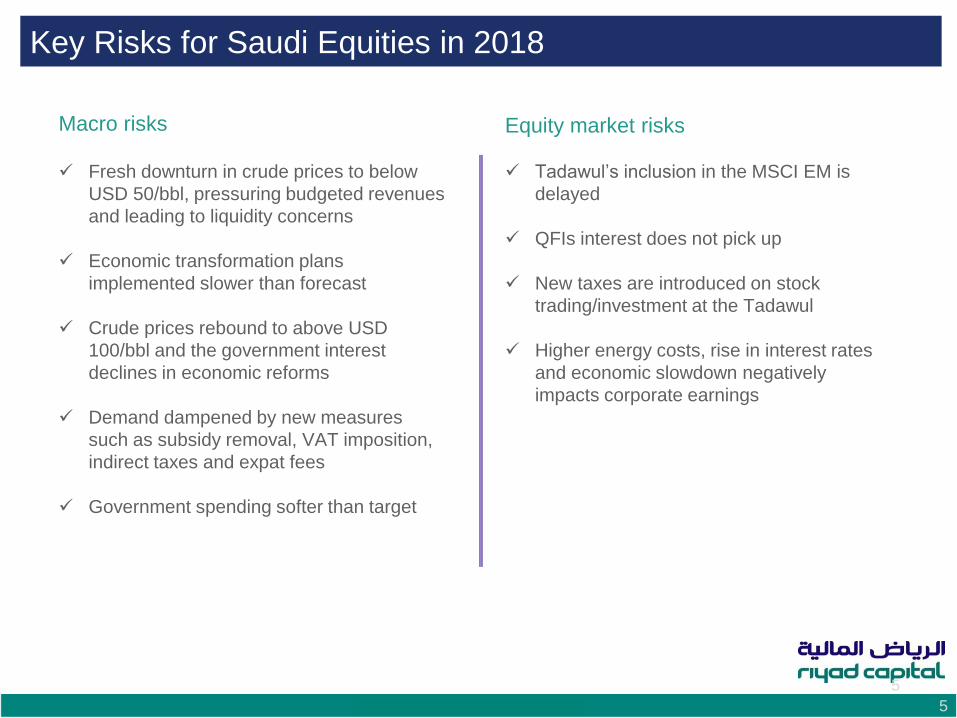
Key Risks for Saudi Equities in 2018
5
Fresh downturn in crude prices to below
USD 50/bbl, pressuring budgeted revenues
and leading to liquidity concerns
Economic transformation plans
implemented slower than forecast
Crude prices rebound to above USD
100/bbl and the government interest
declines in economic reforms
Demand dampened by new measures
such as subsidy removal, VAT imposition,
indirect taxes and expat fees
Government spending softer than target
Macro risks
Tadawul’s inclusion in the MSCI EM is
delayed
QFIs interest does not pick up
New taxes are introduced on stock
trading/investment at the Tadawul
Higher energy costs, rise in interest rates
and economic slowdown negatively
impacts corporate earnings
Equity market risks
Economic and Market Outlook 6
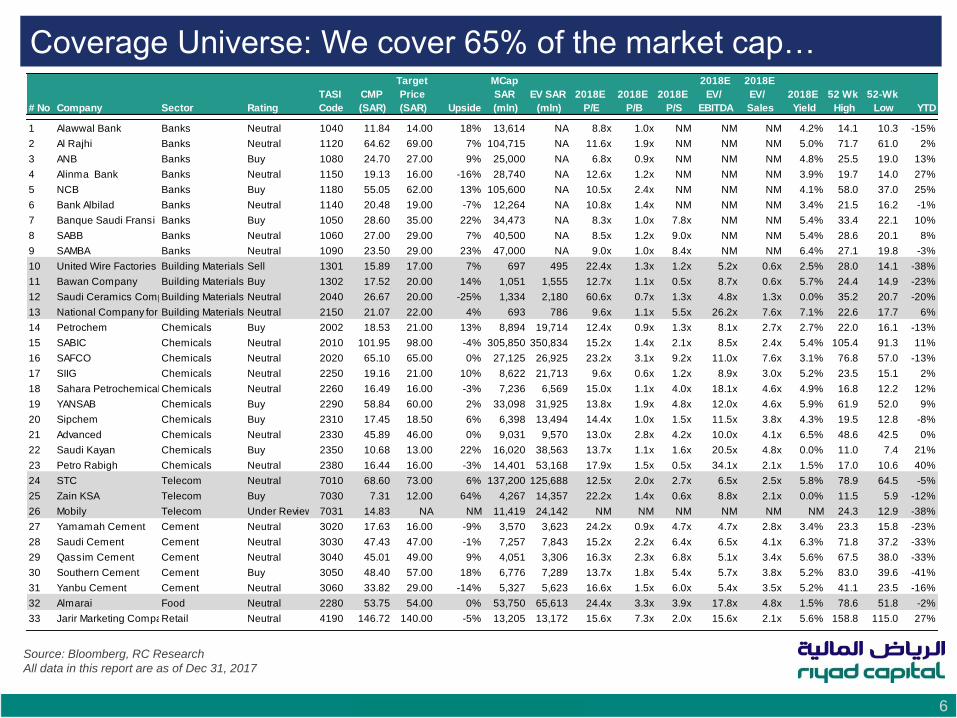
Coverage Universe: We cover 65% of the market cap…
Source: Bloomberg, RC Research
All data in this report are as of Dec 31, 2017
# No Company Sector Rating
TASI
Code
CMP
(SAR)
Target
Price
(SAR) Upside
MCap
SAR
(mln)
EV SAR
(mln)
2018E
P/E
2018E
P/B
2018E
P/S
2018E
EV/
EBITDA
2018E
EV/
Sales
2018E
Yield
52 Wk
High
52-Wk
Low YTD
1 Alawwal Bank Banks Neutral 1040 11.84 14.00 18% 13,614 NA 8.8x 1.0x NM NM NM 4.2% 14.1 10.3 -15%
2 Al Rajhi Banks Neutral 1120 64.62 69.00 7% 104,715 NA 11.6x 1.9x NM NM NM 5.0% 71.7 61.0 2%
3 ANB Banks Buy 1080 24.70 27.00 9% 25,000 NA 6.8x 0.9x NM NM NM 4.8% 25.5 19.0 13%
4 Alinma Bank Banks Neutral 1150 19.13 16.00 -16% 28,740 NA 12.6x 1.2x NM NM NM 3.9% 19.7 14.0 27%
5 NCB Banks Buy 1180 55.05 62.00 13% 105,600 NA 10.5x 2.4x NM NM NM 4.1% 58.0 37.0 25%
6 Bank Albilad Banks Neutral 1140 20.48 19.00 -7% 12,264 NA 10.8x 1.4x NM NM NM 3.4% 21.5 16.2 -1%
7 Banque Saudi Fransi Banks Buy 1050 28.60 35.00 22% 34,473 NA 8.3x 1.0x 7.8x NM NM 5.4% 33.4 22.1 10%
8 SABB Banks Neutral 1060 27.00 29.00 7% 40,500 NA 8.5x 1.2x 9.0x NM NM 5.4% 28.6 20.1 8%
9 SAMBA Banks Neutral 1090 23.50 29.00 23% 47,000 NA 9.0x 1.0x 8.4x NM NM 6.4% 27.1 19.8 -3%
10 United Wire Factories CompanyBuilding Materials Sell 1301 15.89 17.00 7% 697 495 22.4x 1.3x 1.2x 5.2x 0.6x 2.5% 28.0 14.1 -38%
11 Bawan Company Building Materials Buy 1302 17.52 20.00 14% 1,051 1,555 12.7x 1.1x 0.5x 8.7x 0.6x 5.7% 24.4 14.9 -23%
12 Saudi Ceramics CompanyBuilding Materials Neutral 2040 26.67 20.00 -25% 1,334 2,180 60.6x 0.7x 1.3x 4.8x 1.3x 0.0% 35.2 20.7 -20%
13 National Company for Glass IndustriesBuilding Materials Neutral 2150 21.07 22.00 4% 693 786 9.6x 1.1x 5.5x 26.2x 7.6x 7.1% 22.6 17.7 6%
14 Petrochem Chemicals Buy 2002 18.53 21.00 13% 8,894 19,714 12.4x 0.9x 1.3x 8.1x 2.7x 2.7% 22.0 16.1 -13%
15 SABIC Chemicals Neutral 2010 101.95 98.00 -4% 305,850 350,834 15.2x 1.4x 2.1x 8.5x 2.4x 5.4% 105.4 91.3 11%
16 SAFCO Chemicals Neutral 2020 65.10 65.00 0% 27,125 26,925 23.2x 3.1x 9.2x 11.0x 7.6x 3.1% 76.8 57.0 -13%
17 SIIG Chemicals Neutral 2250 19.16 21.00 10% 8,622 21,713 9.6x 0.6x 1.2x 8.9x 3.0x 5.2% 23.5 15.1 2%
18 Sahara PetrochemicalChemicals Neutral 2260 16.49 16.00 -3% 7,236 6,569 15.0x 1.1x 4.0x 18.1x 4.6x 4.9% 16.8 12.2 12%
19 YANSAB Chemicals Buy 2290 58.84 60.00 2% 33,098 31,925 13.8x 1.9x 4.8x 12.0x 4.6x 5.9% 61.9 52.0 9%
20 Sipchem Chemicals Buy 2310 17.45 18.50 6% 6,398 13,494 14.4x 1.0x 1.5x 11.5x 3.8x 4.3% 19.5 12.8 -8%
21 Advanced Chemicals Neutral 2330 45.89 46.00 0% 9,031 9,570 13.0x 2.8x 4.2x 10.0x 4.1x 6.5% 48.6 42.5 0%
22 Saudi Kayan Chemicals Buy 2350 10.68 13.00 22% 16,020 38,563 13.7x 1.1x 1.6x 20.5x 4.8x 0.0% 11.0 7.4 21%
23 Petro Rabigh Chemicals Neutral 2380 16.44 16.00 -3% 14,401 53,168 17.9x 1.5x 0.5x 34.1x 2.1x 1.5% 17.0 10.6 40%
24 STC Telecom Neutral 7010 68.60 73.00 6% 137,200 125,688 12.5x 2.0x 2.7x 6.5x 2.5x 5.8% 78.9 64.5 -5%
25 Zain KSA Telecom Buy 7030 7.31 12.00 64% 4,267 14,357 22.2x 1.4x 0.6x 8.8x 2.1x 0.0% 11.5 5.9 -12%
26 Mobily Telecom Under Review 7031 14.83 NA NM 11,419 24,142 NM NM NM NM NM NM 24.3 12.9 -38%
27 Yamamah Cement Cement Neutral 3020 17.63 16.00 -9% 3,570 3,623 24.2x 0.9x 4.7x 4.7x 2.8x 3.4% 23.3 15.8 -23%
28 Saudi Cement Cement Neutral 3030 47.43 47.00 -1% 7,257 7,843 15.2x 2.2x 6.4x 6.5x 4.1x 6.3% 71.8 37.2 -33%
29 Qassim Cement Cement Neutral 3040 45.01 49.00 9% 4,051 3,306 16.3x 2.3x 6.8x 5.1x 3.4x 5.6% 67.5 38.0 -33%
30 Southern Cement Cement Buy 3050 48.40 57.00 18% 6,776 7,289 13.7x 1.8x 5.4x 5.7x 3.8x 5.2% 83.0 39.6 -41%
31 Yanbu Cement Cement Neutral 3060 33.82 29.00 -14% 5,327 5,623 16.6x 1.5x 6.0x 5.4x 3.5x 5.2% 41.1 23.5 -16%
32 Almarai Food Neutral 2280 53.75 54.00 0% 53,750 65,613 24.4x 3.3x 3.9x 17.8x 4.8x 1.5% 78.6 51.8 -2%
33 Jarir Marketing CompanyRetail Neutral 4190 146.72 140.00 -5% 13,205 13,172 15.6x 7.3x 2.0x 15.6x 2.1x 5.6% 158.8 115.0 27%
Economic and Market Outlook 7
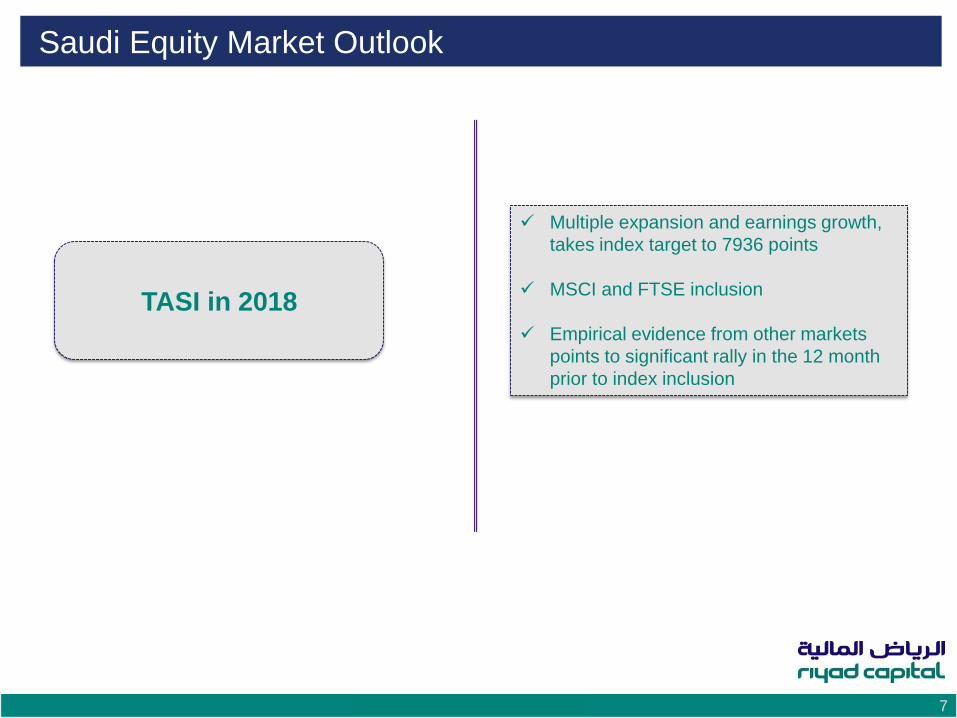
Saudi Equity Market Outlook
Multiple expansion and earnings growth,
takes index target to 7936 points
MSCI and FTSE inclusion
Empirical evidence from other markets
points to significant rally in the 12 month
prior to index inclusion
TASI in 2018
Economic and Market Outlook 8
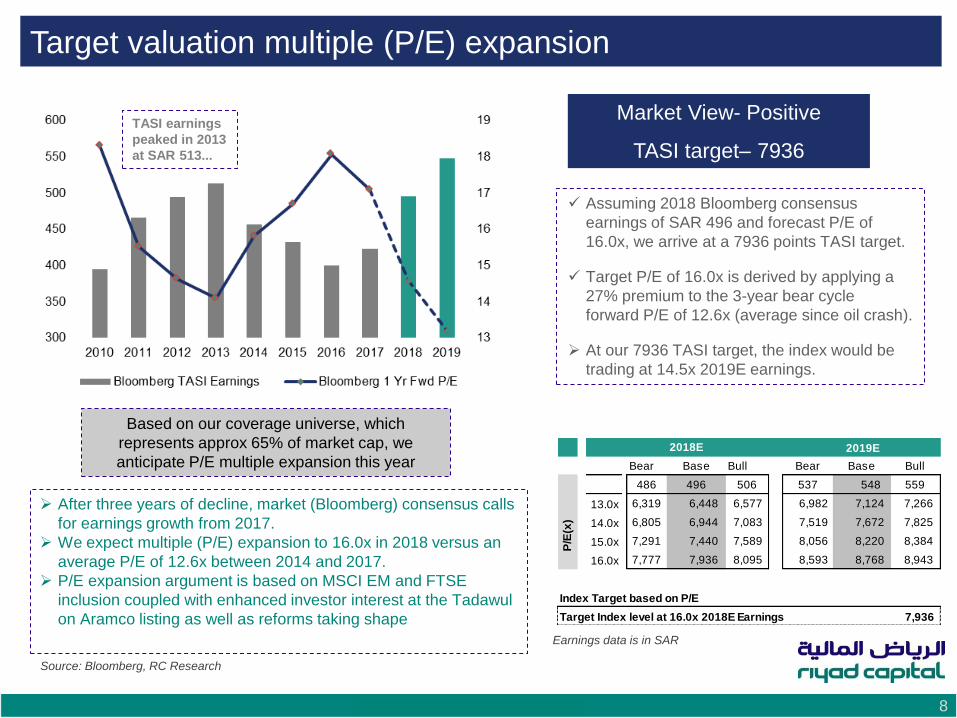
Target valuation multiple (P/E) expansion
Source: Bloomberg, RC Research
Market View- Positive
TASI target– 7936
After three years of decline, market (Bloomberg) consensus calls
for earnings growth from 2017.
We expect multiple (P/E) expansion to 16.0x in 2018 versus an
average P/E of 12.6x between 2014 and 2017.
P/E expansion argument is based on MSCI EM and FTSE
inclusion coupled with enhanced investor interest at the Tadawul
on Aramco listing as well as reforms taking shape
Based on our coverage universe, which
represents approx 65% of market cap, we
anticipate P/E multiple expansion this year
Assuming 2018 Bloomberg consensus
earnings of SAR 496 and forecast P/E of
16.0x, we arrive at a 7936 points TASI target.
Target P/E of 16.0x is derived by applying a
27% premium to the 3-year bear cycle
forward P/E of 12.6x (average since oil crash).
At our 7936 TASI target, the index would be
trading at 14.5x 2019E earnings.
TASI earnings
peaked in 2013
at SAR 513...
2018E 2019E
Bear Base Bull Bear Base Bull
486 496 506 537 548 559
13.0x 6,319 6,448 6,577 6,982 7,124 7,266
14.0x 6,805 6,944 7,083 7,519 7,672 7,825
15.0x 7,291 7,440 7,589 8,056 8,220 8,384
16.0x 7,777 7,936 8,095 8,593 8,768 8,943
Target Index level at 16.0x 2018E Earnings 7,936
Index Target based on P/E
P
/E(x
)
Earnings data is in SAR
Economic and Market Outlook 9
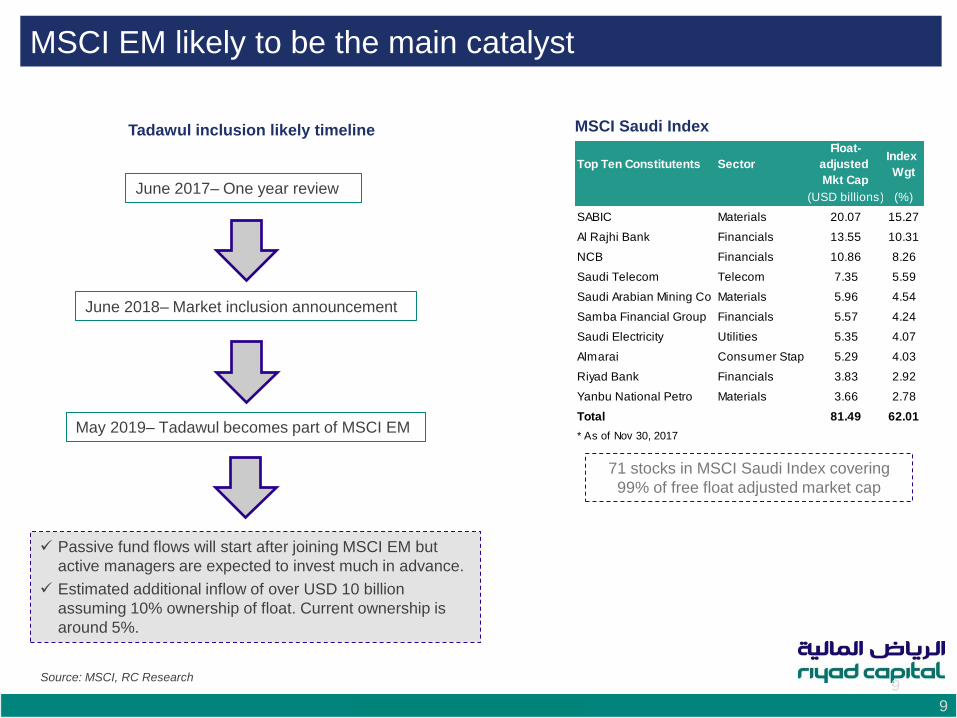
MSCI EM likely to be the main catalyst
9 Source: MSCI, RC Research
Passive fund flows will start after joining MSCI EM but
active managers are expected to invest much in advance.
Estimated additional inflow of over USD 10 billion
assuming 10% ownership of float. Current ownership is
around 5%.
Tadawul inclusion likely timeline MSCI Saudi Index
71 stocks in MSCI Saudi Index covering
99% of free float adjusted market cap
June 2017– One year review
June 2018– Market inclusion announcement
May 2019– Tadawul becomes part of MSCI EM
Top Ten Constitutents Sector
Float-
adjusted
Mkt Cap
Index
Wgt
(USD billions) (%)
SABIC Materials 20.07 15.27
Al Rajhi Bank Financials 13.55 10.31
NCB Financials 10.86 8.26
Saudi Telecom Telecom 7.35 5.59
Saudi Arabian Mining Co Materials 5.96 4.54
Samba Financial Group Financials 5.57 4.24
Saudi Electricity Utilities 5.35 4.07
Almarai Consumer Stap 5.29 4.03
Riyad Bank Financials 3.83 2.92
Yanbu National Petro Materials 3.66 2.78
Total 81.49 62.01
* As of Nov 30, 2017
Economic and Market Outlook
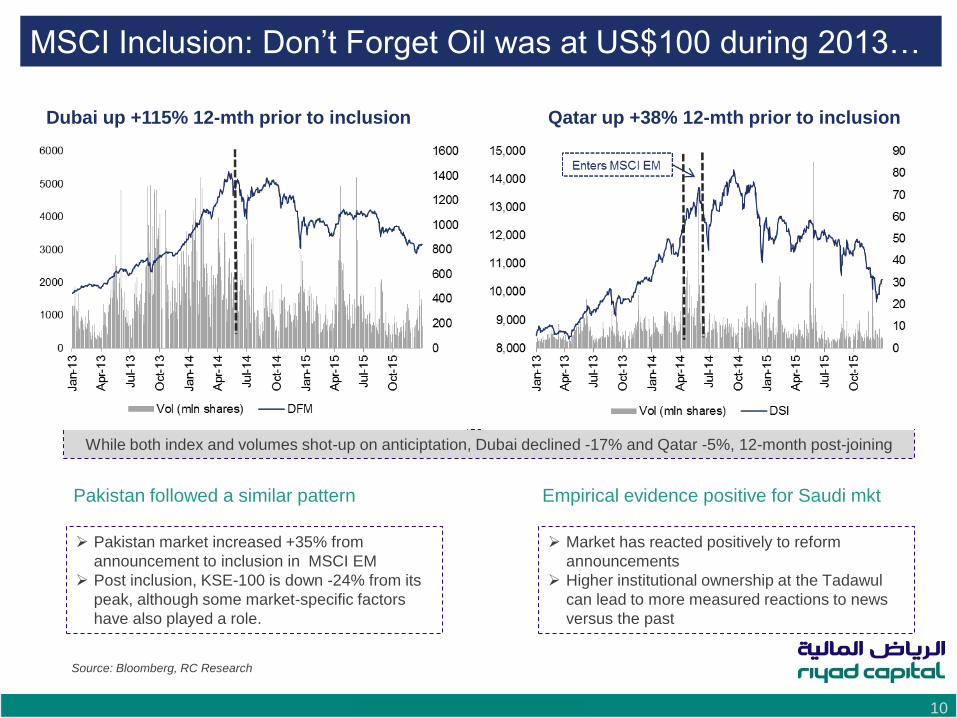
MSCI Inclusion: Don’t Forget Oil was at US$100 during 2013…
10
Source: Bloomberg, RC Research
Dubai up +115% 12-mth prior to inclusion
Empirical evidence positive for Saudi mkt Pakistan followed a similar pattern
Qatar up +38% 12-mth prior to inclusion
While both index and volumes shot-up on anticiptation, Dubai declined -17% and Qatar -5%, 12-month post-joining
Pakistan market increased +35% from
announcement to inclusion in MSCI EM
Post inclusion, KSE-100 is down -24% from its
peak, although some market-specific factors
have also played a role.
Market has reacted positively to reform
announcements
Higher institutional ownership at the Tadawul
can lead to more measured reactions to news
versus the past
Economic and Market Outlook 11
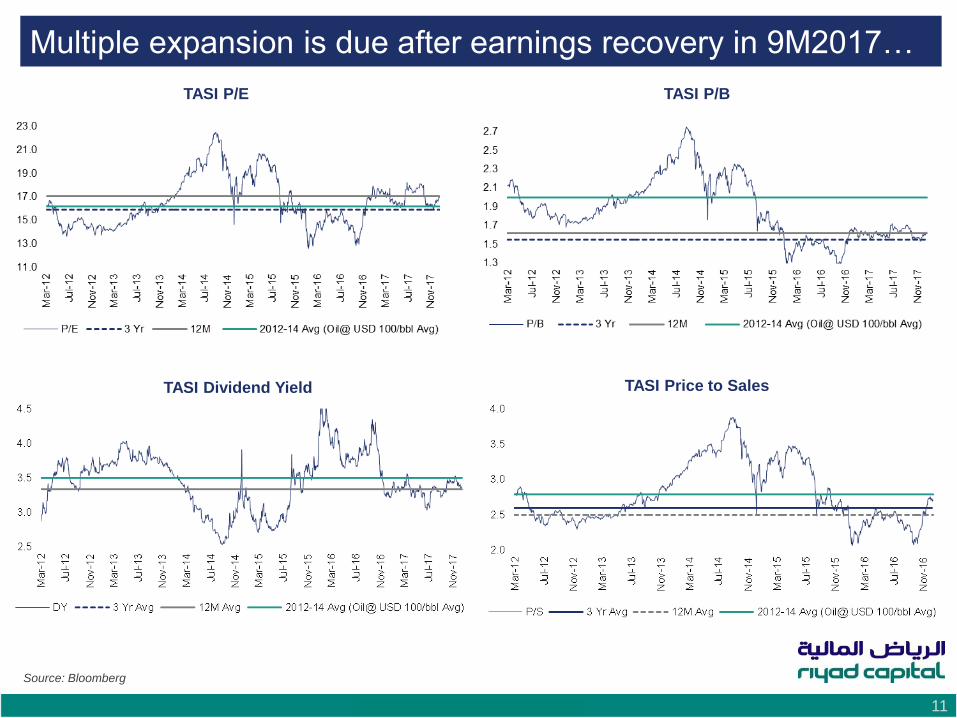
Multiple expansion is due after earnings recovery in 9M2017…
TASI Price to Sales
TASI P/E
TASI Dividend Yield
TASI P/B
Source: Bloomberg
Economic and Market Outlook 12
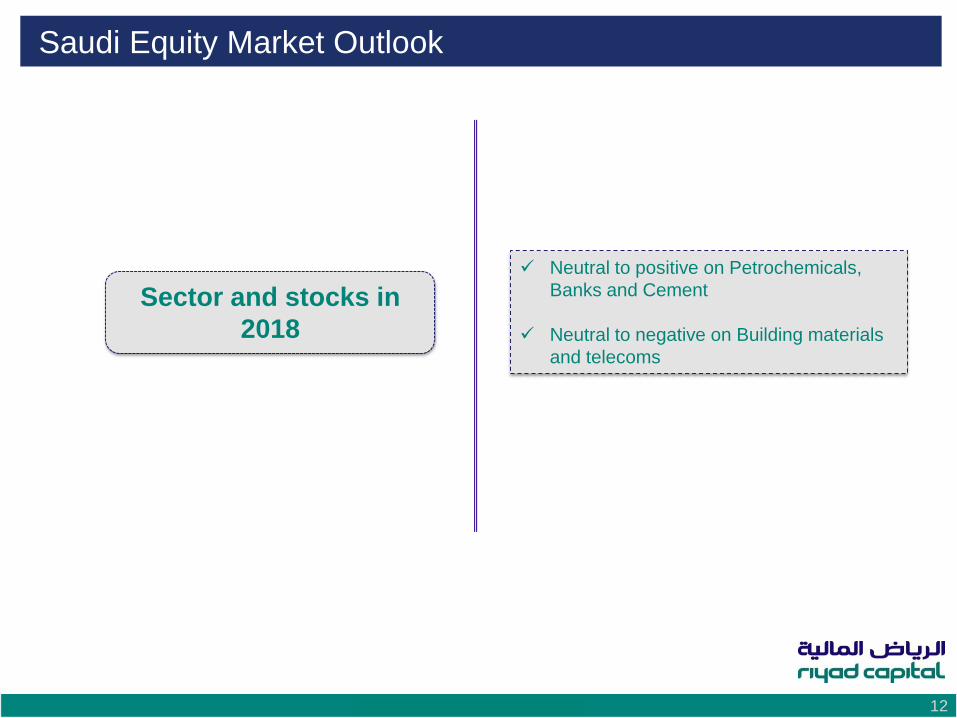
Saudi Equity Market Outlook
Neutral to positive on Petrochemicals,
Banks and Cement
Neutral to negative on Building materials
and telecoms
Sector and stocks in
2018
Economic and Market Outlook 13
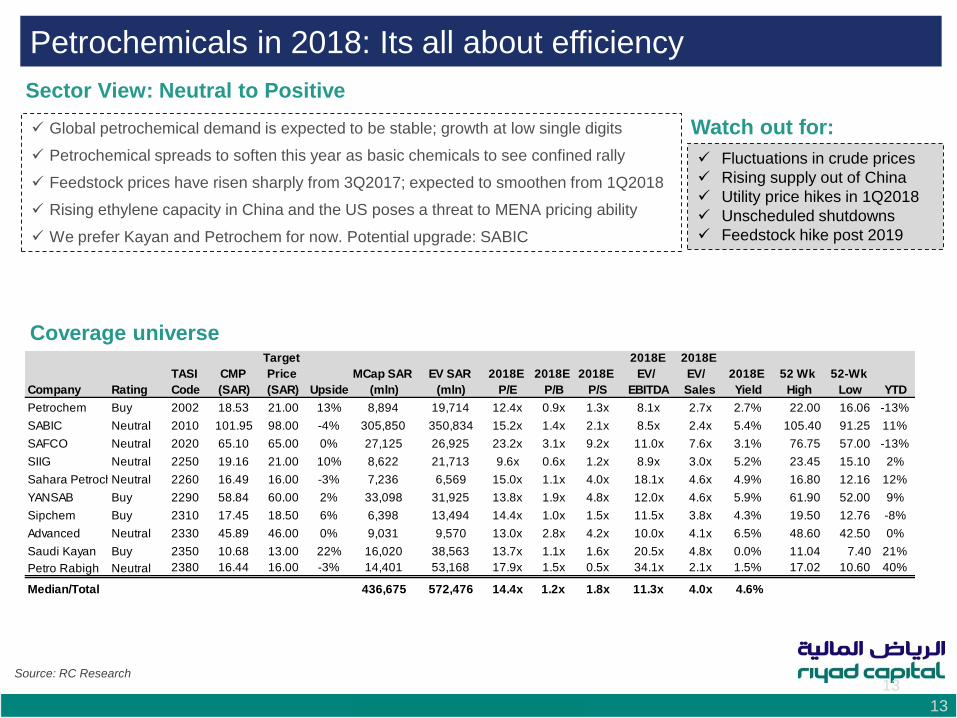
Petrochemicals in 2018: Its all about efficiency
13 Source: RC Research
Watch out for:
Coverage universe
Global petrochemical demand is expected to be stable; growth at low single digits
Petrochemical spreads to soften this year as basic chemicals to see confined rally
Feedstock prices have risen sharply from 3Q2017; expected to smoothen from 1Q2018
Rising ethylene capacity in China and the US poses a threat to MENA pricing ability
We prefer Kayan and Petrochem for now. Potential upgrade: SABIC
Fluctuations in crude prices
Rising supply out of China
Utility price hikes in 1Q2018
Unscheduled shutdowns
Feedstock hike post 2019
Sector View: Neutral to Positive
Company Rating
TASI
Code
CMP
(SAR)
Target
Price
(SAR) Upside
MCap SAR
(mln)
EV SAR
(mln)
2018E
P/E
2018E
P/B
2018E
P/S
2018E
EV/
EBITDA
2018E
EV/
Sales
2018E
Yield
52 Wk
High
52-Wk
Low YTD
Petrochem Buy 2002 18.53 21.00 13% 8,894 19,714 12.4x 0.9x 1.3x 8.1x 2.7x 2.7% 22.00 16.06 -13%
SABIC Neutral 2010 101.95 98.00 -4% 305,850 350,834 15.2x 1.4x 2.1x 8.5x 2.4x 5.4% 105.40 91.25 11%
SAFCO Neutral 2020 65.10 65.00 0% 27,125 26,925 23.2x 3.1x 9.2x 11.0x 7.6x 3.1% 76.75 57.00 -13%
SIIG Neutral 2250 19.16 21.00 10% 8,622 21,713 9.6x 0.6x 1.2x 8.9x 3.0x 5.2% 23.45 15.10 2%
Sahara PetrochemicalNeutral 2260 16.49 16.00 -3% 7,236 6,569 15.0x 1.1x 4.0x 18.1x 4.6x 4.9% 16.80 12.16 12%
YANSAB Buy 2290 58.84 60.00 2% 33,098 31,925 13.8x 1.9x 4.8x 12.0x 4.6x 5.9% 61.90 52.00 9%
Sipchem Buy 2310 17.45 18.50 6% 6,398 13,494 14.4x 1.0x 1.5x 11.5x 3.8x 4.3% 19.50 12.76 -8%
Advanced Neutral 2330 45.89 46.00 0% 9,031 9,570 13.0x 2.8x 4.2x 10.0x 4.1x 6.5% 48.60 42.50 0%
Saudi Kayan Buy 2350 10.68 13.00 22% 16,020 38,563 13.7x 1.1x 1.6x 20.5x 4.8x 0.0% 11.04 7.40 21%
Petro Rabigh Neutral 2380 16.44 16.00 -3% 14,401 53,168 17.9x 1.5x 0.5x 34.1x 2.1x 1.5% 17.02 10.60 40%
Median/Total 436,675 572,476 14.4x 1.2x 1.8x 11.3x 4.0x 4.6%
Economic and Market Outlook 14
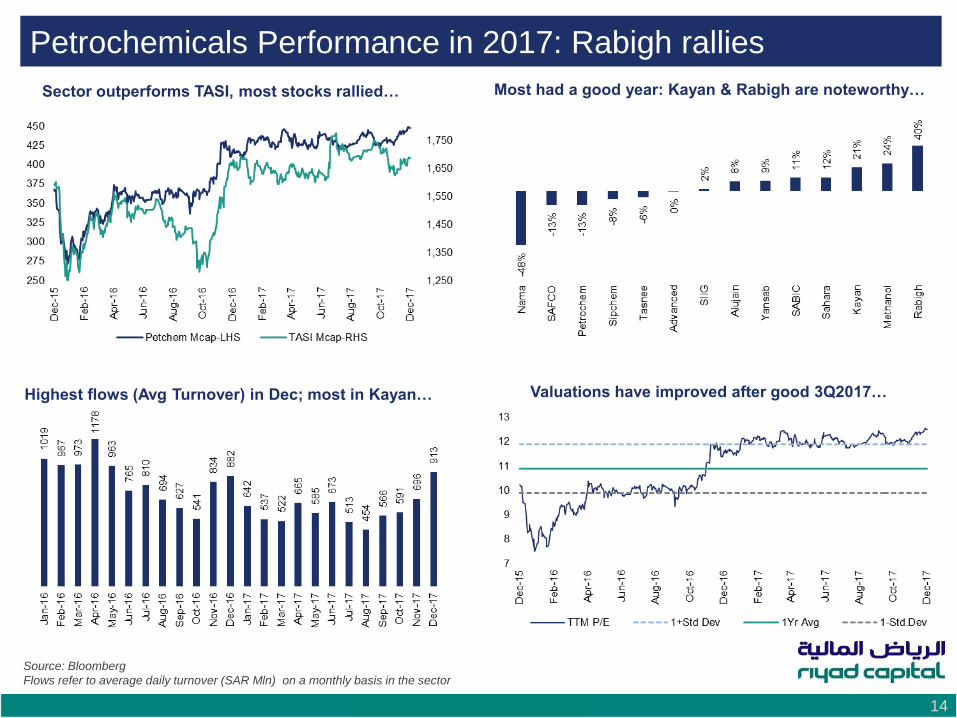
Petrochemicals Performance in 2017: Rabigh rallies
Sector outperforms TASI, most stocks rallied… Most had a good year: Kayan & Rabigh are noteworthy…
Valuations have improved after good 3Q2017… Highest flows (Avg Turnover) in Dec; most in Kayan…
Source: Bloomberg
Flows refer to average daily turnover (SAR Mln) on a monthly basis in the sector
Economic and Market Outlook 15
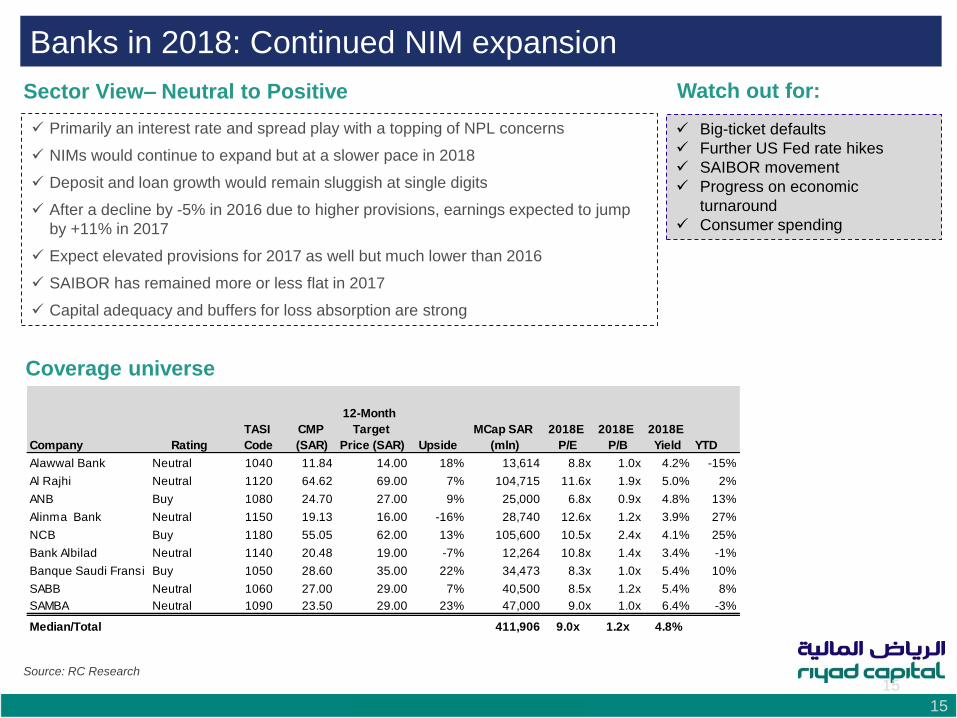
Banks in 2018: Continued NIM expansion
15 Source: RC Research
Sector View– Neutral to Positive Watch out for:
Coverage universe
Primarily an interest rate and spread play with a topping of NPL concerns
NIMs would continue to expand but at a slower pace in 2018
Deposit and loan growth would remain sluggish at single digits
After a decline by -5% in 2016 due to higher provisions, earnings expected to jump
by +11% in 2017
Expect elevated provisions for 2017 as well but much lower than 2016
SAIBOR has remained more or less flat in 2017
Capital adequacy and buffers for loss absorption are strong
Big-ticket defaults
Further US Fed rate hikes
SAIBOR movement
Progress on economic
turnaround
Consumer spending
Company Rating
TASI
Code
CMP
(SAR)
12-Month
Target
Price (SAR) Upside
MCap SAR
(mln)
2018E
P/E
2018E
P/B
2018E
Yield YTD
Alawwal Bank Neutral 1040 11.84 14.00 18% 13,614 8.8x 1.0x 4.2% -15%
Al Rajhi Neutral 1120 64.62 69.00 7% 104,715 11.6x 1.9x 5.0% 2%
ANB Buy 1080 24.70 27.00 9% 25,000 6.8x 0.9x 4.8% 13%
Alinma Bank Neutral 1150 19.13 16.00 -16% 28,740 12.6x 1.2x 3.9% 27%
NCB Buy 1180 55.05 62.00 13% 105,600 10.5x 2.4x 4.1% 25%
Bank Albilad Neutral 1140 20.48 19.00 -7% 12,264 10.8x 1.4x 3.4% -1%
Banque Saudi Fransi Buy 1050 28.60 35.00 22% 34,473 8.3x 1.0x 5.4% 10%
SABB Neutral 1060 27.00 29.00 7% 40,500 8.5x 1.2x 5.4% 8%
SAMBA Neutral 1090 23.50 29.00 23% 47,000 9.0x 1.0x 6.4% -3%
Median/Total 411,906 9.0x 1.2x 4.8%
Economic and Market Outlook 16
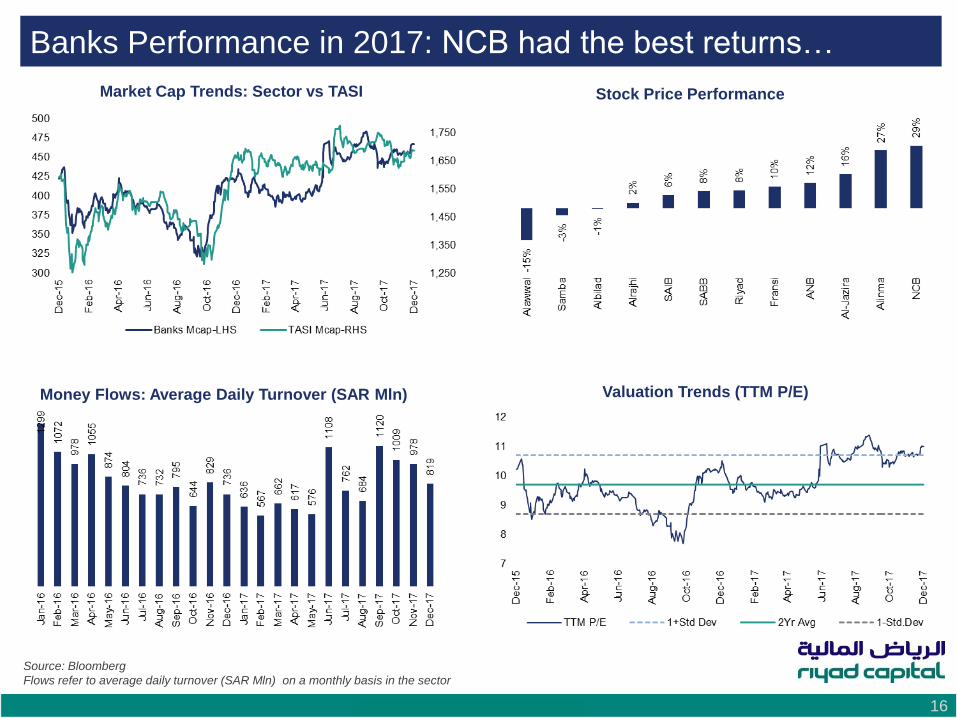
Banks Performance in 2017: NCB had the best returns…
Market Cap Trends: Sector vs TASI Stock Price Performance
Valuation Trends (TTM P/E) Money Flows: Average Daily Turnover (SAR Mln)
Source: Bloomberg
Flows refer to average daily turnover (SAR Mln) on a monthly basis in the sector
Economic and Market Outlook 17
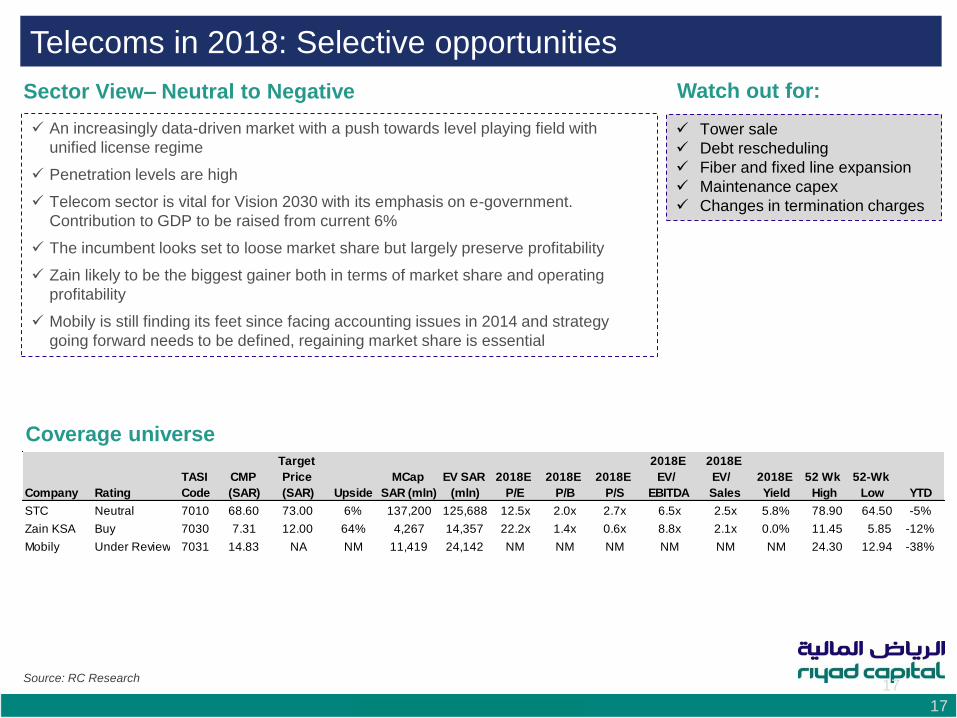
Telecoms in 2018: Selective opportunities
17 Source: RC Research
Sector View– Neutral to Negative Watch out for:
Coverage universe
An increasingly data-driven market with a push towards level playing field with
unified license regime
Penetration levels are high
Telecom sector is vital for Vision 2030 with its emphasis on e-government.
Contribution to GDP to be raised from current 6%
The incumbent looks set to loose market share but largely preserve profitability
Zain likely to be the biggest gainer both in terms of market share and operating
profitability
Mobily is still finding its feet since facing accounting issues in 2014 and strategy
going forward needs to be defined, regaining market share is essential
Tower sale
Debt rescheduling
Fiber and fixed line expansion
Maintenance capex
Changes in termination charges
Company Rating
TASI
Code
CMP
(SAR)
Target
Price
(SAR) Upside
MCap
SAR (mln)
EV SAR
(mln)
2018E
P/E
2018E
P/B
2018E
P/S
2018E
EV/
EBITDA
2018E
EV/
Sales
2018E
Yield
52 Wk
High
52-Wk
Low YTD
STC Neutral 7010 68.60 73.00 6% 137,200 125,688 12.5x 2.0x 2.7x 6.5x 2.5x 5.8% 78.90 64.50 -5%
Zain KSA Buy 7030 7.31 12.00 64% 4,267 14,357 22.2x 1.4x 0.6x 8.8x 2.1x 0.0% 11.45 5.85 -12%
Mobily Under Review 7031 14.83 NA NM 11,419 24,142 NM NM NM NM NM NM 24.30 12.94 -38%
Economic and Market Outlook 18
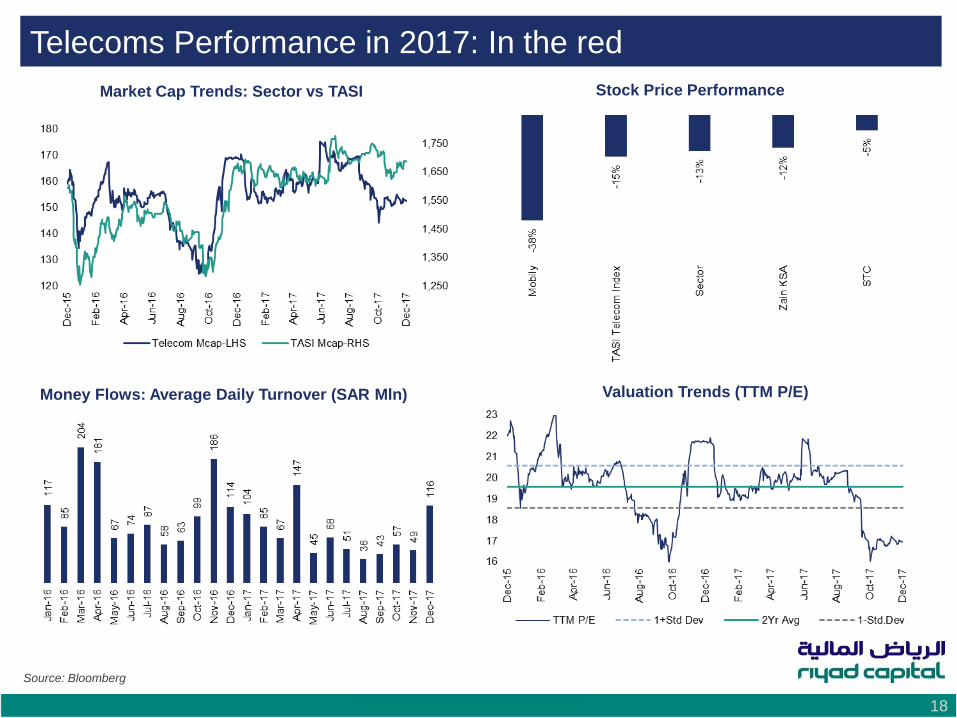
Telecoms Performance in 2017: In the red
Market Cap Trends: Sector vs TASI Stock Price Performance
Valuation Trends (TTM P/E) Money Flows: Average Daily Turnover (SAR Mln)
Source: Bloomberg
Economic and Market Outlook 19
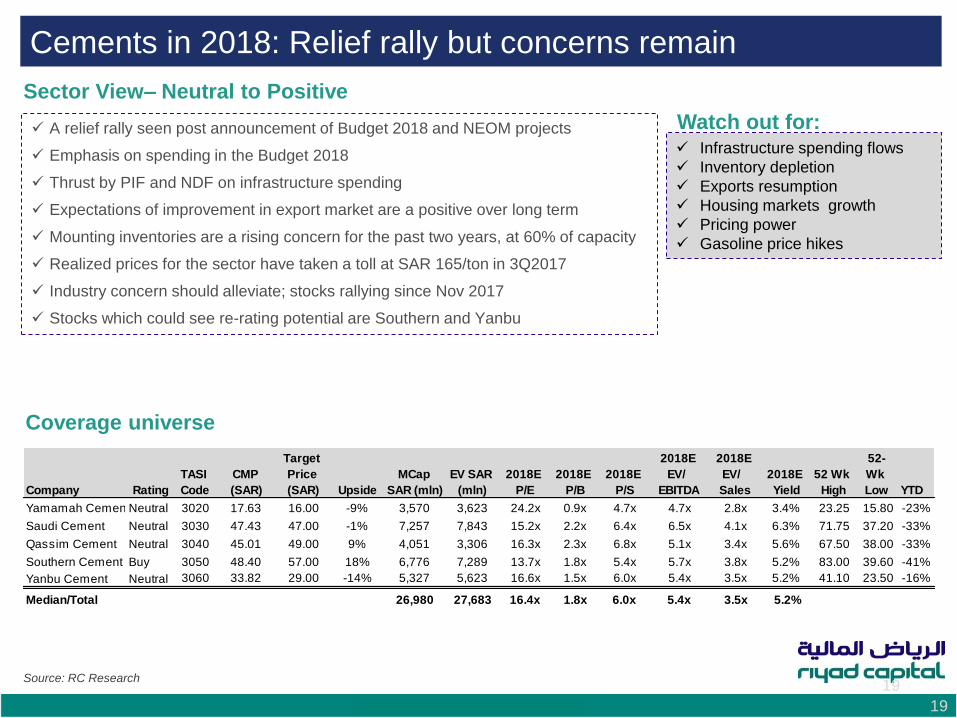
Cements in 2018: Relief rally but concerns remain
19 Source: RC Research
Sector View– Neutral to Positive
Watch out for:
Coverage universe
A relief rally seen post announcement of Budget 2018 and NEOM projects
Emphasis on spending in the Budget 2018
Thrust by PIF and NDF on infrastructure spending
Expectations of improvement in export market are a positive over long term
Mounting inventories are a rising concern for the past two years, at 60% of capacity
Realized prices for the sector have taken a toll at SAR 165/ton in 3Q2017
Industry concern should alleviate; stocks rallying since Nov 2017
Stocks which could see re-rating potential are Southern and Yanbu
Infrastructure spending flows
Inventory depletion
Exports resumption
Housing markets growth
Pricing power
Gasoline price hikes
Company Rating
TASI
Code
CMP
(SAR)
Target
Price
(SAR) Upside
MCap
SAR (mln)
EV SAR
(mln)
2018E
P/E
2018E
P/B
2018E
P/S
2018E
EV/
EBITDA
2018E
EV/
Sales
2018E
Yield
52 Wk
High
52-
Wk
Low YTD
Yamamah CementNeutral 3020 17.63 16.00 -9% 3,570 3,623 24.2x 0.9x 4.7x 4.7x 2.8x 3.4% 23.25 15.80 -23%
Saudi Cement Neutral 3030 47.43 47.00 -1% 7,257 7,843 15.2x 2.2x 6.4x 6.5x 4.1x 6.3% 71.75 37.20 -33%
Qassim Cement Neutral 3040 45.01 49.00 9% 4,051 3,306 16.3x 2.3x 6.8x 5.1x 3.4x 5.6% 67.50 38.00 -33%
Southern Cement Buy 3050 48.40 57.00 18% 6,776 7,289 13.7x 1.8x 5.4x 5.7x 3.8x 5.2% 83.00 39.60 -41%
Yanbu Cement Neutral 3060 33.82 29.00 -14% 5,327 5,623 16.6x 1.5x 6.0x 5.4x 3.5x 5.2% 41.10 23.50 -16%
Median/Total 26,980 27,683 16.4x 1.8x 6.0x 5.4x 3.5x 5.2%
Economic and Market Outlook 20
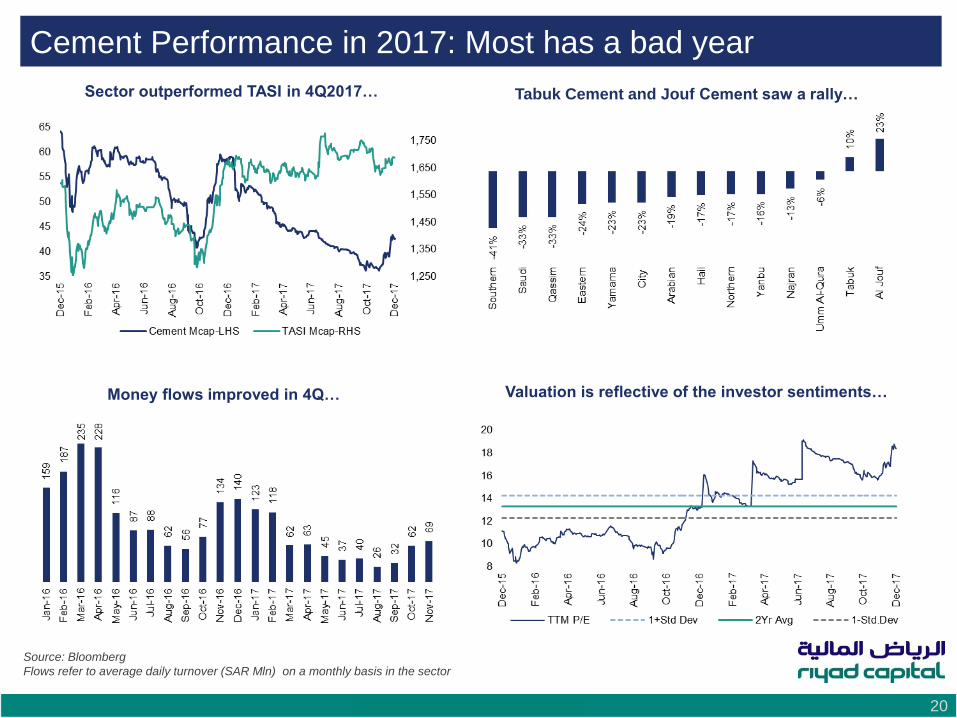
Cement Performance in 2017: Most has a bad year
Sector outperformed TASI in 4Q2017… Tabuk Cement and Jouf Cement saw a rally…
Valuation is reflective of the investor sentiments… Money flows improved in 4Q…
Source: Bloomberg
Flows refer to average daily turnover (SAR Mln) on a monthly basis in the sector
Economic and Market Outlook 21
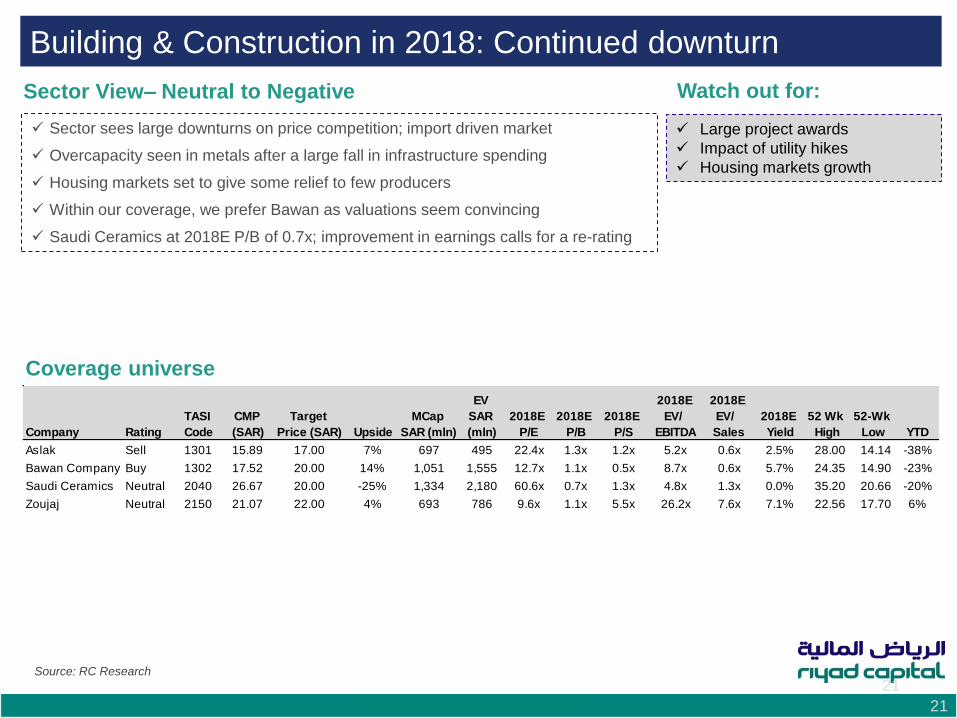
Building & Construction in 2018: Continued downturn
21 Source: RC Research
Sector View– Neutral to Negative Watch out for:
Coverage universe
Sector sees large downturns on price competition; import driven market
Overcapacity seen in metals after a large fall in infrastructure spending
Housing markets set to give some relief to few producers
Within our coverage, we prefer Bawan as valuations seem convincing
Saudi Ceramics at 2018E P/B of 0.7x; improvement in earnings calls for a re-rating
Large project awards
Impact of utility hikes
Housing markets growth
Company Rating
TASI
Code
CMP
(SAR)
Target
Price (SAR) Upside
MCap
SAR (mln)
EV
SAR
(mln)
2018E
P/E
2018E
P/B
2018E
P/S
2018E
EV/
EBITDA
2018E
EV/
Sales
2018E
Yield
52 Wk
High
52-Wk
Low YTD
Aslak Sell 1301 15.89 17.00 7% 697 495 22.4x 1.3x 1.2x 5.2x 0.6x 2.5% 28.00 14.14 -38%
Bawan Company Buy 1302 17.52 20.00 14% 1,051 1,555 12.7x 1.1x 0.5x 8.7x 0.6x 5.7% 24.35 14.90 -23%
Saudi Ceramics Neutral 2040 26.67 20.00 -25% 1,334 2,180 60.6x 0.7x 1.3x 4.8x 1.3x 0.0% 35.20 20.66 -20%
Zoujaj Neutral 2150 21.07 22.00 4% 693 786 9.6x 1.1x 5.5x 26.2x 7.6x 7.1% 22.56 17.70 6%
Economic and Market Outlook 22
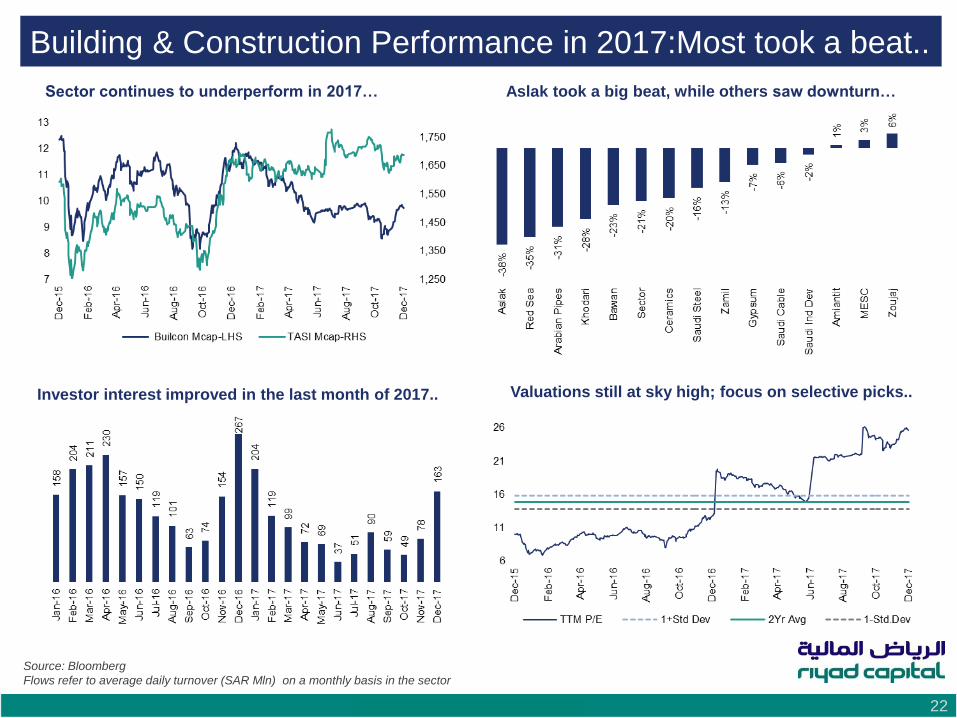
Building & Construction Performance in 2017:Most took a beat..
Sector continues to underperform in 2017… Aslak took a big beat, while others saw downturn…
Valuations still at sky high; focus on selective picks.. Investor interest improved in the last month of 2017..
Source: Bloomberg
Flows refer to average daily turnover (SAR Mln) on a monthly basis in the sector
Economic and Market Outlook 23
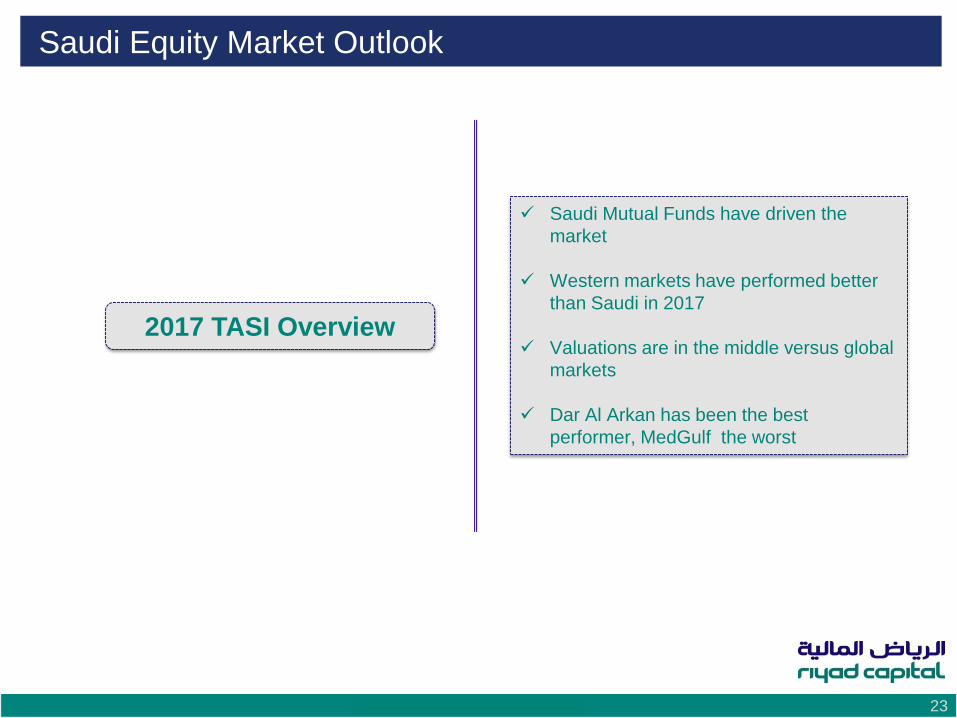
Saudi Equity Market Outlook
Saudi Mutual Funds have driven the
market
Western markets have performed better
than Saudi in 2017
Valuations are in the middle versus global
markets
Dar Al Arkan has been the best
performer, MedGulf the worst
2017 TASI Overview
Economic and Market Outlook 24
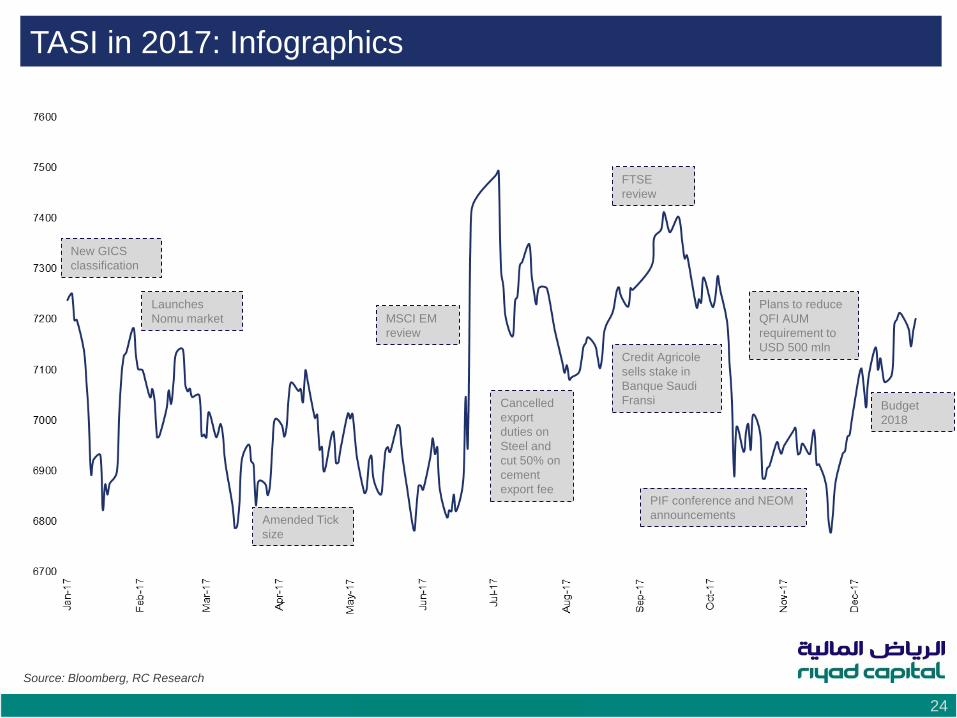
TASI in 2017: Infographics
PIF conference and NEOM
announcements
MSCI EM
review
Budget
2018
FTSE
review
Plans to reduce
QFI AUM
requirement to
USD 500 mln Credit Agricole
sells stake in
Banque Saudi
Fransi
Source: Bloomberg, RC Research
New GICS
classification
Launches
Nomu market
Amended Tick
size
Cancelled
export
duties on
Steel and
cut 50% on
cement
export fee
Economic and Market Outlook 25
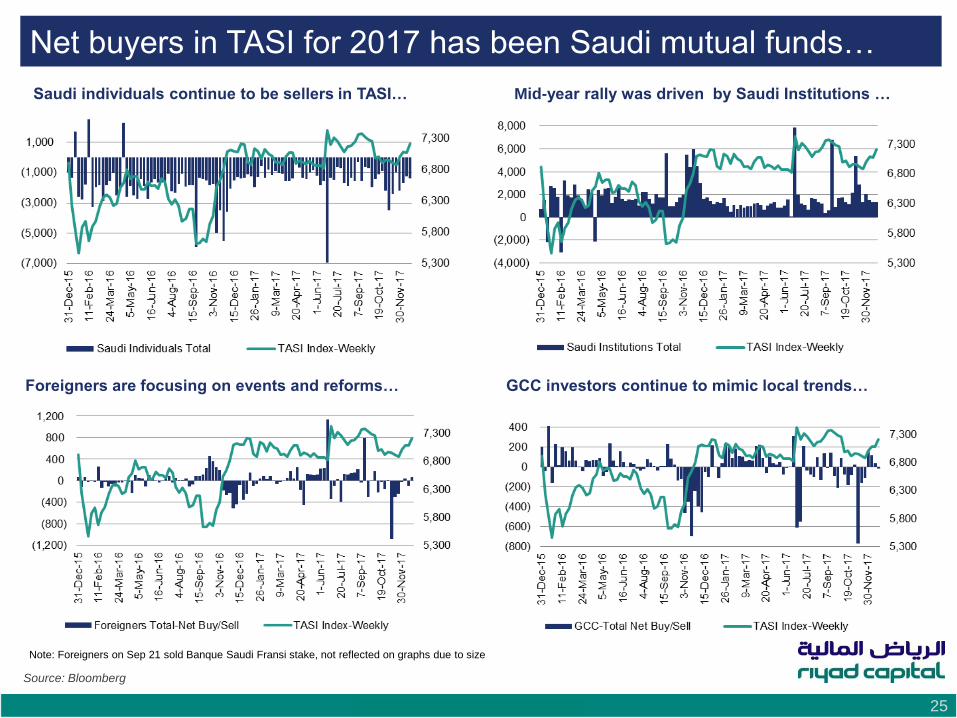
Net buyers in TASI for 2017 has been Saudi mutual funds…
GCC investors continue to mimic local trends… Foreigners are focusing on events and reforms…
Note: Foreigners on Sep 21 sold Banque Saudi Fransi stake, not reflected on graphs due to size
Saudi individuals continue to be sellers in TASI… Mid-year rally was driven by Saudi Institutions …
Source: Bloomberg
Economic and Market Outlook 26
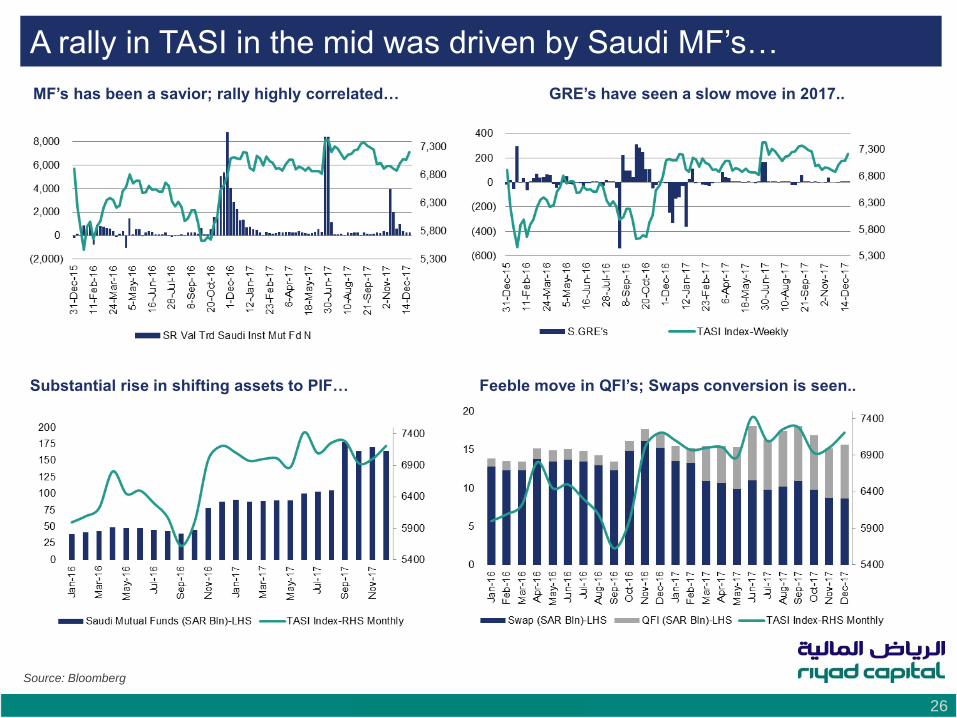
A rally in TASI in the mid was driven by Saudi MF’s…
Feeble move in QFI’s; Swaps conversion is seen..
MF’s has been a savior; rally highly correlated… GRE’s have seen a slow move in 2017..
Substantial rise in shifting assets to PIF…
Source: Bloomberg

Economic and Market Outlook 27
Global Equity Markets in 2017: Saudi Flat; Argentina the best ...
USD (Mcap) returns for major indices; Qatar and Oman worst hit in 2017, S&P 500 at +18% while Turkey is surprising…
Index returns; Kuwait and Bahrain leads the GCC indices, Pakistan declines after delivering best returns in 2016…
Source: Bloomberg
USD market cap returns are point to point currency adjusted Y/Y returns and not adjusted for IPO and corporate actions
Economic and Market Outlook 28
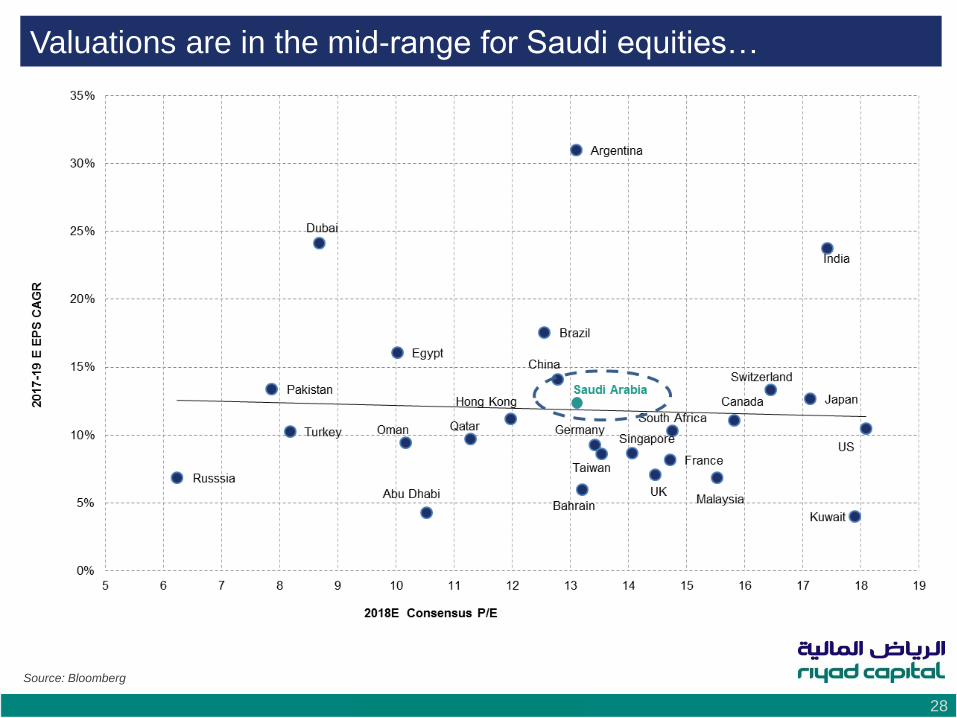
Valuations are in the mid-range for Saudi equities…
Source: Bloomberg
Economic and Market Outlook 29
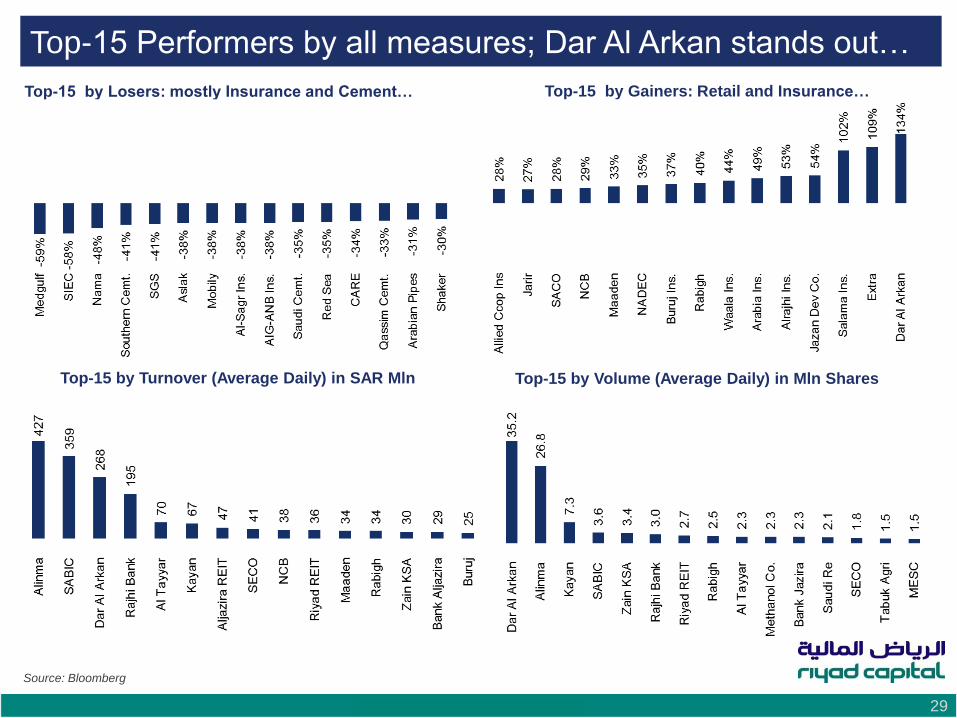
Top-15 Performers by all measures; Dar Al Arkan stands out…
Top-15 by Gainers: Retail and Insurance…
Top-15 by Turnover (Average Daily) in SAR Mln
Top-15 by Losers: mostly Insurance and Cement…
Top-15 by Volume (Average Daily) in Mln Shares
Source: Bloomberg
Economic and Market Outlook 30
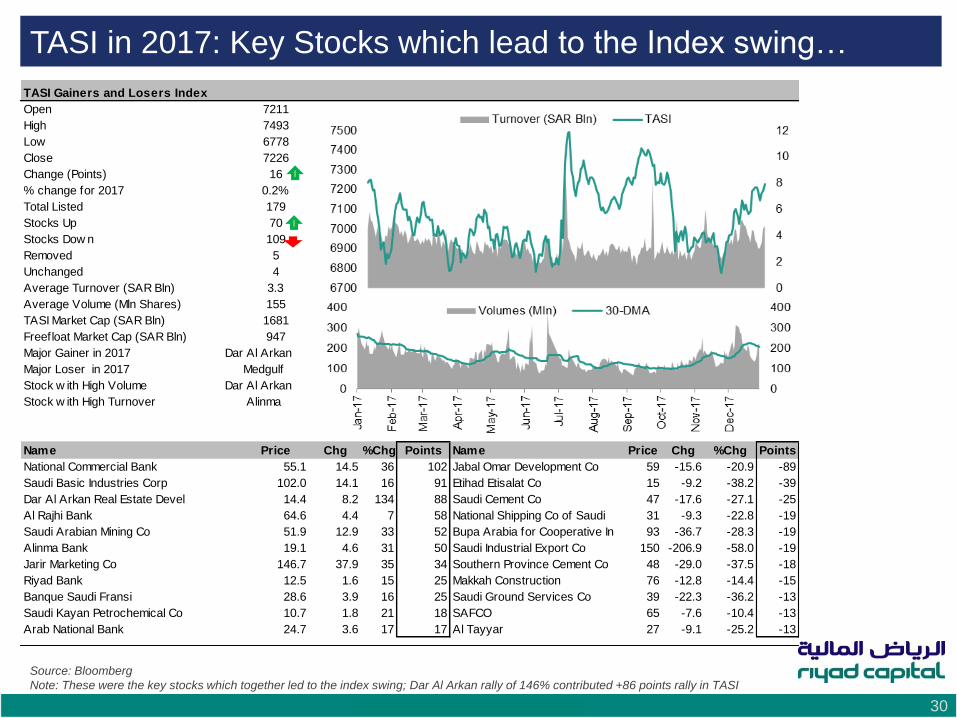
TASI in 2017: Key Stocks which lead to the Index swing…
Source: Bloomberg
Note: These were the key stocks which together led to the index swing; Dar Al Arkan rally of 146% contributed +86 points rally in TASI
TASI Gainers and Losers Index
Open 7211
High 7493
Low 6778
Close 7226
Change (Points) 16
% change for 2017 0.2%
Total Listed 179
Stocks Up 70
Stocks Dow n 109
Removed 5
Unchanged 4
Average Turnover (SAR Bln) 3.3
Average Volume (Mln Shares) 155
TASI Market Cap (SAR Bln) 1681
Freefloat Market Cap (SAR Bln) 947
Major Gainer in 2017 Dar Al Arkan
Major Loser in 2017 Medgulf
Stock w ith High Volume Dar Al Arkan
Stock w ith High Turnover Alinma
Name Price Chg %Chg Points Name Price Chg %Chg Points
National Commercial Bank 55.1 14.5 36 102 Jabal Omar Development Co 59 -15.6 -20.9 -89
Saudi Basic Industries Corp 102.0 14.1 16 91 Etihad Etisalat Co 15 -9.2 -38.2 -39
Dar Al Arkan Real Estate Devel 14.4 8.2 134 88 Saudi Cement Co 47 -17.6 -27.1 -25
Al Rajhi Bank 64.6 4.4 7 58 National Shipping Co of Saudi 31 -9.3 -22.8 -19
Saudi Arabian Mining Co 51.9 12.9 33 52 Bupa Arabia for Cooperative In 93 -36.7 -28.3 -19
Alinma Bank 19.1 4.6 31 50 Saudi Industrial Export Co 150 -206.9 -58.0 -19
Jarir Marketing Co 146.7 37.9 35 34 Southern Province Cement Co 48 -29.0 -37.5 -18
Riyad Bank 12.5 1.6 15 25 Makkah Construction 76 -12.8 -14.4 -15
Banque Saudi Fransi 28.6 3.9 16 25 Saudi Ground Services Co 39 -22.3 -36.2 -13
Saudi Kayan Petrochemical Co 10.7 1.8 21 18 SAFCO 65 -7.6 -10.4 -13
Arab National Bank 24.7 3.6 17 17 Al Tayyar 27 -9.1 -25.2 -13
Economic and Market Outlook 31
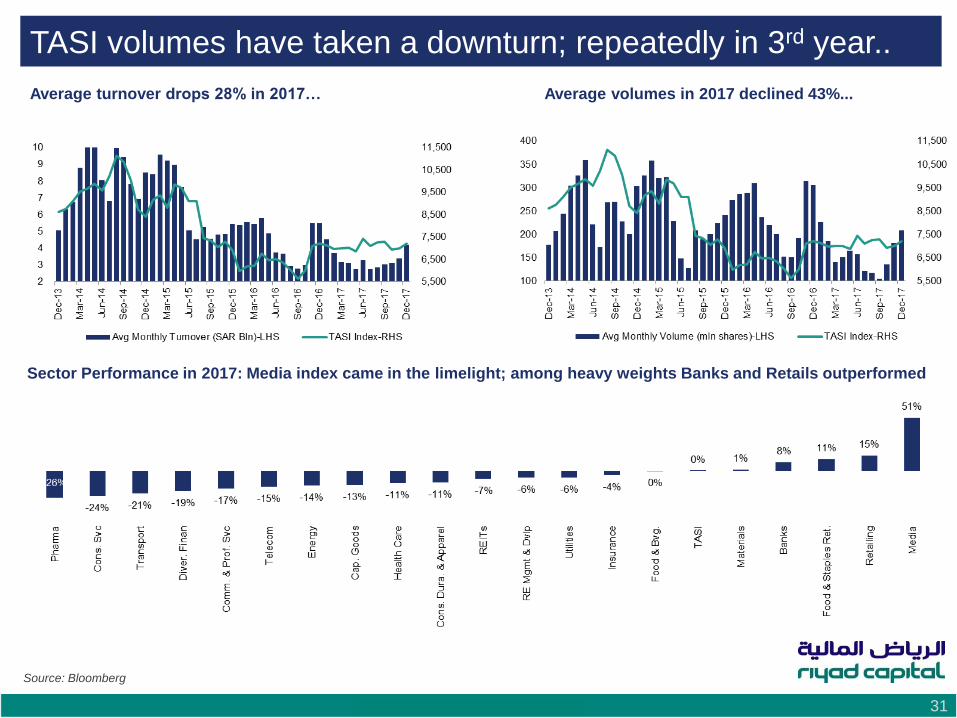
TASI volumes have taken a downturn; repeatedly in 3rd year..
Average turnover drops 28% in 2017…
Sector Performance in 2017: Media index came in the limelight; among heavy weights Banks and Retails outperformed
Average volumes in 2017 declined 43%...
Source: Bloomberg
Economic and Market Outlook 32
Saudi Equity Market Outlook
REITS have captured everyone’s fancy
NOMU has a bright future
Other sectors saw some star performers
2017 Sector Overview
Economic and Market Outlook 33
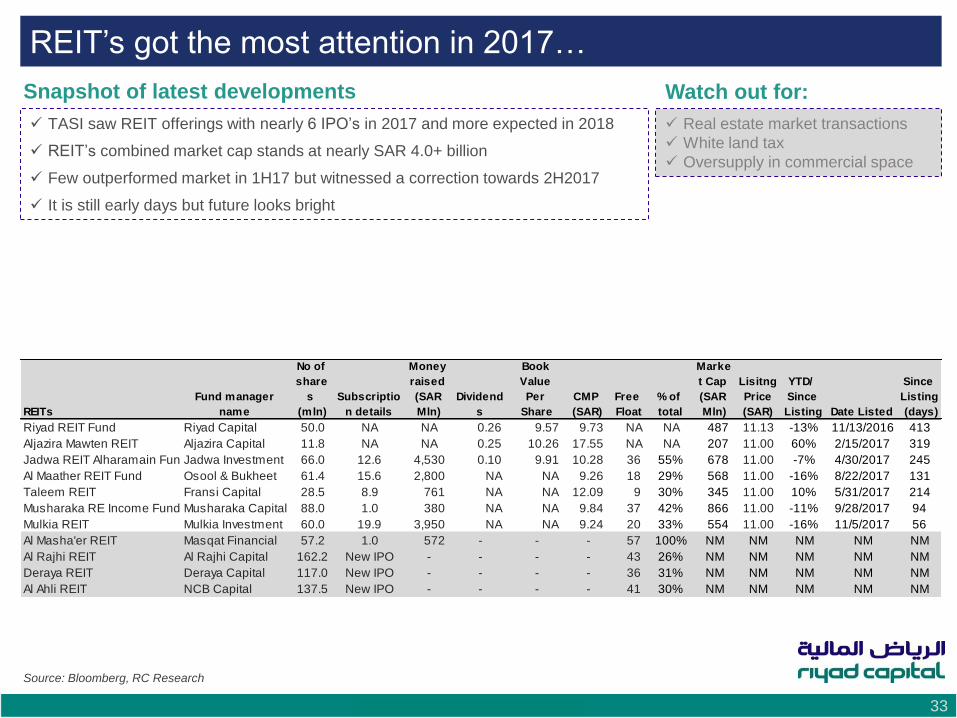
REIT’s got the most attention in 2017…
TASI saw REIT offerings with nearly 6 IPO’s in 2017 and more expected in 2018
REIT’s combined market cap stands at nearly SAR 4.0+ billion
Few outperformed market in 1H17 but witnessed a correction towards 2H2017
It is still early days but future looks bright
Real estate market transactions
White land tax
Oversupply in commercial space
Snapshot of latest developments Watch out for:
Source: Bloomberg, RC Research
REITs
Fund manager
name
No of
share
s
(mln)
Subscriptio
n details
Money
raised
(SAR
Mln)
Dividend
s
Book
Value
Per
Share
CMP
(SAR)
Free
Float
% of
total
Marke
t Cap
(SAR
Mln)
Lisitng
Price
(SAR)
YTD/
Since
Listing Date Listed
Since
Listing
(days)
Riyad REIT Fund Riyad Capital 50.0 NA NA 0.26 9.57 9.73 NA NA 487 11.13 -13% 11/13/2016 413
Aljazira Mawten REIT Aljazira Capital 11.8 NA NA 0.25 10.26 17.55 NA NA 207 11.00 60% 2/15/2017 319
Jadwa REIT Alharamain FundJadwa Investment 66.0 12.6 4,530 0.10 9.91 10.28 36 55% 678 11.00 -7% 4/30/2017 245
Al Maather REIT Fund Osool & Bukheet 61.4 15.6 2,800 NA NA 9.26 18 29% 568 11.00 -16% 8/22/2017 131
Taleem REIT Fransi Capital 28.5 8.9 761 NA NA 12.09 9 30% 345 11.00 10% 5/31/2017 214
Musharaka RE Income Fund Musharaka Capital 88.0 1.0 380 NA NA 9.84 37 42% 866 11.00 -11% 9/28/2017 94
Mulkia REIT Mulkia Investment 60.0 19.9 3,950 NA NA 9.24 20 33% 554 11.00 -16% 11/5/2017 56
Al Masha'er REIT Masqat Financial 57.2 1.0 572 - - - 57 100% NM NM NM NM NM
Al Rajhi REIT Al Rajhi Capital 162.2 New IPO - - - - 43 26% NM NM NM NM NM
Deraya REIT Deraya Capital 117.0 New IPO - - - - 36 31% NM NM NM NM NM
Al Ahli REIT NCB Capital 137.5 New IPO - - - - 41 30% NM NM NM NM NM
Economic and Market Outlook 34
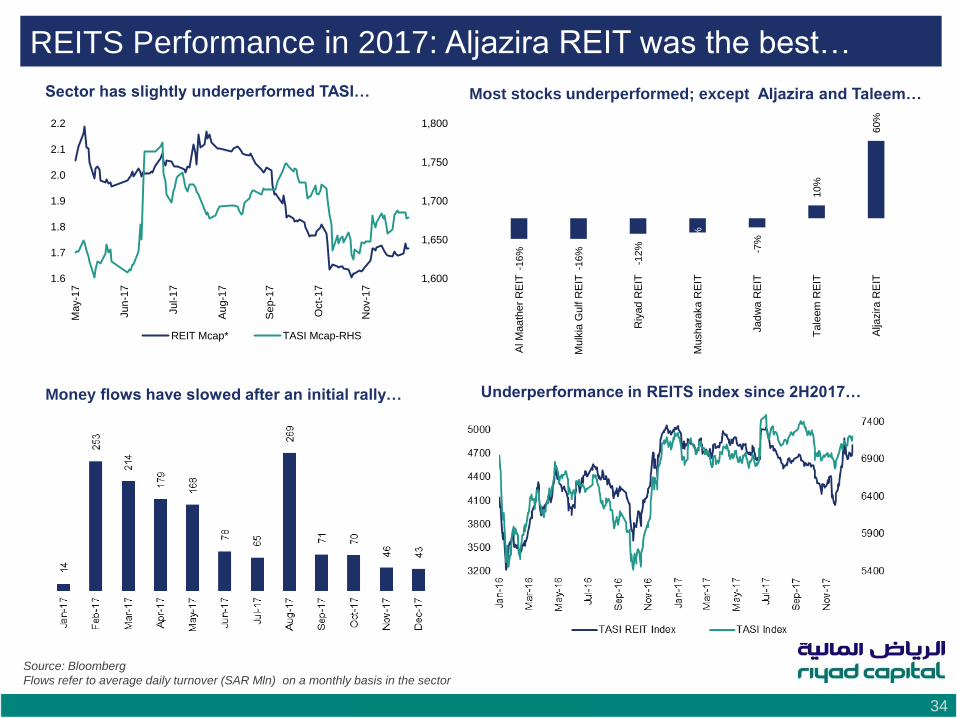
REITS Performance in 2017: Aljazira REIT was the best…
Sector has slightly underperformed TASI… Most stocks underperformed; except Aljazira and Taleem…
Underperformance in REITS index since 2H2017… Money flows have slowed after an initial rally…
Source: Bloomberg
Flows refer to average daily turnover (SAR Mln) on a monthly basis in the sector
1,600
1,650
1,700
1,750
1,800
1.6
1.7
1.8
1.9
2.0
2.1
2.2
May-1
7
Jun
-17
Jul-1
7
Au
g-1
7
Se
p-1
7
Oct-
17
Nov-1
7
REIT Mcap* TASI Mcap-RHS
-16%
-16%
-12% -1
1%
-7%
10%
60%
Al M
aa
ther
RE
IT
Mulk
ia G
ulf R
EIT
Riy
ad R
EIT
Mushara
ka R
EIT
Jad
wa R
EIT
Tale
em
RE
IT
Alja
zira
RE
IT
Economic and Market Outlook 35
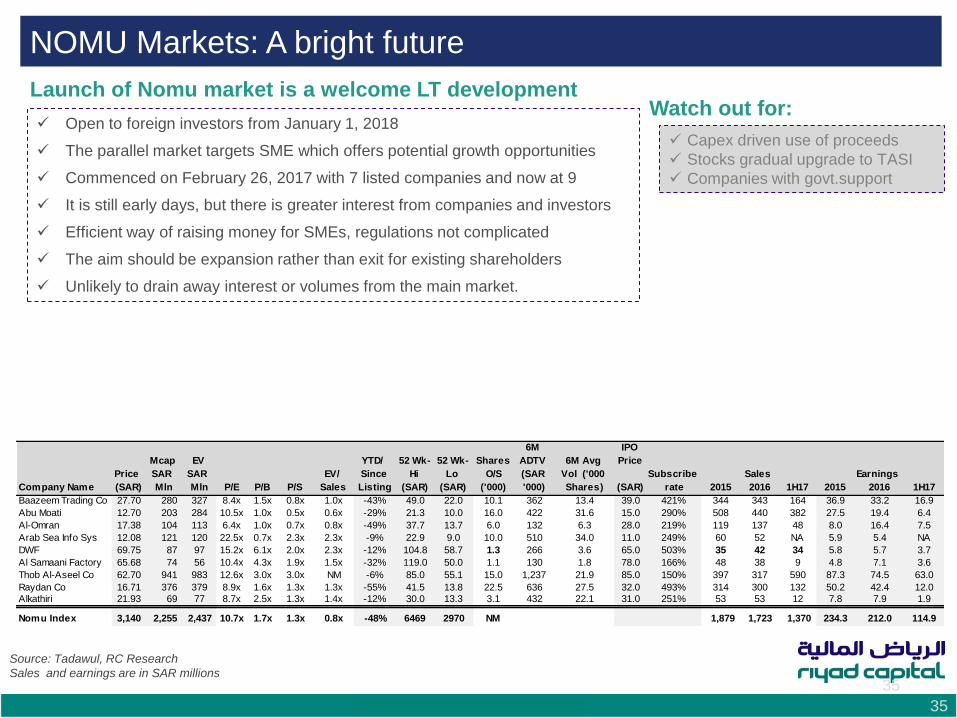
NOMU Markets: A bright future
35
Source: Tadawul, RC Research
Sales and earnings are in SAR millions
Launch of Nomu market is a welcome LT development
Open to foreign investors from January 1, 2018
The parallel market targets SME which offers potential growth opportunities
Commenced on February 26, 2017 with 7 listed companies and now at 9
It is still early days, but there is greater interest from companies and investors
Efficient way of raising money for SMEs, regulations not complicated
The aim should be expansion rather than exit for existing shareholders
Unlikely to drain away interest or volumes from the main market.
Watch out for:
Capex driven use of proceeds
Stocks gradual upgrade to TASI
Companies with govt.support
Company Name
Price
(SAR)
Mcap
SAR
Mln
EV
SAR
Mln P/E P/B P/S
EV/
Sales
YTD/
Since
Listing
52 Wk-
Hi
(SAR)
52 Wk-
Lo
(SAR)
Shares
O/S
('000)
6M
ADTV
(SAR
'000)
6M Avg
Vol ('000
Shares)
IPO
Price
(SAR)
Subscribe
rate 2015
Sales
2016 1H17 2015
Earnings
2016 1H17
Baazeem Trading Co 27.70 280 327 8.4x 1.5x 0.8x 1.0x -43% 49.0 22.0 10.1 362 13.4 39.0 421% 344 343 164 36.9 33.2 16.9
Abu Moati 12.70 203 284 10.5x 1.0x 0.5x 0.6x -29% 21.3 10.0 16.0 422 31.6 15.0 290% 508 440 382 27.5 19.4 6.4
Al-Omran 17.38 104 113 6.4x 1.0x 0.7x 0.8x -49% 37.7 13.7 6.0 132 6.3 28.0 219% 119 137 48 8.0 16.4 7.5
Arab Sea Info Sys 12.08 121 120 22.5x 0.7x 2.3x 2.3x -9% 22.9 9.0 10.0 510 34.0 11.0 249% 60 52 NA 5.9 5.4 NA
DWF 69.75 87 97 15.2x 6.1x 2.0x 2.3x -12% 104.8 58.7 1.3 266 3.6 65.0 503% 35 42 34 5.8 5.7 3.7
Al Samaani Factory 65.68 74 56 10.4x 4.3x 1.9x 1.5x -32% 119.0 50.0 1.1 130 1.8 78.0 166% 48 38 9 4.8 7.1 3.6
Thob Al-Aseel Co 62.70 941 983 12.6x 3.0x 3.0x NM -6% 85.0 55.1 15.0 1,237 21.9 85.0 150% 397 317 590 87.3 74.5 63.0
Raydan Co 16.71 376 379 8.9x 1.6x 1.3x 1.3x -55% 41.5 13.8 22.5 636 27.5 32.0 493% 314 300 132 50.2 42.4 12.0
Alkathiri 21.93 69 77 8.7x 2.5x 1.3x 1.4x -12% 30.0 13.3 3.1 432 22.1 31.0 251% 53 53 12 7.8 7.9 1.9
Nomu Index 3,140 2,255 2,437 10.7x 1.7x 1.3x 0.8x -48% 6469 2970 NM 1,879 1,723 1,370 234.3 212.0 114.9
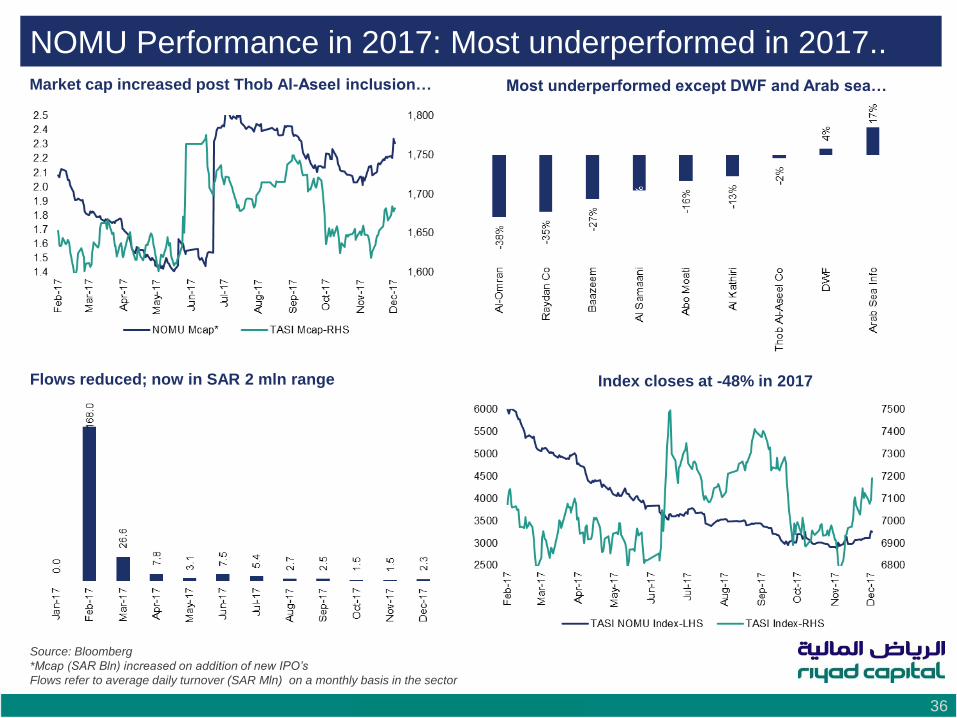
Economic and Market Outlook 36
NOMU Performance in 2017: Most underperformed in 2017.. Market cap increased post Thob Al-Aseel inclusion… Most underperformed except DWF and Arab sea…
Index closes at -48% in 2017 Flows reduced; now in SAR 2 mln range
Source: Bloomberg
*Mcap (SAR Bln) increased on addition of new IPO’s
Flows refer to average daily turnover (SAR Mln) on a monthly basis in the sector
Economic and Market Outlook 37
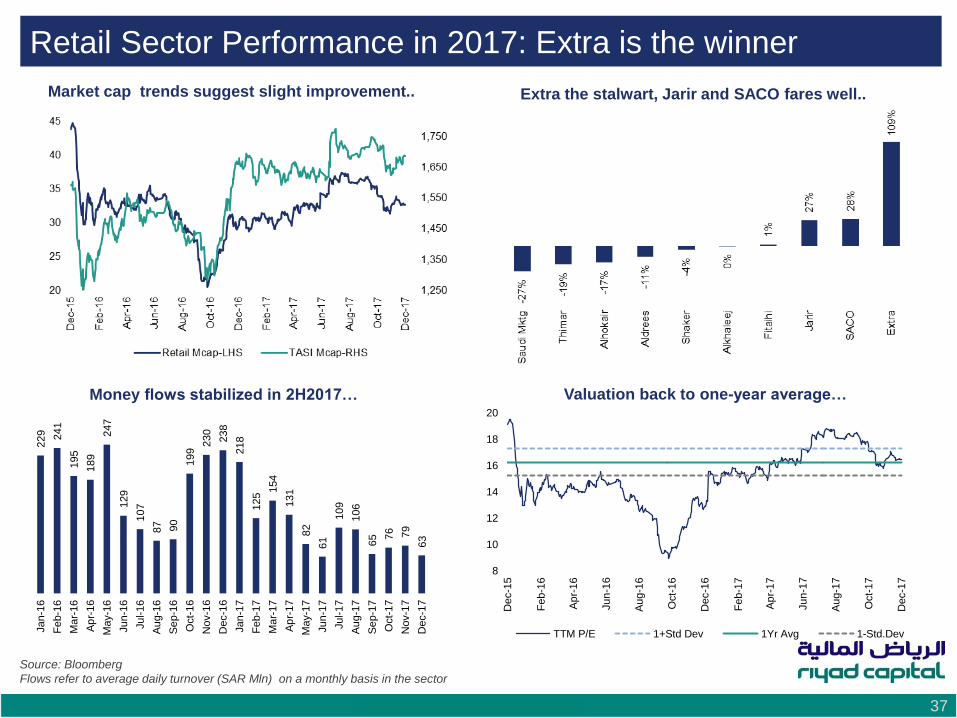
Retail Sector Performance in 2017: Extra is the winner
Market cap trends suggest slight improvement.. Extra the stalwart, Jarir and SACO fares well..
Money flows stabilized in 2H2017… Valuation back to one-year average…
8
10
12
14
16
18
20
Dec-1
5
Fe
b-1
6
Ap
r-16
Ju
n-1
6
Au
g-1
6
Oct-
16
Dec-1
6
Fe
b-1
7
Ap
r-17
Ju
n-1
7
Au
g-1
7
Oct-
17
Dec-1
7
TTM P/E 1+Std Dev 1Yr Avg 1-Std.Dev
229 241
195
189
247
129
107
87 90
199
230
238
218
125
154
131
82
61
109
106
65 7
6 79
63
Jan
-16
Fe
b-1
6
Ma
r-16
Ap
r-1
6
May-1
6
Jun
-16
Jul-1
6
Au
g-1
6
Se
p-1
6
Oct-
16
Nov-1
6
Dec-1
6
Jan
-17
Fe
b-1
7
Ma
r-17
Ap
r-1
7
May-1
7
Jun
-17
Jul-1
7
Au
g-1
7
Se
p-1
7
Oct-
17
Nov-1
7
Dec-1
7
Source: Bloomberg
Flows refer to average daily turnover (SAR Mln) on a monthly basis in the sector
Economic and Market Outlook 38
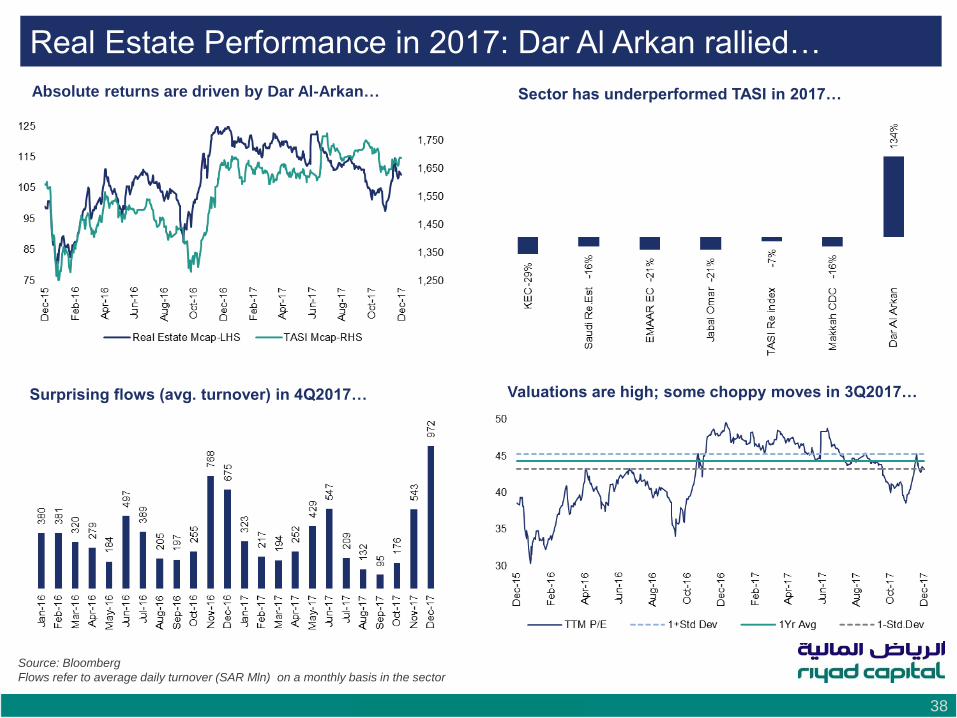
Real Estate Performance in 2017: Dar Al Arkan rallied…
Absolute returns are driven by Dar Al-Arkan… Sector has underperformed TASI in 2017…
Valuations are high; some choppy moves in 3Q2017… Surprising flows (avg. turnover) in 4Q2017…
Source: Bloomberg
Flows refer to average daily turnover (SAR Mln) on a monthly basis in the sector
Economic and Market Outlook 39
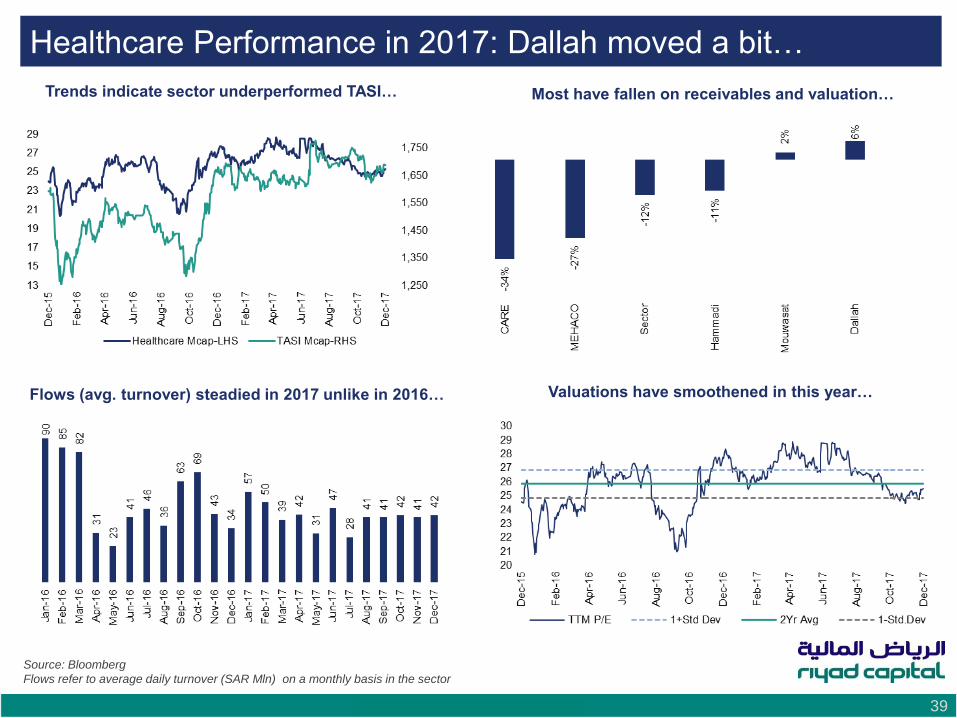
Healthcare Performance in 2017: Dallah moved a bit…
Trends indicate sector underperformed TASI… Most have fallen on receivables and valuation…
Valuations have smoothened in this year… Flows (avg. turnover) steadied in 2017 unlike in 2016…
Source: Bloomberg
Flows refer to average daily turnover (SAR Mln) on a monthly basis in the sector
Economic and Market Outlook 40
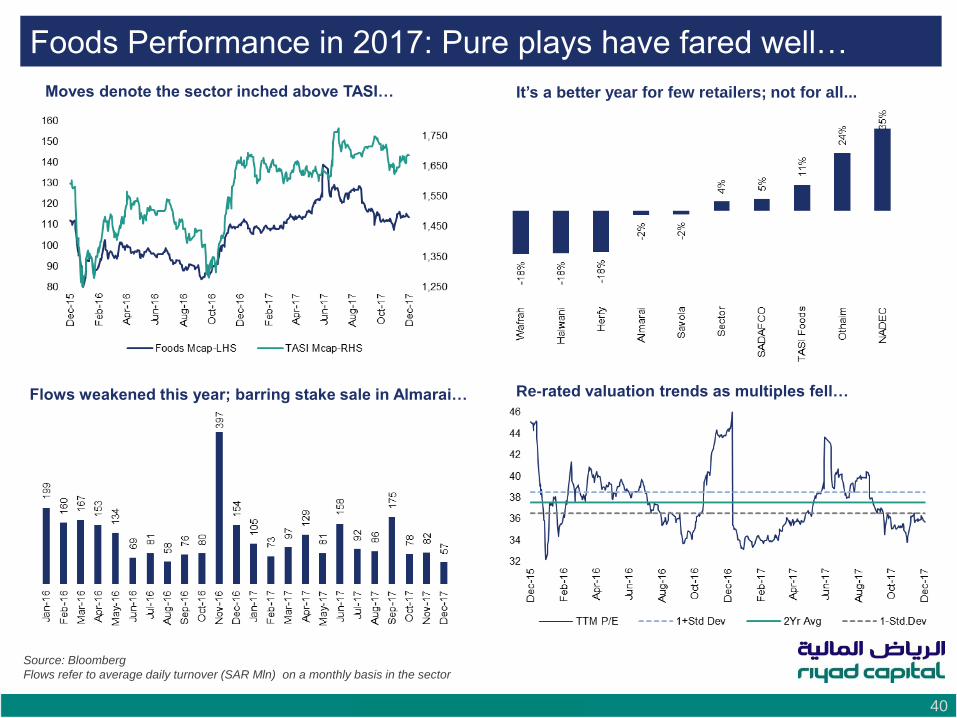
Foods Performance in 2017: Pure plays have fared well…
Moves denote the sector inched above TASI… It’s a better year for few retailers; not for all...
Re-rated valuation trends as multiples fell… Flows weakened this year; barring stake sale in Almarai…
Source: Bloomberg
Flows refer to average daily turnover (SAR Mln) on a monthly basis in the sector
Economic and Market Outlook 41
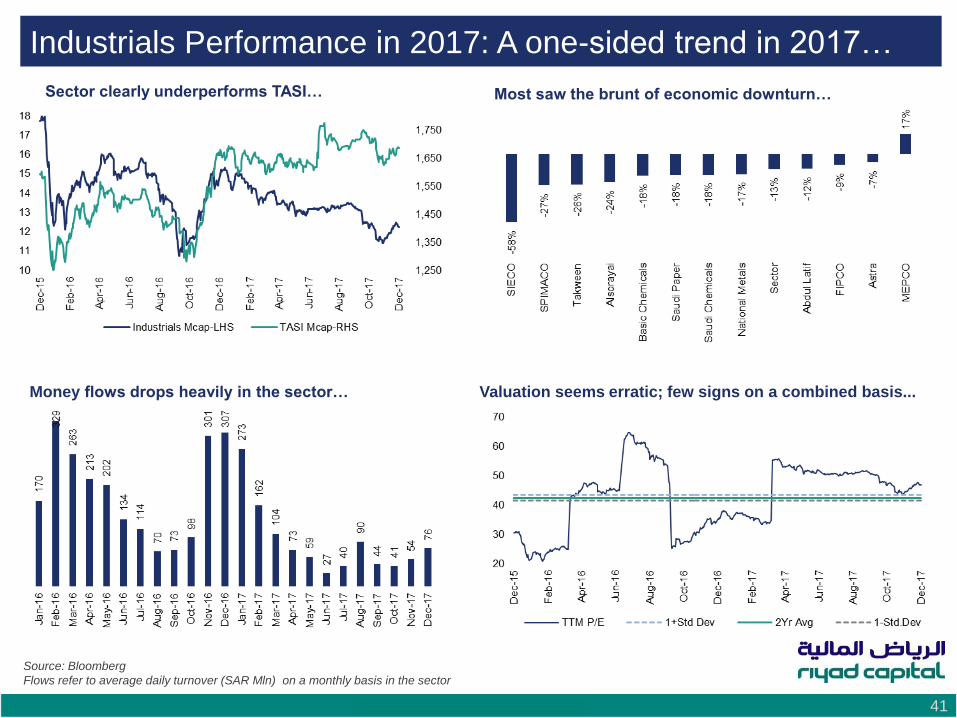
Industrials Performance in 2017: A one-sided trend in 2017…
Sector clearly underperforms TASI… Most saw the brunt of economic downturn…
Valuation seems erratic; few signs on a combined basis... Money flows drops heavily in the sector…
Source: Bloomberg
Flows refer to average daily turnover (SAR Mln) on a monthly basis in the sector
Economic and Market Outlook 42
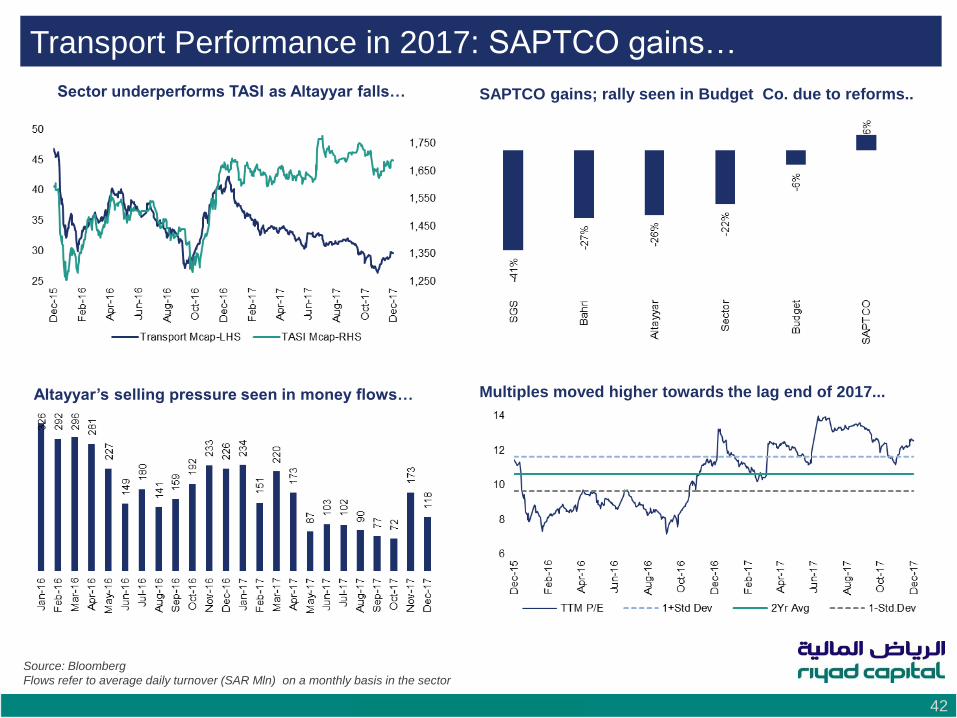
Transport Performance in 2017: SAPTCO gains…
Sector underperforms TASI as Altayyar falls… SAPTCO gains; rally seen in Budget Co. due to reforms..
Multiples moved higher towards the lag end of 2017... Altayyar’s selling pressure seen in money flows…
Source: Bloomberg
Flows refer to average daily turnover (SAR Mln) on a monthly basis in the sector
Economic and Market Outlook 43
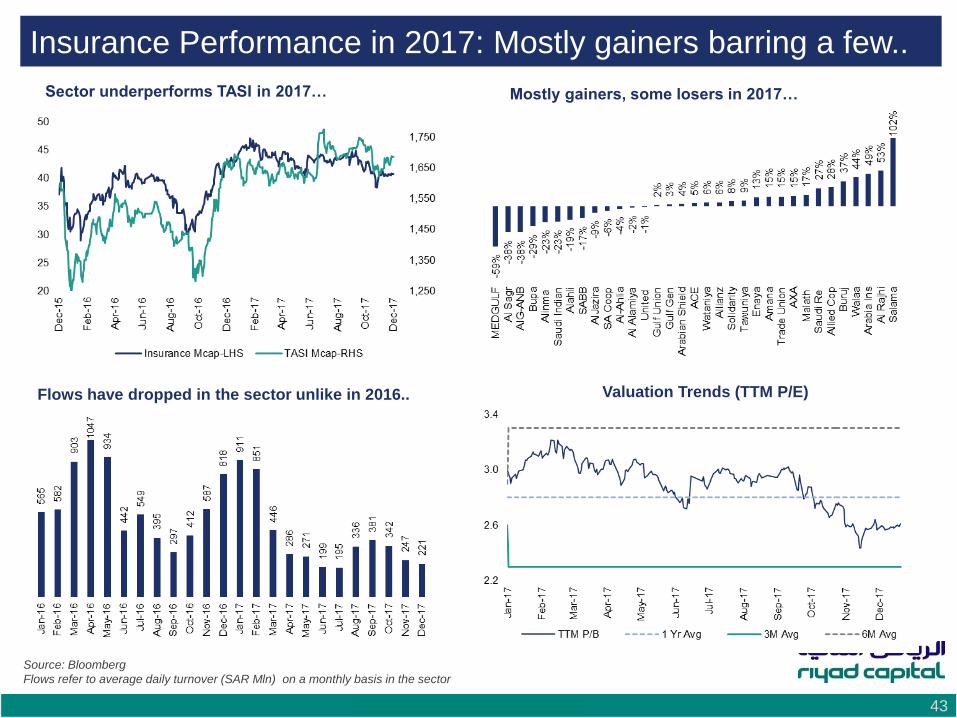
Insurance Performance in 2017: Mostly gainers barring a few..
Sector underperforms TASI in 2017… Mostly gainers, some losers in 2017…
Valuation Trends (TTM P/E) Flows have dropped in the sector unlike in 2016..
Source: Bloomberg
Flows refer to average daily turnover (SAR Mln) on a monthly basis in the sector
Economic and Market Outlook 44
Saudi Equity Market Outlook
TASI earnings and performance by sector
Negotiated deals and Foreign Shareholding
TASI P/E band graph
Performance of TASI-sub indices
Top gainers and losers in 2017
Appendix
Economic and Market Outlook 45
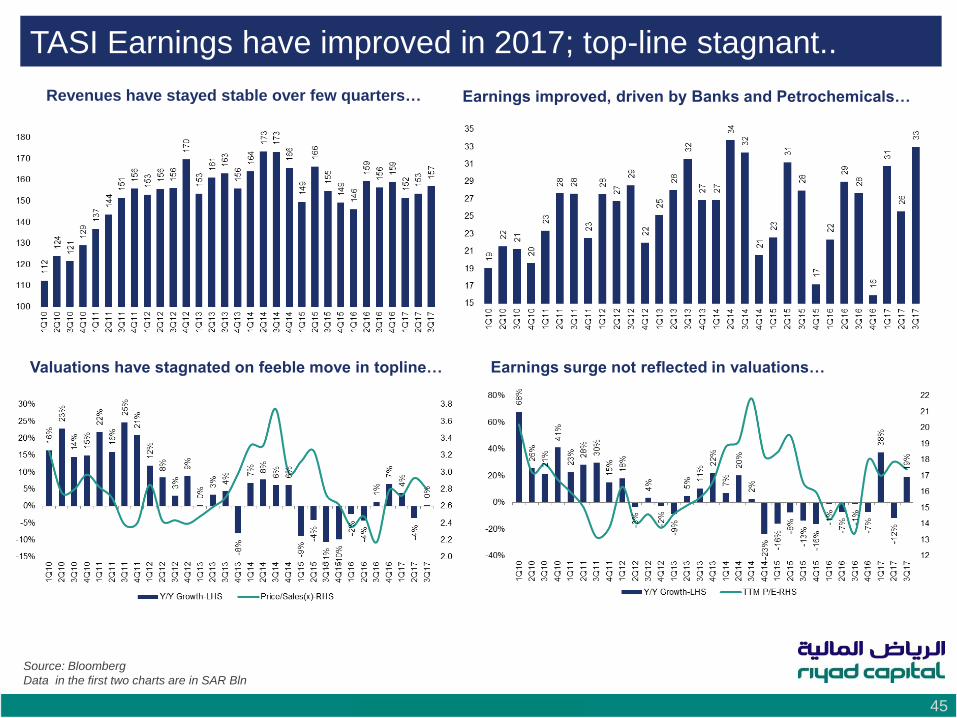
TASI Earnings have improved in 2017; top-line stagnant..
Revenues have stayed stable over few quarters… Earnings improved, driven by Banks and Petrochemicals…
Source: Bloomberg
Data in the first two charts are in SAR Bln
Valuations have stagnated on feeble move in topline… Earnings surge not reflected in valuations…
Economic and Market Outlook 46
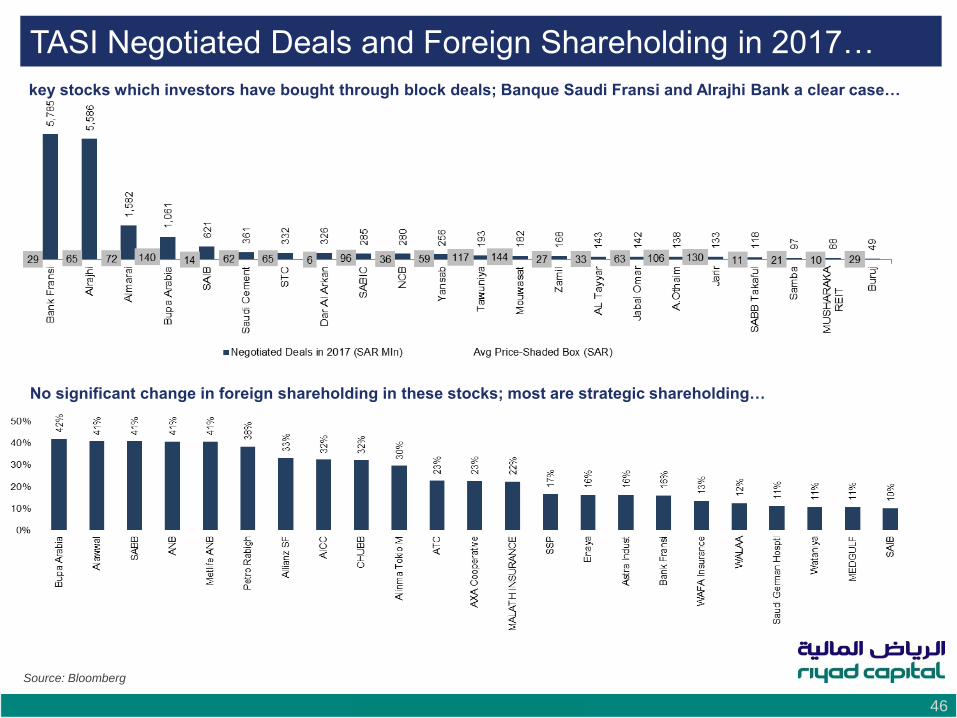
TASI Negotiated Deals and Foreign Shareholding in 2017…
key stocks which investors have bought through block deals; Banque Saudi Fransi and Alrajhi Bank a clear case…
Source: Bloomberg
No significant change in foreign shareholding in these stocks; most are strategic shareholding…
Economic and Market Outlook 47
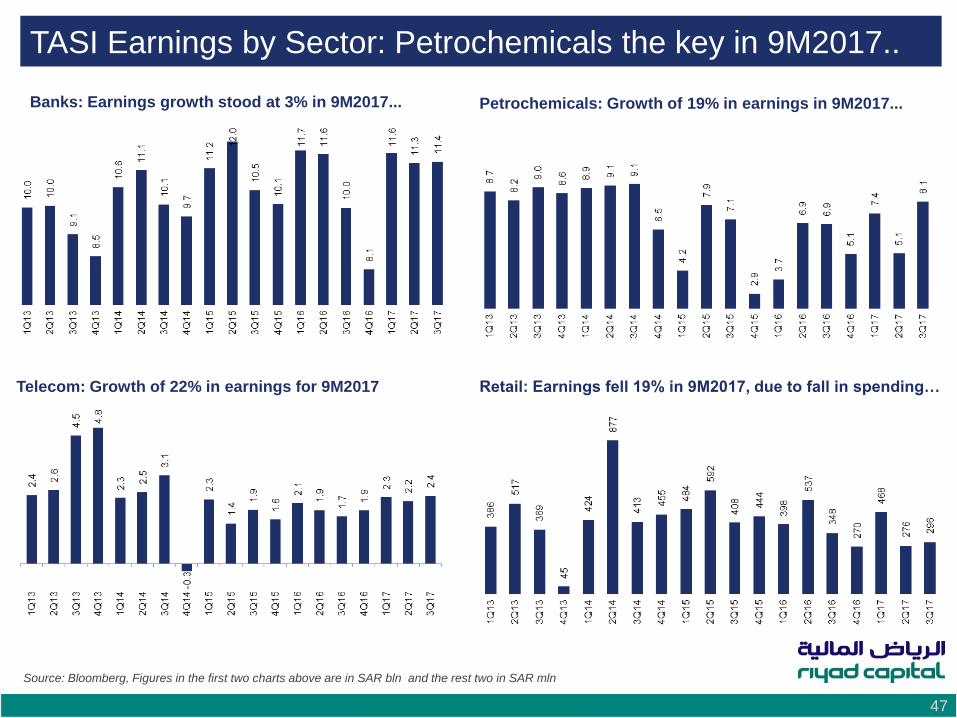
TASI Earnings by Sector: Petrochemicals the key in 9M2017..
Banks: Earnings growth stood at 3% in 9M2017...
Source: Bloomberg, Figures in the first two charts above are in SAR bln and the rest two in SAR mln
Petrochemicals: Growth of 19% in earnings in 9M2017...
Telecom: Growth of 22% in earnings for 9M2017 Retail: Earnings fell 19% in 9M2017, due to fall in spending…
Economic and Market Outlook 48
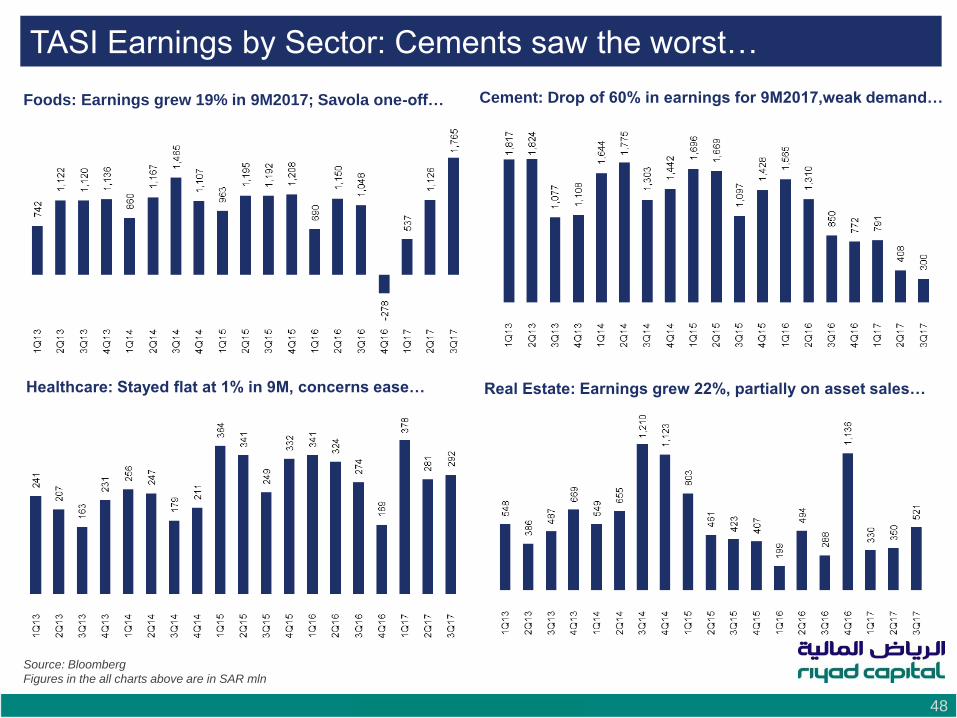
TASI Earnings by Sector: Cements saw the worst…
Source: Bloomberg
Figures in the all charts above are in SAR mln
Foods: Earnings grew 19% in 9M2017; Savola one-off… Cement: Drop of 60% in earnings for 9M2017,weak demand…
Healthcare: Stayed flat at 1% in 9M, concerns ease… Real Estate: Earnings grew 22%, partially on asset sales…
Economic and Market Outlook 49
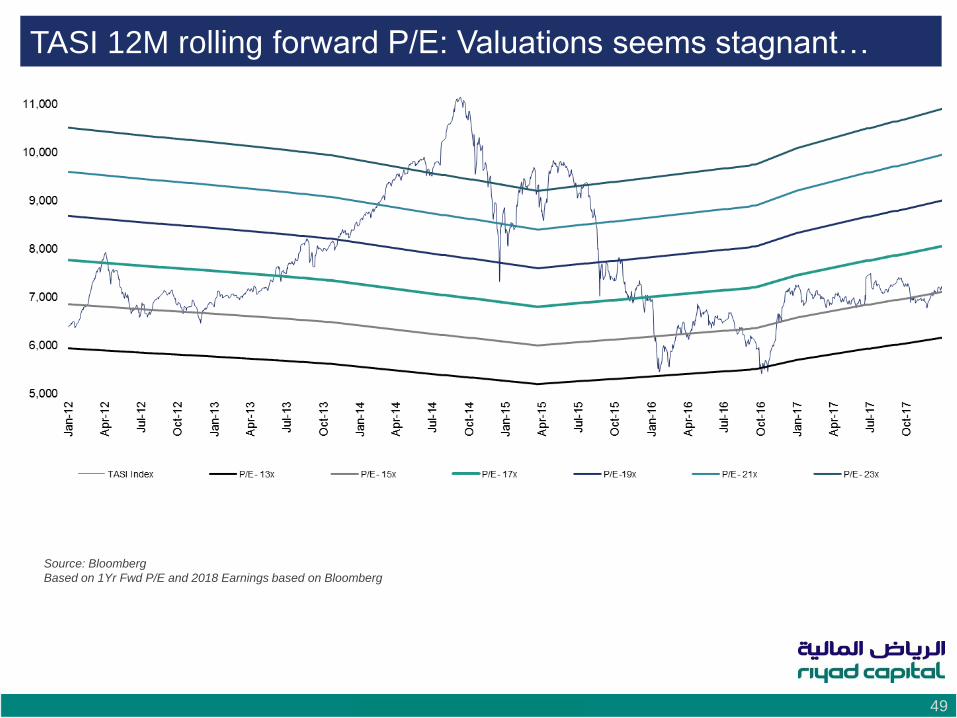
TASI 12M rolling forward P/E: Valuations seems stagnant…
Source: Bloomberg
Based on 1Yr Fwd P/E and 2018 Earnings based on Bloomberg
Economic and Market Outlook 50
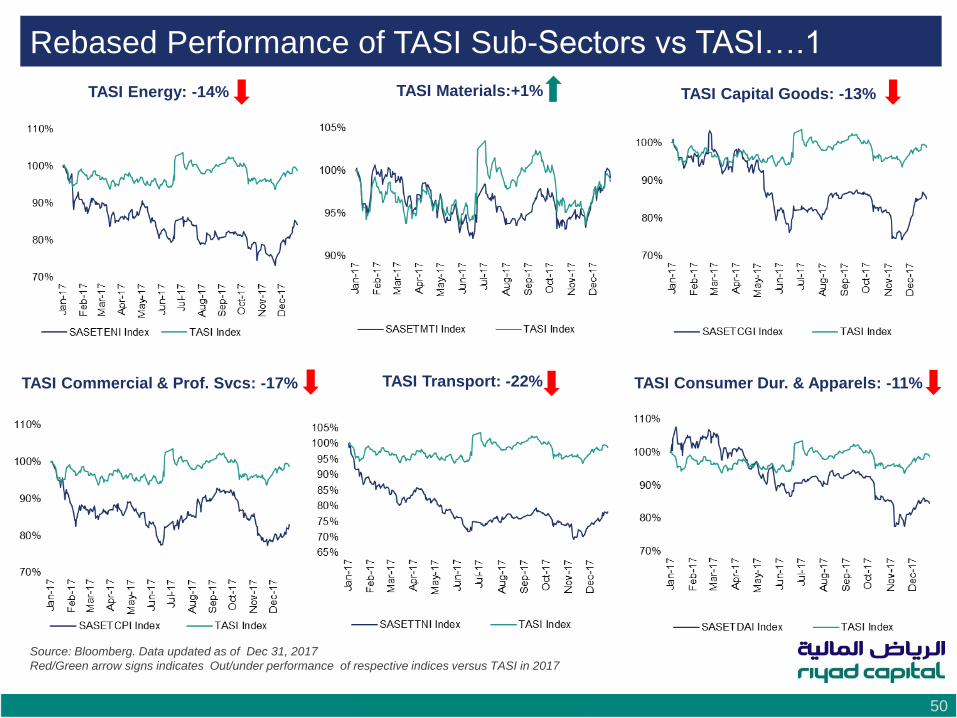
Rebased Performance of TASI Sub-Sectors vs TASI….1
TASI Energy: -14% TASI Capital Goods: -13% TASI Materials:+1%
TASI Commercial & Prof. Svcs: -17% TASI Transport: -22% TASI Consumer Dur. & Apparels: -11%
Source: Bloomberg. Data updated as of Dec 31, 2017
Red/Green arrow signs indicates Out/under performance of respective indices versus TASI in 2017
Economic and Market Outlook 51
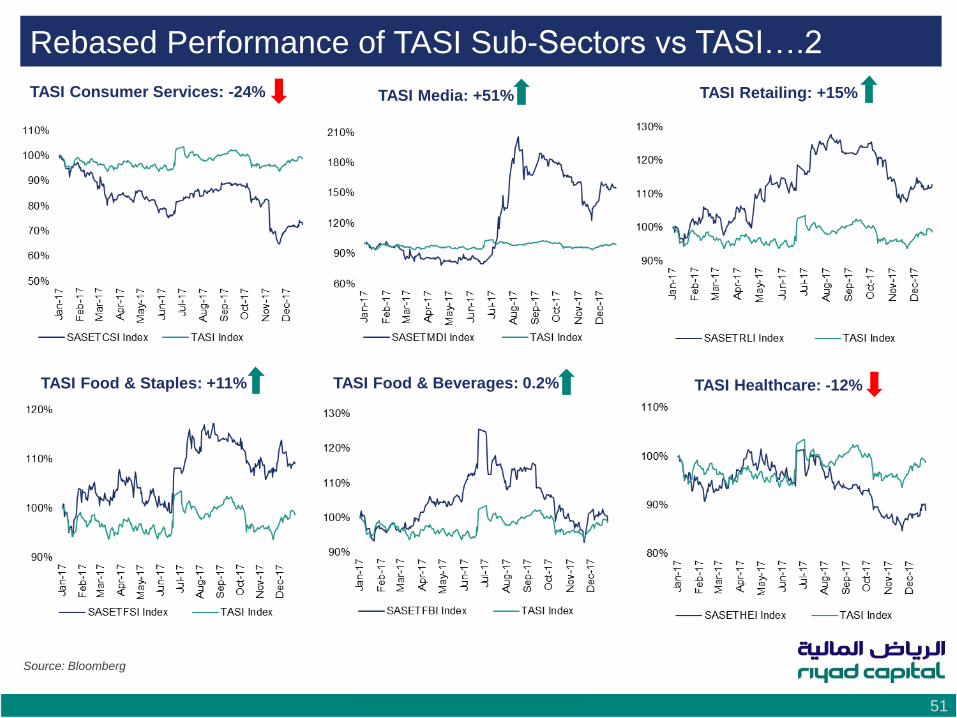
Rebased Performance of TASI Sub-Sectors vs TASI….2
TASI Consumer Services: -24% TASI Retailing: +15% TASI Media: +51%
TASI Food & Staples: +11% TASI Food & Beverages: 0.2% TASI Healthcare: -12%
Source: Bloomberg
Economic and Market Outlook 52
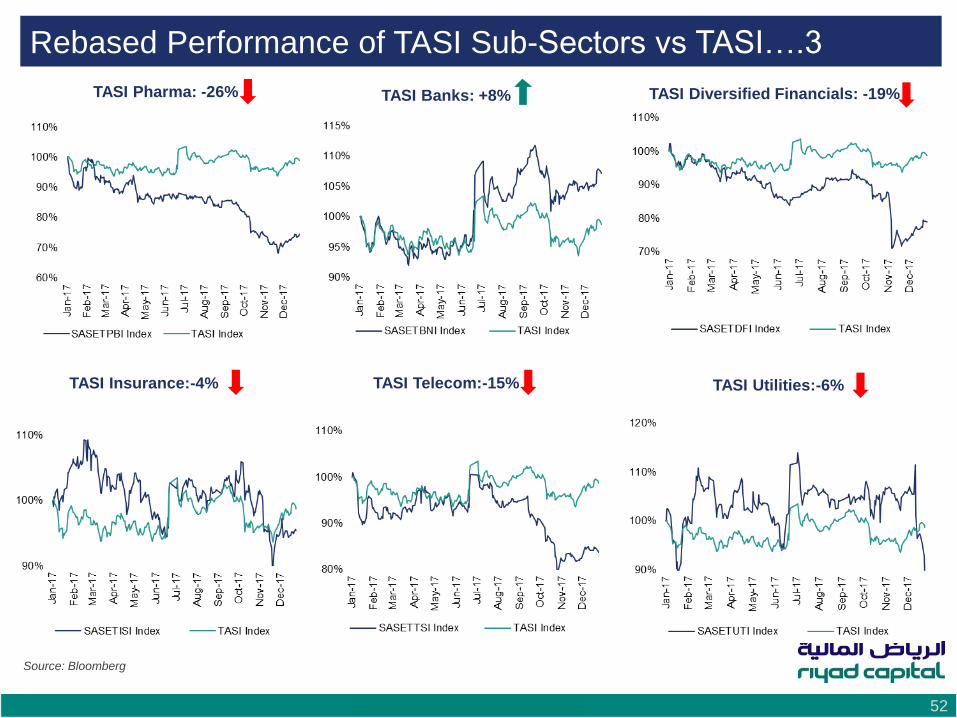
Rebased Performance of TASI Sub-Sectors vs TASI….3
TASI Pharma: -26% TASI Diversified Financials: -19% TASI Banks: +8%
TASI Insurance:-4% TASI Telecom:-15% TASI Utilities:-6%
Source: Bloomberg
Economic and Market Outlook 53
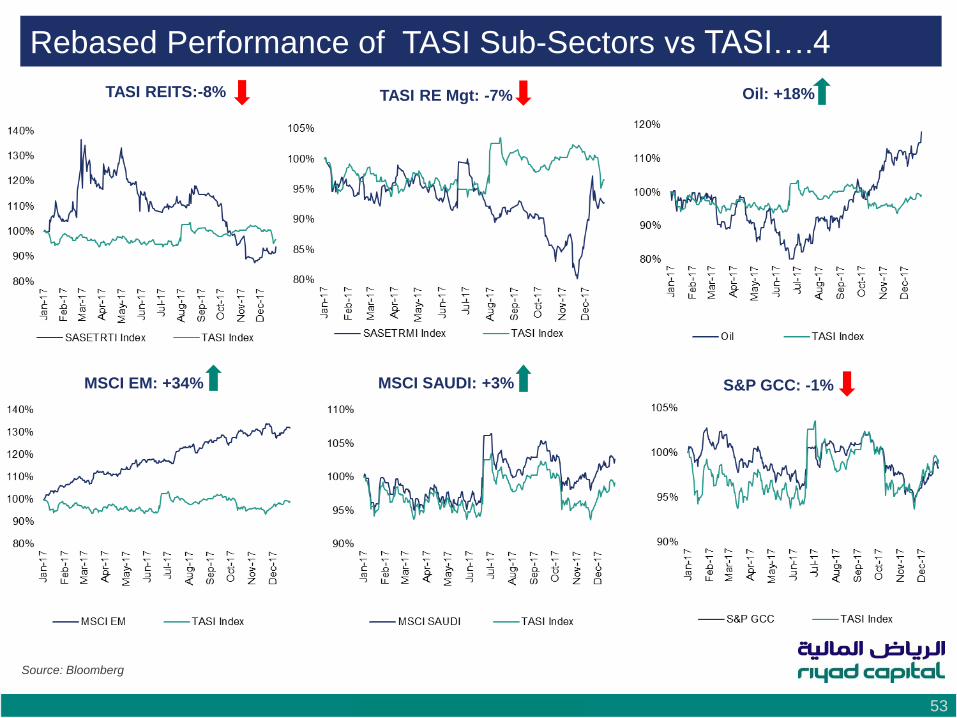
Rebased Performance of TASI Sub-Sectors vs TASI….4
TASI REITS:-8% Oil: +18% TASI RE Mgt: -7%
MSCI EM: +34% MSCI SAUDI: +3% S&P GCC: -1%
Source: Bloomberg
Economic and Market Outlook 54
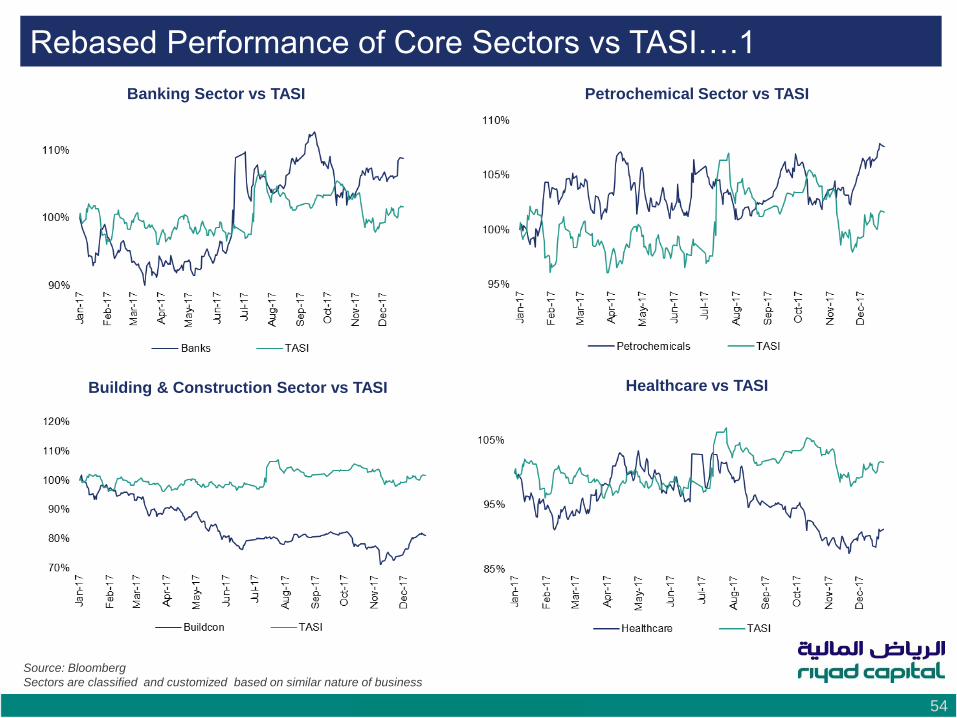
Rebased Performance of Core Sectors vs TASI….1
Healthcare vs TASI
Banking Sector vs TASI
Building & Construction Sector vs TASI
Petrochemical Sector vs TASI
Source: Bloomberg
Sectors are classified and customized based on similar nature of business
Economic and Market Outlook 55
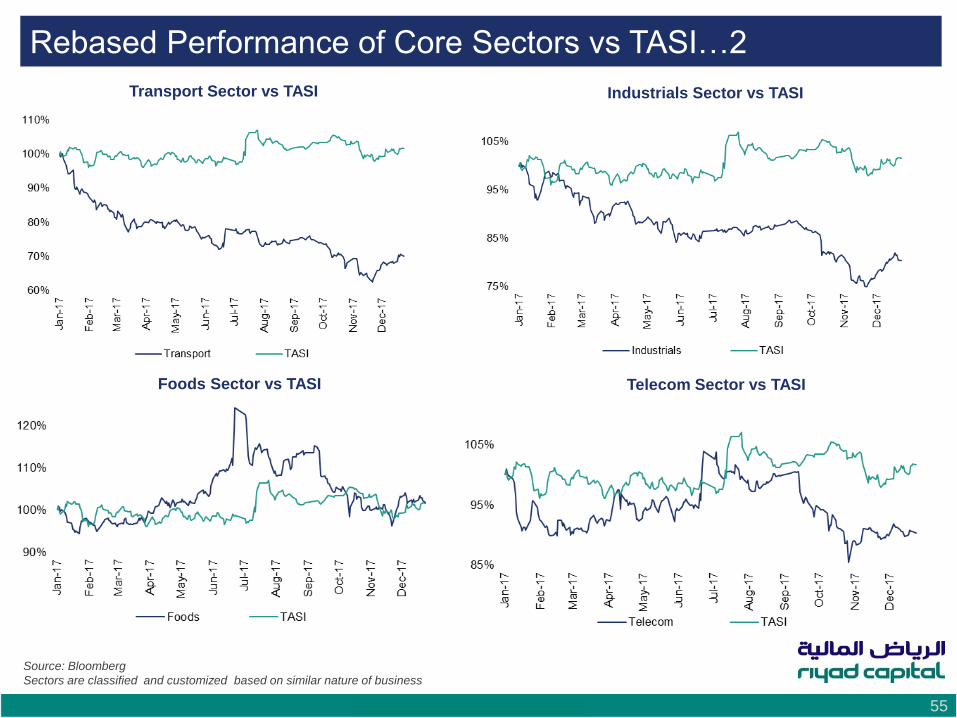
Rebased Performance of Core Sectors vs TASI…2
Transport Sector vs TASI Industrials Sector vs TASI
Foods Sector vs TASI Telecom Sector vs TASI
Source: Bloomberg
Sectors are classified and customized based on similar nature of business
Economic and Market Outlook 56
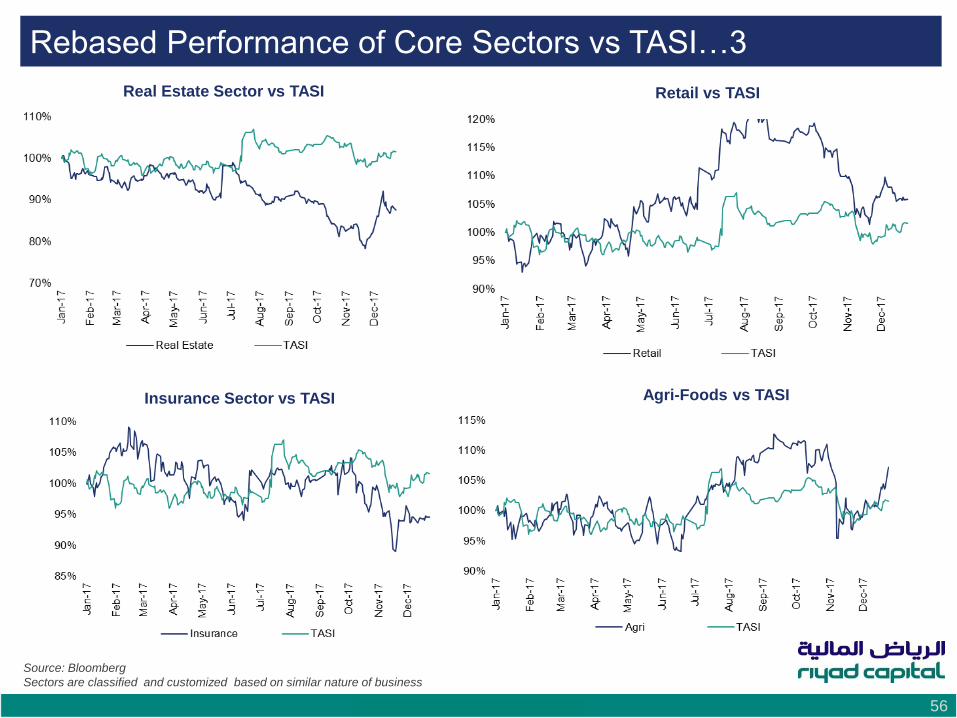
Rebased Performance of Core Sectors vs TASI…3
Real Estate Sector vs TASI Retail vs TASI
Insurance Sector vs TASI Agri-Foods vs TASI
Source: Bloomberg
Sectors are classified and customized based on similar nature of business
Economic and Market Outlook 57
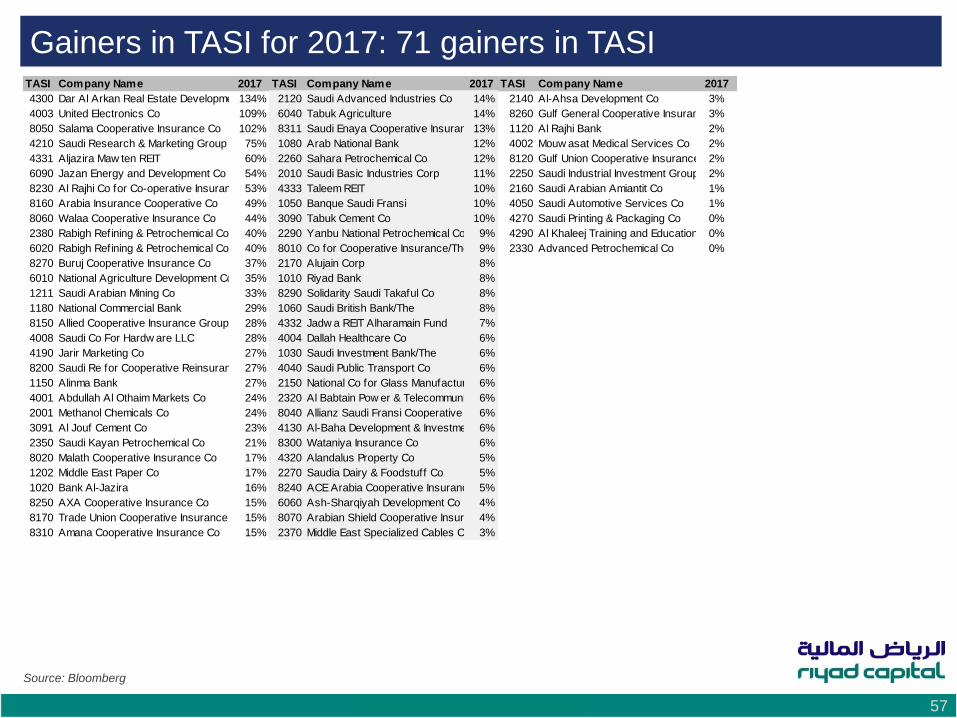
Gainers in TASI for 2017: 71 gainers in TASI
Source: Bloomberg
TASI Company Name 2017 TASI Company Name 2017 TASI Company Name 2017
4300 Dar Al Arkan Real Estate Development Co134% 2120 Saudi Advanced Industries Co 14% 2140 Al-Ahsa Development Co 3%
4003 United Electronics Co 109% 6040 Tabuk Agriculture 14% 8260 Gulf General Cooperative Insurance Co3%
8050 Salama Cooperative Insurance Co 102% 8311 Saudi Enaya Cooperative Insurance Co13% 1120 Al Rajhi Bank 2%
4210 Saudi Research & Marketing Group 75% 1080 Arab National Bank 12% 4002 Mouw asat Medical Services Co 2%
4331 Aljazira Maw ten REIT 60% 2260 Sahara Petrochemical Co 12% 8120 Gulf Union Cooperative Insurance Co2%
6090 Jazan Energy and Development Co 54% 2010 Saudi Basic Industries Corp 11% 2250 Saudi Industrial Investment Group 2%
8230 Al Rajhi Co for Co-operative Insurance 53% 4333 Taleem REIT 10% 2160 Saudi Arabian Amiantit Co 1%
8160 Arabia Insurance Cooperative Co 49% 1050 Banque Saudi Fransi 10% 4050 Saudi Automotive Services Co 1%
8060 Walaa Cooperative Insurance Co 44% 3090 Tabuk Cement Co 10% 4270 Saudi Printing & Packaging Co 0%
2380 Rabigh Refining & Petrochemical Co 40% 2290 Yanbu National Petrochemical Co 9% 4290 Al Khaleej Training and Education Co0%
6020 Rabigh Refining & Petrochemical Co 40% 8010 Co for Cooperative Insurance/The 9% 2330 Advanced Petrochemical Co 0%
8270 Buruj Cooperative Insurance Co 37% 2170 Alujain Corp 8%
6010 National Agriculture Development Co/The35% 1010 Riyad Bank 8%
1211 Saudi Arabian Mining Co 33% 8290 Solidarity Saudi Takaful Co 8%
1180 National Commercial Bank 29% 1060 Saudi British Bank/The 8%
8150 Allied Cooperative Insurance Group 28% 4332 Jadw a REIT Alharamain Fund 7%
4008 Saudi Co For Hardw are LLC 28% 4004 Dallah Healthcare Co 6%
4190 Jarir Marketing Co 27% 1030 Saudi Investment Bank/The 6%
8200 Saudi Re for Cooperative Reinsurance Co27% 4040 Saudi Public Transport Co 6%
1150 Alinma Bank 27% 2150 National Co for Glass Manufacturing/The6%
4001 Abdullah Al Othaim Markets Co 24% 2320 Al Babtain Pow er & Telecommunication Co6%
2001 Methanol Chemicals Co 24% 8040 Allianz Saudi Fransi Cooperative Insurance Co6%
3091 Al Jouf Cement Co 23% 4130 Al-Baha Development & Investment Co6%
2350 Saudi Kayan Petrochemical Co 21% 8300 Wataniya Insurance Co 6%
8020 Malath Cooperative Insurance Co 17% 4320 Alandalus Property Co 5%
1202 Middle East Paper Co 17% 2270 Saudia Dairy & Foodstuff Co 5%
1020 Bank Al-Jazira 16% 8240 ACE Arabia Cooperative Insurance Co5%
8250 AXA Cooperative Insurance Co 15% 6060 Ash-Sharqiyah Development Co 4%
8170 Trade Union Cooperative Insurance Co15% 8070 Arabian Shield Cooperative Insurance Co4%
8310 Amana Cooperative Insurance Co 15% 2370 Middle East Specialized Cables Co 3%
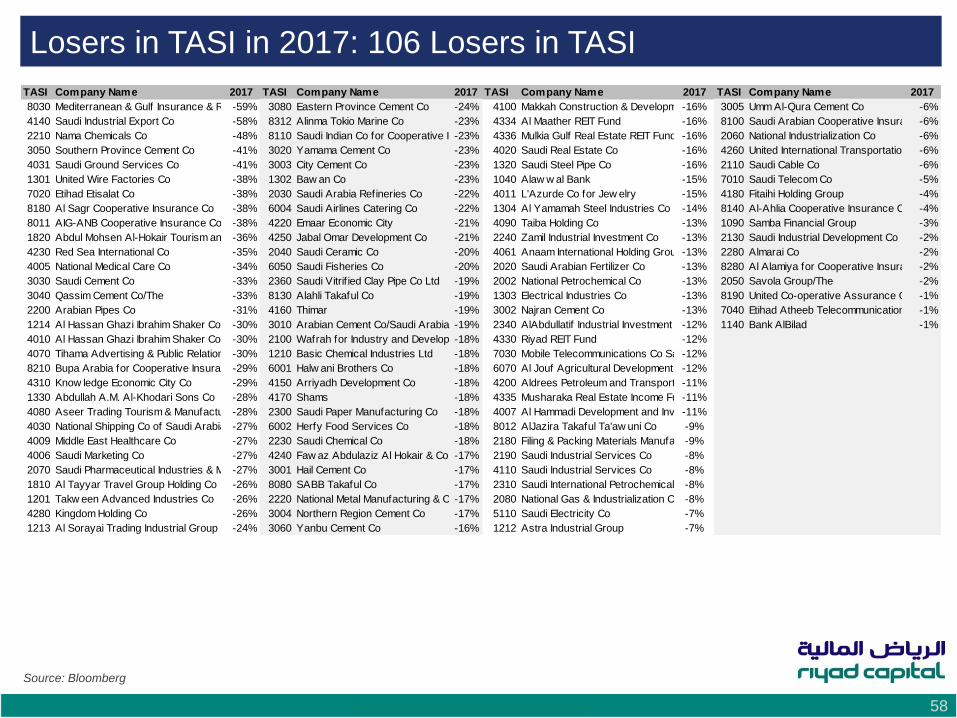
Economic and Market Outlook 58
Losers in TASI in 2017: 106 Losers in TASI
Source: Bloomberg
TASI Company Name 2017 TASI Company Name 2017 TASI Company Name 2017 TASI Company Name 2017
8030 Mediterranean & Gulf Insurance & Reinsurance Co/The-59% 3080 Eastern Province Cement Co -24% 4100 Makkah Construction & Development Co-16% 3005 Umm Al-Qura Cement Co -6%
4140 Saudi Industrial Export Co -58% 8312 Alinma Tokio Marine Co -23% 4334 Al Maather REIT Fund -16% 8100 Saudi Arabian Cooperative Insurance Co-6%
2210 Nama Chemicals Co -48% 8110 Saudi Indian Co for Cooperative Insurance-23% 4336 Mulkia Gulf Real Estate REIT Fund -16% 2060 National Industrialization Co -6%
3050 Southern Province Cement Co -41% 3020 Yamama Cement Co -23% 4020 Saudi Real Estate Co -16% 4260 United International Transportation Co-6%
4031 Saudi Ground Services Co -41% 3003 City Cement Co -23% 1320 Saudi Steel Pipe Co -16% 2110 Saudi Cable Co -6%
1301 United Wire Factories Co -38% 1302 Baw an Co -23% 1040 Alaw w al Bank -15% 7010 Saudi Telecom Co -5%
7020 Etihad Etisalat Co -38% 2030 Saudi Arabia Refineries Co -22% 4011 L'Azurde Co for Jew elry -15% 4180 Fitaihi Holding Group -4%
8180 Al Sagr Cooperative Insurance Co -38% 6004 Saudi Airlines Catering Co -22% 1304 Al Yamamah Steel Industries Co -14% 8140 Al-Ahlia Cooperative Insurance Co -4%
8011 AIG-ANB Cooperative Insurance Co -38% 4220 Emaar Economic City -21% 4090 Taiba Holding Co -13% 1090 Samba Financial Group -3%
1820 Abdul Mohsen Al-Hokair Tourism and Development Co-36% 4250 Jabal Omar Development Co -21% 2240 Zamil Industrial Investment Co -13% 2130 Saudi Industrial Development Co -2%
4230 Red Sea International Co -35% 2040 Saudi Ceramic Co -20% 4061 Anaam International Holding Group Co-13% 2280 Almarai Co -2%
4005 National Medical Care Co -34% 6050 Saudi Fisheries Co -20% 2020 Saudi Arabian Fertilizer Co -13% 8280 Al Alamiya for Cooperative Insurance Co-2%
3030 Saudi Cement Co -33% 2360 Saudi Vitrif ied Clay Pipe Co Ltd -19% 2002 National Petrochemical Co -13% 2050 Savola Group/The -2%
3040 Qassim Cement Co/The -33% 8130 Alahli Takaful Co -19% 1303 Electrical Industries Co -13% 8190 United Co-operative Assurance Co -1%
2200 Arabian Pipes Co -31% 4160 Thimar -19% 3002 Najran Cement Co -13% 7040 Etihad Atheeb Telecommunication Co-1%
1214 Al Hassan Ghazi Ibrahim Shaker Co -30% 3010 Arabian Cement Co/Saudi Arabia -19% 2340 AlAbdullatif Industrial Investment Co-12% 1140 Bank AlBilad -1%
4010 Al Hassan Ghazi Ibrahim Shaker Co -30% 2100 Wafrah for Industry and Development-18% 4330 Riyad REIT Fund -12%
4070 Tihama Advertising & Public Relations Co-30% 1210 Basic Chemical Industries Ltd -18% 7030 Mobile Telecommunications Co Saudi Arabia-12%
8210 Bupa Arabia for Cooperative Insurance Co-29% 6001 Halw ani Brothers Co -18% 6070 Al Jouf Agricultural Development Co-12%
4310 Know ledge Economic City Co -29% 4150 Arriyadh Development Co -18% 4200 Aldrees Petroleum and Transport Services Co-11%
1330 Abdullah A.M. Al-Khodari Sons Co -28% 4170 Shams -18% 4335 Musharaka Real Estate Income Fund-11%
4080 Aseer Trading Tourism & Manufacturing Co-28% 2300 Saudi Paper Manufacturing Co -18% 4007 Al Hammadi Development and Investment Co-11%
4030 National Shipping Co of Saudi Arabia/The-27% 6002 Herfy Food Services Co -18% 8012 AlJazira Takaful Ta'aw uni Co -9%
4009 Middle East Healthcare Co -27% 2230 Saudi Chemical Co -18% 2180 Filing & Packing Materials Manufacturing Co-9%
4006 Saudi Marketing Co -27% 4240 Faw az Abdulaziz Al Hokair & Co -17% 2190 Saudi Industrial Services Co -8%
2070 Saudi Pharmaceutical Industries & Medical Appliances Corp-27% 3001 Hail Cement Co -17% 4110 Saudi Industrial Services Co -8%
1810 Al Tayyar Travel Group Holding Co -26% 8080 SABB Takaful Co -17% 2310 Saudi International Petrochemical Co-8%
1201 Takw een Advanced Industries Co -26% 2220 National Metal Manufacturing & Casting Co-17% 2080 National Gas & Industrialization Co -8%
4280 Kingdom Holding Co -26% 3004 Northern Region Cement Co -17% 5110 Saudi Electricity Co -7%
1213 Al Sorayai Trading Industrial Group Co-24% 3060 Yanbu Cement Co -16% 1212 Astra Industrial Group -7%
Economic and Market Outlook 59
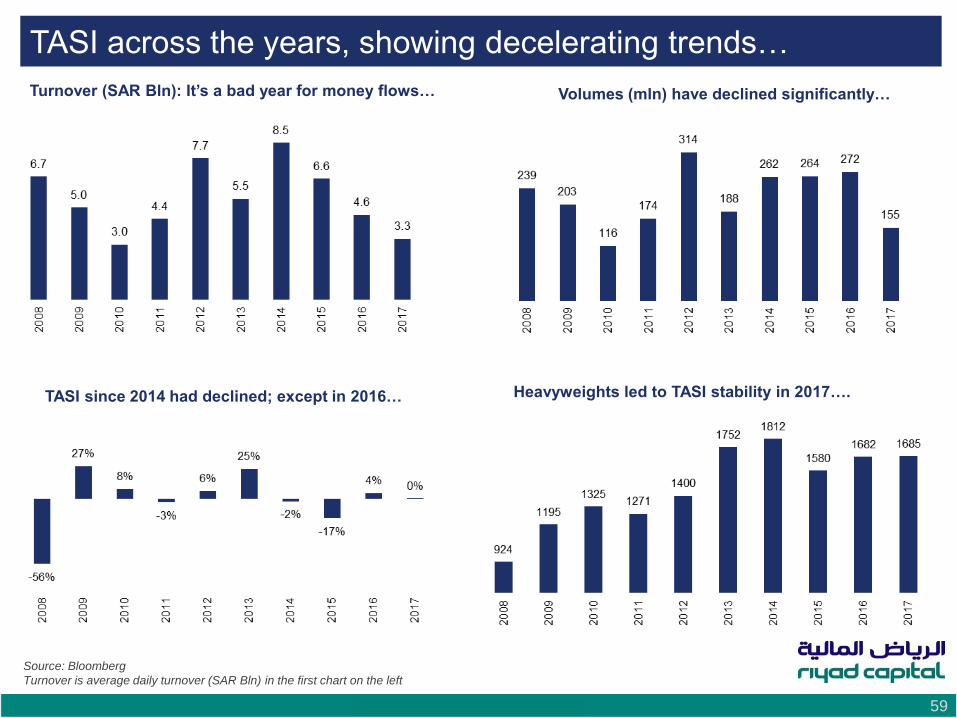
TASI across the years, showing decelerating trends…
Turnover (SAR Bln): It’s a bad year for money flows… Volumes (mln) have declined significantly…
Heavyweights led to TASI stability in 2017…. TASI since 2014 had declined; except in 2016…
Source: Bloomberg
Turnover is average daily turnover (SAR Bln) in the first chart on the left
Economic and Market Outlook 60
The information in this report was compiled in good faith from various public sources believed to be reliable. Whilst all reasonable care has been taken to ensure that
the facts stated in this report are accurate and that the forecasts, opinions and expectations contained herein are fair and reasonable. Riyad Capital makes no
representations or warranties whatsoever as to the accuracy of the data and information provided and, in particular, Riyad Capital does not represent that the
information in this report is complete or free from any error. This report is not, and is not to be construed as, an offer to sell or solicitation of an offer to buy any
financial securities. Accordingly, no reliance should be placed on the accuracy, fairness or completeness of the information contained in this report. Riyad Capital
accepts no liability whatsoever for any loss arising from any use of this report or its contents, and neither Riyad Capital nor any of its respective directors, officers or
employees, shall be in any way responsible for the contents hereof. Riyad Capital or its employees or any of its affiliates or clients may have a financial interest in
securities or other assets referred to in this report. Opinions, forecasts or projections contained in this report represent Riyad Capital's current opinions or judgment
as at the date of this report only and are therefore subject to change without notice. There can be no assurance that future results or events will be consistent with
any such opinions, forecasts or projections which represent only one possible outcome. Further, such opinions, forecasts or projections are subject to certain risks,
uncertainties and assumptions that have not been verified and future actual results or events could differ materially. The value of, or income from, any investments
referred to in this report may fluctuate and/or be affected by changes. Past performance is not necessarily an indicative of future performance. Accordingly, investors
may receive back less than originally invested amount. This report provides information of a general nature and does not address the circumstances, objectives,
and risk tolerance of any particular investor. Therefore, it is not intended to provide personal investment advice and does not take into account the reader’s financial
situation or any specific investment objectives or particular needs which the reader may have. Before making an investment decision the reader should seek advice
from an independent financial, legal, tax and/or other required advisers due to the investment in such kind of securities may not be suitable for all recipients. This
research report might not be reproduced, nor distributed in whole or in part, and all information, opinions, forecasts and projections contained in it are protected by
the copyright rules and regulations
Riyad Capital is a Saudi Closed Joint Stock Company, with commercial registration number (1010239234), licensed and organized by the Capital Market Authority
under License No. (07070-37), and having its registered office at Al Takhassusi Street, Prestige Building, Riyadh, Kingdom of Saudi Arabia (“KSA”). Website:
www.riyadcapital.com
Buy Neutral Sell Not Rated
Expected Total Return
Greater than 15%
Expected Total Return
betw een -15% and +15%
Expected Total Return less
than -15% Under Review / Restricted
*The expected percentage returns are indicative, stock recommendations also incorporate relevant qualitative factors
For any feedback on our reports, please contact [email protected]
Stock Rating
Disclaimer