Embed Size (px)
Citation preview

PHASE 3: SPACE NEEDSJANUARY 2011
FACILITIES MASTER PLANCAPITAL PLAN YEARS 2013 TO 2023
STATE UNIVERSITY CONSTRUCTION FUND & BINGHAMTON UNIVERSITYSUCF PROJECT NUMBER 07839

CONTENTS3.0 INTRODUCTION 4
3.1 ENROLLMENT PROJECTIONS 6
3.1.1 State Demographics 6
3.1.2 Higher Education in New York State 8
3.1.3 SUNY IR Projections for BU 10
3.1.4 Campus Projections 11
3.1.5 Instructional Staffing Projections 16
3.2 SPACE GUIDELINES 18
3.2.1 Structure of the SUNY Guidelines 18
3.2.2 Shortcomings of the Guidelines 18
3.2.3 Alternate Assessment 19
3.3 SPACE UTILIZATION 20
3.3.1 Classroom Utilization 20
3.3.2 Class Lab Utilization 23
3.4 EXISTING SPACE 26
3.4.1 Overview of Existing Space 26
3.4.2 Benchmarking Existing Space 27
3.4.3 2009 Inventory by Building 28
3.4.4 2009 Inventory by Function 30
3.4.5 Inventory Change 31
3.5 SPACE NEEDS 32
3.5.1 Overview of Space Needs 32
3.5.2 Consultant Methodology 34
3.5.3 SUNY Assessment of Overall Need 38
3.5.4 Alternate Assessment of Overall Need 39
3.5.5 Building Capacity Period Detail 43
3.5.6 Sustained Growth Period 56
3.5.7 Qualitative Assessment 58
3.6 UTILIZATION CAPACITY 60
3.6.1 Facility Capacity 60
3.6.2 Campus Capacity 60

4 3.0 INTRODUCTION
3.0 IntroductionBinghamton University is a public research University Center in the State University of New York (SUNY) system. The University includes six schools and offers comprehensive undergraduate and graduate programs in over 130 areas of study.
The University’s 619-acre campus is located in Vestal, NY, in the Southern Tier region of Upstate New York. The University also includes a new downtown campus, as well as a number of smaller support facilities in the Southern Tier region.
The State University Construction Fund (SUCF) engaged Perkins+Will to conduct a Facilities Master Plan (FMP) report for the University. The intent of the FMP is to qualify and evaluate the University’s existing facilities, and provide a plan for future capital projects to support the University’s mission.
The study was initiated in January of 2010, and consists of five phases: Campus Profile, Assessment of Conditions, Analysis of Space Needs, Concept Alternatives, and Final Recommendation.
This report, Space Needs, is the third phase of five comprising the FMP. The document presents enrollment projections, a review of space guidelines, space utilization data, as well as analysis of existing space and future space need for the University. The detailed findings of this report inform the recommendations and plan proposals in Phases 4 and 5 of the FMP.

5
x
xx
xx
xx
x
xx
x
xx
x
x
UDC
0 200 500 1,000 FTN
HillsideCommunity
Physical FacilitiesComplex
HinmanCollege
Mountainview College
SusquehannaCommunity
InnovativeTechnologies
Complex
Institutefor Child
Development
EastGym
WestGym
Sci IV
Sci III
SciLib
Sci II
Sci I
LectureHall Center
NAR
Hinman DH
Dickinson DH
O’ConnorJohnson Halls
WhitneyChamplain Halls
Appalachian Center
IroquoisTuscarora
BartleLibrary
UnivUnion
ChenangoChamplain
Health
New DickinsonCommunity
New NewingCommunity
College in the Woods
UnionWest
Fine ArtsRafuseDigman Halls
Clearview
Administration
Parkg
AndersonCenter
Engineering
ComputerCenter
Academic B
McGuire
UniveristyDowntownCenter
Academic A
Student Wing
Sci V
EventsCenter
BearcatsSports
Complex
ChildcareCenter
COEE&S
Biot
ech
FIGURE 3.0A Binghamton University Existing Campus

6 3.1 ENROLLMENT PROJECTIONS
3.1.1 STATE DEMOGRAPHICS
STATEWIDE DEMOGRAPHIC SHIFT
As it draws nearly 75 percent of its total enrollment from New York State, Binghamton University’s future enrollment is closely dependent on the state’s demographic trends.
The total population for New York is projected to increase by seven percent from the last census in 2000 through 2025. This population growth is not distributed evenly throughout the state, but rather is concentrated in specific zones. Growth zones include the Capital Region, the Finger Lakes, the Hudson Valley, and Long Island. Most other zones, including the Southern Tier where Binghamton is located, are projected to experience a decline in population over the period.
As a whole, New York State faces an aging population. Over the period, the average age of a New Yorker is projected to increase by 2.6 years, from 36.4 to 39.0. The under 30-year-olds are considered to be a population-generating cohort, and negative growth often indicates longer-term population decline. While counties in and around New York City are projected to experience the highest growth rate in the under 30 cohort, nearly all counties in upstate New York are projected to experience a decline in the under 30 population.
Legend
> 15 percent growth
5 to 15 percent growth
0 to 5 percent growth
0 to 5 percent decline
5 to 15 percent decline
> 15 percent decline
FIGURE 3.1.1A Percent Total Population Change by County, 2000 Census (Actual) to 2025 (Projected), Source: Cornell University Program on Applied Demographics (PAD)
Broome County Hudson
Valley
Long Island
Finger Lakes
Western New York
Capital Region
Mohawk Valley
Central New York
Southern Tier
Thousand Islands
Adirondacks
3.1 Enrollment Projections

7
FIGURE 3.1.1B Empire State Development Centers of Excellence
IMPACT OF ECONOMIC DEVELOPMENT
Upstate New York has been heavily impacted by the country’s overall shift toward a service and knowledge economy. The region was once a manufacturing center. Industry has suffered in the new economy, and alternative industries have been slow to take the place of traditional manufacturing. As a result there are fewer jobs in the upstate region. Seeking professional and social opportunities, young people native to the region and those educated upstate often leave for New York City or other locations out of the state. This trend is known as a geographic “brain drain,” and accounts for the population shift projected for the region.
The State recognizes the need to retain and attract back educated individuals to upstate New York. It has established a number of incentives for locating business in the region. Particularly notable are the Empire State Development Centers of Excellence, which engage the State’s premier institutions of higher education as catalysts for industry and economic growth. Six centers of excellence have been identified, each with a unique specialization. Binghamton features the Center of Excellence in Small Scale Systems Integration and Packaging (S3IP).
SUNY DEMOGRAPHICS
Institutions of higher education state-wide will be impacted by the declining demographics of college-aged individuals. In 2009, of the state’s total first-time full time students SUNY captured 42 percent, CUNY 18 percent, independent institutions 34 percent, and proprietary institutions six percent (NY State Education Department). As high school graduate rates decline so will the number of first-time full time students. Institutions will be competing to maintain and expand their share of this pool of students.
The state’s general geographic shift of population out of the upstate region to the greater New York City region may also impact higher education enrollment trends. Institutions located in areas of increasing population, especially in the under-30 year old cohort, will likely have a wider base of potential students. Additionally, institutions located further downstate, such as Binghamton University, may be in an advantageous situation to capture enrollment that exceeds the capacity of the region surrounding New York City.
CENTER OF EXCELLENCE AREA OF SPECIALIZATION
Albany Nanoelectronics
BinghamtonSmall Scale Systems Integration & Packaging (S3IP)
Buffalo Bioinformatics & Life Science
Greater Rochester Infotonics Technology Center (ITC)
Stony Brook Wireless Information Technology
Syracuse Environmental & Energy Systems
BINGHAMTON UNIVERSITY DEMOGRAPHICS
Binghamton University is committed to providing a world-class education to a culturally and economically diverse student body. The institution’s physical facilities must reflect this commitment and provide the physical setting to support students in their academic and social pursuits.
Space requirements do not adhere to a one-size-fits-all model; rather, each cohort of students has its own unique space needs. To ensure that facilities meet student needs, it is important to understand the University’s enrollment profile as it currently exists and in the context of shifting regional demographics.
HOME ORIGIN OF STUDENT
Currently 73 percent of Binghamton University’s headcount enrollment originates from within New York State. Of that, 18 percent comes from Broome County, where the University is located. Another 24 percent comes from Long Island’s Nassau and Suffolk counties combined. The balance of the in-state enrollment originates from 23 other counties in the state, with a notable concentration from the counties in the greater New York City area.
The University’s remaining enrollment consists of seven percent out-of-state United States students and 20 percent foreign students. For its out-of-state enrollment, Binghamton draws most heavily from New Jersey (48 percent of out-of-state U.S.) and Pennsylvania (12 percent of out-of-state U.S.).
The distribution of student home origin weighted toward the in-state population is not uncommon for an institution such as Binghamton. As a state institution, the University’s primary responsibility is to educate students from New York. Like most state systems, the SUNY tuition structure demonstrates this intention by offering notably lower rates for New York State residents ($4,970 in-state versus $12,870 out-of-state and foreign for the Fall 2010 semester).

8 3.1 ENROLLMENT PROJECTIONS
3.1.2 HIGHER EDUCATION IN NEW YORK STATE
HIGH SCHOOL GRADUATE RATES
High school graduate rates provide indication of the number of potential students available for enrollment in institutions of higher education. This group enters as first-time full time students, a key component of an institution’s total enrollment and a basis for returning enrollment.
In New York, the number of high school graduates is projected to decline by 16.5 percent over the ten years projection period from 2009 to 2019 (Source: NYSED ORIS).
In Broome County, the number of high school graduates is projected to decline by 20.4 percent by 2019. The State projects similar decline for neighboring counties, with as much as a 30 percent decline in adjacent Delaware County.
This overall decline of the number of young people in the coming years reduces the pool of potential students for in-state enrollment in SUNY, CUNY, independent, and proprietary institutions. To sustain future growth, Binghamton University must compete to maintain and expand its share of this pool of students.
COUNTY % OF BU ENROLLMENT
PROJECTED CHANGE (NEXT 10 YRS)
Broome 17.9% -20.4%
Nassau 14.3% -14.6%
Suffolk 9.5% -12.3%
TOTAL 41.7% -13.8%
FIGURE 3.1.2A Top Contributing Counties to BU Enrollment and projected change in HS graduates over the next 10 years, Source: BU Office of Institutional Research and Assessment
FIGURE 3.1.2B Graph of New York State High School Graduate Projections, Source: NYSED Office of Research and Information Systems
40,000
60,000
80,000
100,000
120,000
140,000
160,000
180,000
200,000
220,000
HIG
H S
CH
OO
L G
RAD
UATE
CO
UN
T
YEAR
0
20,000
20
07
20
08
20
09
20
10
20
11
20
12
20
13
20
14
20
15
20
16
20
17
20
18
20
19
New York City: -19.8 %
Rest of New York State: -14.9 %
New York State Total: -16.5 %
AC
TUA
L
PR
OJE
CTE
D

9
UNIVERSITY OF THE STATE OF NEW YORK SYSTEM
All colleges and Universities in New York are members of The University of the State of New York (USNY) system, an entity created in 1784 that includes all education in the state, public and private, prekindergarten to postdoctoral. The higher education portion of USNY includes 270 public, non-profit independent, and for-profit proprietary institutions. Binghamton University is a public sector institution. The public sector consists of the State University of New York (SUNY) and the City University of New York (CUNY) systems.
The public sector captures 58 percent of total state-wide enrollment, consisting of 37 percent in the SUNY system and 21 percent in the CUNY system. Of the remaining enrollment, independent institutions capture 38 percent and proprietary capture four percent.
In 2009, the SUNY system captured 64 percent of total public sector enrollment, with CUNY capturing the remaining 36 percent. The SUNY system has 64 campuses located throughout the state, and the CUNY system has 23 campuses dispersed throughout the five Boroughs of New York City.
Economic Trends Impacting Higher Education
Higher education admissions processes are occurring in a climate of economic uncertainty. A study conducted by the National Association for College Admission Counseling identified how the economy is shifting trends in high school students’ college plans. Findings include:
+ An increase in students foregoing their “dream schools” in favor of more affordable options,
+ An increase in the number of students planning to enroll in public versus private institutions,
+ An increase in the number of students planning to enroll in community colleges.
+ And an increase in returning students/ or people looking for a career change
CUNY System Opportunities
With its New York City location, the CUNY system may be in a position to increase its portion of total public sector enrollment. New York City is experiencing a steady increase in
its higher education student population, drawing local, state, national, and international students. Increasingly viewed as a “University town,” New York City attracts students with its reputation as a center for finance, media, and culture. The many institutions of higher education, in turn, contribute to the City’s reputation as a center for ideas and innovation.
As a public institution, CUNY’s role within the New York City’s higher education climate is to provide and affordable education for a high volume of students. Demand at CUNY institutions has been high. The system recently announced that it will enact an admissions waiting list for the first time in its history, indicating that it is near “at-capacity” status. This presents an opportunity for SUNY to capture a higher share of the enrollment.
SUNY Community Colleges
The SUNY system has two major divisions: state operated institutions (consisting of University Centers and other doctoral institutions, Comprehensive Colleges, and Colleges of Technology) and community colleges. Community colleges in New York State have become increasingly competitive with the state operated institutions. Historically, the state operated and community colleges split SUNY’s catchment of first-time full time students roughly 50/50. In recent years, community colleges have pulled ahead to capture a majority share of this population, today nearly 60 percent. A number of factors contribute to the increase, including:
+ Extensive course offerings and even, in some cases, the additional of baccalaureate programs at community colleges, which allow them to compete directly with four-year institutions,
+ The expansion of campus facilities at community colleges to include student life amenities such as field houses and student unions as well as residence halls, heightening students’ facility expectations,
+ Financing models that allow community colleges to charge back to the counties in which students reside, that when combined with campus housing availability transforms them to destination institutions.
These factors, when combined with their natural cost advantage, allow community colleges to provide an effective, subsidized first two years of an eventual baccalaureate degree
at a significant advantage over the state operated colleges. It is possible that community colleges may retain this larger market share as high school graduate rate demographics decline.
Opportunities for Enrollment Catchment
In the context of demographic and economic shifts, opportunities arise for enrollment catchment among the following student profiles:
+ Upper-division transfer students, particularly those who attended community colleges for their first two years and are seeking a bachelor’s degree,
+ Students from downstate and the New York City region that CUNY is unable to accommodate due to capacity issues,
+ Students that may have sought a private school experience were it not for the current economic climate,
+ International students seeking a strong educational experience in the United States that provides excellent services to their population,
+ Returning students for continued emphasis on retaining the core existing BU student population.

10 3.1 ENROLLMENT PROJECTIONS
3.1.3 SUNY IR PROJECTIONS FOR BU
SUNY projects an overall enrollment growth of six percent for Binghamton University through 2023. Total enrollment is projected to peak in 2013 and then steadily decline to a level modestly above existing.
Undergraduate enrollment is projected decline slightly, by one percent, through 2023. The projection follows a similar pattern as the total enrollment, with a peak in 2013 followed by a steady decline. Graduate level enrollment is projected to undergo significant 44 percent growth and account for the institution’s overall growth.
FIGURE 3.1.3B SUNY IR Projections for BU, Source: SUNY IR DataFIGURE 3.1.3A SUNY IR Projections for BU (FTE)
Source: SUNY IR Data
YEAR UNDERGRAD GRAD TOTAL
2008 (Actual) 12,135 2,590 14,725
2013 13,546 2,800 16,346
2018 12,239 3,193 15,432
2023 11,561 3,745 15,306
0
2,000
4,000
6,000
8,000
FTE
YEAR
10,000
12,000
14,000
16,000
18,000
20,000
2023Projected
2018Projected
2013Projected
2008Actual
Undergraduate
Graduate
TOTAL

11
3.1.4 CAMPUS PROJECTIONS
As a part of the FMP process, Binghamton University’s Enrollment Management Group conduced enrollment analysis and issued a projections that reflect its vision for expansion through 2023.
STRATEGIC INITIATIVES AFFECTING ENROLLMENT
HARPUR COLLEGE: FINE ARTS DIVISION
The Fine Arts Division is projected to experience steady enrollment growth over the planning period, proportional to total growth at the Main campus.
The Division expects to maintain its current degree offerings, with undergraduate programs across all departments and graduate programs in Art History, Music and Theater with Art History as the only doctoral granting program. It will seek to create greater synergy among the departments and build on existing collaborations.
The Confucius Institute for Chinese Opera is one of only four specialized Confucius Institutes in the world and maintains strong collaborations with the Music, Theater and Asian and Asian American Studies departments.
The Music master’s program in opera maintains a unique, long-standing collaboration with Tri-Cities Opera, enhancing the strength of the program and contributing to the regional arts community.
The Cinema program is one of the oldest in the US and is recognized for its commitment to cinema as an art form and the strong individual attention students receive.
HARPUR COLLEGE: HUMANITIES DIVISION
The Humanities Division is projected to experience steady enrollment growth over the planning period at a rate slightly above that of total growth at the Main campus. English, General Literature and Rhetoric is highlighted to drive more substantial FTE growth over the period, with growth predominantly at the undergraduate level.
The Humanities Division features the Philosophy, Politics and
Law (PPL) interdisciplinary program. This program is unique to BU and attracts strong students, most of whom are on a pre-law track and will be candidates to feed into the University’s future Law School. The PPL program will drive demand for growth in the Philosophy department.
The division has strong programs in a wide range of world languages including, Arabic, Chinese, French, Hebrew, Hindi, German, Greek, Italian, Japanese, Korean, Latin, Russian, Spanish, Turkish, Vietnamese, and Yiddish. Binghamton is the only institution within the SUNY system to offer majors in Arabic and Russian.
The Institute for the Advanced Study of the Humanities (IASH) promotes faculty research, interdisciplinary collaboration and community outreach in the Humanities and Social Sciences.
The English, General Literature and Rhetoric department has strong programs at the undergraduate and graduate levels and a nationally renowned creative writing program. There are several nationally distinguished writers on the faculty.
The Center for Medieval and Early Renaissance Studies (CEMERS) is internationally recognized for its scholarship, programming and publications.
The Division is also considering additional interdisciplinary programs, such as a literature program that would draw on German, Russian, Romance Languages, and Africana studies, among others.
HARPUR COLLEGE: SCIENCE & MATHEMATICS DIVISION
The Science & Mathematics Division is projected to experience substantive growth over the planning period, however at a rate less than total growth at the Main campus.
The division has the largest undergraduate enrollment within Harpur and prepares large numbers of students for medical school and graduate education in mathematics and science. It, therefore, plays a leading role in meeting the growing demand for students with bachelors, masters, and doctoral level training in the STEM area.
The Psychology department’s Behavioral Neuroscience program ranks among the top 10% of programs in the country and generates significant federal research funding.

12 3.1 ENROLLMENT PROJECTIONS
Physics and Chemistry have strong research programs that include significant collaborations with the Watson School of Engineering through the Materials Science program where advanced research on alternative sources of energy is being conducted.
The Biology department has strong research programs focusing on cancer and biofilms research.
The division has unique programs that reach across the disciplines. The Anthropology department’s master’s program in Biomedical Anthropology supports teaching in forensics and prepares students for work in a wide variety of medical fields and industry. EVoS, the Evolutionary Studies program, is a unique interdisciplinary program with links to Biology, Anthropology, and other areas of the Humanities and Social Sciences.
A new research initiative, which will build on existing strengths in the broad area of health and wellness and strengthen ties with SUNY Upstate Medical Center promises to increase research focused on cancer and neuroscience.
HARPUR COLLEGE: SOCIAL SCIENCE DIVISION
The Social Science Division is projected to experience substantive enrollment growth over the planning period, however at a rate less than total growth at the Main campus.
The Division, which has grown rapidly during the past decade and enrolls the second largest number of majors within Harpur, features strong, well-enrolled undergraduate programs, and doctoral programs in Anthropology, History and Political Science that rank in the top 20% of PhD programs in the nation for their discipline. Sociology and Economics also support strong doctoral programs.
The Public Archaeology Facility (PAF) is a significant research center that collaborates with state and local governments and industry to conduct archaeological impact studies for construction projects. The center will drive growth in Anthropology.
The Fernand Braudel Center is world renowned for promoting high quality, innovative interdisciplinary research in the social sciences with a focus on world historical systems.
The Geography department has significant expertise and visibility in applied geographical research that contributes to
the work of local, state, and national governments and industry. The department supports a state of the art GIS core facility.
Economics boasts strengths in labor economics and environmental economics.
WATSON SCHOOL OF ENGINEERING
The Thomas J. Watson School of Engineering is projected to experience steady growth over the planning period, proportional to the total growth at the Main Campus.
At the undergraduate level, the Thomas J. Watson School of Engineering will retain all six existing majors leading to Bachelor of Science degrees. The Engineering Design program, which serves as the foundation to all engineering programs, will expand its focus on collaborative student work, and will need increased access to shop and lab spaces. At all levels of the curriculum, there is a need for design and project space that fosters teamwork.
The Watson School anticipates an increase in research and graduate level programs, particularly PhD programs. All departments are seeking to make their graduate programs more PhD intensive.
SCHOOL OF EDUCATION
The School of Education is projected to experience significant growth over the planning period, at a rate well above total growth for the Main Campus. Currently the School focuses on graduate education. It intends to continue its existing graduate and postgraduate components, and anticipates a future increased demand for evening courses.
The School of Education currently offers no undergraduate degree programs, however it is considering creation of a minor in Education for undergraduate students to build on existing undergraduate offerings. The minor would serve as a feeder into the graduate programs for students interested in education. Until further definition, the minor is not reflected enrollment projections, but if implemented may significantly increase undergraduate FTEs.
The School is currently pursuing an external graduate education program in New Orleans, which will be delivered through of a combination of off-site, in-person and synchronous distance learning methods. This program is not anticipated to drive FTE

13
growth at the Main Campus, but will have associated faculty and distance learning facilities needs.
SCHOOL OF MANAGEMENT
The School of Management is projected to experience substantive growth over the planning period, however at a rate less than total growth at the Main Campus. The School is currently ranked in the top 50 business schools and the top 12 public business schools in the nation. In order to continue to compete in that milieu, it intends to balance enrollment growth with access to facilities and faculty lines.
At the undergraduate level, the School of Management intends to maintain its current BS offerings, with curriculum in nine focus areas.
At the graduate level, the School currently offers both a Master of Business Administration and a Master of Science in Accounting. The MBA program was recently reduced in size to allow resources to be shifted to the MSA. The School offers a number of tracks for students to approach the MBA program, including: a fast-track MBA offered to Harpur College of Arts and Sciences or Thomas J. Watson School of Engineering students to complete an MBA in one year; executive MBA programs both at the Main Campus and off-campus in New York City; and a professional MBA program offered in New York City.
In addition, the School of Management features a specialized executive MBA program with a health care concentration for students with a clinical background. The executive MBA program with health care concentration has not been offered as a stand-alone program for several semesters but is offered as a track in the EMBA program. The school also offers an executive education program at Price Waterhouse Coopers, delivered at their facility in New York City; a program with Lockheed Martin delivered both at their facility and on campus; and doctoral programs linked to Syracuse University and University at Buffalo.
SCHOOL OF NURSING
The Decker School of Nursing is projected to experience steady enrollment growth over the planning period, proportional to total growth at the Main Campus. The School notes the importance of balancing enrollment growth with the provision of faculty and facilities resources to maintain its high-quality
programs. It anticipates transition to more simulation and diagnostic environments and future tightening of credential requirements, given research indicating that better nurses yield better patient outcomes. These factors will further emphasize the need for resources to support enrollment growth.
At the undergraduate level, the School plans to continue to build programs on sophomore transfer students and admit only a small number of freshman students. Enrollment in the Registered Nurse to Bachelor of Science program, which is built on students with an associates degree that have completed clinical requirements, is anticipated to increase.
At the graduate level, the School plans to continue the Master of Science programs with majors in family nursing, community health nursing, psychiatric mental health, or gerontological nursing and the PhD in nursing with a focus on rural health. During the next 2-5 years the existing masters nurse practitioner and clinical nurse specialist programs will transition to the Doctor of Nursing Practice level (DNP). The post masters DNP program initiated in 2010 is expected to expand. Concentrations at the masters level are available in disaster preparedness, rural nursing, and forensics with a palliative care concentration pending approval. The existing educator and administrator components of the masters programs are planned to continue with expansion of the educator component. The Post masters Nurse Educator Certificate Program is also projected to expand.
The School of Nursing currently offers the only post-graduate program in the nation that focuses on rural health. It plans to continue this area of specialization and intends transition it to an online program with a summer residency in order to better reach interested rural populations.
COLLEGE OF COMMUNITY AND PUBLIC AFFAIRS
The College of Community and Public Affairs is located off of the main campus, in the University Downtown Center in downtown Binghamton. It is projected to experience steady enrollment growth over the planning period, however at a rate less than the University total.
The College currently offers an undergraduate program in Human Development and graduate programs in Public Administration, Social Work, and Student Affairs Administration. It intends to maintain these programs. At the graduate level, joint programming and synergies exist between
Public Administration, Social Work, and the Decker School of Nursing. Students are also offered fast-track programs and certificate options.
The College contains unique internship and field education programs, which actively engage the greater community. These programs are option for undergraduate students, and required for all CCPA students.
In the future, the College intends to initiate a series of PhD programs that foster interdisciplinary collaboration between its existing departments. The PhD program is intended to have designated faculty and resources.
14 3.1 ENROLLMENT PROJECTIONS
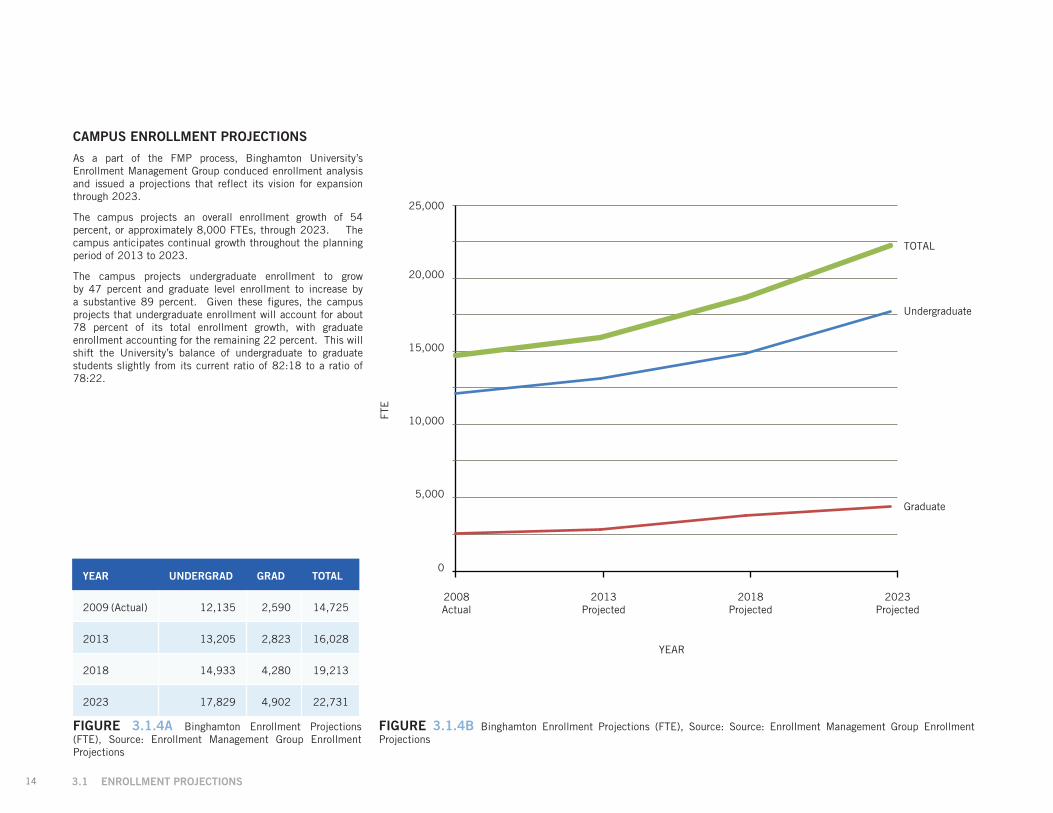
CAMPUS ENROLLMENT PROJECTIONS
As a part of the FMP process, Binghamton University’s Enrollment Management Group conduced enrollment analysis and issued a projections that reflect its vision for expansion through 2023.
The campus projects an overall enrollment growth of 54 percent, or approximately 8,000 FTEs, through 2023. The campus anticipates continual growth throughout the planning period of 2013 to 2023.
The campus projects undergraduate enrollment to grow by 47 percent and graduate level enrollment to increase by a substantive 89 percent. Given these figures, the campus projects that undergraduate enrollment will account for about 78 percent of its total enrollment growth, with graduate enrollment accounting for the remaining 22 percent. This will shift the University’s balance of undergraduate to graduate students slightly from its current ratio of 82:18 to a ratio of 78:22.
FIGURE 3.1.4B Binghamton Enrollment Projections (FTE), Source: Source: Enrollment Management Group Enrollment Projections
FIGURE 3.1.4A Binghamton Enrollment Projections (FTE), Source: Enrollment Management Group Enrollment Projections
YEAR UNDERGRAD GRAD TOTAL
2009 (Actual) 12,135 2,590 14,725
2013 13,205 2,823 16,028
2018 14,933 4,280 19,213
2023 17,829 4,902 22,731
0
5,000
10,000FTE
YEAR
15,000
20,000
25,000
Undergraduate
Graduate
TOTAL
2023Projected
2018Projected
2013Projected
2008Actual
15
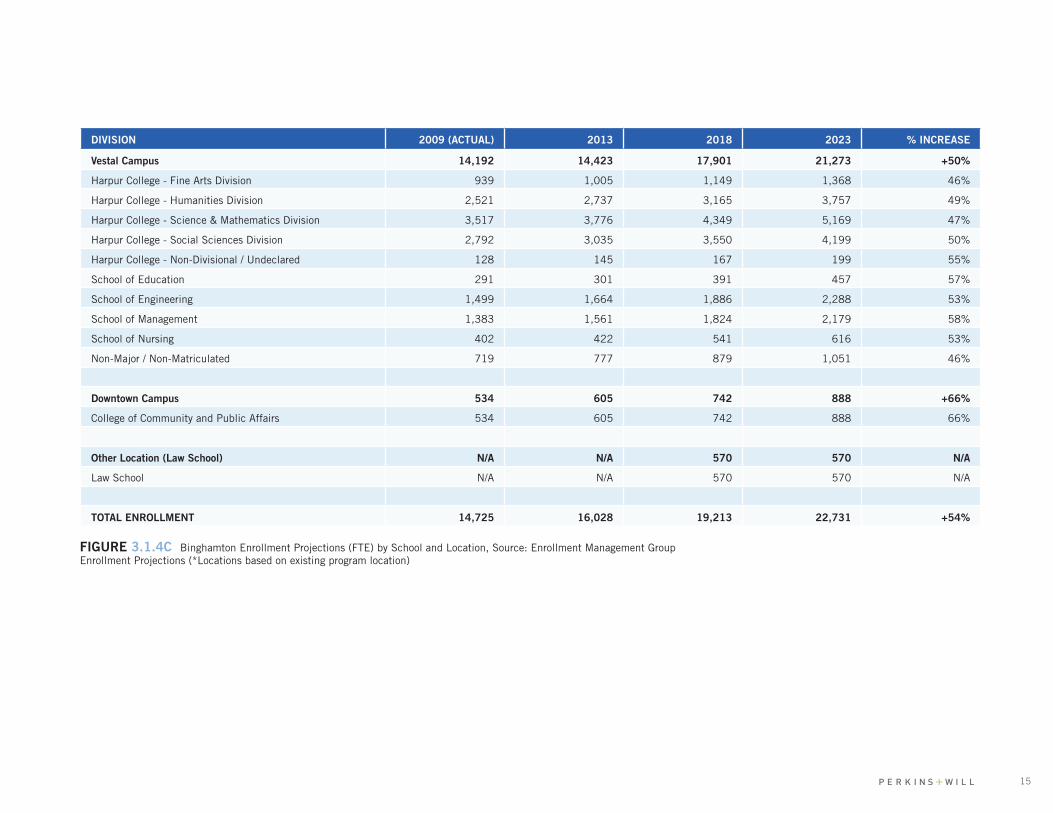
DIVISION 2009 (ACTUAL) 2013 2018 2023 % INCREASE
Vestal Campus 14,192 14,423 17,901 21,273 +50%
Harpur College - Fine Arts Division 939 1,005 1,149 1,368 46%
Harpur College - Humanities Division 2,521 2,737 3,165 3,757 49%
Harpur College - Science & Mathematics Division 3,517 3,776 4,349 5,169 47%
Harpur College - Social Sciences Division 2,792 3,035 3,550 4,199 50%
Harpur College - Non-Divisional / Undeclared 128 145 167 199 55%
School of Education 291 301 391 457 57%
School of Engineering 1,499 1,664 1,886 2,288 53%
School of Management 1,383 1,561 1,824 2,179 58%
School of Nursing 402 422 541 616 53%
Non-Major / Non-Matriculated 719 777 879 1,051 46%
Downtown Campus 534 605 742 888 +66%
College of Community and Public Affairs 534 605 742 888 66%
Other Location (Law School) N/A N/A 570 570 N/A
Law School N/A N/A 570 570 N/A
TOTAL ENROLLMENT 14,725 16,028 19,213 22,731 +54%
FIGURE 3.1.4C Binghamton Enrollment Projections (FTE) by School and Location, Source: Enrollment Management Group Enrollment Projections (*Locations based on existing program location)

16 3.1 ENROLLMENT PROJECTIONS
SCHOOL OR DIVISION 2009 ACT
2013 PROJ
2018 PROJ
2023 PROJ % INC
Main Campus 821 899 1,073 1,271 55%
Harpur College: Fine Arts Division 58 63 72 85 46%
Harpur College: Humanities Division 144 164 192 227 57%
Harpur College: Science & Mathematics Division 198 217 262 307 55%
Harpur College: Social Sciences Division 164 180 220 257 57%
School of Education 28 29 38 44 56%
Thomas J. Watson School of Engineering 122 137 156 193 59%
School of Management 63 61 71 87 37%
Decker School of Nursing 44 48 63 71 62%
Downtown Campus 35 39 46 53 63%
College of Community and Public Affairs 35 39 46 53 63%
TOTAL INSTRUCTIONAL STAFF FTE 856 938 1120 1324 55%
FIGURE 3.1.5A Target Instructional Staff FTE Composition
3.1.5 INSTRUCTIONAL STAFFING PROJECTIONS
In addition to student FTEs, instructional staffing plays a key role in the assessment of space needs for a university. Instructional staffing requirements are informed by departmental student FTEs and the associated WSCHs.
An instructional staffing model determines a total staff FTE requirement. The total is comprised of a blend of full-time faculty, part-time faculty, adjunct lectures, professors emeritus, technical specialists, graduate student lecturers, and administrative assistant support staff.
The chart to the right summarizes total instructional staff FTEs requirements projected for BU’s academic schools and divisions.

17
Full-Time Faculty Projections
Full-time faculty are an important component in the long-term success of an institution academic programming. Full-time positions consist of full-time tenure-track faculty, visiting faculty, and full-time lecturers.
The FMP assumes a metric 70 percent of all instructional staff FTEs to be provided by full-time positions. This metric is employed throughout the assessment, with the exception of instances where a unique figure was provided by the University.
The adjacent chart summarizes total full-time lines for BU’s academic schools and divisions.
FIGURE 3.1.5B Target Full-Time Faculty Composition
SCHOOL OR DIVISION 2009 ACT
2009 NEED
2013 PROJ
2018 PROJ
2023 PROJ % INC
Main Campus 588 632 670 769 905 54%
Harpur College: Fine Arts Division 37 41 44 48 56 51%
Harpur College: Humanities Division 107 118 129 145 170 59%
Harpur College: Science & Mathematics Division 129 144 156 184 215 67%
Harpur College: Social Sciences Division 121 126 131 154 180 49%
School of Education 19 20 20 27 31 63%
Thomas J. Watson School of Engineering 85 91 100 113 139 64%
School of Management 45 47 45 53 65 44%
Decker School of Nursing 45 45 45 45 49 9%
Downtown Campus 22 25 27 32 36 64%
College of Community and Public Affairs 22 25 27 32 36 64%
TOTAL FACULTY 610 657 697 832 972 59%

18 3.2 SPACE GUIDELINES
3.2.1 STRUCTURE OF THE SUNY GUIDELINES
The SUNY Space Guidelines, dating from the 1960s and early 1970s, represented the state-of-the-art in space management at the time. During that period, the system’s major capitalization phase, the guidelines provided a methodology for allocating resources both across the system and within an individual campus.
The SUNY guidelines project space requirements using one of three approaches: space factors, FTE-based models, and equivalency with existing space.
SPACE FACTORS
This approach allocates resources based on an institution’s student and faculty FTEs and is employed to determine requirements for instruction and research space. Overall space requirements are derived using the following data sets: student FTE projections, the campus’ actual inventory as reported in the Physical Space Inventory (PSI), student contact hours from the course schedule, and a space factor.
SUNY guidelines incorporate both a space factor, designating ASF per station, and a design guideline, which includes the station and shared departmental space square footage. For example, the space standard for a faculty office is 120 ASF and the space factor is 160 ASF, with the additional 40 ASF accounting for support staff, conference and work areas, and intra-departmental circulation.
FTE-BASED MODELS
This approach allocates space based on an institution’s student and faculty FTE range and is used to determine requirements for the categories of: assembly and exhibition, building services, central services, data and resources center, general administration, instructional resources, libraries, physical education, student health services, and student faculty activities. Space requirements are determined using a programming metric established by SUCF for each category.
Specialized categories incorporate additional information, such as analysis of library volumes for libraries space.
EQUIVALENCY WITH EXISTING SPACE
This approach allocates a space requirement that is equivalent to the existing space reported in the PSI. It is employed for the categories of organized activities, organized research, and public service.
3.2.2 SHORTCOMINGS OF THE GUIDELINES
Certain elements of the SUNY guidelines are problematic for planning given the context in which they were created and the complexity of contemporary higher education. Specific areas of concern include the following:
1. The methodology of employing space factors for academic space needs projections
2. The values employed for certain FTE-based and percentage-based models for support space needs projections.
THE ISSUE OF SPACE FACTORS
SUNY’s space factors are useful at the system-level for the early stages of project development to provide a “cost per square foot” model. They allow for development of basic square foot budgeting prior to contracting based on student FTEs. For example, SUCF could employ space factors to prepare a preliminary scope or space budget, establishing parameters for consultant teams to work within for space program development. The space factors are particularly effective when large-scale expansion is pursued, and less effective with small-scale expansion.
However, with mature campuses space factors become more problematic as these campuses often require a finer degree of analysis that the factors can provide. Capital projects at mature campuses often occur at reduced scales through local
renovations, infill additions, or single new buildings. These projects often contain a range of space types in smaller quantities, and as such it is difficult to allocate a specific student FTE, a key aspect with calculation by space factor.
Additionally, the space factors were generated in a different context than contemporary higher education institutions face. The factors reference a utilization standard that was determined over 40 years ago that makes assumptions about where instruction occurs that do not accurately represent the current activity of institutions.
Given these issues, the space factors simply do not provide enough precision for calculation of academic space needs. Specific shortcomings for general instruction space and departmental space are outlined below.
General Instruction Space. General instruction space is calculated using the space factor method. SUNY has established a space factor of 16 ASF per station for general instruction. Design guidelines, which include shared space, are 16 ASF per station for lecture halls and 20 ASF per station for classrooms.
These figures, derived over 30 years ago, assume general instruction to occur in compact lecture hall and tablet-armchair style spaces and do not meet the needs of today’s instructional delivery methods. With pedagogy shifts, instruction in lecture halls and tablet armchair rooms requires more space, 18-21 ASF per station.
Pedagogy shifts also drive instruction to occur in different types of rooms, including rooms with tables and chairs, seminar rooms, and project-based learning rooms. These room typologies require between 21 and 28 ASF per station, well over the SUNY design guideline.
Departmental Space. Faculty office space requirements are derived using an FTE space factor, combined with a space standard that allocates ASF per workstation. SUNY’s instructional space factor allocates 160 ASF per faculty FTE (FTEF), while the space standard for an individual faculty office is 120 ASF. The goal of the 160 ASF is to include not only the faculty office, but also space for support staff, conference and work areas, and intra-departmental circulation.
3.2 Space Guidelines

19
However, this last element, intra-departmental circulation, is not effectively addressed in the space factor in instances when departmental offices/space does not open directly onto public corridors. The reporting of space for indirect cost recovery (ICR) requires that the PSI conform to the Postsecondary Education Facilities Inventory and Classification Manual (FICM). To achieve this compliance in these cases, the inventory procedure must include intra-departmental circulation within the departmental ASF. The 160 ASF space factor, while adequate for the office and ancillary uses, does not provide sufficient space for intra-departmental circulation. The alternative assessment uses a space factor of 180 ASF to model department space.
FTE-BASED AND PERCENTAGE-BASED MODELS
The SUNY guidelines employ FTE-based and percentage-based models to project space needs in a number of support space categories. Factors employed in these models were developed over 40 years ago. Some still serve as a good representation of space needs, however some are no longer valid. Of particular concern are the following:
Data Processing. The guidelines allocate a flat quantity of ASF for data processing space, also referred to as information technology space, based on an institution’s type and student FTE. Due to the time period in which they were developed, the guidelines do not account for contemporary shifts and efficiencies gained in data processing equipment and operations and over-allocate facilities.
Libraries. The guidelines determine space needs for libraries as a sum of three factors: a space per volume calculation, a seating space calculation of 5.32 ASF per student FTE, and an administrative calculation of 0.25 x (seating + volume space). The guidelines size a library based on the assumption of it serving as a repository for books and physical collections, supported by a robust administrative staff. Since their establishment, libraries have undergone a significant shift and today are conceived of as an intellectual hub for information access through a variety of means, rather than a repository for collections. This shift has been driven by the advent of technology and resource limitations. It yields a net reduction in space needs for library functions compared with the SUNY guidelines and an entirely different distribution of that space.
Student Health Center. The guidelines allocate a flat quantity of ASF for a student health center based on an institution’s type
and student FTE. The space allowance assumes the provision of a robust health center. Many institutions today, particularly the University Centers in the SUNY system, are located in close range of medical centers. As such, significantly less demand is placed on the on-campus student health center, resulting in reduced facilities demands.
General Administration. The guidelines allocate a rate of 8 ASF per student FTE for general administration functions for University Centers. Similarly to the provision on the academic side for departmental space and faculty offices, this figure is not robust enough to accommodate the full range of office and support functions that today’s institutions require.
Central Services. The guidelines determine space needs for central services as a metric of 4 percent of the sum of other facilities categories (excluding central services and building services). This allocation is insufficient for contemporary institutions to support the full range of required buildings and grounds operation functions. A specific shortcoming is the provision of facilities for equipment and vehicle storage and maintenance, a particularly area of concern with electric and alternative fuel vehicles.
OBSOLESCENCE OF ANY SPACE GUIDELINE
It is important to note that all space guidelines obsolesce. This is not uncommon to hear, both from campuses and from SUCF program managers. The reality is that the factors obsolesce from the bottom-up. This means that while individual, more detailed space allocation figures may lose their meaning, the aggregate need of an institution will remain largely unchanged. It is often not the overall space need that is changing, but rather the distribution of that space. For example, if space need calculations based on the guidelines result in 150 ASF per student for an institution, it can be expected that the composition of that space will change over time. However, the total of 150 ASF will rarely change in a substantive way, and will continue to serve as a meaningful way to evaluate capital expenditures.
Often when pursuing new facilities that are unwarranted, institutions erroneously reference an obsolescence of the guidelines that assumes error in the larger numbers rather than the smaller numbers. The ability to recognize and implement constraints on the construction of new facilities is essential
to maintaining excellence across the building inventory, and should increasingly define what makes a “green” campus. Too often campuses pursue a continued expansion of facilities, in many cases emulating their more heavily endowed tier-one, private institutions, which typically have double the ASF per student FTE of SUNY institutions. By seeking to emulate institutions with substantially more resources, colleges expend beyond their capacity on a limited segment of their facilities, while starving other areas of quantity of space, adaptation, and modernization.
3.2.3 ALTERNATE ASSESSMENT
The alternate assessment for Binghamton University provides a higher degree of specificity for calculation of academic space needs, to more closely reflect the inherent complexities of higher education. The detail provided offers a deeper level of analysis compared with the SUNY guidelines that facilitates the development and later-stage management of future individual projects. It also more accurately reflects the location of instruction employed by today’s pedagogy.
To that end, space factors play a diminutive role in the academic portion of the alternate assessment, providing corroborating evidence rather than serving as the primary driver of space needs. The assessment employs SUNY space standards and utilization based on contemporary instruction. For detailed methodology, refer to section 3.5.2 Consultant Methodology.

20 3.3 SPACE UTILIZATION
3.3.1 CLASSROOM UTILIZATION
Classrooms represent about six percent of Binghamton University’s facilities inventory, however are the location of approximately 80 percent of all instruction. Additionally, classrooms by nature are more resource efficient than class labs, their instructional counterparts, both in terms of space requirements and construction and maintenance costs. Due to the combination of these factors, an ideal classroom inventory is able to provide a high value at a modest resource investment.
Given aggressive enrollment targets, it is essential that BU maximize its existing inventory of classrooms and lecture spaces. The following classroom utilization analysis outlines the utilization performance of existing classrooms. Ultimately, the utilization data will inform the scope, nature, and prioritization of classroom-related projects in Phases 4 and 5 of the FMP.
CALCULATING UTILIZATION
Classroom utilization is calculated for PSI rooms coded as classrooms (space type 1001) and lecture halls (space type 1100). Classroom utilization is calculated using two metrics: utilization rate and fill rate. The ensuing analysis includes only general purpose classrooms that are centrally scheduled.
Utilization Rate. Utilization rate is a ratio of the total number of hours a classroom is scheduled per week over a target, which SUNY defines as 35.4 hours/week. The target utilization of 35.4 hours per week was increased by the State Department of Budget from the original SUNY standard of 30 hours per week based on the assumption that classrooms could be used in the evening as well as during the day. Utilization rate is calculated for each classroom, with an ideal utilization rate near 100 percent (with 100 percent representing 35.4 hours).
Fill Rate. Fill rate is a ratio of the number of students in a course section over the number of seats available in the classroom the section is scheduled in. SUNY defines a target fill rate of 80 percent. Fill rate is calculated for each course section, and may be averaged for each classroom to determine an average classroom fill rate.
In system-wide analysis, SUNY combines the utilization and fill rates to derive a weekly student contact hour (WSCH) goal. For classrooms, SUNY defines the WSCH goal of 28.32 hours per
FIGURE 3.3.1A SUNY Utilization Standards
SYSTEM ADJUSTED HOURS % USED WSCH /
STATION
SUNY 35.4 hours 80% 28.32
CUNY 30.0 hours 80% 24.00
California 53.0 hours 66% 35.00
Florida 40.0 hours 60% 24.00
station (the utilization rate of 35.4 multiplied by the fill rate of 0.80 = 28.32). The chart below summarizes WSCH per station targets of different university systems.
The two-pronged utilization rate and fill rate approach to deriving the WSCH goal allows for more accurate analysis of classroom inventory across campus. Consider a situation involving a large lecture hall that is heavily scheduled, but scheduled with small section sizes. If analyzed only by number of scheduled hours, the lecture hall would appear effectively utilized. However, due to the small section sizes, the room performs poorly in terms of percent fill rate. Combining the two assessment methods allows for a more accurate portray of utilization.
INVENTORY AND CALCULATION METHODOLOGY
During the Fall 2009 semester, Binghamton University’s inventory of general purpose, centrally allocated classrooms included 126 rooms, 115 located at the main campus and 11 located at the University Downtown Center.
The PSI for the Fall 2009 term coded 156 rooms in classroom space types (1001 as “Classrooms” and 1100 as “Lecture Halls”). Overlaying PSI and general purpose classroom data sets reveals that 30 classrooms from the PSI are not centrally allocated.
Additionally, courses for the Fall 2009 semester were scheduled in 23 rooms outside of the general purpose classrooms and PSI coded classrooms. These rooms are predominantly coded as departmental spaces, such as conference rooms.
The following calculations for classroom utilization and fill rate include only data sets for general purpose, centrally controlled classrooms (the base 126 rooms). This methodology reduces the impact of outlier and anomaly data for analysis that most closely reflects experienced utilization.
Calculations are presented on the following pages organized as averages by classroom section-size tier and by building. The total quantity of rooms included and key data for both the Fall 2009 and Spring 2010 semesters are included for each component. Semester data consists of the following:
+ Average Hours per Week. This column presents the average hours per week that applicable rooms are scheduled. For example, the 16 rooms at the main campus that contain
0-20 seats collectively average 25 hours per week during the Fall 2009 semester. The target for values in this category is the SUNY target of 35.4 hours.
+ Average Utilization Rate. This column presents the average utilization rate across applicable rooms. Per the definition outlined above, the utilization rate is the ratio of the total number of hours a room is scheduled in a week over the SUNY target of 35.4 hours. The target for values in this category is 100 percent, which is equivalent to 35.4 hours.
+ Average Fill Rate. This column presents the average fill rate across applicable rooms. Per the definition outlined above, the fill rate is the ratio of the number of students in a course section over the number of seats available in the classroom the section is scheduled in. Figures in the chart represent an average of all applicable course section data. The target for values in this category is 80 percent, the SUNY fill rate target.
CLASSROOM UTILIZATION
Classrooms at Binghamton’s main campus nearly meet target utilization figures, with an average utilization rate of 90 percent and an average fill rate of just over 70 percent for the Fall 2009 semester.
Due to its location away from the main campus and more limited program offerings, classrooms at the University Downtown Center are not as well utilized, with average utilization and fill rates right around 60 percent.
The reduced utilization away from the main campus is important to note for the University’s future development. It can be expected that instructional space constructed away from the Brain area of the main campus in the future will experience utilization well below indicated targets.
3.3 Space Utilization

21
FIGURE 3.3.1B Summary of classroom utilization rate and fill rate data by section size, Fall 2009 and Spring 2010. (Average utilization based on ratio of room hours scheduled to target of 35.4 hours; average fill rate based on ratio of actual enrollment to available station count, averaged over all courses in the schedule.)
CLASSROOM UTILIZATION BY CLASSROOM SECTION SIZE
QTY OF ROOMS
AVG HRS/WK FA 2009
AVG UTILIZ FA 2009
AVG FILL FA 2009
AVG HRS/WK SP 2010
AVG UTILIZ SP 2010
AVG FILL SP 2010
Main Campus 115 31 90% 71% 27 75% 72%
0-20 seats 16 25 72% 70% 18 51% 70%
20-32 seats 41 32 89% 75% 28 78% 74%
32-48 seats 12 39 109% 73% 30 85% 77%
48-75 seats 23 37 106% 64% 29 81% 66%
75-125 seats 16 20 57% 71% 36 74% 70%
125+ seats 7 38 107% 71% 30 84% 76%
Downtown 11 21 58% 61% 20 56% 58%
0-20 seats N/A N/A N/A N/A N/A N/A N/A
20-32 seats 6 22 61% 54% 23 65% 51%
32-48 seats 1 15 42% 48% 9 25% 46%
48-75 seats 4 20 57% 75% 17 49% 75%
75-125 seats N/A N/A N/A N/A N/A N/A N/A
125+ seats N/A N/A N/A N/A N/A N/A N/A
COMPOSITE 126 30 86% 71% 26 74% 71%
Target N/A 35.4 100% 80% 35.4 100% 80%

22 3.3 SPACE UTILIZATION
FIGURE 3.3.1C Summary of classroom utilization rate and fill rate data by building, Fall 2009 and Spring 2010. (Average utilization based on ratio of room hours scheduled to target of 35.4 hours; average fill rate based on ratio of actual enrollment to available station count, averaged over all courses in the schedule.)
CLASSROOM UTILIZATION BY BUILDING NAME
QTY OF ROOMS
AVG HRS/WK FA 2009
AVG UTILIZ FA 2009
AVG FILL FA 2009
AVG HRS/WK SP 2010
AVG UTILIZ SP 2010
AVG FILL SP 2010
Main Campus 115 31 89% 71% 27 75% 72%
Academic A 5 33 93% 63% 28 78% 74%
Academic B 2 27 77% 76% 26 74% 73%
Appalachian Collegiate Center 2 36 102% 61% 0 0% 76%
Engineering Building 5 44 125% 67% 28 79% 67%
Fine Arts Building 20 36 101% 68% 32 91% 70%
Lecture Hall Center 12 42 117% 72% 34 96% 74%
Library North 8 22 63% 73% 19 53% 78%
Nelson A. Rockefeller Center 4 33 94% 77% 32 89% 75%
Science I 3 28 80% 73% 16 45% 72%
Science II 13 36 101% 75% 29 82% 75%
Science Library 7 35 99% 67% 28 80% 68%
Student Wing 22 29 81% 73% 23 64% 74%
Tuscarora Office Building 2 22 61% 81% 17 49% 80%
University Union 10 10 29% 66% 25 72% 63%
Downtown 11 20 58% 61% 20 56% 58%
University Downtown Center 11 20 58% 61% 20 56% 58%
COMPOSITE 126 30 87% 71% 26 74%
Target N/A 35.4 100% 80% 35.4 100% 80%

23
3.3.2 CLASS LAB UTILIZATION
Class labs represent about four percent of Binghamton University’s facilities inventory, and are the location of about 20 percent of all instruction. By nature, class labs are more resource intensive than classrooms, both in terms of construction and maintenance costs. Due to the magnitude of facilities needs and the associated resource investment of class labs, it is important to maximize their utilization.
CALCULATING UTILIZATION
Class lab utilization is calculated for PSI rooms coded in the 1300-series, as class lab (1300), specialized class lab (1301) individual study lab (1302), tutorial lab wet (1303), tutorial lab (1304), individual project lab (1306). Class lab utilization is calculated in a similar method as classroom utilization using the metrics of utilization rate and fill rate.
Utilization Rate. Utilization rate is a ratio of the total number of hours a classroom is scheduled per week over a target, which SUNY defines as 28.32 hours/week. Utilization rate is calculated for each class lab, with an ideal utilization rate near 100 percent (with 100 percent representing 28.32 hours).
Fill rate. Fill rate is a ratio of the number of students in a course section over the number of seats available in the class lab the section is scheduled in. SUNY defines a target fill rate of 80 percent. Fill rate is calculated for each course section, and may be averaged for each class lab to determine an average class lab fill rate.
In system-wide analysis, SUNY combines the utilization and fill rates to derive a weekly student contact hour (WSCH) goal. For class labs, SUNY defines the WSCH goal of 22.66 hours per station (the utilization rate of 28.32 multiplied by the fill rate of 0.80 = 22.66).
INVENTORY AND CALCULATION METHODOLOGY
The Fall 2009 PSI coded approximately 250 rooms in 1300-series space types. During the Fall 2009 semester, Binghamton University’s course schedule assigned class lab functions to 88 of those rooms. Of the total, ten are computer labs and the remaining are a range of labs required to support academic programming.
Additionally, activity courses for the Fall 2009 semester were scheduled in 26 rooms outside of 1300-series space types.
The following calculations for class lab utilization and fill rate include only data sets 1300-series spaces.
Calculations are presented on the following pages organized as averages by space type and by building. Total quantity of rooms and key data are included for each component for both the Fall 2009 and Spring 2010 semesters. Semesters data consists of the following:
+ Average Hours per Week. This column presents the average hours per week that applicable rooms are scheduled. The target for values in this category is the SUNY target of 28.32 hours.
+ Average Utilization Rate. This column presents the average utilization rate across applicable rooms. Per the definition outlined above, the utilization rate is the ratio of the total number of hours a room is scheduled in a week over the SUNY target of 28.32 hours. The target for values in this category is 100 percent, which is equivalent to 28.32 hours.
+ Average Fill Rate. This column presents the average fill rate across applicable rooms. Per the definition outlined above, the fill rate is the ratio of the number of students in a course section over the number of seats available in the classroom the section is scheduled in. Figures in the chart represent an average of all applicable course section data. The target for values in this category is 80 percent, the SUNY fill rate target.
CLASS LAB UTILIZATION
Unlike classrooms which may be shared by multiple users, class labs are often specialized facilities with less consistent utilization. Unique labs must be available in an institution’s inventory, even if to satisfy demand for only a single section. As a result of limited fungibility across academic departments, labs experience reduced overall demand for meeting utilization targets. Additionally, issues of curriculum design and faculty availability often place an uneven demand on class labs across the two academic calendar semesters.
Overall, Binghamton University experiences moderate utilization of class labs. Figures indicate that existing labs
FIGURE 3.3.2A SUNY Utilization Standards
SYSTEM ADJUSTED HOURS % USED WSCH /
STATION
SUNY 28.32 hours 80% 22.66
CUNY 24.00 hours 80% 19.20
California 27.5 hours 85% 23.38
Florida 24.00 hours 80% 19.20
are utilized to meet curriculum demands, and that many have excess capacity to support growth.
Labs functioning near capacity include the following:
+ Academic B: School of Nursing Learning Lab
+ Fine Arts Building: Art Studies Design Studio and Painting Studio; Theater Dance Studio
+ Bartle Library: General Use Computer Lab; Electrical and Computer Engineering General Instruction Labs
+ Science II: Chemistry General Lab and Organic Chemistry Labs
+ Sciences III: Anatomy and Physiology Lab; General Use Microcomputer Lab

24 3.3 SPACE UTILIZATION
CLASS LAB UTILIZATION BY SPACE TYPE
QTY OF ROOMS
AVG HRS/WK FA 2009
AVG UTILIZ FA 2009
AVG FILL FA 2009
AVG HRS/WK SP 2010
AVG UTILIZ SP 2010
AVG FILL SP 2010
Main Campus 87 15 52% 53% 15 52% 53%
1300: Class Lab 67 16 57% 58% 16 58% 59%
1301: Specialized Class Lab 7 1 4% 3% 4 4% 5%
1304: Tutorial Lab 11 19 67% 58% 14 48% 48%
1306: Individual Project Lab 2 0 0% 0% 6 22% 24%
Downtown 1 7 25% 30% 0 0% 0%
1300: Class Lab 1 7 25% 30% 0 0% 0%
COMPOSITE 88 15 52% 52% 14 51% 52%
Target N/A 28.3 100% 80% 28.3 100% 80%
FIGURE 3.3.2B Summary of class lab utilization rate and fill rate data by space type, Fall 2009 and Spring 2010. (Average utilization based on ratio of room hours scheduled to target of 28.3 hours; average fill rate based on ratio of actual enrollment to available station count, averaged over all courses in the schedule.)

25
FIGURE 3.3.2C Summary of class lab utilization rate and fill rate data by building, Fall 2009 and Spring 2010. (Average utilization based on ratio of room hours scheduled to target of 28.3 hours; average fill rate based on ratio of actual enrollment to available station count, averaged over all courses in the schedule.)
CLASS LAB UTILIZATION BY BUILDING NAME
QTY OF ROOMS
AVG HRS/WK FA 2009
AVG UTILIZ FA 2009
AVG FILL FA 2009
AVG HRS/WK SP 2010
AVG UTILIZ SP 2010
AVG FILL SP 2010
Main Campus 87 15 52% 53% 15 52% 53%
Academic A 3 23 82% 56% 21 73% 66%
Academic B 1 54 191% 95% 4 13% 6%
Biotechnology Building 2 11 40% 12% 0 0% 0%
Champlain Hall 1 5 16% 8% 3 11% 6%
Engineering Building 3 6 21% 41% 14 49% 35%
Fine Arts Building 26 14 51% 33% 14 50% 37%
Library North 9 15 54% 71% 18 63% 97%
Science I 9 8 29% 33% 12 44% 38%
Science II 18 20 69% 95% 19 68% 79%
Science III 12 12 43% 47% 12 43% 52%
Student Wing 3 12 42% 22% 10 34% 11%
Downtown 1 7 25% 30% 0 0% 0%
University Downtown Ctr 1 7 25% 30% 0 0% 0%
COMPOSITE 88 15 52% 52% 14 51% 52%
Target N/A 28.3 100% 80% 28.3 100% 80%

26 3.4 EXISTING SPACE
3.4.1 OVERVIEW OF EXISTING SPACE
The quantitative space needs assessment of the FMP is rooted in numerical calculations that reference Binghamton University’s Fall 2009 PSI. The inventory reports a total of 1.86 million assignable square feet, distributed across three main locations: the main campus in Vestal, the downtown campus, and other off campus locations. The chart below summarizes the 2009 inventory.
ADJUSTMENTS TO THE PSI
To ensure the validity and utility of FMP recommendations, analysis must reference an accurate PSI document. To this end, the space needs assessment for BU makes the following adjustments to the PSI:
+ Student Recreation. Student recreation facilities in the East Gym are re-coded from Student Faculty Activity recreation space to Health and Physical Education recreation space to more closely reflect the intent of the classification system. The Student Faculty Activity recreation category is intended for the type of recreation space that exists in the University Union, such as general purpose fitness rooms, billiards and game rooms, TV rooms, etc. The types of spaces present in the East Gym include gymnasia, basketball courts, indoor swimming pools, etc. These spaces correspond with Health and Physical Education recreation, which includes facilities for intercollegiate, intramural, physical education, and recreation.
+ Research Units. FMP analysis makes an adjustment to the PSI classification for research space. Binghamton University is unique within the SUNY University Centers in its reporting of research space. The original inventory bifurcates each academic department to separate out research space into a series of organized research units. This has the effect of double counting some departmental space allocations based on a given quantity of faculty, graduate, and post-doctoral units. To more closely align analysis of existing space with space assessment projections, research space that is core to departmental operation is allocated to the individual departments.
+ Departmental Storage. FMP analysis adjusts the classification of departmental storage space. Much of this space type is currently assigned to the general Building Services category, inflating totals. To more closely reflect the intent of the classification system, departmental storage for instruction, research, or administration is assigned to individual departments.
FIGURE 3.4.1A Existing Inventory by Location and Active or Inactive, Fall 2009 PSI
CAMPUS LOCATION 2009 ASF
Main Campus 1,751,455
Active Space 1,722,567
Inactive Space 28,888
Downtown 36,921
Active Space 36,921
Inactive Space 0
Off Campus 72,518
Active Space 60,853
Inactive Space 11,665
TOTAL 1,860,894
3.4 Existing Space

27
3.4.2 BENCHMARKING EXISTING SPACE
Benchmarking is a tool utilized to conduct overview evaluation of space from a quantitative standpoint. By evaluating Binghamton University against comparable or peer institutions, benchmarking offers a general indication of whether facilities are appropriate, inadequate, or overbuilt.
Benchmarking is reported as a ratio of total ASF per student average annual FTE (AAFTE). AAFTE enrollment figures are calculated by averaging FTE data for all academic terms of the regular academic year. The use of AAFTE across the system for purposes of benchmarking allow for more accurate comparison between campuses.
Binghamton University’s AAFTE for 2009 is 14,075, in contrast to the Fall 2009 semester FTE of 14,725. As a result, calculation of space per student FTE yields the figure of 133 with use of AAFTE.
It is important to note that as benchmarking analysis is derived from totals for square footage and FTE figures, it is a highly simplified form of analysis. Often it does not account for irregularities affecting an institution’s space inventory, such as the specialized facilities to support particular degree programs or the existence of multiple campuses, which necessitated duplication of core services. Additionally, this high level assessment does not drill down to nuances of the appropriateness of an institution’s inventory.
Benchmarking of existing space at Binghamton University is presented to the right. The University is evaluated against the University Centers and Comprehensive Colleges in the SUNY system. Data for the University Centers includes all reported inventory and has not been discounted for multiple campuses, specialized programming, or the presence of hospitals.
Total instructional ASF per student AAFTE at each University Center’s main campus is presented at the bottom of the adjacent chart. Calculations were derived by discounting all facilities located off of the main campus.
Facilities benchmarking reveals that Binghamton University is operating a level of ASF per AAFTE significantly less than other SUNY institutions, particularly among the University Centers.
ASF / AAFTE
Instructional ASF / AAFTE at Main Campus
Total ASF / AAFTE
Stony Brook
Buffalo
Binghamton
Albany
Purchase
Potsdam
Oswego
Oneonta
Geneseo
Fredonia
Cortland
Buffalo College
Brockport
Stony Brook
Buffalo
Binghamton
Albany
68
83
56
51
232
220
178
136
168
152
151
150
191
178
174
133
189
0 50 100 150 200 250
Average of 180 ASF/ AAFTE for University
Centers
FIGURE 3.4.2A Benchmarking of Existing Space, Fall 2009 PSI

28 3.4 EXISTING SPACE
3.4.3 2009 INVENTORY BY BUILDING
The chart to the right reports Binghamton University’s 2009 inventory based on building location. Building inventories are arranged and sub-total based on major functions.
BUILDING NAME 2009 ASF
Academic, Research, Library Buildings 1,237,583
Academic Complex Building A 44,866
Academic Complex Building B 34,793
Bartle Library 336,264
Clearview Hall 12,540
Engineering Building 86,158
Fine Arts Building & Anderson Center 162,186
Institute for Child Development 13,347
ITC Biotechnology Building 70,800
Lecture Hall Center / Student Wing 90,243
Outdoor Biology Research Facility 580
Science I 62,375
Science II 99,184
Science III 98,443
Science IV 40,974
Science Library 47,909
University Downtown Center 36,921
Administration Service Buildings 60,828
Computer Center 21,247
Couper Administration Building 37,926
McGuire Building 1,655
FIGURE 3.4.3A Existing Space by Building, Fall 2009 PSI

29
BUILDING NAME 2009 ASF
Campus Service Buildings 55,737
Central Heating Plant 280
Chem Rad Storage 1,361
Commissary 14,753
Garage 6,702
Information Booth 225
Paid Parking Booth 42
Parking Structure 133
Physical Facilities 10,169
Physical Facilities North 14,066
Warehouse 8,006
Off Campus Facilities 72,518
Art Factory 3,446
Commerce Road Building 29,239
Endicott Interconnect 258 10,510
Remote Library Stack Facility 29,323
TOTAL 2009 ASF 1,860,894
BUILDING NAME 2009 ASF
Student Activity and Service Buildings 191,422
Appalachian Center (Non-Food Service) 5,432
Childcare Building 8,740
Dickinson DH (Non-Food Service) 1,703
Emergency Vehicle Garage 1,081
Health Service 10,958
Hinman DH (Non-Food Service) 2,549
Iroquois Tuscarora (Non-Food Service) 8,595
Nelson A. Rockefeller Center 7,151
University Union 88,936
University Union West 56,277
Athletic, Recreation, HWS Buildings 242,806
East Gym 48,009
Event Center 100,869
Physical Education Storage Facility 504
Pollard Memorial 151
Public Restroom Facility 52
Track Press Box 168
West Gym 93,053

30 3.4 EXISTING SPACE
3.4.4 2009 INVENTORY BY FUNCTION
The chart to the right reports Binghamton University’s 2009 inventory according to function categories predetermined by the SUNY system.
FIGURE 3.4.4A Existing Space Use by Function, Fall 2009 PSI
FUNCTION CATEGORY 2009 ASF
Instructional Space 561,361
Classrooms & Computer Labs 111,667
Instructional Department Facilities 449,694
Support Space 1,258,980
Organized Activity Units 70,691
Organized Research Units 186,972
Public Service Units 16,959
Assembly And Exhibition 15,983
Electronic Data Processing 22,801
Health & Physical Education 229,757
Instructional Resources 14,750
Libraries 267,664
Student & Faculty Activities 125,765
Student Health Services 7,652
General Administration 145,714
Maintenance & Operations Central Services 84,930
Building Services 69,342
Other Space 40,553
Inactive Space 40,553
TOTAL ASF 1,860,894

31
3.4.5 INVENTORY CHANGE
The FMP plans for develoment at Binghamton University during the two capital funding periods 2013 to 2018 and 2018 to 2023. To accurately assess future space needs against the University’s existing array of spaces, changes to the inventory must be accounted for.
The 2009 PSI is impacted by several known projects prior to the intiation of the FMP planning period in 2013, including construction of Science V, construction of ITC Engineering & Science, construction of ITC Center of Excellence, and conversion of Johnson Hall from residential space to academic and support space.
As summarized in the adjacent diagram, these projects increase the University’s total ASF to 2.03 million by 2013.
FIGURE 3.4.5A Inventory Change through 2013
0
0.5
1.0
AS
F (i
n m
illio
ns)
YEAR
1.5
2.0
3.0
2.5
2023201820132009
2011 (1.96M ASF)ITC Engineering & Science: 64,750 ASFScience V (2.07M ASF): 30,850 ASF
2009 (1.86M ASF)
2013 (2.03M ASF)ITC Center of Excellence: 47,600 ASFJohnson Hall: 25,100 ASF

32 3.0 INTRODUCTION
3.5.1 OVERVIEW OF SPACE NEEDS
THE ROLE OF A SPACE NEEDS ASSESSMENT
Effective space planning models an institution’s facilities requirements with consideration for mission, programmatic direction, student enrollment projections, instructional staffing models, and current inventory distribution. Findings are summarized in a space needs assessment, which outlines the facilities that are required for an institution to its support existing and future population and program distribution. The assessment serves as an important tool for the institution and state funding agency to model, prioritize, and develop capital budgets for future facilities use.
The following section outlines the space needs assessment for Binghamton University in two parts, a SUNY assessment of overall need and an alternate assessment of overall need. The SUNY assessment calculates need based on the SUNY guidelines methodology, presented in section 3.2 Space Guidelines; the alternate assessment calculates need based on a modified set of parameters, outlined in the following section 3.5.2 Consultant Methodology.
The space needs assessment represents a snapshot of current and future departmental needs based on projections and the planning context at the time of its creation. It is intended to function as a modeling tool for to aid Binghamton University and the SUCF in its space planning and capital budgeting. The assessment is not intended to replace future detailed program studies or the programming phase associated with the capital projects identified in the FMP. Additionally, the numbers presented in the assessment do not represent SUCF-prescribed allocations.
The space needs assessment outlines existing facilities requirements given the University’s reported 2009 population and projected facilities requirements for the two capital funding cycles 2013 to 2018 and 2018 to 2023.
FACILITIES EFFICIENCY
At a macro-level, Binghamton University operates at a level
of assignable square footage per student FTE significantly less than other SUNY institutions, particularly among the University Centers. As reported in section 3.4.2 Benchmarking of Existing Space, in 2009 BU reported a total of 133 ASF per student AAFTE campus-wide, compared with an average of 180 ASF per FTE among the other three University Centers. This indicates that BU functions at a highly efficient level, occupying approximately 25 percent less space per student FTE than its system peers.
Further analysis demonstrates that Binghamton University functions at a greater degree of facilities efficiency during the Fall semester, the academic term with the greatest demand. During Fall 2009, the University operated at a composite figure of 126 ASF per student FTE. The main campus in Vestal is the location of nearly 95 percent of total facilities, and operates at 123 ASF per student FTE. Due to limited academic programming, the University’s secondary location at the University Downtown Center operates at 69 ASF per student FTE.
MAGNITUDE OF SPACE NEEDS AT BU
Binghamton University faces a significant magnitude of need through the planning period. The SUNY assessment indicates a campus-wide need of 2.1 million ASF in 2013 and 2.6 million ASF in 2023. The alternate assessment indicates a more substantive need of 2.3 million ASF in 2013 and 2.9 million ASF in 2023.
ORGANIZATION OF THE PROJECTIONS
Academic versus Support Space. A facilities inventory for an institution of higher education is comprised of two main components: academic space and support space. Academic space includes all classrooms and labs where instruction occurs, departmental office facilities, and research facilities. Support space includes shared auxiliary facilities required on a campus to support the daily lives of the campus community, such as libraries, student and faculty activity space, student services, administrative services, athletic and recreation space, campus services, and building services.
Binghamton University’s 2009 inventory reports a ratio of
38 percent academic space to 62 percent support space, an expected proportion for a residential university of its size and type.
The space needs assessment projects this ratio to shift toward the academic side for 45 percent academic space and 55 percent support space. As the University’s population grows, a more linear increase in academic space will be required to support the campus population. Assuming the continued concentration of programming at the main campus, efficiency will be gained on the support space side.
Planning Horizons. Due to the magnitude of enrollment growth and associated space needs, it is important for the FMP to prioritize overall need when sequencing the capital projects in Phases 4 and 5. This will ensure that the correct types of facilities are provided early in the plan, facilities growth in University-identified strategic programs and catalyzing future cycles of renovation.
To aid in prioritization, space needs are separated into two planning horizons: a near-term Building Capacity Period followed by a long-term Sustained Growth Period.
The Building Capacity Period address space needs associated with growth through 2018. The period achieves the two-fold purpose of redressing existing facilities capacity and condition issues while also aligning overall facilities provision with the University’s revised academic and strategic mission.
The Sustained Growth Period builds on the foundation of the Building Capacity Period, achieving additional facilities capacity to support additional enrollment growth through 2023.
3.5 Space Needs

33
0
0.5M
1.0MAS
F (i
n m
illio
ns)
YEAR
1.5M
2.0M
3.0M
2.5M
2023201820132009
Building Capacity Period
Building CapacityPeriod Space Needs
Sustained Growth PeriodSpace Needs
Sustained Growth Period
Alternate Assessment
SUNY Assessment
Facilities Inventory
FIGURE 3.5.1A Summary of Inventory and Space Needs through 2023

34 3.5 SPACE NEEDS
3.5.2 CONSULTANT METHODOLOGY
SUNY ASSESSMENT OF OVERALL NEEDThe SUNY assessment of overall need calculates space needs for Binghamton University based on the SUNY guideline methodology, outlined in section 3.2.1. This methodology uses a combination of space factors, FTE-based models, and equivalency factors. Space needs are reported in section 3.5.3 SUNY Assessment of Overall Need.
ALTERNATE ASSESSMENT OF OVERALL NEEDThe alternate assessment of overall need calculates space needs for Binghamton University based on a modified set of parameters, addressing the shortcomings of the SUNY guidelines reported in section 3.2.2. This section presents consultant methodology in deriving the alternate assessment of overall need. Space needs are reported in section 3.5.4 Alternate Assessment of Overall Need.
The alternate assessment identifies and develops the University’s space program around information from the following sources:
+ Current and projected student and faculty FTEs. In accordance with the future 2013-23 Capital Plans, the space analysis projects a need to 2023.
+ Physical Space Inventory. The Physical Space Inventory (PSI), as maintained by the University, shows total net square feet of building area, including all assignable space plus non-assignable circulation and mechanical space. The numbers generated from the inventory are grouped together by various categories including function and department, and are utilized in determining the amount of space required by a campus to support its mission and particular programs. It is important to note that throughout the FMP process, the University’s inventory continues to undergo revisions and updating. The FMP reports two stages of Binghamton University’s inventory: the 2009 reported by SUNY and an updated inventory that reflects new construction and major building modifications that are in the queue and will be online prior to the planning period.
+ Utilization figures. The assessment incorporates data sets derived from utilization analysis as outlined in section 3.3 of this report: Space Utilization. Utilization analysis contributes to recommendations for additional room units given WSCH allocation.
+ SUNY space guidelines. SUNY space guidelines provide a top-down allocation of space by institution level. However, the FMP consultant notes that applying top-down guidelines do not always accurately represent need and may be problematic depending on issues unique to particular campuses. Even with areas of inadequacy, the SUNY model does remain fairly accurate in identifying the total aggregate space requirements for Binghamton University. Refinements that disaggregate space totals into smaller elements are necessitated primarily to allow for planning subtleties in the Phase 4 and Phase 5 concept alternatives. The alternate assessment of need is provided for Binghamton University’s FMP to report such refinements and adjustments to the University’s total space need.
+ Leadership Meetings and Interviews. Development of the University’s programmatic concepts began with a series of detailed discussions and group interviews conducted by the consultants. The consulting team met with several academic and nonacademic user groups, including the President, senior staff administrators, faculty chairs, support and auxiliary departments, and other representatives to solicit ideas and recommendations regarding current physical conditions and future programmatic goals. During the course of the interviews, a number of topics were presented to encourage the groups to uncover and discuss specific needs or intended changes in programs that could affect future space requirements. Among these topics were campus mission and image, student/faculty services and amenities, special programs, programmatic initiatives, building maintenance and upkeep, technology, library services, athletics and recreation, teaching environments and site and land use.
+ Consideration of unique characteristics. Unique characteristics also have an impact on the types of facilities that a University provides to its students. Binghamton University has a rich history in the liberal arts, coupled with programmatic excellence in engineering and professional programs. As a University Center in the SUNY system, it is poised as a leader in higher education
within the state of New York. Through extensive study of state and regional issues, as well as interview with a wide range of University constituents, characteristics unique to Binghamton University have been accounted for both quantitatively in the alternate assessment of need. Where such characteristics do not impact quantitative space projections, they have been considered in the FMP’s qualitative assessment of need, outlined in section 3.5.7.
ACADEMIC SPACE
The alternate assessment approaches space needs for academic space, including general classrooms and computer labs and space for academic schools divisions, in a fundamentally different manner than the SUNY guidelines. In response to the shortcomings of the guidelines outlined in section 3.2.2 Shortcomings of the Guidelines, the alternate assessment provides a higher degree of specificity on the academic side for the most accurate portrayal of space needs and to facilitate a deeper level of analysis in the later-stages of project development.
General Classrooms and Computer Labs
This category includes credit-bearing teaching space in the form of (1) lecture halls, classrooms, seminar rooms, and classroom support; and (2) instructional computer labs.
Classrooms and Lecture Halls. Total classroom and lecture hall space need is principally based on evaluation of weekly student contact hours (WSCH). Total need is calculated using the following formula: Classroom Space Need = Total WSCH x Average Station Size / Station Usage Goal.
+ Total WSCH. The total WSCH is reported based on the Banner system at Binghamton University, using specifically identified PSI rooms. PSI rooms include those coded as classrooms (space type 1001) and lecture halls (space type 1100).
+ Average Station Size. SUNY assumes an average station size standard of 16 ASF per station. This figure reflects the provision of standard lecture hall-style instruction, which is only one component of contemporary pedagogy. The alternate assessment of need recommends that the University build an inventory of high-quality classroom facilities that reflects a diversity of pedagogical styles including lecture, small section discussion, project-based

35
learning, etc. To reflect this range of learning environments, the alternate assessment employs an average station size figure of 24 ASF per station.
+ Station Usage Goal. The alternate assessment employs the SUNY classroom station usage goal of 28.32 student contact hours per station per week.
As a result of the increase in average station size, the alternate assessment calls for more classroom and lecture hall space compared with the SUNY assessment.
Instructional Computer Labs. The methodology used to calculate instructional computer lab need is similar to that the classrooms space, using the formula of Lab Space Need = Total WSCH x Average Station Size / Station Usage Goal, with a variation in the factors.
+ The total WSCH is reported based on the Banner system at Binghamton University, using specifically identified PSI rooms.
+ Average Station Size. Station size requirements for instructional computer labs are larger than for general purpose classrooms. The alternate assessment provides 38 ASF per station for instructional computer labs.
+ Station Usage Goal. The alternate assessment utilizes the SUNY class lab station usage goal of 22.66 student contact hours per station per week.
Academic Schools and Divisions
The alternate assessment determines departmental space needs for academic schools and divisions based on program majors, departmental student FTEs, departmental WSCH, and instructional staffing models. This category includes space needs for (1) departmental spaces, (2) instructional laboratories, (3) research facilities, and (4) special use facilities.
+ Program Majors. The number of majors a department supports impacts facilities requirements for classroom, class lab, research, and departmental space. Majors are considered by academic status as undergraduate, graduate, or doctorate. Program major projections are derived from the University enrollment projections.
+ Departmental Student FTEs. Departmental student FTEs
serve as an indication of the daily workload of faculty members. The figure includes both FTEs from program majors as well as those from courses delivered to the general University population. Departmental FTEs inform the total departmental WSCHs. Student FTE projections are derived from the University enrollment projections.
+ Departmental WSCH. Departmental WSCH data is derived from the University’s Fall 2009 course schedule, which represents peak load for the University. Like departmental student FTEs, figures includes both hours from program majors as well as those from courses delivered to the general University population. WSCHs are calculated using Binghamton University’s methodology, which equates one credit-hour to 60 minutes.
WSCH are coded with a location, to indicate whether instruction occurs in a general classrooms or a class lab. Given the total WSCH associated with a particular space type, the space needs required for a department to deliver instruction may be determined.
Future departmental WSCHs are projected based on existing data coupled with the University’s student FTE projections.
+ Instructional Staffing Models. The instructional staffing model outlines required full-time faculty, part-time faculty, adjunct faculty, teaching assistants and doctoral students, and supporting staff members required for a department to deliver instruction. Full-time faculty includes all full-time tenure-track, visiting faculty, and full-time lecturers. The instructional staffing model informs the quantity of departmental space and research space a department requires.
The alternate assessment assumes a metric of 70 percent of total required faculty FTEs to be provided as full-time. This metric is employed throughout the assessment, except in instances where a unique factor was provided by the University.
Projections for the academic schools and divisions consider four main categories of space:
Departmental Space. Departmental space includes all departmental offices for the chair, full-time faculty, part-time faculty, adjunct faculty, teaching assistants and doctoral students, and administrative support staff. The category also
includes supporting spaces such as workrooms, conference rooms, storage, and waiting rooms.
The alternate assessment utilizes a space factor of 180 ASF for departmental chairs offices and full-time faculty offices. This factor consists of a space standard of 120 ASF per office, plus an allowance of additional space for shared facilities. Space factors for part-time faculty, adjunct faculty, teaching assistants and doctoral students are tailored to each academic schools’ unique application.
Each department is provided with a quantity and size of conference facilities to support their functions. For smaller departments, a single conference room to accommodate the entire faculty is provided. For larger departments, conference space is not provided to accommodate the entire department in a single room, rather multiple rooms are provided, with emphasis on supporting key committees and groups.
The alternate assessment envisions a model of space planning that provides identity for each department within the context of each building and the larger campus. Departments are conceived of as having a “front door” that is recognizable to the campus community, and including distributed student study and informal meeting space. Departmental facilities are sized to quantitatively account for such spaces.
Class Laboratory Space. Class lab space includes all instructional labs required for a given department to meet its curriculum delivery needs. Computer labs and support labs are included in this category.
Class lab quantity and section size are informed by WSCHs. In cases where the total WSCHs call for fractions of labs, the total quantity is rounded up.
Research Space. Research space includes all non-instructional facilities employed by faculty members and students to support research initiatives. Research space is derived as a factor of the participating faculty and/or graduate and undergraduate student population participating in research. The number of faculty participating in research is determined by referencing the distribution of faculty lines.
Special Use Space. Special use space includes all other unique spaces a department may require to meet its curriculum requirements that are not accounted for in the above categories.

36 3.5 SPACE NEEDS
SUPPORT SPACE
The alternate assessment’s space calculations for support functions are more consistent with SUNY guidelines. As outlined in section 3.2.2 Shortcomings of the Guidelines, the alternate assessment identifies and corrects problematic areas in the guidelines for key categories.
This section outlines support space categories and their component departments, describes the SUNY guideline methodology for space needs calculation, and describes the alternate assessment methodology for space needs calculation, indicating if and how it diverges from the SUNY methodology.
Centers, Institutes, and Grant Funded Programs
Centers, institutes and grant funded programs include all facilities designated to such functions that are not designated as core research facilities within associated departments.
The SUNY guidelines account for centers, institutes, and grant funded programs within the organized activity and research categories. The original intent of these categories were to account for functions within an institution that have uses and identity independent of the academic departments and require facilities. The guidelines allocate space for these categories as an equivalent to existing space.
For the FMP analysis, the alternate assessment makes an adjustment to the original PSIs classification of research space. Binghamton University is unique within the SUNY University Centers in its reporting of research space. The inventory bifurcates each academic department to separate out research space into a series of organized research units. This has the effect of double counting some departmental space allocations based on a given quantity of faculty, graduate, and post-doctoral units. To more closely align analysis of existing space with space assessment projections, research space that is core to departmental operation is allocated to the individual departments.
The alternate assessment sizes space needs for centers, institutes, and grant funded programs based on the units remaining in the category following the above reallocation. The assessment allocates 3 ASF per FTE for the functions combined.
Academic Support
Academic support space consists of specialized functions that support student academics, but are not accounted for within departments or other support categories. For BU this includes the Writing Center and associated Writing Initiative program.
The academic support category is not discretely carried in the SUNY guidelines. The closest category is instructional resources, which includes both analog as well as technology-based initiatives that support academic functions.
The alternate assessment re-allocates a number of the functions in instructional resources to more closely represent the contemporary institution. Technological support, such as for distance learning, is accounted for in the information technology category. As a result, the academic space category is significantly reduced in its scope.
Space needs for academic support functions are sized based on the individual component departments, the Writing Center and Writing Initiative. The alternate assessment calls for an initial increase in space allowance to provide distinct identity for these programs better align facilities provision with the University’s strategic goals, for an allocation of 0.25 ASF per FTE. Due to efficiencies gained with overall growth, academic support space needs do not increase linearly with FTE and the allocation reduces to 0.15 ASF per FTE through the planning period.
Information Technology
Information technology space consists of the University’s Information Technology Services (ITS) department and its supporting functions as well as technological support functions for distance learning initiatives, such as EngiNet as a part of the Watson School of Engineering, and Educational Communications.
The SUNY guidelines account for information technology space in the data processing and instructional resources categories. Data processing includes core functions of computer services, such as those in BU’s ITS department. The guidelines calculate space needs in both categories using a specified space allocation given the student population. BU’s allowance for data processing is 35,700 ASF and for instructional resources is 29,002 ASF given its current population. These allowances increase to 49,080 ASF and 32,572 ASF respectively when
enrollment exceeds 20,001 FTEs.
The alternate assessment makes corrections in space allocation for data processing based on contemporary shifts and efficiencies gained in data processing equipment and operations, and complements data processing with instructional resource functions. To most accurately model needs, the assessment allocates 3.25 ASF per FTE in the near-term. Due to efficiencies gained with overall growth, space needs do not increase linearly with FTE and the allocation reduces to 2.5 ASF per FTE through the planning period.
Libraries
Library space includes collection space, seating space, and administrative offices and supporting facilities.
The SUNY guidelines determine space needs for libraries as a sum of three factors: a space per volume calculation, a seating space calculation of 5.32 ASF per student FTE, and an administrative calculation of 0.25 x (seating + volume space). The guidelines size a library based on the assumption of its serving as a repository for books, supported by a robust administrative staff.
The alternate assessment makes corrections in space allocation based on the contemporary role of the library as an intellectual hub for information access through a variety of means, rather than a repository for collections. The result is a net reduction in space needs driven by technological advances and resource limitations, as well as a fundamental shift in the distribution of space.
Athletics, Recreation, Health & Wellness Studies
Athletics, recreation, and health & wellness studies includes all spaces used by members of the campus community for athletic or physical activity functions, such as gymnasia, basketball courts, racquetball courts, indoor swimming pools, aerobic rooms, and supporting facilities. The category also includes indoor spectator seating for such facilities. The category does not include office space for health & wellness studies, which is an academic unit within Harpur College and is reported under Harpur non-divisional programs.
The SUNY guidelines calculate space needs for this category using a specified space allocation given student population. BU’s allowance for the physical education category is 186,000

37
ASF given its current population. This allowances increases to 282,000 ASF when enrollment exceeds 20,001 FTEs.
For the FMP analysis, the alternate assessment reallocates 89,700 ASF of space from the student activities category to the athletics, recreation, HWS category. For details refer to section 3.4.1 Overview of Existing Space. This results in a total of 229,800 ASF in the category, exceeding the SUNY allowance of 186,000 ASF.
The alternate assessment calls for the total quantity of space for athletics, recreation, and HWS to remain constant at its current level until the University’s population exceeds 20,001 FTEs. At that time, it calls for an increase to 282,000 ASF, per the SUNY guidelines.*
Assembly & Exhibition
Assembly and exhibition space includes formal assembly facilities such as theaters as well as exhibition facilities such as museums and galleries.
The SUNY guidelines calculate space needs for this category using a specified space allocation given student population. BU’s allowance for assembly and exhibition is 61,450 ASF given its current population. This allowances increases to 84,120 ASF when enrollment exceeds 20,001 FTEs.
The alternate assessment employs the SUNY allocation indicated above.
Student Activity
Student activity space includes functions that support student and faculty life on campus, such as designated lounge space, game rooms, student organizations, food service offers, etc.
The SUNY guidelines calculate space needs for student activity space using a space factor of 10.5 ASF per FTE for University Centers. The alternate assessment employs the SUNY factor.
Child Care Center
Child care center space includes facilities designated to the University’s worksite Campus Pre-School and Early Childhood Center.
The SUNY guidelines account for this space type with the student and faculty activities category. However, at the time
the guidelines were created, child care functions at institutions were provided at a much more modest level than today.
To account for such changes, the alternate assessment pulls out the child care center as a distinct space category. The assessment calls for an initial increase in space allowance to right-size the facility, for an allocation of 0.75 ASF per FTE. Due to efficiencies gained with overall growth, space needs do not increase linearly with FTE and the allocation reduces to 0.50 ASF per FTE through the planning period.
Student Services and Administration
Student services include those administrative functions that support student life on campus, such as admissions, financial aid, registrar, tutoring services and advising, as well as unique academic distinction programs.
Administration includes all administrative support services that facilitate the operations of a university, consisting primarily of offices, workstations, and office support areas such as conference rooms, work rooms, etc.
The SUNY guidelines account for student service and administration space within the general administration category. The guidelines allocate a total of 8 ASF per FTE for the composite of administrative units.
The assessment increase the space provision for student service and administrative units as the guidelines do not providing a robust enough space allocation to accommodate the full range of office and support functions that contemporary institutions require. As a result, the alternate assessment employs a modified composite figure of 10.5 ASF per FTE based on BU’s current population. Due to efficiencies gained with overall growth, space needs do not increase linearly with FTE and the allocation returns to 8 ASF per FTE through the planning period.
In its reporting, the alternate assessment separates student services and administration to allow for closer accounting of space needs between the two functions.
Campus Services
Campus services space includes all “back of house” campus support spaces such as physical facilities operations (storage space, shops, and administrative space) and campus police
and safety functions.
The SUNY guidelines calculate space needs for campus services as 4 percent of the sum of other facilities categories (excluding campus services and building services).
The alternate assessment finds this allocation insufficient for contemporary institutions to support the full range of required buildings and grounds operation functions. A specific shortcoming is the provision of facilities for equipment and vehicle storage and maintenance, a particularly area of concern with electric and alternative fuel vehicles. As such, the alternate assessment employs a figure of 6 percent of the sum of other facilities categories.
Building Services
Building services space includes all local custodial and storage facilities located within buildings across campus.
The SUNY guidelines calculate space needs for building services as 3 percent of the sum of all other facilities categories (excluding building services). The alternate assessment employs the SUNY methodology.
*Due to unique programming at Binghamton University in the Division I Varsity Athletics, Campus Recreation, and Health & Wellness Studies, the qualitative assessment returned findings to indicate that the existing provision of space for this category is insufficient to support existing program. Refer to section 3.5.7 Qualitative Assessment for details. Concept alternatives and the final recommendation will consider both the space needs and qualitative assessments.

38 3.5 SPACE NEEDS
3.5.3 SUNY ASSESSMENT OF OVERALL NEED
The adjacent table represents the SUNY assessment of overall need for existing and future space needs at Binghamton University. The table is broken down into the relevant SUNY space categories on the instructional and support side. The columns represent the overall space need of the University at key points in the FMP planning period through 2023, including:
+ 2009 Existing. The University’s existing inventory as reported in the Fall of 2009.
+ Updated Inventory. The University’s inventory updated with projects in the queue through 2013.
+ 2009 Need. The calculated total quantity of space required to support the 2009 population of students, faculty and staff.
+ 2013 Need. The future space needs required to support the projected student, faculty and staff population in 2013.
+ 2018 Need. The future space needs required to support the projected student, faculty and staff population in 2018.
+ 2018 Deficit. The difference between 2013 Updated and 2018 Need.
+ 2023 Need. The future space needs required to support the projected student, faculty and staff population in 2023.
+ 2023 Deficit. The difference between 2013 Updated and 2023 Need.
The SUNY assessment of overall need indicates a near-term increase in the ASF per student FTE, followed by a decrease given full 2023 enrollment growth. This decrease occurs as a result of the type of student majors represented in the enrollment growth projections and efficiencies gained on the support space side.
Note: The difference between the 2009 Existing ASF of 1,821,397 and the total available ASF of 1,860,894 as indicated in section 3.3 Existing Conditions is the space tagged as inactive in the PSI. Inactive space is not allocated against a department in either space needs assessment.
FIGURE 3.5.3A SUNY Assessment of Overall Need, Total Institution
TOTAL INSTITUTION 2009 EXIST
2013 UPDATED
2009 NEED
2013 PROJ
2018 PROJ
2018 DEFICIT
2023 PROJ
2023 DEFICIT
Instructional Space 562,592 595,087 665,004 681,586 716,040 -120,953 847,750 -252,663
Classrooms & Computer Labs 111,667 111,667 97,105 109,139 125,009 -13,342 148,544 -36,877
Instructional Dept Facilities 450,925 483,420 567,899 572,447 591,031 -107,611 699,206 -215,786
Instructional ASF per FTE 38 40 45 43 37 37
Support Space 1,259,245 1,292,657 1,445,363 1,465,786 1,563,134 -270,477 1,798,530 -505,873
Organized Activity Units 70,691 70,691 70,691 70,691 70,691 0 70,691 0
Organized Research Units 189,087 216,975 216,975 216,975 216,975 0 216,975 0
Public Service Units 16,959 16,959 16,959 16,959 16,959 0 16,959 0
Assembly And Exhibition 15,983 15,983 61,450 61,450 61,450 -45,467 84,120 -68,137
Electronic Data Processing 22,801 21,997 35,700 35,700 35,700 -13,703 49,080 -27,083
Health & Physical Education 229,757 229,757 186,000 186,000 186,000 43,757 282,000 -52,243
Instructional Resources 14,750 14,750 29,002 29,002 29,002 -14,252 32,572 -17,822
Libraries 267,664 267,664 397,625 391,482 421,148 -153,484 433,440 -165,776
Student & Faculty Activities 123,765 123,515 154,613 168,294 201,737 -78,222 238,676 -115,161
Student Health Services 7,652 7,652 18,278 18,278 18,278 -10,626 16,278 -8,626
General Administration 146,373 148,103 117,800 128,224 153,704 -5,601 181,848 -33,745
M&O Central Services 84,930 85,651 78,804 80,186 85,107 544 98,816 -13,165
Building Services 68,833 72,960 61,467 62,545 66,384 6,576 77,076 -4,116
Support ASF per FTE 86 88 98 91 81 79
TOTAL ASF 1,821,837 1,887,744 2,110,367 2,147,371 2,279,174 -391,430 2,646,280 -758,536
Student FTE 14,725 14,725 14,725 16,028 19,213 22,731
ASF per Student FTE 124 128 143 134 119 - 116 -
Building Capacity Period Sustained Growth Period

39
3.5.4 ALTERNATE ASSESSMENT OF OVERALL NEED
The adjacent table represents the alternate assessment of overall need for existing and future space needs at Binghamton University. The table is broken down into alternate assessment categories for instructional and support spaces. The columns represent the overall space need of the University at key points in the FMP planning period through 2023, similarly as with the SUNY assessment.
The alternate assessment of overall need indicates a near-term increase in the ASF per student FTE, followed by a decrease given full 2023 enrollment growth. Like the SUNY assessment, this decrease occurs as a result of the type of student majors represented in the enrollment growth projections and efficiencies gained on the support space side. However, the alternate assessment’s ASF per student FTE figure does not decrease as significantly in the out-year.
Note: The difference between the 2009 Existing ASF of 1,862,390 and the total available ASF of 1,860,894 as indicated in section 3.3 Existing Conditions is the space tagged as inactive in the PSI. Inactive space is not allocated against a department in either space needs assessment.
TOTAL INSTITUTION 2009 EXIST
2013 UPDATED
2009 NEED
2013 PROJ
2018 PROJ
2018 DEFICIT
2023 PROJ
2023 DEFICIT
Academic Space 703,536 736,031 901,961 997,574 1,174,378 -438,347 1,312,088 -576,057
Classrooms & Computer Labs 124,041 124,041 152,537 165,419 197,054 -63,037 231,452 -107,411
Schools and Departments 579,495 611,990 749,424 832,155 977,324 -375,310 1,080,636 -468,646
Academic ASF per FTE 48 50 61 62 61 58
Support Space 1,118,301 1,151,713 1,217,612 1,262,129 1,416,457 -264,744 1,575,020 -423,307
Grant Funded Programs 7,990 7,990 9,988 11,486 13,208 -5,218 15,190 -7,200
Centers & Institutes 25,813 53,701 34,574 39,308 50,152 3,549 56,413 -2,712
Academic Support 1,099 1,099 3,268 3,268 9,668 -8,569 9,668 -8,569
Information Technology 38,034 37,230 46,812 48,431 50,107 -12,877 51,841 -14,611
Library 301,559 301,559 282,603 289,103 344,396 -42,837 376,420 -74,861
Athletics, Recreation, HWS* 229,757 229,757 229,757 229,757 229,757 0 280,000 -50,243
Assembly & Exhibition 51,846 51,846 67,159 67,159 77,409 -25,563 77,409 -25,563
Student Activity 124,261 124,011 149,507 162,439 194,451 -70,440 229,870 -105,859
Child Care Center 8,605 8,605 10,856 10,856 10,856 -2,251 10,856 -2,251
Student Health Center 7,756 7,756 7,979 7,979 7,979 -223 7,979 -223
Student Services 42,743 43,193 54,306 56,064 61,483 -18,290 63,365 -20,172
Administrative Services 120,912 122,349 134,793 138,773 147,712 -25,363 152,017 -29,668
Campus Services 118,007 118,728 125,284 132,798 146,084 -27,356 162,236 -43,508
Building Services 39,334 44,231 61,068 65,050 73,537 -29,306 82,098 -37,867
Support ASF per FTE 76 78 83 79 74 - 69 -
TOTAL ASF 1,821,837 1,887,744 2,119,573 2,259,703 2,590,835 -703,091 2,887,108 -999,364
Student FTE 14,725 14,725 14,725 16,028 19,213 - 22,731 -
ASF per Student FTE 124 128 144 141 135 127
Building Capacity Period Sustained Growth Period
FIGURE 3.5.4A Alternate Assessment of Need, Total Institution
*Due to unique programming at Binghamton University in the Division I Varsity Athletics, Campus Recreation, and Health & Wellness Studies, the qualitative assessment returned findings to indicate that the existing provision of space for this category is insufficient to support existing program. Refer to section 3.5.7 Qualitative Assessment for details. Concept alternatives and the final recommendation will consider both the space needs and qualitative assessments.

40 3.5 SPACE NEEDS
MAIN CAMPUS 2009 EXIST
2013 UPDATED
2009 NEED
2013 PROJ
2018 PROJ
2018 DEFICIT
2023 PROJ
2023 DEFICIT
Academic Space 684,357 717,009 884,896 977,096 1,103,993 -386,984 1,239,351 -522,342
Classrooms & Computer Labs 114,489 114,489 147,771 160,171 181,830 -67,341 215,173 -100,684
Schools and Departments 569,868 602,520 737,125 816,925 922,163 -319,643 1,024,178 -421,658
Academic ASF per FTE 48 51 62 63 62 - 58 -
Support Space 1,028,041 1,061,453 1,127,352 1,171,869 1,253,972 -110,416 1,412,535 -351,082
Grant Funded Programs 7,990 7,990 9,988 11,486 13,208 -5,218 15,190 -7,200
Centers & Institutes 22,799 50,687 31,560 36,294 41,738 8,949 47,999 2,688
Academic Support 1,099 1,099 3,268 3,268 3,268 -2,169 3,268 -2,169
Information Technology 37,479 36,675 46,257 47,876 49,552 -12,877 51,286 -14,611
Library 271,565 271,565 252,609 259,109 282,827 -11,262 314,851 -43,286
Athletics, Recreation, HWS 229,757 229,757 229,757 229,757 229,757 0 280,000 -50,243
Assembly & Exhibition 51,846 51,846 67,159 67,159 67,159 -15,313 67,159 -15,313
Student Activity 123,765 123,515 149,011 161,943 187,955 -64,440 223,374 -99,859
Child Care Center 8,605 8,605 10,856 10,856 10,856 -2,251 10,856 -2,251
Student Health Center 7,756 7,756 7,979 7,979 7,979 -223 7,979 -223
Student Services 38,650 39,100 50,213 51,971 53,790 -14,690 55,672 -16,572
Administrative Services 85,774 87,054 99,498 103,478 107,617 -20,563 111,922 -24,868
Campus Services 103,309 104,030 110,586 118,100 129,586 -25,556 145,738 -41,708
Building Services 37,647 41,774 58,611 62,593 68,680 -26,906 77,241 -35,467
Support ASF per FTE 72 75 79 76 70 - 66 -
TOTAL ASF 1,712,398 1,778,462 2,012,248 2,148,965 2,357,965 -579,503 2,651,886 -873,424
Student FTE 121 125 142 139 132 - 125 -
ASF per Student FTE 14,191.52 14,191.52 14,191.52 15,423.13 17,900.46 - 21,273.68 -
FIGURE 3.5.4B Alternate Assessment of Need, Main Campus, Student FTE determined for the main campus based on the location of student contact hours.
Building Capacity Period Sustained Growth Period
MAIN CAMPUS
The adjacent table represents the alternate assessment of overall need for Binghamton University’s main campus in Vestal. The main campus includes both the area in and around the Brain, as well as the ITC Campus.

41
DOWNTOWN CAMPUS 2009 EXIST
2013 UPDATED
2009 NEED
2013 PROJ
2018 PROJ
2018 DEFICIT
2023 PROJ
2023 DEFICIT
Academic Space 19,179 19,179 17,065 20,478 24,327 -4,303 26,679 -7,657
Classrooms & Computer Labs 9,552 9,552 4,766 5,248 6,250 4,304 7,305 2,247
Schools and Departments 9,627 9,627 12,299 15,230 18,077 -8,607 19,374 -9,904
Academic ASF per FTE 32 32 32 34 33 - 30 -
Support Space 17,742 17,742 17,742 17,742 17,742 0 17,742 0
Grant Funded Programs 0 0 0 0 0 0 0 0
Centers & Institutes 0 0 0 0 0 0 0 0
Academic Support 0 0 0 0 0 0 0 0
Information Technology 555 555 555 555 555 0 555 0
Library 671 671 671 671 671 0 671 0
Athletics, Recreation, HWS 0 0 0 0 0 0 0 0
Assembly & Exhibition 0 0 0 0 0 0 0 0
Student Activity 496 496 496 496 496 0 496 0
Child Care Center 0 0 0 0 0 0 0 0
Student Health Center 0 0 0 0 0 0 0 0
Student Services 4,093 4,093 4,093 4,093 4,093 0 4,093 0
Administrative Services 10,325 10,325 10,325 10,325 10,325 0 10,325 0
Campus Services 162 162 162 162 162 0 162 0
Building Services 1,440 1,440 1,440 1,440 1,440 0 1,440 0
Support ASF per FTE 33 33 33 29 24 20
TOTAL ASF 36,921 36,921 34,807 38,220 42,069 -4,303 44,421 -7,500
Student FTE 69 69 65 63 57 50
ASF per Student FTE 533.57 533.57 533.57 604.67 742.34 - 887.61 -
FIGURE 3.5.4C Alternate Assessment of Need, Downtown Campus, Student FTE determined for the downtown campus based on the location of student contact hours.
Building Capacity Period Sustained Growth Period
DOWNTOWN CAMPUS
The adjacent table represents the alternate assessment of overall need for Binghamton University’s downtown campus in Binghamton at the University Downtown Center.

42 3.5 SPACE NEEDS
SCHOOL OF LAW PROJECTED NEED
Academic Space 46,058
Classrooms & Computer Labs 8,974
Schools and Departments 37,084
Academic ASF per FTE 65
Support Space 73,425
Grant Funded Programs 0
Centers & Institutes 5,400
Law Clinic 6,400
Academic Support 1,200
Information Technology 0
Library 31,575
Athletics, Recreation, HWS 0
Assembly & Exhibition 10,250
Student Activity 6,000
Child Care Center 0
Student Health Center 0
Student Services 3,600
Administrative Services 4,800
Campus Services 1,800
Building Services 2,400
Support ASF per FTE 129
TOTAL ASF 119,483
Student FTE 570
ASF per Student FTE 194
OFF CAMPUS FACILITIES PROJECTED NEED
Academic Space N/A
Classrooms & Computer Labs N/A
Schools and Departments N/A
Academic ASF per FTE N/A
Support Space 60,853
Grant Funded Programs 0
Centers & Institutes 3,014
Academic Support 0
Information Technology 0
Library 29,323
Athletics, Recreation, HWS 0
Assembly & Exhibition 0
Student Activity 0
Child Care Center 0
Student Health Center 0
Student Services 0
Administrative Services 24,813
Campus Services 14,536
Building Services 832
Support ASF per FTE N/A
TOTAL ASF 72,518
Student FTE N/A
ASF per Student FTE N/A
OFF CAMPUS FACILITIES AND THE NEW SCHOOL OF LAW
The adjacent table represents the alternate assessment of overall need for off-campus facilities for Binghamton University as well as need to support the new School of Law.
The School of Law is a new academic program at BU that is projected to come on-line in 2015. The strategic approach toward facilities for the School of Law is to provide space in an existing or temporary facility for the initial years following program inception. The alternate assessment projections inclue a full listing of facilities requirements for a new School of Law Building, outlined to the right. This need is included in the Sustained Growth Period of space needs projections.
FIGURE 3.5.4D Alternate Assessment of Need, Off Campus, Based on student contact hours, no student FTEs are allocated to off campus facilities.
FIGURE 3.5.4E Alternate Assessment of Need, New School of Law, Student FTE determined for the School of Law based on the location of student contact hours.

43
SCHOOL OR DIVISION 2009 EXIST
2013 UPDATED
2009 NEED
2013 PROJ 2018 PROJ 2018
DEFICIT
Classrooms and Computer Labs 124,041 124,041 152,537 165,419 197,054 -63,037
Harpur College: Fine Arts Division
95,742 95,742 106,893 119,682 128,783 -33,041
Harpur College: Humanities Division
28,193 28,193 47,510 50,846 57,361 -29,168
Harpur College: Science & Mathematics Division
255,802 271,728 282,634 311,526 361,520 -89,792
Harpur College: Social Sciences Division
56,442 60,776 92,134 99,894 106,633 -45,857
Harpur College: Interdisciplinary Programs
2,307 2,307 2,524 2,524 2,765 -458
Harpur College: Non-Majors Programs
4,915 4,915 6,176 6,446 6,662 -1,747
Watson School of Engineering 94,877 107,112 142,295 161,674 187,316 -80,204
School of Education 6,144 6,144 11,210 12,356 14,438 -8,294
School of Management 15,720 15,720 24,139 26,340 28,897 -13,177
School of Nursing 9,883 9,883 21,610 25,637 27,788 -17,905
TOTAL 694,066 726,561 889,662 982,344 1,156,301 -462,235
3.5.5 BUILDING CAPACITY PERIOD DETAIL
Due to the magnitude of enrollment growth and associated space needs, it is important for the FMP to prioritize overall need to ensure that the correct type of facilities are provided early in the plan. To aid in prioritization, space needs are separated into two planning horizons: a near-term Building Capacity Period, followed by a long-term Sustained Growth Period.
The Building Capacity Period address space needs associated with growth through 2018. The period achieves the two-fold purpose of redressing existing facilities capacity and condition issues while also aligning the overall facilities provision with the University’s revised academic and strategic mission.
The following section presents the space needs associated with the Building Capacity Period according to the format:
+ Main Campus, Academic Space
+ General Classrooms and Computer Labs
+ Harpur College: Fine Arts Division
+ Harpur College: Humanities Division
+ Harpur College: Science & Mathematics Division
+ Harpur College: Social Science Division
+ Harpur College: Non-Divisional Programs
+ Watson School of Engineering
+ Professional Programs
+ Main Campus, Support Space
+ Downtown Campus
FIGURE 3.5.5A Summary of Academic Space Needs for the Main Campus
BUILDING CAPACITY PERIOD
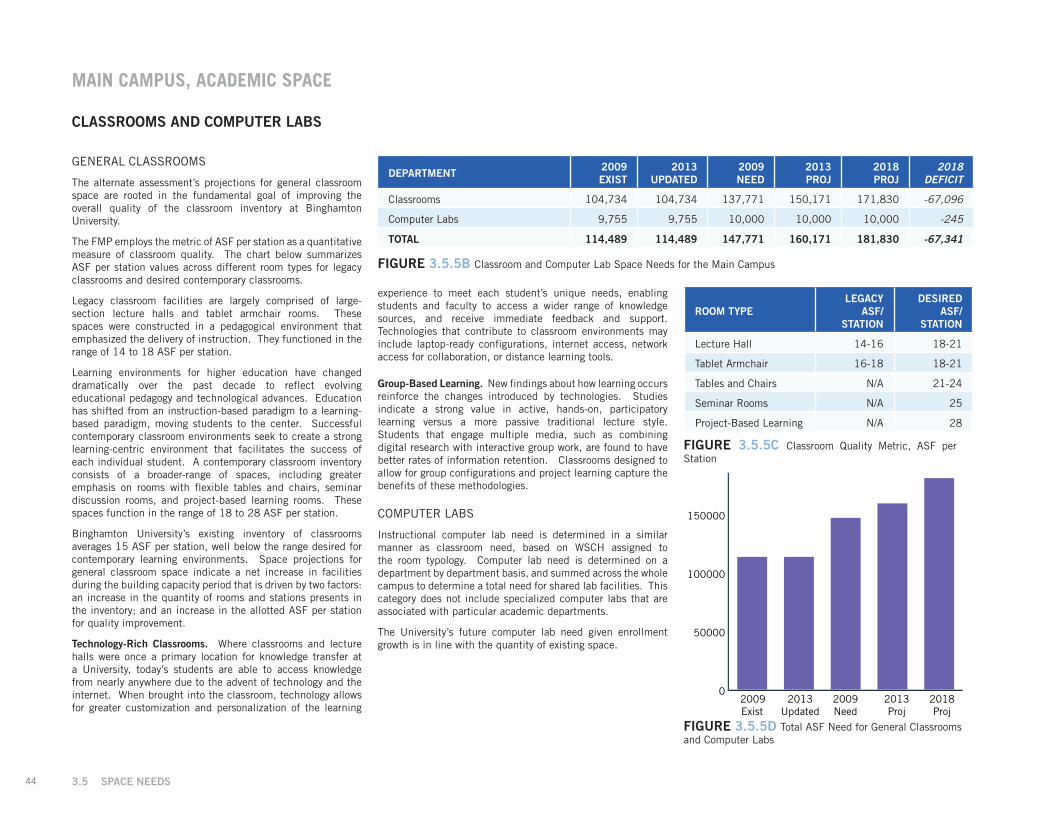
44 3.5 SPACE NEEDS
GENERAL CLASSROOMS
The alternate assessment’s projections for general classroom space are rooted in the fundamental goal of improving the overall quality of the classroom inventory at Binghamton University.
The FMP employs the metric of ASF per station as a quantitative measure of classroom quality. The chart below summarizes ASF per station values across different room types for legacy classrooms and desired contemporary classrooms.
Legacy classroom facilities are largely comprised of large-section lecture halls and tablet armchair rooms. These spaces were constructed in a pedagogical environment that emphasized the delivery of instruction. They functioned in the range of 14 to 18 ASF per station.
Learning environments for higher education have changed dramatically over the past decade to reflect evolving educational pedagogy and technological advances. Education has shifted from an instruction-based paradigm to a learning-based paradigm, moving students to the center. Successful contemporary classroom environments seek to create a strong learning-centric environment that facilitates the success of each individual student. A contemporary classroom inventory consists of a broader-range of spaces, including greater emphasis on rooms with flexible tables and chairs, seminar discussion rooms, and project-based learning rooms. These spaces function in the range of 18 to 28 ASF per station.
Binghamton University’s existing inventory of classrooms averages 15 ASF per station, well below the range desired for contemporary learning environments. Space projections for general classroom space indicate a net increase in facilities during the building capacity period that is driven by two factors: an increase in the quantity of rooms and stations presents in the inventory; and an increase in the allotted ASF per station for quality improvement.
Technology-Rich Classrooms. Where classrooms and lecture halls were once a primary location for knowledge transfer at a University, today’s students are able to access knowledge from nearly anywhere due to the advent of technology and the internet. When brought into the classroom, technology allows for greater customization and personalization of the learning
DEPARTMENT 2009 EXIST
2013 UPDATED
2009 NEED
2013 PROJ
2018 PROJ
2018 DEFICIT
Classrooms 104,734 104,734 137,771 150,171 171,830 -67,096
Computer Labs 9,755 9,755 10,000 10,000 10,000 -245
TOTAL 114,489 114,489 147,771 160,171 181,830 -67,341
ROOM TYPELEGACY
ASF/STATION
DESIRED ASF/
STATION
Lecture Hall 14-16 18-21
Tablet Armchair 16-18 18-21
Tables and Chairs N/A 21-24
Seminar Rooms N/A 25
Project-Based Learning N/A 28
experience to meet each student’s unique needs, enabling students and faculty to access a wider range of knowledge sources, and receive immediate feedback and support. Technologies that contribute to classroom environments may include laptop-ready configurations, internet access, network access for collaboration, or distance learning tools.
Group-Based Learning. New findings about how learning occurs reinforce the changes introduced by technologies. Studies indicate a strong value in active, hands-on, participatory learning versus a more passive traditional lecture style. Students that engage multiple media, such as combining digital research with interactive group work, are found to have better rates of information retention. Classrooms designed to allow for group configurations and project learning capture the benefits of these methodologies.
COMPUTER LABS
Instructional computer lab need is determined in a similar manner as classroom need, based on WSCH assigned to the room typology. Computer lab need is determined on a department by department basis, and summed across the whole campus to determine a total need for shared lab facilities. This category does not include specialized computer labs that are associated with particular academic departments.
The University’s future computer lab need given enrollment growth is in line with the quantity of existing space.
0
50000
100000
150000
200000
2009Exist
2013Updated
2013Proj
2018Proj
2009Need
FIGURE 3.5.5D Total ASF Need for General Classrooms and Computer Labs
MAIN CAMPUS, ACADEMIC SPACE
CLASSROOMS AND COMPUTER LABS
FIGURE 3.5.5C Classroom Quality Metric, ASF per Station
FIGURE 3.5.5B Classroom and Computer Lab Space Needs for the Main Campus

45
BUILDING CAPACITY PERIOD
DEPARTMENT 2009 EXIST
2013 UPDATED
2009 NEED
2013 PROJ
2018 PROJ
2018 DEFICIT
Art History 6,450 6,450 7,837 7,897 8,036 -1,586
Art Studio 21,992 21,992 26,116 28,293 31,758 -9,766
Cinema 9,335 9,335 13,630 17,092 19,234 -9,899
Music 23,537 23,537 26,240 30,660 32,731 -9,194
Theater 34,428 34,428 33,070 35,740 37,024 -2,596
TOTAL 95,742 95,742 106,893 119,682 128,783 -33,041
ART HISTORY
Projections for the Art History department indicate a net increase in facilities during the building capacity period.
+ An increase in departmental space for right-sizing of existing facilities and an increase in faculty lines,
+ An increase in research space to provide facilities for a greater number of graduate students participating in research,
+ A decrease in the facilities allotted to the department’s slide library by the end of the period, consistent with the transition of University toward digitization and remote and consolidated storage of collections.
ART STUDIO
Projections for the Art Studio department indicate a net increase in facilities during the building capacity period.
+ A modest increase in departmental space for additional faculty lines,
+ An increase in class laboratory space for additional studios (design, drawing, microcomputer lab, and painting) and provision of a new central output and equipment dispensing space,
+ Provision of new studios for undergraduate BFA student use.
CINEMA
Projections for the Cinema department indicate a net increase in facilities during the building capacity period.
+ An increase in departmental space for right-sizing of existing facilities and an increase in faculty lines,
+ An net increase in class laboratory space, comprised of a transition toward and increase in digital media facilities from analog facilities and provision of a new central output and equipment dispensing space.
MUSIC
Projections for the Music department indicate a net increase in facilities during the building capacity period.
0
30000
60000
90000
120000
150000
2009Exist
2013Updated
2013Proj
2018Proj
2009Need
FIGURE 3.5.5F Total ASF Need for Harpur College of Arts and Sciences, Fine Arts Division
+ An increase in departmental space for right-sizing of existing facilities, a increase of one faculty line, and an increase in teaching assistants,
+ A net increase in class laboratory space, comprised of an initial retrenchment followed by the provision of additional studios (small rehearsal room and organ room, large and small) and a central output and equipment dispensing space,
+ An increase in research space to provide facilities for a greater number of undergraduate student practice rooms.
THEATER
Projections for the Theater department indicate a modest net increase in space facilities during the building capacity period, comprised of an initial retrenchment, followed by expansion.
+ An increase in departmental space for an increase in faculty lines and provision of a conference room,
+ A net decrease in facilities allotted to class laboratory space for right-sizing of facilities, however including the provision of an additional rehearsal studio at the end of the period,
+ Provision of new undergraduate rehearsal rooms for Theater student use.
HARPUR COLLEGE: FINE ARTS DIVISION
FIGURE 3.5.5E Harpur Fine Arts Departmental Space Needs

46 3.5 SPACE NEEDS
AFRICANA STUDIES
Projections for the Africana Studies department indicate an increase in facilities during the building capacity period.
+ An increase in departmental space for right-sizing of facilities and an increase in faculty and teaching assistants.
ASIAN & ASIAN-AMERICAN STUDIES
Projections for Asian & Asian-American Studies indicate an increase in facilities during the building capacity period.
+ An increase in departmental space for right-sizing of existing facilities and an increase in faculty lines, as well as the addition of doctoral student lines in 2018.
CLASSICAL & NEAR EASTERN STUDIES
Projections for Classical & Near Eastern Studies indicate an increase in facilities during the building capacity period.
+ A near-term increase in departmental space for right-sizing of existing facilities, an increase in faculty lines, and the addition of a designated conference room.
COMPARATIVE LITERATURE
Projections for the Comparative Literature department indicate an increase in facilities during the building capacity period.
+ A significant increase in departmental space for right-sizing of existing facilities and an increase in faculty lines, doctoral student lines, and teaching assistants,
+ The provision of new facilities for graduate students participating in research functions.
ENGLISH, GENERAL LITERATURE & RHETORIC
Projections for the English, General Literature & Rhetoric department indicate an increase in facilities during the building capacity period.
+ A significant increase in departmental space for right-sizing of existing facilities, an increase in faculty lines, and provision of additional conference and secretary facilities,
+ An increase in class laboratory space for right-sizing of the existing journalism lab and provision of an additional lab and an increase in faculty research space.
0
10000
20000
30000
40000
50000
60000
2009Exist
2013Updated
2013Proj
2018Proj
2009Need
FIGURE 3.5.5H Total ASF Need for Harpur College of Arts and Sciences, Humanities Division
DEPARTMENT 2009 EXIST
2013 UPDATED
2009 NEED
2013 PROJ
2018 PROJ
2018 DEFICIT
Africana Studies 1,062 1,062 1,890 1,944 1,944 -882
Asian & Asian-American Studies 2,910 2,910 3,767 4,037 5,373 -2,463
Classical & Near Eastern Studies 1,094 1,094 2,295 2,295 2,295 -1,201
Comparative Literature 2,254 2,254 6,440 7,067 7,958 -5,704
English, General Literature, Rhetoric 10,999 10,999 16,627 18,065 21,012 -10,013
German and Russian Studies 1,828 1,828 2,329 2,329 2,329 -501
Judaic Studies 1,093 1,093 2,005 2,005 2,005 -912
Philosophy 3,346 3,346 7,378 8,325 9,612 -6,266
Romance Languages & Literature 2,777 2,777 3,949 3,949 4,003 -1,226
Chair 830 830 830 830 830 0
TOTAL 28,193 28,193 47,510 50,846 57,361 -29,168
MAIN CAMPUS, ACADEMIC SPACE
HARPUR COLLEGE: HUMANITIES DIVISION
GERMAN AND RUSSIAN STUDIES
Projections for German and Russian Studies indicate an increase in facilities during the building capacity period.
+ An increase in departmental space for right-sizing of facilities given existing lines.
JUDAIC STUDIES
Projections for the Judaic Studies department indicate an increase in facilities during the building capacity period.
+ An increase in departmental space for right-sizing of facilities given existing lines.
PHILOSOPHY
Projections for the Philosophy department indicate an increase in facilities during the building capacity period.
+ An increase in departmental space for right-sizing of existing facilities, an increase in faculty, doctoral student and teaching assistant lines, and a conference room.
ROMANCE LANGUAGES & LITERATURE
Projections for Romance Languages & Literature indicate an increase in facilities during the building capacity period.
+ An increase in departmental space for right-sizing of facilities given existing lines.
FIGURE 3.5.5G Harpur Humanities Departmental Space Needs

47
BUILDING CAPACITY PERIOD
HARPUR COLLEGE: SCIENCE & MATHEMATICS DIVISION
BIOLOGY
Projections for the Biology department indicate an increase in facilities during the building capacity period.
+ An increase in departmental space for an increase in faculty, graduate student, and teaching assistant lines as well as the provision of an additional conference facility,
+ A modest increase in class laboratory space for provision of an additional anatomy & physiology lab and microbiology lab,
+ An increase in research space for the provision of facilities for a greater number of faculty members, graduate students, and undergraduate students, and supporting staff,
+ Provision of a new designated departmental tutoring center.
CHEMISTRY
Projections for the Chemistry department indicate an increase in facilities during the building capacity period.
+ An increase in departmental space for an increase in faculty and graduate student lines as well as the provision of an additional conference facility in the out-year,
+ An increase in class laboratory space for provision of an additional general chemistry lab, organic chemistry lab, and physical chemistry lab,
+ An increase in research space for the provision of facilities for a greater number of faculty members, graduate students, and undergraduate students, and supporting staff,
+ Provision of a new designated storage facility for the department.
GEOLOGICAL SCIENCES & ENVIRONMENTAL STUDIES
Projections for the Geological Sciences & Environmental Studies department indicate an initial decrease in the near-term followed by a net increase in facilities during the building capacity period.
+ A reduction in departmental office space for right-sizing of facilities,
+ An increase in class laboratory space for the right-sizing
0
50000
100000
150000
200000
250000
300000
350000
400000
2009Exist
2013Updated
2013Proj
2018Proj
2009Need
FIGURE 3.5.5J Total ASF Need for Harpur College of Arts and Sciences, Sciences & Mathematics Division
DEPARTMENT 2009 EXIST
2013 UPDATED
2009 NEED
2013 PROJ
2018 PROJ
2018 DEFICIT
Biology 73,047 73,197 72,425 81,290 92,574 -19,377
Chemistry 57,184 57,184 67,395 74,972 86,568 -29,384
Geological Sciences & Environmental Studies
27,749 27,749 27,704 28,937 34,734 -6,985
Mathematical Sciences 8,487 8,487 13,557 14,124 16,035 -7,548
Physics, Applied Physics & Astronomy 28,439 28,439 26,564 30,718 37,242 -8,803
Psychology 46,698 55,298 51,189 54,885 64,967 -9,669
Animal Care 14,198 21,374 23,800 26,600 29,400 -8,026
TOTAL 255,802 271,728 282,634 311,526 361,520 -89,792
of existing laboratories and the provision of an additional geology lab in the out-year,
+ A net reduction in research space for right-sizing and re-allocating facilities to support a greater number of graduate and undergraduate students participating in research.
MATHEMATICAL SCIENCES
Projections for the Mathematical Sciences department indicate an increase in facilities during the building capacity period.
+ An increase in departmental space for an increase in faculty lines and provision of an additional conference room,
+ A modest increase in class laboratory space to provide facilities to support a greater number of faculty and graduate students,
+ The provision of a new Math Center to support new pedagogical curriculum development shifts.
PHYSICS, APPLIED PHYSICS & ASTRONOMY
Projections for the Physics, Applied Physics & Astronomy Studies department indicate an initial decrease in the near-term followed by a net increase in facilities during the building capacity period.
FIGURE 3.5.5I Harpur Sciences Departmental Space Needs

48 3.5 SPACE NEEDS
MAIN CAMPUS, ACADEMIC SPACE
+ An increase in departmental space for right-sizing of existing facilities, provision of additional storage and conference space, and provision of facilities for doctoral students in the out-year,
+ A modest net increase in class laboratory space consisting of an initial decrease for reduction of sophomore and junior project labs, and the provision of an additional general physics lab in the out-year,
+ A net increase in research space consisting of an initial decrease for right-sizing of facilities and re-allocating of facilities to support a greater number of undergraduate and graduate students participating in research.
PSYCHOLOGY
Projections for the Psychology department indicate an increase in facilities during the building capacity period.
+ An increase in departmental space for an increase in faculty and doctoral student lines and the provision of additional storage and conference facilities,
+ An increase in class laboratory space for right-sizing of facilities and the provision of an additional learning motivation lab,
+ A net increase in research space, consisting of an initial decrease for right-sizing of facilities, followed by an increase in facilities provided for undergraduate students and research staff and the addition of forth research focus area.

49
DEPARTMENT 2009 EXIST
2013 UPDATED
2009 NEED
2013 PROJ
2018 PROJ
2018 DEFICIT
Anthropology 25,929 25,929 44,105 48,349 50,414 -24,485
Economics 5,464 5,464 10,105 11,258 12,423 -6,959
Geography 6,827 11,318 9,628 9,736 10,168 1,150
History 6,950 6,950 13,372 13,693 14,823 -7,873
Political Science 7,397 7,397 6,975 7,891 8,831 -1,434
Sociology 3,718 3,718 7,949 8,967 9,974 -6,256
TOTAL 56,285 60,776 92,134 99,894 106,633 -45,857
ANTHROPOLOGY
Projections for the Anthropology department indicate an increase in facilities during the building capacity period.
+ A modest increase in departmental space for right-sizing of existing facilities and an increase in faculty, doctoral student, and teaching assistant lines,
+ An increase in class laboratory space for right-sizing of existing lab facilities,
+ An increase in research space for the provision of facilities for a greater number of faculty and graduate students.
ECONOMICS
Projections for the Economics department indicate an increase in facilities during the building capacity period.
+ An increase in departmental space for right-sizing of existing facilities and an increase in faculty, doctoral student, and teaching assistant lines,
+ Provision of a designated computer lab space,
+ Provision of research space for graduate students in the out-year.
GEOGRAPHY
Projections for the Geography department indicate a modest increase in facilities during the building capacity period.
+ A modest net increase in departmental space, consisting of a near-term decrease in the context of expanded faculty lines and provision of a designated conference facility for right-sizing, followed by an increase for faculty and teaching assistant line expansion,
+ An increase in class laboratory space for right-sizing of existing lab facilities,
+ An increase in research facilities for right-sizing of facilities.
HISTORY
Projections for the History department indicate an increase in facilities during the building capacity period.
+ An increase in departmental space for right-sizing of
0
20000
40000
60000
80000
100000
120000
2009Exist
2013Updated
2013Proj
2018Proj
2009Need
FIGURE 3.5.5L Total ASF Need for Harpur College of Arts and Sciences, Social Sciences Division
BUILDING CAPACITY PERIOD
HARPUR COLLEGE: SOCIAL SCIENCE DIVISION
existing facilities an increase doctoral student and teaching assistant lines and provision of a new conference room, and an out-year increase in faculty lines,
+ An increase in research facilities for right-sizing of existing facilities and provision of space for additional faculty members.
POLITICAL SCIENCE
Projections for the Political Science department indicate a net increase in facilities during the building capacity period, consisting of a near-term reduction followed by expansion.
+ An increase in departmental space for right-sizing of existing facilities an increase doctoral student and teaching assistant lines and provision of a new conference room, and an out-year increase in faculty lines,
+ A decrease and right-sizing of research facilities to meet needs of graduate student research.
SOCIOLOGY
Projections for the Sociology department indicate an increase in facilities during the building capacity period.
+ An increase in departmental space for right-sizing of existing facilities and an increase in faculty, doctoral student, and teaching assistant lines,
+ Provision of facilities for graduate student research.
FIGURE 3.5.5K Harpur Social Sciences Departmental Space Needs

50 3.5 SPACE NEEDS
MAIN CAMPUS, ACADEMIC SPACE
DEPARTMENT 2009 EXIST
2013 UPDATED
2009 NEED
2013 PROJ
2018 PROJ
2018 DEFICIT
Bioengineering 12,417 12,417 17,722 19,948 22,794 -10,377
Computer Science 22,456 22,456 27,232 30,284 35,230 -12,774
Electrical Engineering 20,042 28,157 31,477 37,482 44,507 -16,350
Engineering Design 4,275 4,275 9,916 10,461 10,758 -6,483
Mechanical Engineering 22,353 26,473 36,025 40,761 48,637 -22,164
Systems & Industrial Engineering 13,334 13,334 19,923 22,738 25,390 -12,056
TOTAL 94,877 107,112 142,295 161,674 187,316 -80,204
BIOENGINEERING
Projections for the Bioengineering department indicate an increase in facilities during the building capacity period.
+ A decrease in departmental space for right-sizing of existing facilities, in the context of the provision of an additional storage facility and an increase in teaching assistant lines,
+ An increase in class laboratory space for right-sizing of existing facilities,
+ An increase in research facilities for right-sizing existing spaces and provision of facilities for a greater number of graduate and undergraduate students.
COMPUTER SCIENCE
Projections for the Computer Science department indicate an increase in facilities during the building capacity period.
+ A modest increase in departmental space for an increase in faculty lines and the provision of an additional storage facility,
+ A modest increase in class laboratory facilities for right-sizing of existing spaces,
+ A net increase in research space, consisting of an initial decrease for right-sizing followed by expansion to support an increased number of faculty, graduate students, and undergraduate students.
ELECTRICAL AND COMPUTER ENGINEERING
Projections for the Electrical and Computer Engineering department indicate an increase in facilities during the building capacity period.
+ An increase in departmental space for right-sizing of existing facilities, an increase in faculty, doctoral student, and teaching assistant lines, and provision of an additional storage facility,
+ A modest increase in class laboratory facilities for right-sizing of existing spaces,
+ An increase in research space for the provision of facilities for a greater number of faculty, graduate students, and undergraduate students.
ENGINEERING DESIGN
Projections for the Engineering Design department indicate an increase in facilities during the building capacity period.
0
50000
100000
150000
200000
2009Exist
2013Updated
2013Proj
2018Proj
2009Need
FIGURE 3.5.5N Total ASF Need for Watson School of Engineering
+ A modest increase in departmental space in the out-years for an increase in faculty and teaching assistant lines,
+ An increase in class laboratory space for right-sizing of the freshman project lab and provision of an additional lab.
MECHANICAL ENGINEERING
Projections for the Mechanical Engineering department indicate an increase in facilities during the building capacity period.
+ An increase in departmental space for right-sizing of existing facilities and an increase in faculty, doctoral student, and teaching assistant lines,
+ Equivalency of existing class laboratory space,
+ An increase in research space for the provision of facilities for a greater number of faculty, graduate students, and undergraduate students.
SYSTEMS SCIENCE & INDUSTRIAL ENGINEERING
Projections for the Systems Science & Industrial Engineering department indicate an increase in facilities during the building capacity period.
+ An increase in departmental space for right-sizing of existing facilities and an increase in faculty, doctoral student, and teaching assistant lines,
+ A increase in class laboratory space for right-sizing of facilities,
+ A net increase in research facilities in the out-year, consisting of a decrease in the near-term for right-sizing while increasing facilities allowance for graduate students.
WATSON SCHOOL OF ENGINEERING
FIGURE 3.5.5M Watson School of Engineering Departmental Space Needs

51
DEPARTMENT 2009 EXIST
2013 UPDATED
2009 NEED
2013 PROJ
2018 PROJ
2018 DEFICIT
School of Education 6,144 6,144 11,210 12,356 14,438 -8,294
School of Management 15,720 15,720 24,139 26,340 28,897 -13,177
School of Nursing 9,883 9,883 21,610 25,637 27,788 -17,905
TOTAL 31,747 31,747 56,959 64,333 71,123 -39,376
SCHOOL OF EDUCATION
Projections for the School of Education indicate an increase in facilities during the building capacity period.
+ An increase in departmental space for right-sizing of existing facilities and an increase in faculty, doctoral student, and teaching assistant lines,
+ An increase in class laboratory space for right-sizing of the existing computer lab,
+ A modest increase in facilities provision for the lyceum.
SCHOOL OF MANAGEMENT
Projections for the School of Management indicate an increase in facilities during the building capacity period.
+ An increase in departmental space for right-sizing of existing facilities and an increase in faculty, doctoral student, and teaching assistant lines,
+ An increase in class laboratory space for right-sizing of existing labs, the provision of an additional decision lab, and the provision of additional team rooms,
+ An increase in research facilities to support a greater number of faculty and graduate students.
DECKER SCHOOL OF NURSING
Projections for the School of Nursing indicate an increase in facilities during the building capacity period.
+ An increase in departmental space for the provision of office facilities for all full-time faculty, whether on the tenure track or clinical track and provision of facilities for an increase in faculty, doctoral student, and teaching assistant lines,
+ A net increase in class laboratory space, consisting of an initial decrease for right-sizing followed by an increase for the provision of an additional simulation lab and skills lab,
+ An increase in research space to support a greater number of faculty and graduate students.
0
10000
20000
30000
40000
50000
60000
70000
80000
2009Exist
2013Updated
2013Proj
2018Proj
2009Need
FIGURE 3.5.5P Total ASF Need for Professional Programs
BUILDING CAPACITY PERIOD
PROFESSIONAL PROGRAMS
FIGURE 3.5.5O Professional Program Departmental Space Needs

52 3.5 SPACE NEEDS
GRANT FUNDED PROGRAMS
Projections indicate an increase in facilities for Grant Funded Programs during the building capacity period. The increase consists of a combination of expansion of existing programs as well as the addition of new programs with the University’s future emphasis on innovation and discovery.
CENTERS & INSTITUTES
Projections indicate an increase in facilities for Centers & Institutes during the building capacity period. Like Grant Funded Programs, the increase consists of a combination of expansion of existing programs as well as the addition of new programs with the University’s future emphasis on innovation and discovery. Within the next increase also exists a reallocation of space to right-size certain existing programs.
ACADEMIC SUPPORT
Projections indicate an increase in facilities for Academic Support during the building capacity period. This category includes the University’s Writing Center and Writing Initiative. The projections provide designated facilities for each program, emphasizing the University’s rich history in the liberal arts.
INFORMATION TECHNOLOGY
Projections indicate an increase in facilities for Information Technology during the building capacity period. The increase occurs due to expansion of the University’s technology support programs, particularly those supporting technology-enhanced teaching and learning. The projections account for efficiencies gained in data processing equipment and operations.
LIBRARIES
Projections indicate a net increase in facilities for Libraries during the building capacity period, consisting of an initial decrease driven by right-sizing of collections space, followed by an increase. The projections allocate library space based on the contemporary role of the library as an intellectual hub for information access through a variety of means, rather than a repository for collections. Space needs for Libraries consist of a decrease in the amount of facilities for collections, assuming use of a consolidated storage mechanism to accommodate partial collections; an increase reader-centric functions such
MAIN CAMPUS, SUPPORT SPACE
as seating, information commons, librarian access points, and individual and group study rooms; and a relative equivalent provision of space for administrative functions.
ATHLETICS, RECREATION, HEALTH & WELLNESS STUDIES
Projections indicate no additional facilities requirements for Athletics, Recreation, and the support side of Health and Wellness Studies during the building capacity period. The assessment finds this category of space to be sufficient compared with the University’s peers, and over-built compared with system standards.
ASSEMBLY & EXHIBITION
Projections indicate a modest increase in facilities for Assembly & Exhibition during the building capacity period. The increase accounts for the right-sizing of support functions to complement the University’s existing assembly and exhibition spaces.
STUDENT ACTIVITY
Projections indicate an increase in facilities for Student Activity during the building capacity period. The increase provides informal student gathering, lounge, and study space distributed throughout all campus buildings to support existing centralized facilities. This model reflects student learning styles and contemporary practices within higher education.
CHILD CARE CENTER
Projections indicate a modest increase in facilities for the Child Care Center during the building capacity period. The increase occurs due to right-sizing of existing functions and a modest increase in capacity.
STUDENT HEALTH CENTER
Projections indicate an increase in facilities for the Student Health Center during the building capacity period. The increase occurs due to right-sizing of existing functions.
STUDENT SERVICES
Projections indicate an increase in facilities for Student Services during the building capacity period. The increase provides
expanded capacity for student financial and registration services such as financial aid, registrar, and student accounts; expanded capacity for the academic advising office for Harpur College; new designated facilities for the Binghamton Scholars and Bridges to Baccalaureate programs; expanded capacity for the Student Counseling center; and expanded capacity to support a general growing student population for other services such as the Career Development Center, Disable Student Services, the Discovery program, and the Dean of Students and affiliated functions.
ADMINISTRATIVE SERVICES
Projections indicate an increase in facilities for Administrative Services during the building capacity period. Need is associated with right-sizing of existing administrative functions to provide a more robust space allocation to accommodate the full range of office and support facilities that contemporary institutions require, as identified in Student Services and Administration in section 3.5.2 Consultant Methodology.
CAMPUS SERVICES
Projections indicate an increase in facilities for Campus Services during the building capacity period. The increase accounts for the full array of services provided by campus services at the contemporary institution. A specific area addressed is the provision of facilities for equipment and vehicle storage and maintenance, a particularly area of concern with electric and alternative fuel vehicles.
BUILDING SERVICES
Projections indicate an increase in facilities for Building Services during the building capacity period. The increase assumes continued distribution of building services spaces throughout facilities, and reflects the University’s overall increase in facilities provision.

53
DEPARTMENT 2009 EXIST
2013 UPDATED
2009 NEED
2013 PROJ
2018 PROJ
2018 DEFICIT
Grant Funded Programs 7,990 7,990 9,988 11,486 13,208 -5,218
Centers & Institutes 25,813 53,701 34,574 39,308 50,152 3,549
Academic Support 1,099 1,099 3,268 3,268 9,668 -8,569
Information Technology 38,034 37,230 46,812 48,431 50,107 -12,877
Libraries 301,559 301,559 282,603 289,103 344,396 -42,837
Athletics, Recreation, HWS* 229,757 229,757 229,757 229,757 229,757 0
Assembly & Exhibition 51,846 51,846 67,159 67,159 77,409 -25,563
Student Activity 124,261 124,011 149,507 162,439 194,451 -70,440
Child Care Center 8,605 8,605 10,856 10,856 10,856 -2,251
Student Health Center 7,756 7,756 7,979 7,979 7,979 -223
Student Services 42,743 43,193 54,306 56,064 61,483 -18,290
Administrative Services 120,912 122,192 134,636 138,616 147,555 -25,363
Campus Services 118,007 118,728 125,284 132,798 146,084 -27,356
Building Services 39,919 44,046 60,883 64,865 73,352 -29,306
TOTAL 1,118,301 1,151,713 1,217,612 1,262,129 1,416,457 -264,744
BUILDING CAPACITY PERIOD
FIGURE 3.5.5Q Support Space Needs
*Due to unique programming at Binghamton University in the Division I Varsity Athletics, Campus Recreation, and Health & Wellness Studies, the qualitative assessment returned findings to indicate that the existing provision of space for this category is insufficient to support existing program. Refer to section 3.5.7 Qualitative Assessment for details. Concept alternatives and the final recommendation will consider both the space needs and qualitative assessments.

54 3.5 SPACE NEEDS
DEPARTMENT 2009 EXIST
2013 UPDATED
2009 NEED
2013 PROJ
2018 PROJ
2018 DEFICIT
Classroom & Computer Labs 9,552 9,552 4,766 5,248 6,250 4,304
CCPA Departmental Facilities 9,470 9,470 12,299 15,230 18,077 -8,607
Human Development 2,305 2,305 6,170 6,814 7,826 -5,521
Public Administration 4,677 4,677 3,395 3,576 3,660 1,017
Social Work 2,488 2,488 2,734 3,004 3,166 -678
Student Affairs Administration 0 0 0 1,836 1,998 -1,998
Interdisciplinary Programs 0 0 0 0 763 -763
TOTAL 19,179 19,179 17,065 20,478 24,327 -4,303
CLASSROOMS & COMPUTER LABS
Projections for the Classrooms & Computer Labs at the downtown campus indicate a decrease in facilities during the building capacity period. This presents an opportunity to right-size facilities for improved utilization, and re-allocate space to meet other needs.
HUMAN DEVELOPMENT
Projections for the Human Development department indicate an increase in facilities during the building capacity period.
+ An increase in departmental space for right-sizing of existing facilities and the provision of space for an increased number of faculty and teaching assistant lines,
+ The provision of research space to support graduate students.
PUBLIC ADMINISTRATION
Projections for the Public Administration department indicate a net decrease in facilities during the building capacity period.
+ A decrease in departmental space for right-sizing of facilities and re-allocation of existing spaces to provide for an increased number of teaching assistant lines and a designated conference room,
+ The provision of research space to support faculty and graduate students.
SOCIAL WORK
Projections for the Social Work department indicate an increase in facilities during the building capacity period.
+ A modest increase in departmental space for the provision of a designated conference room and an out-year increase in facilities for faculty and teaching assistant lines.
STUDENT AFFAIRS ADMINISTRATION
Projections indicate the provision of new facilities for the Student Affairs Administration department during the building capacity period. 0
5000
10000
15000
20000
25000
2009Exist
2013Updated
2013Proj
2018Proj
2009Need
FIGURE 3.5.5S Total ASF Need for College of Community and Public Affairs
COLLEGE OF COMMUNITY AND PUBLIC AFFAIRS
DOWNTOWN CAMPUS
+ The provision of new departmental space for faculty, support staff, and storage, conference and waiting functions.
INTERDISCIPLINARY PROGRAMS
Projections indicate the provision of new facilities for Interdisciplinary Programs during the building capacity period.
+ The provision of new departmental space for faculty, support staff, and storage, conference and waiting functions.
FIGURE 3.5.5R General Classroom and Computer Space and Departmental Needs for the Downtown Campus

55
SUPPORT SPACE
Given the nature of the singular building at the University Downtown Center and its recent construction, support space projections for the downtown campus assume that the same distribution of programs and spaces are maintained.
DEPARTMENT 2009 EXIST
2013 UPDATED
2009 NEED
2013 PROJ
2018 PROJ
2018 DEFICIT
Grant Funded programs 0 0 0 0 0 0
Centers & Institutes 0 0 0 0 0 0
Academic Support 0 0 0 0 0 0
Information Technology 555 555 555 555 555 0
Library 671 671 671 671 671 0
Athletics, Recreation, HWS 0 0 0 0 0 0
Assembly & Exhibition 0 0 0 0 0 0
Student Activity 496 496 496 496 496 0
Child Care Center 0 0 0 0 0 0
Student Health Center 0 0 0 0 0 0
Student Services 4,093 4,093 4,093 4,093 4,093 0
Administrative Services 10,325 10,325 10,325 10,325 10,325 0
Campus Services 162 162 162 162 162 0
Building Services 1,440 1,440 1,440 1,440 1,440 0
TOTAL 17,742 17,742 17,742 17,742 17,742 0
BUILDING CAPACITY PERIOD
FIGURE 3.5.5T Support Space Needs for the Downtown Campus

56 3.5 SPACE NEEDS
3.5.6 SUSTAINED GROWTH PERIOD
The Sustained Growth Period builds on the foundation of the Building Capacity Period, achieving additional facilities capacity to support additional enrollment growth through 2023.
The following section presents the space needs associated with the Susatined Growth Period according to the format:
+ Main Campus, Academic Space
+ Main Campus, Support Space
+ Downtown Campus
+ School of Law
MAIN CAMPUS, ACADEMIC SPACE
Classrooms and Computer Labs
Classroom and computer lab projections for the sustained growth period continue the the fundamental goal of improving the overall quality of the classroom inventory at Binghamton University. New construction and renovation projects seek to add spaces that function in the range of 18 to 28 ASF per station, a metric of classroom quality.
Academic Schools and Divisions
Projections for the sustained growth period provide continued expansion for the academic schools and divisions, reflecting enrollment expansion.
The most substantive facilities needs occur within the Harpur College Science and Mathematics Division and the Watson School of Engineering as these programs by nature are more facilities-intensive, requiring a larger ASF to support individual FTEs.
MAIN CAMPUS, SUPPORT SPACE
Enrollment growth in the sustained growth period requires a significant provision of support facilities. The most substantive areas of need include libraries, student activities, as well as an expansion of facilities for athletics, recreation, and health and wellness studies.
MAIN CAMPUS: SCHOOL, DIVISION, OR DEPARTMENT 2018 PROJ 2023 PROJ 2018 TO 2023 DEFICIT
Academic Space 1,103,993 1,239,351 -135,358
Classrooms and Computer Labs 181,830 215,173 -33,343
Harpur College: Fine Arts Division 128,783 136,742 -7,959
Harpur College: Humanities Division 57,361 64,176 -6,815
Harpur College: Science & Mathematics Division 361,520 401,829 -40,309
Harpur College: Social Sciences Division 106,633 114,035 -7,402
Harpur College: Interdisciplinary Programs 2,765 3,265 -500
Harpur College: Non-Majors Programs 6,662 6,770 -108
Watson School of Engineering 187,316 218,051 -30,735
School of Education 14,438 16,503 -2,065
School of Management 28,897 32,737 -3,840
School of Nursing 27,788 30,070 -2,282
Support Space 1,253,972 1,412,535 -158,563
Grant Funded Programs 13,208 15,190 -1,982
Centers & Institutes 41,738 47,999 -6,261
Academic Support 3,268 3,268 0
Information Technology 49,552 51,286 -1,734
Libraries 282,827 314,851 -32,024
Athletics, Recreation, HWS 229,757 280,000 -50,243
Assembly & Exhibition 67,159 67,159 0
Student Activities 187,955 223,374 -35,419
Student Health Center 10,856 10,856 0
Child Care Center 7,979 7,979 0
Student Services 53,790 55,672 -1,882
Administrative Services 107,617 111,922 -4,305
Campus Services 129,586 145,738 -16,152
Building Services 68,680 77,241 -8,561
FIGURE 3.5.6A Sustained Growth Period Space Needs for the Main Campus

57
SUSTAINED GROWTH PERIOD
DOWNTOWN CAMPUS: DIVISION, OR DEPARTMENT 2018 PROJ 2023 PROJ 2018 TO 2023 DEFICIT
Academic Space 24,327 26,679 -2,352
Classrooms and Computer Labs 6,250 7,305 -1,055
Human Development 7,826 8,474 -648
Public Administration 3,660 4,067 -407
Social Work 3,166 3,220 -54
Student Affairs Administration 1,998 2,160 -162
Interdisciplinary Programs 763 763 0
Support Space 17,742 17,742 0
Grant Funded Programs 0 0 0
Centers & Institutes 0 0 0
Academic Support 0 0 0
Information Technology 555 555 0
Libraries 671 671 0
Athletics, Recreation, HWS 0 0 0
Assembly & Exhibition 0 0 0
Student Activities 496 496 0
Student Health Center 0 0 0
Child Care Center 0 0 0
Student Services 4,093 4,093 0
Administrative Services 10,325 10,325 0
Campus Services 162 162 0
Building Services 1,440 1,440 0
DOWNTOWN CAMPUS
Classrooms and Computer Labs
Classroon and computer lab projections for the sustained growth period at the Downtown Campus continue to grow modestly from 2018 to 2023, however do not exceed levels of the existing 2009 provision of space. This indicates further the opportunity to right-size classroom facilites in the building and repurposed gained space for other academic program use.
Academic Divisions
Facilities for academic programs grow modestly during the building capacity period. Growth is related to the expnasion of capacity of the individual programs, primarily the Human Development and the Public Administration Programs.
Support Space
Given the nature of the singular building at the University Downtown Center and its recent construction, support space projections for the downtown campus assume that the same distribution of programs and spaces are maintained.
SCHOOL OF LAW
The new School of Law program is anticipated to be on-line and supported by significant enrollment growth during the Sustained Growth Period. Given enrollment targets, the alternate assessment identifies space needs to support the academic program. Due to the anticipated location of the building at an off-campus location, program includes the full complement of support facilities required to support student life. Refer to section 3.5.4 Alternate Assessment of Overall Need, subsection Off Campus Facilities and the New School of Law for program details.
FIGURE 3.5.6B Sustained Growth Period Space Needs for the Downtown Campus

58 3.5 SPACE NEEDS
3.5.7 QUALITATIVE ASSESSMENT
Successful campus planning must consider the full spectrum of factors that impact an institution of higher education in order to be successful. To this end, solutions presented in Phases 4 and 5 of the FMP synthesize findings from three data sets:
+ The Conditions Assessment,
+ The Quantitative Space Needs Assessment,
+ The Qualitative Assessment.
Recommendations from the Conditions Assessment are presented in Phase 2 Assessment of Conditions of the FMP, and recommendations from the Quantitative Assessment are presented in this document Phase 3 Space Needs. These assessments account for qualitative feedback received, however translate the feedback into statements of conditions or numerical needs, rather than presenting it directly.
ROLE OF THE QUALITATIVE ASSESSMENT
The role of the Qualitative Assessment is to present strategic and qualitative feedback received throughout the course of the FMP in a direct manner. Data was gathered through an extensive series of meetings, group discussions, and feedback sessions with University leadership, faculty and staff members, students, and community members, including:
Senior Leadership Meetings. Senior leadership meetings were conducted with the FMP Steering Committee and Planning Committee at regular intervals throughout the planning process. The senior leadership worked with the planning team to imbue the plan with the University’s strategic and academic missions, and synthesize qualitative findings from other groups.
The planning team also met with the deans from each academic school for feedback on the strategic direction of entire schools and innovative programming being conducted by individual programs.
Anomaly Program Interviews. Anomaly program interviews were conducted with key campus departments that required a greater level of study. Departments were selected largely based on information requirements to inform the space needs assessments.
Roundtable Discussions. Roundtable discussions drew together a wide array of campus constituents across departments to discuss given themes. University leaders were chosen to participate in the discussions, representing constituents from
the whole of their department or division. Sessions themes included the following:
+ Harpur Fine Arts
+ Harpur Humanities, Social Sciences and Mathematics
+ Harpur Sciences
+ Watson School of Engineering
+ University Libraries
+ Student Services, “One-Stop” Functions
+ Student Academic Support Services
+ International Programs and Services
+ Student Activities & Residential Life
+ Athletics, Recreation, Health & Wellness Studies
+ External Affairs and Outreach
+ Campus Safety
Open Forum Sessions. Three open forum sessions were conducted throughout the FMP to present the plan to the greater campus community. The intent of the sessions was to update members of the campus community on findings and progress of the FMP, and provide a venue for the community to ask questions and express feedback on the process or content. Open forum sessions were addressed the following components of the plan:
+ Phases 1 through 3 Synthesis of Findings
+ Phase 4 Concept Alternatives
+ Phase 5 Final Recommendation
QUALITATIVE ASSESSMENT FINDINGS
Data gathered from qualitative sources has been compiled and analyzed for key themes, presented on the opposite page. These themes drive the direction of the University across programs and departments. Planning in Phases 4 and 5 of the FMP seeks to effectivley translate these themes into physical space.
Upgrade facilities for contemporary pedagogy and learning.
Support an interdisciplinary approach to academics that emphasizes innovation and discovery.
Binghamton University recognizes that many of the key issues faced in our world today are complex, extending beyond the
expertise of any one discipline, and require holistic solution finding. As such, the University has established a strategic goal to encourage interdisciplinarity of programming across all schools and divisions. This shift will enables the University to prepare students and conduct research for today’s world.
The shift toward interdisciplinary programming yields different facilities requirements than past models that approached program on a purely departmental level. An interdisciplinary approach co-locates key faculty members and other facilities to support high collaboration. For example, such organization occurs within a research cluster of genetics and DNA at Science III where faculty members from the anthropology department are co-located with faculty members from biology around a central core of common facilities.
The qualitative assessment identifies the opportunity to foster future interdisciplinary programming at BU by co-locating key programs to reflect the mission in physical space. Such opportunities include: international programming, including both academic programs and support services; organization within the sciences and engineering around research themes; and within liberal arts programming.
Engage technology in teaching and learning environments to enhance the student experience.
Higher education is experiencing a pedagogy shift from a teaching-centric model to a learning-centric model where students are more active in their pursuit of knowledge and accumulate it through a variety of means. Technology is identified as a tool that may encourage such active learning and engage students of today and tomorrow.
The qualitative assessment identifies the opportunity to increase the use of technology in both formal and informal learning environments at BU. Key programs such as the School of Nursing, the foundational calculus programs within the Mathematics department, and summer distance learning programs are already employing technology for such purposes. Findings from these programs may be applicable to a greater number of courses campus-wide. However, the qualitative assessment identifies constraints to effective incorporation of technology enhanced learning methods. One key constraint is faculty comfort with technology, extending from basic use of hardware and software, to more in-depth re-design of course content. Another constraint is the provision of facilities on campus where faculty members may gain access to technology for experimentation and ultimate adoption. The opportunity exists to provide spaces on campus that include technology-

59
rich learning environments, and co-locate them with a full complement of support services.
Support the student experience beyond the classroom.
Increase the number of soft spaces across campus for gathering and informal learning.
Contemporary learning-centric pedagogy recognizes that student learning extends well beyond the classroom and that development of the complete student includes not only academic success, but also social interaction and a sense of belonging to the university community.
The physical campus environment supports and encourages such informal learning and social interaction by providing a wide range of places on campus where students, faculty and other members of the university community may come together. Due to past facilities constraints, Binghamton University has a lack of such informal spaces, as nearly all possible spaces within the building have been tapped for active program use.
The qualitative assessment identifies the provision of soft spaces for gathering and informal learning as a critical component to student success and innovation and discovery at BU.
Identify specific areas of need for the Athletics, Recreation, and Health & Wellness Studies programs.
Binghamton University support a wide complement of physical activity programs through its Varsity Athletics, Campus Recreation, and Health & Wellness Studies program. Currently the programs make use of facilities at the East Gym, West Gym, and Events Center, as well as outdoor fields.
The space needs assessments indicate the campus to be overbuilt with respect to these facilities, however the qualitative assessment returned a significant quantity of data indicating that additional facilities are required to support the existing campus population and for growth. Space needs for this program area must be understood in the greater context of need on campus, specifically on the academic side. However, recognizing the role of physical activity in the complete BU student the opportunity exists for the FMP to identify specific space needs that will yield a high return for limited facilities investment. Specific identified areas of need include: indoor
court space for use by all programs, multipurpose rooms, classrooms for Health & Wellness Studies, an expanded student academic success center for Athletics, and improved quality outdoor field facilities.
Strategically locate key facilities to support student access and improved delivery.
A number of services offered throughout the campus support the student academic experience and ensure student success. In the context of continual resource constraints, BU has become strategic in its delivery of key student support services.
The qualitative assessment identifies the opportunity to reflect this strategic approach in physical space, considering carefully the location of services on campus and the relationship between related programs or departments. Student support services may be located in high-activity zones at the core of campus, for easy access. Key components may be co-located to maximize resources, improve delivery to students, while also improving access, such as financial support services of financial aid, bursar, student accounts, with graduate and undergraduate admissions.
Employ key facilities and technology to leverage limited staff and facilities resources.
Binghamton University is advanced in its use of technology to deliver services for both academics and support. Examples include the full complement of resources offered through the University Libraries, as well as online access and account services for student financials.
The qualitative assessment identifies that use of technology has been critical for the University in accommodating an increased student body in the context of resource limitations. Technology allows basic functions to be automated, and ensures staff are available to assist with case by case needs. However, the assessment also notes that the introduction of technologies must include support services on both the IT side as well as the user experience side.
Project the spirit of Binghamton University.
Highlight the University’s emphasis on the global experience.
Binghamton University emphasizes the global experience through on-campus academic programs, study abroad
programs, research initiatives, and support services for its large population of international students and faculty members.
The qualitative assessment identifies this as a highly unique component of the University, particularly within the SUNY system. The opportunity exists to showcase BU’s commitment to internationalization in the experience of the physical campus by co-locating key programs and making them visible to the greater campus community.
Showcase the University’s rich history in the liberal arts.
Binghamton University has a rich history in the liberal arts. The institution that is today a SUNY University Center was founded as Harpur College in 1946. Today, Harpur College of Arts and Sciences continues to serve as the backbone of the University as its liberal arts and sciences college and largest academic unit. A culture of depth and inquiry, rooted in study of the liberal arts, permeates all components of BU.
The qualitative assessment identifies the opportunity to highlight BU’s history in the liberal arts and Harpur College’s position today as a significant component of the overall University experience. This may be achieved by co-locating key programs, supporting innovative program initiatives such as the interdisciplinary Philosophy, Politics, and Law (PPL) program, and showcasing support functions.
Clarify campus wayfinding for improved user experience.
Binghamton University provides a campus environment with an atmosphere that is conducive to learning, safe for members of the University community, and attractive and welcoming to visitors and prospective students. The campus itself serves a myriad of functions, such as facilitating circulation and movement between built nodes and providing designated places to support many activities.
The qualitative assessment identifies the opportunity to build on the quality of the existing campus to continue to project the spirit of the University in the physical spaces. Specific spaces on campus may be defined to have unique characteristics, reflecting the wide variety of interests and focuses of the University community. Vehicular and circulation routes may be clarified for clearly communicated routes between major nodes and the reduction of conflict points. Signage may be provided to brand the campus and provide users with a stream of information aiding them in navigation.

60 3.6 UTILIZATION CAPACITY
3.6.1 FACILITY CAPACITY
Binghamton University’s existing campus has limited available facilities capacity. In its current state, the University is operating at a more efficient ASF per student FTE than that indicated as needed in the Alternate Assessment.
With the addition of key new facilities including Science V, ITC Engineering & Science, and ITC Center of Excellence, a modest amount of space will be vacated at BU’s main campus. Renovation and program relocation associated with this space will serve as the crucial first step in catalyzing a series of phased renovations of many of the University’s legacy facilities over the course of the FMP. As the quantity of available swing space on the campus is limited, it is important to approach first moves and subsequent in a highly strategic manner.
3.6.2 CAMPUS CAPACITY
Binghamton University’s main campus consists of over 600 acres of land, however development is dramatically limited due to land coverage by natural areas. Additionally, outdoor athletic and recreation fields along the north end of the campus further limit development, as they are desired to be retained. While these constraints limit the available land area for development, the campus is anticipated to have sufficient capacity to support future development associated with 2023 enrollment growth.
Expansion of capacity at BU will occur through both additions to existing facilities and the construction of new buildings. While additions will play an important role in improving circulation and connectivity on campus, substantive construction of new buildings will be required for the University to gain the magnitude of space required to support enrollment growth.
The most desirable locations for new construction capacity expansion at BU are those sites in and around the Brain area, due to adjacency to existing facilities and the presence of infrastructure. Key opportunities for near-term expansion exist at the East Campus and at the Visitor’s Parking Lot, south of the Library. To achieve longer-term facilities expansion, construction of new buildings will be required either on existing parking lots or open spaces.
3.6 Utilization Capacity

61


![arXiv:1909.11706v1 [cs.CL] 25 Sep 2019 · 4 Pypestream, Inc., New York, USA mkim151@binghamton.edu, sayama@binghamton.edu Abstract. The text classi cation is one of the most critical](https://img.pdfslide.net/doc/110x75/5f56b094a8740b34a15d5f74/arxiv190911706v1-cscl-25-sep-2019-4-pypestream-inc-new-york-usa-mkim151binghamtonedu.jpg)