Embed Size (px)
Citation preview
THE FINANCIAL IMPACT OF THE FA CUP
January 2012
This report contains financial and other supporting analysis by Deloitte

Introduction 4
Executive summary 7
Income generation for clubs 9
Club case studies 15
Appendix 1: Limitations 23
Contents page


4
• ThisdocumentcontainsfinancialinformationinrespectofTheFACupoverthetenyearperiodfrom2001/02to2010/11,including:
– AnnualTVandprizemoneypayments;
– Totalgatereceiptsgeneratedbycompetitionmatchesineachyear;and
– CasestudiesforasampleofEnglishfootballclubs,outliningtherevenueimpactofparticipatinginTheFACupinselectedyears.
• Thefinancialanalysisoutlinedwithinthisdocument,asdescribedabove,hasbeenconductedbyDeloitteinrespectofinformationprovidedtoitbyTheFA.
MethodologyTV and prize money payments
• DeloittehavesetouttheannualTVpaymentsandprizemoneydistributedbyTheFAtoclubsparticipatinginTheFACupforeveryseasonfrom2001/02to2010/11.DeloittehavealsosetoutTheFA’sforecastTVpaymentsandprizemoneydistributionsforthe2011/12season.
Gate receipts• Deloittehaveoutlinedthetotalgate
receiptsgeneratedannuallybyFACupcompetitionmatchesfortheperiod2001/02to2010/11.
• TotalgatereceiptsshownforeachyeararegrossfiguresbeforematchdayexpensesandVATarededucted.GatereceiptsreceivedbycasestudyclubsintheparticularyearDeloittehavefocussedonarenetamounts,after
matchdayexpensesandVATarededucted,andaccordingtoTheFA’srulesregardingtheproportionallocatedtothehomeclub,awayclub,andcentralpoolinrespectofcompetitionmatches.
• DeloittecalculationsarebasedoninformationprovidedtoDeloittebyTheFA.InsomecasesDeloittehaveestimatedgatereceiptsforcertainmatches,usingattendancedataandassumptionsonticketpriceandmatchdayexpenses.
Introduction
The FA Cup with Budweiser is the world’s oldest and greatest domestic cup competition. In the 2011/12 season, 763 clubs across England were accepted to play in the competition.

5
Case study clubs
• FurtheranalysisisprovidedinrespectoftheperformanceofselectedcasestudyclubsfromvarioustiersoftheEnglishfootballpyramidincertainyears.
• Inrespectofeachclubandtheselectedyear,Deloitteprovidedataonprizemoneydistributions,TVpaymentsandestimatedgatereceiptsreceived,aswellastotalestimatedFACuprevenuesasaproportionoftotalclubrevenuesfortheselectedseason.
• Totalrevenuesinrespectofeachcasestudyclubhavebeensourcedfromauditedfinancialstatements,orinsomecaseswheresuchinformationisunavailableDeloittehaveestimatedtotalclubrevenuesbasedoninformationavailableonthatclubforpreviousyearsand/oravailabledataforcomparablepeergroupclubs.
• Fortheavoidanceofdoubt,thescopeofworkhasnotincludedanydirectcontact,consultationwith,orinformationprovisionfromtheclubsconcerned.
• Thecasestudyclubs,andtheseasonformingthefocusofouranalysisaresetoutbelow:
– PremierLeague:StokeCity(2009/10,SixthRoundProper)
– ChampionshipMillwall(2003/04,RunnersUp)
– League1:LeytonOrient(2010/11,FifthRoundProper)
– League2:AccringtonStanley(2009/10,FourthRoundProper)
– ClubsoutsidetheFootballLeague:
> Havant&Waterlooville(2007/08,FourthRoundProper)
> BurtonAlbion(2005/06,ThirdRoundProper)
> CrawleyTown(2010/11,FifthRoundProper)

In total The FA Cup has delivered almost £650m in prize money, TV payments and gate receipts to participating clubs over the ten year period 2001/02 to 2010/11.
7
Executive Summary
Overview
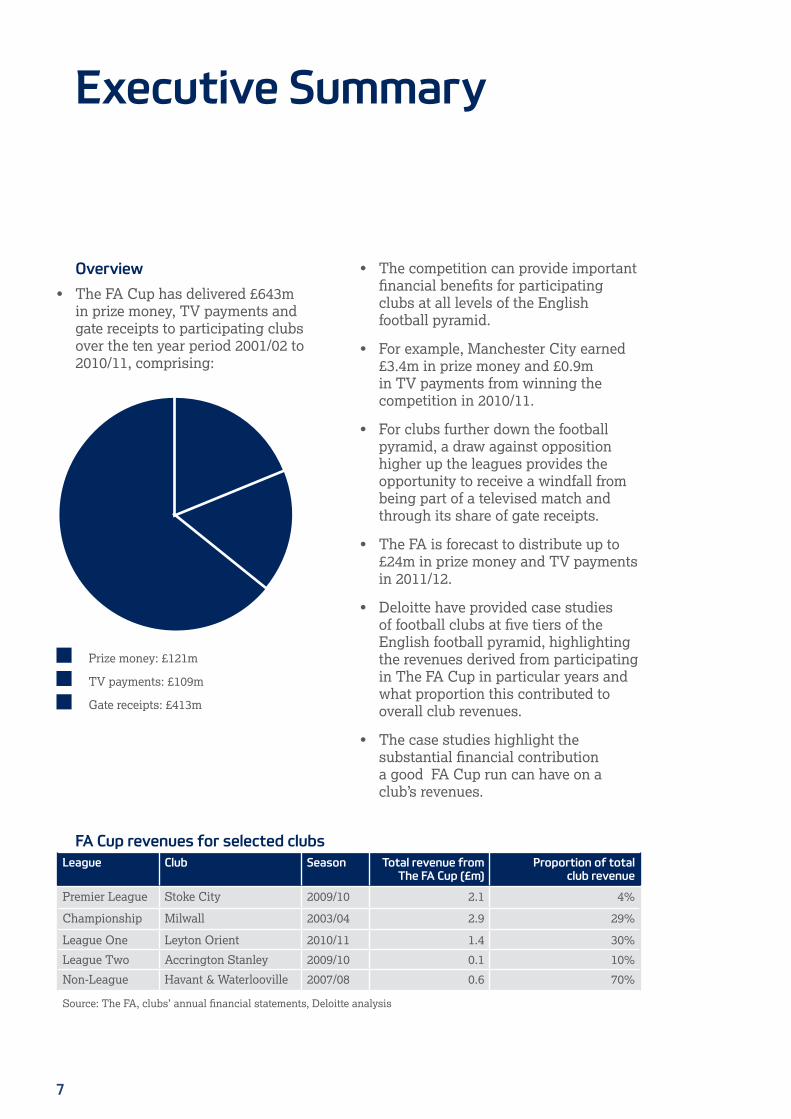
• TheFACuphasdelivered£643minprizemoney,TVpaymentsandgatereceiptstoparticipatingclubsoverthetenyearperiod2001/02to2010/11,comprising:
• ThecompetitioncanprovideimportantfinancialbenefitsforparticipatingclubsatalllevelsoftheEnglishfootballpyramid.
• Forexample,ManchesterCityearned£3.4minprizemoneyand£0.9minTVpaymentsfromwinningthecompetitionin2010/11.
• Forclubsfurtherdownthefootballpyramid,adrawagainstoppositionhigheruptheleaguesprovidestheopportunitytoreceiveawindfallfrombeingpartofatelevisedmatchandthroughitsshareofgatereceipts.
• TheFAisforecasttodistributeupto£24minprizemoneyandTVpaymentsin2011/12.
• DeloittehaveprovidedcasestudiesoffootballclubsatfivetiersoftheEnglishfootballpyramid,highlightingtherevenuesderivedfromparticipatinginTheFACupinparticularyearsandwhatproportionthiscontributedtooverallclubrevenues.
• ThecasestudieshighlightthesubstantialfinancialcontributionagoodFACupruncanhaveonaclub’srevenues.
TVpayments:£109m
Gatereceipts:£413m
Prizemoney:£121m
FA Cup revenues for selected clubsLeague Club Season Total revenue from
The FA Cup (£m)Proportion of total
club revenue
PremierLeague StokeCity 2009/10 2.1 4%
Championship Milwall 2003/04 2.9 29%
LeagueOne LeytonOrient 2010/11 1.4 30%
LeagueTwo AccringtonStanley 2009/10 0.1 10%
Non-League Havant&Waterlooville 2007/08 0.6 70%
Source:TheFA,clubs’annualfinancialstatements,Deloitteanalysis


9
Income generation for clubs
FA Cup TV payments and prize money 2001/02 – 2010/11 Season TV payments (£’000) Prize money (£’000) Total (£’000)
2001/02 13’080 12’650 25’730
2002/03 13’490 12’690 26’180
2003/04 12’170 10’690 22’860
2004/05 10’070 9’660 19’730
2005/06 10’600 9’670 20’270
2006/07 11’130 9’630 20’760
2007/08 9’010 9’650 18’660
2008/09 10’830 16’410 27’240
2009/10 9’210 14’950 24’160
2010/11 9’590 14’950 24’540
10yeartotal 109’180 120’950 230’130Source:theFA,Deloitteanalysis
• TVpaymentsandprizemoneypaidbyTheFAtoclubsinrespectofFACupmatchestotalled£25min2010/11.
• TVpaymentsandprizemoneyarelinkedtothequantumofrightsfeesreceivedfromTheFA’sbroadcastpartnersforthecompetition.
• Prizemoneypaymentstoclubstotalled£121mforTheFACupcompetitionsbetween2001/02and2010/11,with£109minTVpayments.
• Forthemostrecentseason(2010/11)atotalof£24.5mwaspaidout,splitbetweenprizemoney(circa£15m)andTVpayments(£9.6m).
• The2008/09FACuptotalprizefundpaymentsincreasedby70%fromtheprioryear,withanewprizemoneystructuremeaningindividualpaymentsincreasingforwinnersateachstageofthecompetition.Forthefirsttime,clubsreachingtheSemiFinalsandFinalwereguaranteedprizemoney
eveniftheylostinthatround.ThetwoclubseliminatedattheSemiFinalstageeachreceived£500k,withtherunnerupandwinnerreceiving£2mand£3mrespectivelyacrosstheSemiFinalandFinalmatches.
• Inthe2010/11competition,thetwoclubseliminatedattheSemiFinalstageeachreceived£450k,withtherunnerupandwinnerreceiving£1.8mand£2.7mrespectivelyacrosstheSemiFinalandFinalmatches.ManchesterCity,TheFACupwinnersin2010/11,receivedtotalprizefundpaymentsof£3.4m.

10
Forecast 2011/12 income generation
FA Cup forecast live TV payments 2011/12 Round Number of live matches Fee per televised club (£) Fee per round (£)
Round1 3 67’500 405’000
Replays 2 33’750 135’000
Round2 3 72’000 432’000
Replays 2 36’000 144’000
Round3 5 123’500 1’235’000
Replays 2 62’000 248’000
Round4 5 123’500 1’235’000
Replays 2 62’000 248,000
Round5 5 212’000 2’120’000
Replays 2 106’000 424’000
Round6 4 212’000 1’696’000
Replays 2 106’000 424’000
Total 8’746’000
Note:Highlightspaymentsarealsomadeinrespectof3matches(6clubs)ineachofRounds1to5Source:TheFA
FA Cup forecast prize money payments 2011/12Round Number of teams Payment per
round winner (£)Total payments
per round (£)Cumulative
payments (%)
ExtraPreliminary 408 750 153’000 1%
Preliminary 334 1’500 250’500 3%
Q1 232 3’000 348’000 5%
Q2 160 4’500 360’000 7%
Q3 80 7’500 300’000 9%
Q4 64 12’500 400’000 12%
Round1 80 18’000 720’000 17%
Round2 40 27’000 540’000 21%
Round3 64 67’500 2’160’000 35%
Round4 32 90’000 1’440’000 45%
Round5 16 180’000 1’440’000 54%
Round6 8 360’000 1’440’000 64%
SemiFinals(losers) 2 450’000 900’000 70%
SemiFinals(winners) 2 900’000 1’800’000 82%
Final(losers) 1 900’000 900’000 88%
Final(winners) 1 1’800’000 1’800’000 100%
Total 14’951’500Source:TheFA

11
• TheFAisforecasttodistribute£23.7minTVpaymentsandprizemoneyin2011/12
• Upto40livematcheswillbebroadcastlivein2011/12,comprising16matchesonITVand25onESPN(bothbroadcasterssharingtheFinal).
• Clubsalsoreceivepaymentsforfeaturinginhighlightsprogrammingandaspartofradiocommentary.
• Forlowerleagueandnon-leagueclubs,theprizefundsonofferthroughoutthecompetitionpropercanrepresentasignificantadditionalrevenuesource.
• Inkeepingwith2010/11,shouldTheFACupwinnerbeaPremierLeagueorChampionshipclubenteringattheThirdRoundstage,itwillreceiveatotalof£3.4minprizemoney.
Should The FA Cup winner be a Premier League or Championship club entering at the Third Round stage, it will receive a total of £3.4m in prize money alone.


13
• Gatereceiptsgeneratedoverthetenseasonsfrom2001/02to2010/11areestimatedtototalinexcessof£400m,averagingcirca£41mperseason,drivenbytotalattendancesof22.7moverthesameperiod.Thesefiguresrepresentthetotalamountspaidbyspectators,includingVAT.
• ThetotalofgatereceiptsforagivenseasonisdependentonthetotalnumberofmatchesandnumberofhometiesplayedbythelargerPremierLeagueclubs.
• FormatchesfromtheThirdRoundProperuptoandincludingtheSixthRoundProper,netgatereceiptsfromeachmatcharesplitbetweenthetwoteamsinvolved,the‘Pool’andTheFA.NetgatereceiptsarethetotaltickettakingsforthematchlessVATandcertaincosts,forexampletravellingandaccommodationexpensesofthevisitingclub.
• Paymentsintothe‘Pool’aredistributedtoPremierLeagueandFootballLeagueclubswhichparticipatedinthecompetition;paymentstoTheFAaresubsequentlydistributedtonon-leagueclubswhoparticipatedintheFirstRoundProperofthecompetition.
• PriortotheThirdRoundProperofthecompetitioneachteaminatiewillreceiveatleast47.5%ofthenetgatereceiptsfromthatmatch.ForanytieuptoandincludingtheSixthRoundProperanon-leagueclubwillreceiveaminimumof47.5%ofnetgatereceipts.
• ForclubsinthelowerleaguesoroutsidetheFootballLeagueitisoftenmorefinanciallyattractivetobedrawnaway,ratherthanathome,againstabigteambecauseTheFACup’smechanismfordistributinggatereceiptsallowstheawayteamtobenefitfromgreaterattendances.Thishasledtosomenon-leaguesidesgeneratingwellinexcessof£0.5mfromasinglematchwhendrawnawaytoatopPremierLeagueclub.
• ClubsfromthePremierLeagueandFootballLeaguereceive45%ofnetgatereceiptsformatchesplayedbetweentheThirdRoundProperandSixthRoundProperofTheFACup(42.5%inrespectofreplayedmatches).
• IntheSemiFinalandFinalclubsreceivealowerproportionofgatereceipts,howeverthisiscounteredbyhigherprizemoneypaymentsinthefinalroundsofthecompetition.
Gate receipts
FA Cup gate receipts generated by clubs 2001/02 – 2010/11 Season Gate receipts (£’m)
2001/02 34
2002/03 35
2003/04 38
2004/05 42
2005/06 37
2006/07 48
2007/08 42
2008/09 50
2009/10 39
2010/11 48
10yeartotal 413Note:figuresaregrossgatereceiptsincludingVATSource:TheFA,Deloitteanalysis

Gate receipts generated over the ten seasons from 2001/02 to 2010/11 are estimated to total in excess of £400m, averaging circa £41m per season.

15
Club case studies
Case Study: Stoke City – Premier League
• StokeCity’sFACupperformancesin2009/10and2010/11havetogethergeneratedcirca£6minrevenueandqualifiedtheclubforEuropeancompetitionforthefirsttimeinitshistory.
• StokeCityreachedtheSixthRoundProperofthe2009/10FACupbeatingArsenalandManchesterCity,whobothfinishedinthetopfiveofthePremierLeague.Theylosttoeventualwinners,andPremierLeaguechampions,Chelsea.Therungeneratedincomeofcirca£2.1m,4%oftheclub’stotalincomefortheyear.
• ThePotters’2009/10FACuprungeneratedprizemoneyof£0.3mfromwinsagainstYorkCity,ArsenalandManchesterCity.
• Thekeydriveroftheclub’srevenuesfromthecompetitionweregatereceipts,withfourmatchesagainsttopPremierLeagueclubs.StokeCity’sshareofthegatereceiptsfromthesefourgamesisestimatedtohavedeliveredover£1m.
• Additionally,Stoke’shighprofileoppositionresultedinthreeoftheclub’sfivematchesbeingtelevisedlive,generating£0.7minTVpayments.
• In2010/11,thePotterswentevenfurther,progressingtoTheFACupFinalforthefirsttimeintheclub’shistory,resultinginthereceiptofcirca£3.5minprizemoney,TVpayments,andgatereceipts.ThedefeatintheFinaltoManchesterCitywasprecededbya5-0winoverBoltonWanderers,thebiggestwinningmarginatthatstageofTheFACupsince1939.
• Prizemoneyin2010/11delivered£2.5m,including£1.8mfromtheSemiFinalandFinalalone.
• TVpaymentsof£0.3min2010/11weredrivenbylivecoverageoftheSixthRoundPropertieagainstWestHamUnited.TotalprizemoneyandTVpaymentscombinedwithgatereceiptsmeanthattheclub’sFACuprevenuesfromthe2010/11campaigntotalledcirca£3.5m.
• StokeCity’sparticipationinthe2011/12UEFAEuropaLeague,forwhichtheyqualifiedviaTheFACup,couldbeworthcirca£15minadditionalincomeifthePottersgoontoliftthetrophy.
Stoke City’s FA Cup run 2009/10Round Opposition H/A Score Attendance
R3 YorkCity H 3-1 15’586
R4 Arsenal H 3-1 19’735
R5 ManchesterCity A 1-1 28’019
R5replay ManchesterCity H 3-1 21’813
R6 Chelsea A 0-2 41’322
Income generated from Stoke City’s 2009/10 FA Cup runSource £m
Prizemoney 0.3
TVpayments 0.7
Gatereceipts 1.1
Total 2.1
Proportionofclub’sannualincome 4%Note:gatereceiptsrepresenttheamountsrecognisedbytheclubasrevenueSource:TheFA,club’sannualfinancialstatements,Deloitteanalysis

16
Case Study: Millwall – Championship
• In2004MillwallbecamethefirstteamoutsidethetopflightintwelveyearstoreachTheFACupFinal,withrevenuesfromthecompetitioncontributing29%oftotalrevenues.
• Ledbyplayer-managerDennisWise,MillwallenjoyedaruntoTheFACupFinalin2004,thefirstinitshistory,wheretheclubwasdefeatedbyManchesterUnited.Theclubreceivedprizemoney,TVpayments,andgatereceiptstotalling£2.9mfromTheFACup.
• Thebiggestcontributortowardsthis£2.9mrevenuefromTheFACupwasprizemoney,accountingfor£1.7m(68%)ofthetotal.TheSemiFinalvictoryagainstSunderlandgenerated£1minprizemoney,with£0.4mcomingfromtheSixthRoundProperwinagainstTranmereRovers.
• BothmatchesagainstTranmereRoversweretelevised,generating
£0.6mforMillwall.ReachingtheFinalwithouthavingfacedPremierLeagueoppositionmayhavehelpedtheclub’sprogressthroughthecompetition,althoughitdidn’treceiveanyTVpaymentspriortotheSixthRoundProperasnomatchesweretelevised.
• Theclub’sshareofgatereceiptsdeliveredcirca£0.6m,withcirca50%ofthatfigureattributabletotheSemiFinalagainstSunderlandatOldTrafford.ThetwomatchesagainstTranmereRoverstogethergeneratedcirca£0.2minrevenuefromgatereceipts.
• Over20,000MillwallfanswerereportedtohaveattendedeachoftheSemiFinalandFinal.
• Millwall’sperformanceinthe2003/04FACupearneditaplaceinthe2004/05UEFACup,theclub’sfirsteverparticipationinEuropeancompetition.TheywereeliminatedpriortothegroupstagebyHungariansideFerencvaros.
Millwalls FA Cup run 2003/04Round Opposition H/A Score Attendance
R3 Walsall H 2-1 6’977
R4 TelfordUnited A 2-0 5’589
R5 Burnley H 1-0 10’420
R6 TranmereRovers H 0-0 16’404
R6replay TranmereRovers A 2-1 15’510
SemiFinal Sunderland N 1-0 56’112
Final ManchestedUnited N 0-3 72’350Notes:SemiFinalplayedatOldTrafford,finalplayedatMilleniumStadiumSource:TheFA,SkySportsFootballYearbook,Deloitteanalysis
Income generated from Millwall’s 2003/04 FA Cup runSource £m
Prizemoney 1.7
TVpayments 0.6
Gatereceipts 0.6
Total 2.9
Proportionofclub’sannualincome 29%Note:gatereceiptsrepresenttheamountsrecognisedbytheclubasrevenueSource:TheFA,club’sannualfinancialstatements,Deloitteanalysis


18
Case Study: Leyton Orient – League One
• LeytonOrientreachedtheFifthRoundProperofthe2010/11FACupwheretheytookArsenaltoareplay.Therungeneratedcirca£1.4minrevenuescontributingcirca30%oftotalclubrevenuefortheyear.
• LeytonOrient’s2010/11FACuprunsawthembeattwoChampionshipsidesinNorwichCityandSwanseaCity,bothofwhomwentontowinpromotiontothePremierLeague.TheyweresubsequentlyknockedoutbyArsenalinaFifthRoundProperReplayattheEmiratesStadiuminfrontofalmost60,000fans.
• TherunhadlookedindoubtintheSecondRoundProperreplayathometoDroylsden,asOrientwere2-1downwithtwominutesofthe90remaining.Anequaliserinthedyingminutesledtoextra-timeduringwhichOrientfoundthenetsixtimes,producinganimprobable8-2victoryandaThirdRoundPropertieawaytoNorwichCity.
• ProgressionthroughtotheFifthRoundProperofTheFACupsawOrientgenerateover£0.2minprizemoney,whichaccountedfor15%ofthetotalrevenuesearnedfromtheclub’sFACuprun.
• Theclub’ssuccesssawthembroadcastliveonTVfourtimes–threetimesonESPNandonceonS4C,earningthem£0.5mofTVrevenue,withthetwomatchesagainstArsenalaccountingforalmost80%ofthistotal.
• ThehomematchagainstArsenalattractedanattendanceofalmostdoubletheclub’saveragehomeleagueattendancefortheseason.This,togetherwiththereplayattheEmiratesStadium,earnedtheclubcirca£0.5mingatereceiptrevenue,withanadditionalcirca£0.2mingaterevenuesgeneratedfromtheearlierrounds.Totalgatereceiptrevenuesofcirca£0.7maccountedfor50%oftheclub’sFACupincomefor2010/11.
• Priorto2010/11,theclubhadnotreachedtheFifthRoundProperofTheFACupsincetheirSemiFinalappearancein1978.
Leyton Orient’s FA Cup run 2010/11 Round Opposition H/A Score Attendance
R1 Dagenham&Redbridge A 1-1 3’378
R1replay Dagenham&Redbridge H 3-2 2’901
R2 Droylsden A 1-1 1’762
R2replay Droylsden H 8-2 1’345
R3 NorwichCity A 1-0 18’087
R4 SwanseaCity A 1-2 6’281
R5 Arsenal H 1-1 9’136
R5replay Arsenal A 0-5 59’361Source:TheFA,SkySportsFootballYearbook,Deloitteanalysis
Income generated from Leyton Orient’s 2010/11 FA Cup runSource £’000
Prizemoney 0.2
TVpayments 0.5
Gatereceipts 0.7
Total 1.4
Proportionofclub’sannualincome 30%Note:gatereceiptsrepresenttheamountsrecognisedbytheclubasrevenueSource:TheFA,club’sfinancialstatementsfor2009and2010,Deloitteanalysis

19
Case Study: Accrington Stanley – League Two
• AccringtonStanley’s2009/10FACupruntotheFourthRoundProperprovidedadditionalrevenueduringaseasoninwhichtheyfacedawindinguporderfromHMRC.
• AccringtonStanley’sFourthRoundPropertieagainstPremierLeagueFulhamwasthefirsttimesincetheclubwasre-formedinthelate1960’sthatithadprogressedthisfarinTheFACupcompetition,arunthatgeneratedcirca£150kinprizemoney,TVpaymentsandgatereceiptsfortheLeague2club.
• Theclubbenefittedfromprizemoneyof£113kresultingfromwinsagainstSalisburyCity(FootballConference,£18k),Barnet(League2,£27k)andGillingham(League1,£68k).
• AccringtonStanleygenerated£8kofrevenuefromthescreeningof
highlightsoftheclub’sFourthRoundPropertiewithFulham.
• Gatereceiptrevenueofcirca£30kwasgeneratedfromthefivematches,withcirca40%ofthisfigureestimatedtohavecomefromtheFourthRoundPropertieathometoFulham.
• The2009/10FACupruncameatatimeoffinancialuncertaintyfortheLeague2club,whohadacreditorinexcessof£0.3mpayabletoHMRCduringtheseason.
• AccringtonStanley’sCuprunisestimatedtohavedeliveredtheclub£150kinprizemoney,TVpaymentsandgatereceiptsequatingtocirca.10%oftheclub’srevenue.
• AccringtonStanleywentontofinish15thinLeague2in2009/10,aperformanceonwhichtheyimprovedin2010/11whentheclubfinishedin5thpositionthusreachingtheLeague2play-offs.
Accrington Stanley’s FA Cup run 2009/10 Round Opposition H/A Score Attendance
R1 Salisbury H 2-1 1’379
R2 Barnet H 2-2 1’501
R2replay Barnet A 1-0 1’288
R3 Gillingham H 1-0 1’322
R4 Fulham H 1-3 3’712Source:TheFA,SkySportsFootballYearbook,Deloitteanalysis
Income generated from Accrington Stanley’s 2009/10 FA Cup runSource £m
Prizemoney 0.11
TVpayments 0.01
Gatereceipts 0.03
Total 0.15
Proportionofclub’sannualincome 10%
Note:gatereceiptsrepresenttheamountsrecognisedbytheclubasrevenueSource:TheFA,Deloitteanalysis

20
Crawley Town• CrawleyTownweredrawnawayto
ManchesterUnitedinthe2010/11FACup.Theclub’srungeneratedcirca£1.5mofrevenue,withcirca£1mcomingfromthetieatOldTraffordalone–acombinationofgatereceiptsandTVpayments.Prizemoneytothenon-leagueclubtotalled£0.2m.
CrawleyTownweredrawnawaytoManchesterUnitedinthe2010/11FACup.Theclub’srungeneratedcirca£1.5mofrevenue,withcirca£1mcomingfromthetieatOldTraffordalone.
Case Study: Havant & Waterlooville – Conference South
Havant & Waterlooville• ProgressioninTheFACupby
clubsbelowtheFootballLeaguecandeliversubstantialfinancialbenefits,particularlyfromgatereceiptsandTVpaymentsshoulditdrawhighprofileopposition.
• Havant&WaterloovillereachedtheFourthRoundProperin2007/08,twicehavingledLiverpoolatAnfieldbeforefinallylosing5-2.
• Asaresultoftheirperformanceinthe2007/08FACup,Havant&Waterloovilleearnedcirca£0.6minprizemoney,TVpaymentsandgatereceipts,equatingtocirca70%oftheclub’sestimatedtotalrevenuesfortheyear.
• ProgressioninTheFACupbyclubsbelowtheFootballLeaguecandeliversubstantialfinancialbenefits,particularlyfromgatereceiptsandTVpaymentsshoulditdrawhighprofileopposition.
Burton Albion• In2005/06,BurtonAlbionforceda
replayagainstManchesterUnitedafteradrawathomeintheThirdRoundProper.Areported10,500BurtonfansmadethetriptoOldTraffordtoseetheirsidelose5-0totheclubplaced104leaguepositionsabovethem,agamewhichdeliveredcirca£0.5mingatereceiptrevenuetothenon-leagueclub.
• BothmatchesagainstManchesterUnitedwerebroadcastliveonTV,withtheclubearning£0.2minTVrevenues.Burton’sstrongFACupperformance,whichgeneratedtotalrevenuesofcirca£0.7m,wasfollowedbyitspromotiontotheFootballLeagueinthe2008/09season.

21
Havant & Waterlooville’s FA Cup run 2007/08 Round Opposition H/A Score Attendance
2Q BognorRegisTown A 2-1 426
3Q FleetTown H 2-1 386
4Q LeightonTown H 3-0 378
R1 YorkCity A 1-0 2’001
R2 NottsCounty A 1-0 3’810
R3 SwanseaCity A 1-1 8’761
R3replay SwanseaCity H 4-2 4’400
R4 Liverpool A 2-5 42’566
Source:TheFA,Deloitteanalysis
Income generated from Havant & Waterlooville’s 2007/08 FA Cup runSource £m
Prizemoney 0.1
TVpayments 0.0
Gatereceipts 0.5
Total 0.6
Proportionofclub’sannualincome 70%Note:gatereceiptsrepresenttheamountsrecognisedbytheclubasrevenueSource:TheFA,Deloitteanalysis

Burton’s strong FA Cup performance, which generated total revenues of circa £0.7m, was followed by its promotion to the Football League in the 2008/09 season.

23
Appendix 1: Limitations
Limitations
• Unlessotherwisestated,theinformationcontainedinthisreportanduponwhichitisbased,exceptwhereobtaineddirectlyfromTheFA,hasbeenobtainedfrompubliclyavailablefinancialstatements,websites,mediareportsandsportsbusinesspress/publications.Whilstallreasonablecarehasbeentakentoensurethatsuchinformationhasbeenaccuratelyextractedorderivedfromthesesources,neitherTheFAnorDeloittehavenotseparatelyverifiedtheinformation,norsoughttoestablishthereliabilityofthesources.
• Deloitte’sprocedureshavenotincludedauditorverificationwork.Deloittedonotexpressanyconclusionsoropinionsonanyinformationpresentedherein.
• Accordingly,neitherTheFAnorDeloitteacceptnoliabilityhoweversoarising,directlyorindirectly,fromanyerrororincompletenessoffactoropinioninthisdocumenttotheextentcausedbyinaccuraciesorincompletenessintheinformationonwhichDeloittehaverelied.
• Thisdocumenthasbeendevelopedbasedontheinformationavailableatthedateofthedocument.


Forfurtherinformation,pleasecontact:
MattPhillipsTheFACommunicationsDivisionTel:08449808200,Ext:4671E-mail:[email protected]
CharlieBossMarketingManager–TheFACupTheFACommercialDivisionTel:08449808200,Ext:6807E-mail:[email protected]