Embed Size (px)
Citation preview

ChangeWave Research: Consumer Spending
January Consumer Spending ReportExpectations and Confidence Rebound but January Consumer Spending Growth Lags
Jean Crumrine and Paul Carton
Overview: A January ChangeWave survey shows U.S. consumer expectations and confidence surging this month as Americans grow more upbeat about the overall direction of the economy. That said, spending growth is lower this month in comparison to the seasonal uptick we reported in December. ChangeWave Research is a service of 451 Research.
In the aftermath of the holidays, consumer electronics spending has slowed this month. Restaurant spending is also registering a seasonal decline.
The January 2-15 survey of 2,385 U.S. consumers shows the fiscal cliff tax resolution earlier this month is causing one-in-three respondents (35%) to say they’ll spend less as a result. Much of this is likely attributable to the 2% pay cut Americans are feeling as the 2010 Social Security payroll tax holiday expires.
Surge in Consumer Expectations and Confidence The good news for January is a positive jump in consumer expectations and confidence – both bouncing back from the downticks we had picked up in December.
Consumer Expectations. A total of 27% of respondents think the overall direction of the U.S. economy will improve over the next 90 days, 8-pts better than a month ago. And while 32% still believe it will worsen – that’s a major 15-pt improvement from December.
This information is from ChangeWave Research, a service of 451 Research, LLC, and contains confidential business information.It may not be copied or distributed without permission. ©2013 451 Research, LLC. All rights reserved.
January 23, 2013

ChangeWave Research: Consumer SpendingStock Market Confidence. Similarly, 28% now say they’re More Confident in the stock market than they were 90 days ago – a 12-pt jump since December. Three-in-ten (31%) say they’re Less Confident, but that’s a huge 18-pt improvement from previously. All-told it’s an extraordinary 30-pt upswing since the previous survey.
Importantly, these are the best readings for consumer expectations and confidence in nine months.
We also asked respondents about their investing plans, and U.S. Stocks (+4; up 6-pts) are registering a net money inflow, as are Non-U.S. Stocks (+7; up 8-pts).
Spending Outlook for JanuaryThe consumer picture looks different when it comes to actual spending. One-in-five (22%) U.S. respondents say they'll spend more over the next 90 days than they did a year ago – down 5-pts since our December holiday survey. Another 35% say they'll spend less, 3-pts worse than previously.
This information is from ChangeWave Research, a service of 451 Research, LLC, and contains confidential business information.It may not be copied or distributed without permission. ©2013 451 Research, LLC. All rights reserved.
2

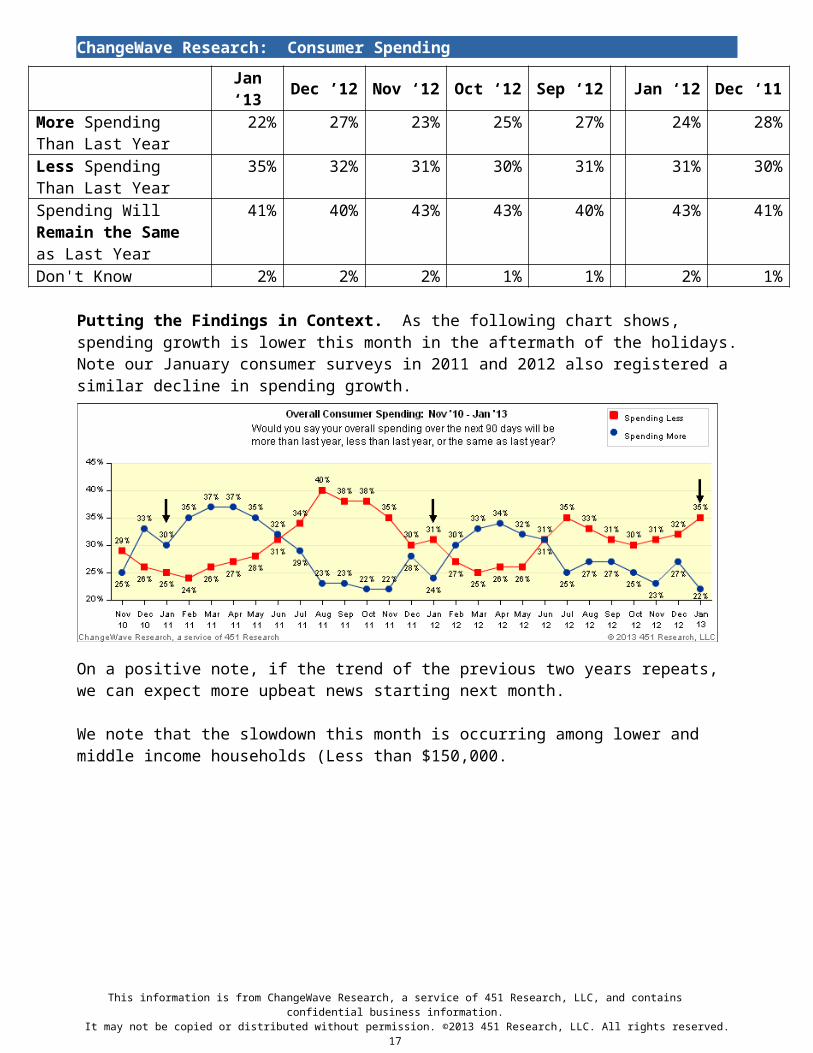
ChangeWave Research: Consumer SpendingPutting the Findings in Context. As the following chart shows, spending growth is lower this month in the aftermath of the holidays. Note our January consumer surveys in 2011 and 2012 also registered a similar decline in spending growth.
On a positive note, if the trend of the previous two years repeats, we can expect more upbeat news starting next month.
Individual Spending Categories
In the aftermath of the holidays, Consumer Electronics spending has slowed this month – with 15% saying they’ll spend more on electronics going forward and 31% less. While this represents a major 13-pt decline since December, it’s still better than the 16-pt seasonal drop of a year ago.
Restaurant spending is also registering a seasonal decline – down a net 7-pts in January. In other categories, Durable Goods has declined 1-pt since December, but Travel/ Vacation, Autos and Household Repairs are each up 1-pt.
Year-to-Year Comparison of Change in Net Difference Scores: January 2013 vs. January 2012January
2013 Change in
Net Difference
Score(Jan ’13 vs.
Dec ’12)
January 2012
Change in Net
Difference Score
(Jan ’12 vs.Dec ’11)
Healthcare Services +3 +2Household Repairs/Improvements +1 +2Automobile Purchase +1 0Travel/Vacation +1 +1Durable Goods for the Home -1 -2Restaurants/Everyday Entertainment -7 -3Consumer Electronics -13 -16
We note that Healthcare Services has jumped 3-pts this month.
This information is from ChangeWave Research, a service of 451 Research, LLC, and contains confidential business information.It may not be copied or distributed without permission. ©2013 451 Research, LLC. All rights reserved.
3

ChangeWave Research: Consumer Spending
Fiscal Cliff Issue Continues to Pose ThreatPrevious ChangeWave reports have shown fiscal cliff uncertainty was having a damaging impact on the U.S. consumer economy. But now that Congress has passed a last minute tax deal that at least temporarily averts the fiscal cliff, what if anything has changed?
To find out, we asked consumers how the new tax agreement was impacting their discretionary spending.
Thinking about your own discretionary spending over the next 90 days, does the Congressional agreement on taxes make you more likely to increase your discretionary spending, decrease your discretionary spending, or is it having no impact on your discretionary spending over the next 90 days?
Current Survey Jan ‘13
More Likely to Decrease Spending for Next 90 Days Because Fiscal Cliff Agreement
35%
More Likely to Increase Spending for Next 90 Days Because of Fiscal Cliff Agreement
4%
No Impact on My Spending for Next 90 Days 58%Don’t Know 4%
Worryingly, 35% say they’re more likely to Decrease spending for the next 90 days because of the Congressional fiscal cliff agreement. Only 4% say Increase.
Clearly, the January 1st agreement hasn’t done much thus far to ease consumer concerns regarding the fiscal cliff. Much of this is likely attributable to the 2% pay cut Americans are feeling as the 2010 Social Security payroll tax holiday expires.
Above and beyond the tax issue, there are other major economic issues that have yet to be addressed – including government spending cuts, the U.S. debt ceiling, and passage of a federal budget.
Bottom line, despite or even possibly because of the January 1st agreement on taxes, consumers say they’re holding back on their actual spending – and the fiscal cliff issue continues to have a negative impact on the consumer economy.
Retailer TrendsIn the aftermath of the holidays, our January survey shows few signs of momentum among major retailers.
Costco (COST) is down 3-pts from December, although spending growth remains slightly higher than a year ago and it still leads the other major retailers going forward.
Walmart (WMT) is seeing a 2-pt decline in growth this month. It’s now at the exact same level it was a year ago.
Target (TGT) is the biggest decliner of all the major retailers – dropping 5-pts this month. Other retailers that are slowing include Kohl’s (KSS; down 4-pts), Bed, Bath and Beyond (BBBY; down 4-pts), Macy’s (M; down 3-pts), Sears (SHLD; down 2-pts) and TJ Maxx (TJX; down 2-pts).
This information is from ChangeWave Research, a service of 451 Research, LLC, and contains confidential business information.It may not be copied or distributed without permission. ©2013 451 Research, LLC. All rights reserved.
4

ChangeWave Research: Consumer Spending
Home Entertainment and Online Shopping Apple (AAPL) is off 3-pts from its December all-time high in the home entertainment market, with 22% saying they'll buy home entertainment products at Apple over the next 90 days.
Amazon (AMZN) is also down 3-pts from its all-time high last month on the home entertainment retail front. Nonetheless, the 48% who say they’ll shop at Amazon for home entertainment and computer networking products is the second highest we’ve seen.
Best Buy (BBY; 28%; down 2-pts) has suffered its second consecutive drop – and is now showing one of their weakest readings ever.
Online Shopping. When we asked consumers the percentage of total retail purchases they’d be making online, they reported online buying would account for 23% of their retail purchases – up from 21% a year ago.
This information is from ChangeWave Research, a service of 451 Research, LLC, and contains confidential business information.It may not be copied or distributed without permission. ©2013 451 Research, LLC. All rights reserved.
5

ChangeWave Research: Consumer SpendingWe also asked shoppers where they'd be spending their online shopping dollars over the next 90 days:
For each of the following websites, please tell us if you will be spending more money, about the same amount, or less money over the next 90 days compared with the previous 90 days.
MoreMoney
LessMoney
Net Score
SameAmount of
MoneyNo
Money
Amazon.com 18% 13% +5 50% 15%Costco.com 3% 3% 0 16% 67%Samsclub.com 1% 3% -2 5% 78%Yahoo! Shopping 0% 2% -2 4% 80%Sears.com 1% 3% -2 6% 77%Target.com 1% 4% -3 10% 71%Overstock.com 1% 4% -3 6% 75%Walmart.com 1% 5% -4 13% 68%eBay.com 3% 9% -6 24% 52%Best Buy.com 2% 9% -7 14% 63%
With nearly one-in-five consumers (18%) saying they’ll spend more money online at Amazon, the industry leader continues to dwarf all other online retailers.
We also took a closer look at Amazon’s Prime subscription service and found two-thirds (67%) of respondents who subscribe say they’re Very Satisfied with their subscription. Another 30% say they’re Somewhat Satisfied. Importantly, nine-in-ten (89%) say they’re likely to renew their subscription when it expires (63% Very Likely; 26% Somewhat Likely) – up 5-pts since October.
Bottom Line: The good news is consumer confidence and expectations are surging in the first month of 2013 – bouncing back from last month’s decline. That said, spending growth is lower this month after the seasonal uptick we reported in December.
Importantly, the January 1st fiscal cliff tax resolution has resulted in one-in-three respondents (35%) saying they’re going to spend less because of it. Much of this is likely attributable to the 2% pay cut Americans are feeling as the 2010 Social Security payroll tax holiday expires.
This information is from ChangeWave Research, a service of 451 Research, LLC, and contains confidential business information.It may not be copied or distributed without permission. ©2013 451 Research, LLC. All rights reserved.
6

ChangeWave Research: Consumer Spending
Summary of Key Findings
The ChangeWave Research Network is a group of 25,000 highly qualified business, technology, and medical professionals in leading companies of select industries—credentialed professionals who spend their everyday lives working on the frontline of technological change. ChangeWave surveys its Alliance members on a range of business and investment research and intelligence topics, collects feedback from them electronically, and converts the information into proprietary quantitative and qualitative reports.
This information is from ChangeWave Research, a service of 451 Research, LLC, and contains confidential business information.It may not be copied or distributed without permission. ©2013 451 Research, LLC. All rights reserved.
7
… But January U.S. Consumer Spending Growth Lags Only 22% of say they’ll
spend More Money over next 90 days than year ago – down 5-pts since December
35% say they’ll spend Less Money – 3-pts worse
Electronics and Restaurant Spending Slows Consumer Electronics (-13) Restaurants (-7)
Other Categories Hold Steady Household Repairs (+1) Travel Vacation (+1) Autos (+1) Durable Goods (-1)
Fiscal Cliff Issue Still Having Negative Impact on Consumer Economy 35% say they’re more likely to
Decrease spending during next 90 days because of fiscal cliff agreement
Retail Store TrendsMost Down After the Holidays Costco (down 3-pts) still leads
in terms of spending growth Walmart (down 2-pts) TJ Maxx (down 2-pts) Sears (down 2-pts) Macy’s (down 3-pts) Bed, Bath&Beyond (down 4-
pts) Kohl’s (down 4-pts) Target (down 5-pts)
Home Entertainment Shopping Amazon (48%) down 3-pts
from December all-time high Apple (22%) also down 3-pts
from Dec all-time high
Surge in Consumer Expectations and Confidence …Consumer Expectations 27% of U.S. respondents
believe the overall direction of economy will improve over next 90 days – up 8-pts since December
While 32% still believe overall direction of U.S. economy will worsen – that’s a major 15-pt improvement
Confidence in Stock Market 28% now say they’re More
Confident in U.S. stock market and 31% Less Confident
An extraordinary 30-pt upswing since last month

ChangeWave Research: Consumer Spending
Table of Contents
Summary of Key Findings.............................................................................................7
The Findings...................................................................................................................9
(A) Consumer Expectations and Confidence...............................................................9
(B) Overall U.S. Consumer Spending.........................................................................11
(C) Individual Consumer Spending Categories..........................................................13
(D) Fiscal Cliff Issue...................................................................................................15
(E) Overall Retailer Trends.........................................................................................16
(F) Home Entertainment and Online Shopping..........................................................18
(G) Impact of the Economy on Investors....................................................................22
(H) Reasons Given By Consumers Who Are Spending Less ....................................23
ChangeWave Research Methodology........................................................................24
About ChangeWave Research....................................................................................24
About 451 Research.....................................................................................................24
This information is from ChangeWave Research, a service of 451 Research, LLC, and contains confidential business information.It may not be copied or distributed without permission. ©2013 451 Research, LLC. All rights reserved.
8

ChangeWave Research: Consumer Spending
The Findings
Introduction: A January ChangeWave survey shows U.S. consumer expectations and confidence surging this month as Americans grow more upbeat about the overall direction of the economy. That said, spending growth is lower this month in comparison to the seasonal uptick we reported in December. ChangeWave Research is a service of 451 Research.
In the aftermath of the holidays, consumer electronics spending has slowed this month. Restaurant spending is also registering a seasonal decline.
The January 2-15 survey of 2,385 U.S. consumers shows the fiscal cliff tax resolution earlier this month is causing one-in-three respondents (35%) to say they’ll spend less as a result. Much of this is likely attributable to the 2% pay cut Americans are feeling as the 2010 Social Security payroll tax holiday expires.
(A) A Surge in Consumer Expectations and Confidence
The good news for January is a positive jump in consumer expectations and confidence – both bouncing back from the downticks we had picked up in December.
Consumer Expectations. A total of 27% of respondents think the overall direction of the U.S. economy will improve over the next 90 days, 8-pts better than a month ago. And while 32% still believe it will worsen – that’s a major 15-pt improvement from December.
This information is from ChangeWave Research, a service of 451 Research, LLC, and contains confidential business information.It may not be copied or distributed without permission. ©2013 451 Research, LLC. All rights reserved.
9

ChangeWave Research: Consumer SpendingIn your opinion, which of the following statements best describes the overall direction of the economy over the next 90 days?
Current Survey Jan ‘13
Previous Survey Dec ’12
Previous Survey Nov ‘12
Previous Survey Oct ‘12
Previous Survey Sep ‘12
Previous Survey Jan ‘12
PreviousSurveyDec ‘11
The economy is going to improve over the next 90 days
27% 19% 22% 19% 17% 30% 23%
The economy is going to worsen over the next 90 days
32% 47% 40% 42% 44% 25% 35%
The economy is going to remain the same over the next 90 days
39% 31% 36% 39% 38% 44% 40%
Stock Market Confidence. Similarly, 28% now say they’re More Confident in the stock market than they were 90 days ago – a 12-pt jump since December. Three-in-ten (31%) say they’re Less Confident, but that’s a huge 18-pt improvement from previously. All-told it’s an extraordinary 30-pt upswing since the previous survey.
Are you now more or less confident in the U.S. stock market compared to 90 days ago?
Current Survey Jan ‘13
Previous Survey Dec ’12
Previous Survey Nov ‘12
Previous Survey Oct ‘12
Previous Survey Sep ‘12
Previous Survey Jan ‘12
PreviousSurveyDec ‘11
More Confident Than 90 Days Ago
28% 16% 14% 19% 20% 33% 21%
Less Confident Than 90 Days Ago
31% 49% 46% 41% 38% 21% 39%
No Change 37% 29% 35% 35% 39% 42% 36%Don't Know 4% 4% 4% 5% 4% 4% 4%
Importantly, these are the best readings for consumer expectations and confidence in nine months.
This information is from ChangeWave Research, a service of 451 Research, LLC, and contains confidential business information.It may not be copied or distributed without permission. ©2013 451 Research, LLC. All rights reserved.
10

ChangeWave Research: Consumer Spending
(B) Overall U.S. Consumer Spending The consumer picture looks different when it comes to actual spending. One-in-five (22%) U.S. respondents say they'll spend more over the next 90 days than they did a year ago – down 5-pts since our December holiday survey. Another 35% say they'll spend less, 3-pts worse than previously.
Would you say your overall spending over the next 90 days will be more than last year, less than last year, or the same as last year?
Current Survey Jan ‘13
Previous Survey Dec ’12
Previous Survey Nov ‘12
Previous Survey Oct ‘12
Previous Survey Sep ‘12
Previous Survey Jan ‘12
PreviousSurveyDec ‘11
More Spending Than Last Year
22% 27% 23% 25% 27% 24% 28%
Less Spending Than Last Year
35% 32% 31% 30% 31% 31% 30%
Spending Will Remain the Same as Last Year
41% 40% 43% 43% 40% 43% 41%
Don't Know 2% 2% 2% 1% 1% 2% 1%
Putting the Findings in Context. As the following chart shows, spending growth is lower this month in the aftermath of the holidays. Note our January consumer surveys in 2011 and 2012 also registered a similar decline in spending growth.
This information is from ChangeWave Research, a service of 451 Research, LLC, and contains confidential business information.It may not be copied or distributed without permission. ©2013 451 Research, LLC. All rights reserved.
11

ChangeWave Research: Consumer Spending
On a positive note, if the trend of the previous two years repeats, we can expect more upbeat news starting next month.
We note that the slowdown this month is occurring among lower and middle income households (Less than $150,000.
Current Survey (Jan 2013) – Breakdown by Income Levels
TotalLessThan
$100,000
$100,001-
$150,000
Greater Than
$150,000More Spending Than Last Year 22% 19% 22% 26%Less Spending Than Last Year 35% 36% 33% 33%Spending Will Remain the Same as Last Year
41% 41% 43% 40%
This information is from ChangeWave Research, a service of 451 Research, LLC, and contains confidential business information.It may not be copied or distributed without permission. ©2013 451 Research, LLC. All rights reserved.
12

ChangeWave Research: Consumer Spending
(C) Individual Consumer Spending Categories
Which of the following consumer items will you be spending more money on over the next 90 days compared to last year? (Check All That Apply)
Current Survey Jan ’13
Previous Survey Dec ’12
Previous Survey Nov ‘12
Previous Survey Oct ‘12
Previous Survey Sep ‘12
Previous Survey Jan ‘12
PreviousSurveyDec ‘11
Household Repairs/ Improvements
27% 28% 27% 30% 31% 28% 26%
Travel/Vacation 21% 22% 22% 23% 24% 22% 22%Healthcare Services 16% 14% 13% 13% 13% 16% 14%Consumer Electronics 15% 24% 24% 16% 16% 16% 28%Durable Goods for the Home 12% 13% 12% 11% 12% 11% 12%Restaurants/Everyday Entertainment
10% 14% 14% 11% 11% 11% 14%
Children's Services (e.g. camp, education, lessons, other activities)
7% 6% 7% 6% 7% 7% 6%
Automobile Purchase 6% 6% 6% 6% 6% 6% 6%Other Services (e.g. adult education, fitness activities)
4% 4% 4% 4% 4% 4% 4%
And which of the following consumer items will you be spending less money on over the next 90 days than last year? (Check All That Apply)
Current Survey Jan ’13
Previous Survey Dec ’12
Previous Survey Nov ‘12
Previous Survey Oct ‘12
Previous Survey Sep ‘12
Previous Survey Jan ‘12
PreviousSurveyDec ‘11
Consumer Electronics 31% 27% 29% 28% 30% 31% 27%Restaurants/Everyday Entertainment
29% 26% 26% 29% 29% 28% 28%
Travel/Vacation 25% 27% 29% 27% 27% 26% 27%Durable Goods for the Home 23% 23% 23% 24% 24% 22% 21%Automobile Purchase 20% 21% 20% 19% 19% 21% 21%Household Repairs/ Improvements
14% 16% 15% 14% 16% 15% 15%
Healthcare Services 6% 7% 7% 7% 7% 7% 7%Children's Services (e.g. camp, education, lessons, other activities)
6% 8% 8% 7% 7% 7% 7%
Other Services (e.g. adult education, fitness activities)
6% 8% 8% 6% 8% 7% 7%
This information is from ChangeWave Research, a service of 451 Research, LLC, and contains confidential business information.It may not be copied or distributed without permission. ©2013 451 Research, LLC. All rights reserved.
13

ChangeWave Research: Consumer SpendingChange in Net Difference Score - Current Survey (Jan 2013) vs. Previous Survey (Dec 2012)
CurrentSurvey
Net Difference
Score(Jan ’13)
PreviousSurvey
Net Difference
Score(Dec ’12)
Change in Net
Difference Score
Healthcare Services +10 +7 +3Children’s Services (e.g. camp, education, lessons, other activities)
+1 -2 +3
Other Services (e.g. adult education, health and fitness activities)
-2 -5 +3
Household Repairs/Improvements +13 +12 +1Automobile Purchase -14 -15 +1Travel/Vacation -4 -5 +1Durable Goods for the Home -11 -10 -1Restaurants/Everyday Entertainment -19 -12 -7Consumer Electronics -16 -3 -13
In the aftermath of the holidays, Consumer Electronics spending has slowed this month – with 15% saying they’ll spend more on electronics going forward and 31% less. While this represents a major 13-pt decline since December, it’s still better than the 16-pt seasonal drop of a year ago.
Restaurant spending is also registering a seasonal decline – down a net 7-pts in January. In other categories, Durable Goods has declined 1-pt since December, but Travel/ Vacation, Autos and Household Repairs are each up 1-pt.
Year-to-Year Comparison of Change in Net Difference Scores: January 2013 vs. January 2012January
2013 Change in
Net Difference
Score(Jan ’13 vs.
Dec ’12)
January 2012
Change in Net
Difference Score
(Jan ’12 vs.Dec ’11)
Healthcare Services +3 +2Household Repairs/Improvements +1 +2Automobile Purchase +1 0Travel/Vacation +1 +1Durable Goods for the Home -1 -2Restaurants/Everyday Entertainment -7 -3Consumer Electronics -13 -16
We note that Healthcare Services has jumped 3-pts this month.
This information is from ChangeWave Research, a service of 451 Research, LLC, and contains confidential business information.It may not be copied or distributed without permission. ©2013 451 Research, LLC. All rights reserved.
14

ChangeWave Research: Consumer Spending
(D) Fiscal Cliff Issue Continues to Pose Threat
Previous ChangeWave reports have shown fiscal cliff uncertainty was having a damaging impact on the U.S. consumer economy. But now that Congress has passed a last minute tax deal that at least temporarily averts the fiscal cliff, what if anything has changed?
To find out, we asked consumers how the new tax agreement was impacting their discretionary spending.
On January 1st, Congress reached an agreement addressing key "Fiscal Cliff" tax issues. Thinking about your own discretionary spending over the next 90 days, does this Congressional agreement on taxes make you more likely to increase your discretionary spending, decrease your discretionary spending, or is it having no impact on your discretionary spending over the next 90 days?
Current Survey Jan ‘13
More Likely to Decrease Spending for Next 90 Days Because Fiscal Cliff Agreement
35%
More Likely to Increase Spending for Next 90 Days Because of Fiscal Cliff Agreement
4%
No Impact on My Spending for Next 90 Days 58%Don’t Know 4%
Worryingly, 35% say they’re more likely to Decrease spending for the next 90 days because of the Congressional fiscal cliff agreement. Only 4% say Increase.
Clearly, the January 1st agreement hasn’t done much thus far to ease consumer concerns regarding the fiscal cliff. Much of this is likely attributable to the 2% pay cut Americans are feeling as the 2010 Social Security payroll tax holiday expires.
Above and beyond the tax issue, there are other major economic issues that have yet to be addressed – including government spending cuts, the U.S. debt ceiling, and passage of a federal budget.
Bottom line, despite or even possibly because of the January 1st agreement on taxes, consumers say they’re holding back on their actual spending – and the fiscal cliff issue continues to have a negative impact on the consumer economy.
This information is from ChangeWave Research, a service of 451 Research, LLC, and contains confidential business information.It may not be copied or distributed without permission. ©2013 451 Research, LLC. All rights reserved.
15

ChangeWave Research: Consumer Spending
(E) Overall Retailer Trends
In the aftermath of the holidays, our January survey shows few signs of momentum among major retailers.
Costco (COST) is down 3-pts from December, although spending growth remains slightly higher than a year ago and it still leads the other major retailers going forward.
Walmart (WMT) is seeing a 2-pt decline in growth this month. It’s now at the exact same level it was a year ago.
Target (TGT) is the biggest decliner of all the major retailers – dropping 5-pts this month. Other retailers that are slowing include Kohl’s (KSS; down 4-pts), Bed, Bath and Beyond (BBBY; down 4-pts), Macy’s (M; down 3-pts), Sears (SHLD; down 2-pts) and TJ Maxx (TJX; down 2-pts).
This information is from ChangeWave Research, a service of 451 Research, LLC, and contains confidential business information.It may not be copied or distributed without permission. ©2013 451 Research, LLC. All rights reserved.
16
ChangeWave Research: Consumer SpendingWe want to learn more about how consumers will be spending their shopping dollars over the next 90 days. For each of the following stores, please tell us if you will be spending more money, about the same amount, or less money over the next 90 days compared with the previous 90 days.
MoreMoney
SameAmoun
t ofMoney
LessMoney
NetScore
MonthlyChange
FromDec ‘12
Year-to-Year
ChangeFrom
Jan ‘12
NoMoney
Sam's Club 4% 19% 4% 0 0 +1 64%Dillard's 1% 9% 4% -3 -1 0 76%Nordstrom 2% 14% 6% -4 -1 0 69%K-Mart 1% 15% 7% -6 -1 0 68%JC Penney 1% 20% 9% -8 -1 0 60%BJ's Wholesale Club 1% 6% 2% -1 -2 0 81%Walmart 8% 48% 10% -2 -2 0 26%Bloomingdale's 0% 4% 3% -3 -2 -1 83%Ross 1% 12% 4% -3 -2 -1 73%T.J. Maxx 2% 19% 6% -4 -2 -1 63%Sears 2% 23% 12% -10 -2 -1 54%Costco 10% 36% 6% +4 -3 +1 42%Macy's 4% 27% 11% -7 -3 +1 49%Bed, Bath & Beyond 3% 29% 10% -7 -4 0 50%Kohl's 4% 28% 11% -7 -4 0 48%Target 7% 47% 12% -5 -5 0 26%
This information is from ChangeWave Research, a service of 451 Research, LLC, and contains confidential business information.It may not be copied or distributed without permission. ©2013 451 Research, LLC. All rights reserved.
17

ChangeWave Research: Consumer Spending
(F) Home Entertainment and Online Shopping
Apple (AAPL) is off 3-pts from its December all-time high in the home entertainment market, with 22% saying they'll buy home entertainment products at Apple over the next 90 days.
Amazon (AMZN) is also down 3-pts from its all-time high last month on the home entertainment retail front. Nonetheless, the 48% who say they’ll shop at Amazon for home entertainment and computer networking products is the second highest we’ve seen.
Best Buy (BBY; 28%; down 2-pts) has suffered its second consecutive drop – and is now showing one of their weakest readings ever.
This information is from ChangeWave Research, a service of 451 Research, LLC, and contains confidential business information.It may not be copied or distributed without permission. ©2013 451 Research, LLC. All rights reserved.
18

ChangeWave Research: Consumer SpendingHere are the complete results for home entertainment shopping retailers:
Over the next 90 days, which of the following stores do you think you and your family will shop at for home entertainment and computer/ networking products? (Choose No More Than Three)
Current
Survey Jan ‘13
Previous Survey Dec ’12
Previous Survey Nov ‘12
Previous Survey Oct ‘12
Previous Survey Sep ‘12
Previous Survey Jan ‘12
PreviousSurveyDec ‘11
Amazon 48% 51% 47% 45% 44% 46% 47%Best Buy 28% 30% 33% 27% 27% 30% 35%Apple 22% 25% 24% 22% 24% 20% 21%Costco 19% 21% 24% 21% 22% 20% 23%Walmart 11% 12% 12% 12% 11% 13% 12%Staples 8% 9% 7% 9% 9% 10% 9%Fry's Electronics 7% 7% 8% 7% 7% 7% 8%Newegg 7% 8% 6% 7% 6% 7% 7%eBay 6% 7% 7% 7% 7% 7% 7%Sam's Club 6% 7% 8% 6% 7% 7% 7%Office Depot 5% 4% 4% 5% 5% 5% 5%Target 5% 5% 5% 4% 5% 4% 5%TigerDirect 5% 5% 6% 5% 5% 5% 5%Micro Center 3% 3% 3% 3% 3% 3% 3%OfficeMax 3% 2% 2% 2% 2% 3% 2%BJ's Wholesale Club 2% 2% 2% 2% 2% 2% 2%Buy.com 2% 2% 2% 2% 2% 3% 3%Dell Online 2% 2% 2% 3% 2% 2% 2%FutureShop 2% 3% 2% 3% 2% 2% 3%Radio Shack 2% 2% 2% 1% 2% 2% 2%hhgregg 1% 2% 2% 2% 2% 2% NAOther 6% 5% 5% 5% 5% 5% 5%
This information is from ChangeWave Research, a service of 451 Research, LLC, and contains confidential business information.It may not be copied or distributed without permission. ©2013 451 Research, LLC. All rights reserved.
19

ChangeWave Research: Consumer SpendingOnline Shopping. When we asked consumers the percentage of total retail purchases they’d be making online, they reported online buying would account for 23% of their retail purchases – up from 21% a year ago.
And over the next 90 days, what percentage of your total retail purchases do you think you'll make online?
Online Buying as a Percentage of Total
Retail Purchases
Current SurveyJan ‘13
PreviousSurveyJan ‘12
Consensus Estimate 22.8% 20.6%
We also asked shoppers where they'd be spending their online shopping dollars over the next 90 days:
We want to learn more about how Alliance members will be spending their online shopping dollars over the next 90 days. For each of the following websites, please tell us if you will be spending more money, about the same amount, or less money over the next 90 days compared with the previous 90 days.
MoreMoney
LessMoney
Net Score
SameAmount of
MoneyNo
Money
Amazon.com 18% 13% +5 50% 15%Costco.com 3% 3% 0 16% 67%Samsclub.com 1% 3% -2 5% 78%Yahoo! Shopping 0% 2% -2 4% 80%Sears.com 1% 3% -2 6% 77%Target.com 1% 4% -3 10% 71%Overstock.com 1% 4% -3 6% 75%Walmart.com 1% 5% -4 13% 68%eBay.com 3% 9% -6 24% 52%Best Buy.com 2% 9% -7 14% 63%
With nearly one-in-five consumers (18%) saying they’ll spend more money online at Amazon, the industry leader continues to dwarf all other online retailers.
This information is from ChangeWave Research, a service of 451 Research, LLC, and contains confidential business information.It may not be copied or distributed without permission. ©2013 451 Research, LLC. All rights reserved.
20

ChangeWave Research: Consumer SpendingWe also took a closer look at Amazon’s Prime subscription service and found two-thirds (67%) of respondents who subscribe say they’re Very Satisfied with their subscription. Another 30% say they’re Somewhat Satisfied.
How satisfied are you with your Amazon Prime subscription?
Amazon PrimePaid
Subscribers
CurrentSurveyJan ‘13
Amazon PrimePaid
SubscribersPreviousSurveyOct ‘12
Very Satisfied 67% 61%
Somewhat Satisfied 30% 36%
Somewhat Unsatisfied 2% 1%
Very Unsatisfied 0% 1%
Don’t Know 1% 2%
Importantly, nine-in-ten (89%) say they’re likely to renew their subscription when it expires (63% Very Likely; 26% Somewhat Likely) – up 5-pts since October.
And how likely are you to renew your Amazon Prime subscription when it expires?
Amazon PrimePaid
SubscribersCurrentSurveyJan ‘13
Amazon PrimePaid
SubscribersPreviousSurveyOct ‘12
Very Likely 63% 60%
Somewhat Likely 26% 24%
Somewhat Unlikely 3% 4%
Very Unlikely 2% 3%
Don’t Know 8% 9%
This information is from ChangeWave Research, a service of 451 Research, LLC, and contains confidential business information.It may not be copied or distributed without permission. ©2013 451 Research, LLC. All rights reserved.
21

ChangeWave Research: Consumer Spending
(G) Impact of the Economy on Investors
We also asked respondents about their investing plans, and U.S. Stocks (+4; up 6-pts) are registering a net money inflow, as are Non-U.S. Stocks (+7; up 8-pts).
In light of recent events, will you be investing more money or less money going forward in each of the following vehicles?
Here’s the complete breakdown:
More Money
Less Money
Net Score
Change in Net Score
Same Amoun
t of Money
No Money
Non-U.S. Stocks 18% 11% +7 +8 37% 26%U.S. Stocks 19% 15% +4 +6 49% 13%Mutual Funds 6% 7% -1 +4 37% 40%Real Estate 10% 3% +7 +2 23% 52%ETFs 11% 7% +4 +2 33% 39%Currencies 3% 2% +1 +2 11% 71%Equity Options 8% 6% +2 +1 19% 58%Index Options 4% 5% -1 +1 13% 67%High-Yield/ Income/ Dividend Focused Vehicles
15% 4% +11 0 28% 42%
Other Commodities 7% 4% +3 -1 18% 58%Short-Side Investments (stocks, ETFs, etc.)
7% 5% +2 -1 14% 61%
CDs (Certificates of Deposit) 1% 5% -4 -1 13% 68%Bonds 4% 10% -6 -1 24% 52%Money Market Funds 4% 11% -7 -2 34% 40%Going to Cash 13% 9% +4 -3 35% 31%Gold 12% 4% +8 -4 22% 51%
This information is from ChangeWave Research, a service of 451 Research, LLC, and contains confidential business information.It may not be copied or distributed without permission. ©2013 451 Research, LLC. All rights reserved.
22

ChangeWave Research: Consumer Spending
(H) Reasons Given By Consumers Who Are Spending Less
Our January survey shows a jump in the percentage of consumers spending less because they’re Saving More Money (31%) – up 4-pts since December. Reducing Debt (29%; up 2-pts) has also registered an uptick as a reason for why consumers say they are spending less.
Here’s the complete breakdown of reasons given by consumers who are spending less:
For those who will be spending less than last year, what are the most important reasons why? (Choose No More Than Three)
Reasons Given By Respondents Spending Less
Current Survey Jan ’13
Previous SurveyDec ’12
Previous SurveyNov ‘12
Previous SurveyOct ‘12
Previous SurveySep ‘12
PreviousSurveyJan ‘12
PreviousSurveyDec ‘11
Cost of Living/InflationInflation/Increase in Cost of Living 32% 34% 37% 39% 35% 31% 32%Higher Energy Costs 12% 11% 19% 22% 22% 14% 14%Medical Expenses 12% 12% 11% 12% 11% 13% 13%Education Expenses 7% 6% 7% 7% 8% 7% 6%Trying to Improve Personal FinancesReducing Debt 29% 27% 27% 28% 28% 29% 28%Saving More Money 31% 27% 25% 28% 28% 27% 32%Investing More Money 9% 7% 7% 8% 7% 9% 8%Big Ticket Purchases/ExpensesHome Improvement Expenses 9% 8% 8% 9% 10% 10% 10%Recent Purchase of Big Ticket Item(s) 10% 8% 7% 7% 9% 12% 8%Purchased New Home 1% 3% 2% 2% 2% 2% 2%Mortgage/Home Equity CostsMortgage Payment Increased 3% 3% 3% 2% 3% 3% 4%Home Equity Loan Payment Increased 2% 0% 1% 1% 1% 2% 1%OtherReduced Income 37% 37% 38% 40% 38% 38% 40%Value of Home Has Decreased 4% 6% 7% 8% 8% 11% 11%Traveling Less 9% 11% 8% 8% 9% 8% 9%
This information is from ChangeWave Research, a service of 451 Research, LLC, and contains confidential business information.It may not be copied or distributed without permission. ©2013 451 Research, LLC. All rights reserved.
23

ChangeWave Research: Consumer Spending
This information is from ChangeWave Research, a service of 451 Research, LLC, and contains confidential business information.It may not be copied or distributed without permission. ©2013 451 Research, LLC. All rights reserved.
24

ChangeWave Research: Consumer Spending
ChangeWave Research MethodologyThis report presents the findings of a recent ChangeWave survey on consumer spending patterns. The survey was conducted between January 2 - 15, 2013. A total of 2,385 U.S. respondents participated in the survey.
ChangeWave's proprietary research and business intelligence gathering system is based upon the systematic gathering of valuable business and investment information directly over the Internet from accredited members of its research network.
The business and investment intelligence provided by ChangeWave provides a real-time view of companies, technologies, and consumer and business trends in key market sectors, along with an in-depth perspective of the macro economy – well in advance of other available sources.
About ChangeWave ResearchChangeWave Research, a service of 451 Research, is a survey research firm that identifies and quantifies change in corporate buying & business trends, telecom trends, and consumer spending & electronics trends.
The ChangeWave Research Network is a group of 25,000 highly qualified business, technology, and medical professionals – as well as early adopter consumers – who work in leading companies of select industries. ChangeWave surveys its Network members weekly on a range of business and consumer topics, and converts the information into a series of proprietary quantitative and qualitative reports. ChangeWave delivers its products and services on the Web at www.ChangeWaveResearch.com.
451 Research, LLC, including its ChangeWave Research service, does not make any warranties, express or implied, as to results to be obtained from using the information in this report. Investors should obtain individual financial advice based on their own particular circumstances before making any investment decisions based upon information in this report.
About 451 Research451 Research, a division of The 451 Group, is a leading global analyst and data company focused on the business of enterprise IT innovation. Clients of 451 Research – at end-user, service-provider, vendor, and investor organizations – rely on 451 Research’s insight through a range of syndicated research and advisory services to support both strategic and tactical decision-making. For additional information on 451 Research, go to: 451research.com.
For More Information:ChangeWave Research Telephone: 301-250-23637101 Wisconsin Ave. Fax: 240-200-3988Suite 1301 www.ChangeWaveResearch.comBethesda, MD 20814 [email protected]
This information is from ChangeWave Research, a service of 451 Research, LLC, and contains confidential business information.It may not be copied or distributed without permission. ©2013 451 Research, LLC. All rights reserved.
25