Embed Size (px)
Citation preview

January – March 2012
Volume 12 No. 4
Bank of Jamaica Quarterly Monetary Policy Report, January to March 2012
Bank of Jamaica
Quarterly Monetary
Policy Report
Jan – March 2012
Volume 12 No. 4

Bank of Jamaica Quarterly Monetary Policy Report, January to March 2012

Bank of Jamaica Quarterly Monetary Policy Report, January to March 2012
© 2003 Bank of Jamaica Nethersole Place
Kingston
Jamaica
Telephone: (876) 922 0750-9
Fax: (876) 922 0854
E-mail: [email protected]
Website: www.boj.org.jm
ISSN 0799 1037
The report is available in PDF format at the Bank’s website.
Comments on this publication are welcome and can be sent directly to the Bank or to our website.

Bank of Jamaica Quarterly Monetary Policy Report, January to March 2012
CONTENTS Preface i
Overview iii 1. International Economic Developments 1
Box 1- External Competitiveness in Jamaica 8 2. Monetary Policy and Financial Markets
Money & Credit 14 Monetary Policy & Base Money Management 14
Money Supply 16 Private Sector Credit 19
Bond Market 22
Stock Market 25
Foreign Exchange Market 29
3. Real Sector Developments 31
4. Inflation 36
5. Economic Outlook and Monetary Policy Perspectives 41
Appendices
A. Fiscal Developments 48 B. Monetary Policy Developments 52 C. Summary Tables 71
Glossary 97 List of Boxes in the QMPR 102

Bank of Jamaica Quarterly Monetary Policy Report, January to March 2012

Bank of Jamaica Quarterly Monetary Policy Report, January to March 2012
i
PREFACE
The Bank of Jamaica’s Quarterly Monetary Policy Report reviews the
conduct of monetary policy and the main factors that influence
inflation. It also presents the Bank’s perspective on emerging
economic trends and the path of monetary policy over the short- to
medium-term and features an exposition of Jamaica’s External
Competitiveness (Box 1).
The developments in the review quarter are set against policy targets
for the fiscal year, which runs from April to March. In some instances
the data used in the preparation of the report are provisional and are
therefore subject to change.

Bank of Jamaica Quarterly Monetary Policy Report, January to March 2012
ii

Bank of Jamaica Quarterly Monetary Policy Report, January to March 2012
iii
OVERVIEW
Recent Developments
During the March 2012 quarter, the domestic economic
environment continued to be characterized by relatively
stable conditions. Inflation was in the Bank’s forecast
range, the foreign exchange market was generally stable
and the nascent recovery in economic activity continued.
However, there were uncertainties regarding the content
and timing of a new agreement with the IMF and the
impact of the upcoming fiscal budget as well as rising
international commodity prices. Against this background,
the Bank maintained its monetary policy rate at 6.25 per
cent for the review quarter.
Headline inflation for the March 2012 quarter was 1.7 per
cent. This outturn, which was within the Bank’s forecast
range of 1.0 per cent to 2.0 per cent, was primarily
influenced by higher international commodity prices and
moderate depreciation in the exchange rate. The impact of
these impulses was partially offset by reduction in the
prices of some domestic agricultural items due to
improvement in supplies as well as continued weak
domestic demand, albeit improving. For FY2011/12, the
inflation outturn was 7.3 per cent which was within the
target range of 6.0 per cent to 8.0 per cent.
The weighted average selling rate (WASR) of the US dollar
vis-à-vis the Jamaica Dollar, depreciated by 0.8 per cent in
the March 2012 quarter. Notwithstanding, the adequacy of
net private capital flows to finance the demand for current
account transactions for the quarter, there were intermittent
periods of excess demand for foreign currency. Against this
background, the Bank sold US$102.1 million (net) in the
market during the quarter. This contributed to a decline of
US$189.0 million in the net international reserves (NIR) to
US$1 777.1 million. The Bank’s gross reserves at end-
Bank of Jamaica Quarterly Monetary Policy Report, January to March 2012
iv
March 2012 amounted to US$2 638.9 million, representing
17.0 weeks of projected goods and services imports.
Economic growth is estimated to be in the range of 0.0 per
cent to 1.0 per cent for the March 2012 quarter. This
followed average quarterly growth of 1.5 per cent for 2011.
The estimated growth for the review quarter was mainly
reflected in the following sectors: Agriculture, Forestry &
Fishing; Manufacture; Electricity & Water Supply and
Transport, Storage & Communication. Growth in the
economy was mirrored primarily in net external demand
which emanated from both an increase in exports and a
reduction in imports. Other components of aggregate
demand were estimated to have declined or remained flat in
the review period. For FY2011/12 economic activity is
estimated to have expanded within the range of 1.0 per cent
to 1.5 per cent in comparison to an average decline of 1.6
per cent over the previous two fiscal years. The outturn was
broadly in line with the projection for the fiscal year.
Primarily reflecting the weak domestic demand conditions,
albeit improving, broad Jamaica Dollar money supply
(M3J) declined by 2.0 per cent during the March 2012
quarter, a sharper contraction than the reduction for the
corresponding quarter of 2011. For FY2011/12, M3J grew
by 8.9 per cent and was below the average increase of 9.6
per cent for the last five fiscal years. The contraction for the
review quarter occurred in spite of a 3.9 per cent growth in
private sector credit, albeit at a slower rate than that
recorded for the preceding quarter. The increased demand
for private sector loans during the March 2012 quarter may
be reflective of the continued contraction in rates offered
on overall credit, with the weighted average rate of interest
on private sector credit falling by 35 bps.
The quality of private sector credit improved marginally
during the review quarter. In this regard, the ratio of non-

Bank of Jamaica Quarterly Monetary Policy Report, January to March 2012
v
performing loans, three-months and over declined to 8.4
per cent from 8.8 per cent for the December 2011 quarter.
During the March 2012 quarter, market determined interest
rates exhibited mixed movements. While the average yield
on the GOJ 30-day Treasury bill declined over the quarter,
there were marginal increases on the longer tenors. Of note,
there was convergence in yield on the 90-day tenor towards
equivalent yield on the BOJ’s 30-day Certificate of Deposit
(CD).
Outlook
The general price level for domestic consumer goods and
services is forecasted to expand by 1.5 per cent to 2.5 per
cent during the June 2012 quarter, following an increase of
1.7 per cent for the March 2012 quarter. Inflation for the
quarter is expected to be influenced by a forecast for
relatively stable imported inflation, domestic inflation
expectations and capacity conditions. The forecast for
imported inflation assumes that, in spite of some volatility
in crude oil price intra-quarter, the overall movement
should not be significantly different from the average price
which prevailed in the previous quarter. In addition, the
output gap is expected to remain negative but improving
relative to the previous quarter thus providing minimal
impetus to price increases. There is the possibility of
additional inflationary impulses emanating from fiscal
measures, which would result in a higher inflation.
Domestic output is anticipated to expand marginally for the
June quarter, largely similar to the estimated growth in the
March quarter. The main growth sectors are expected to be
Agriculture, Forestry & Fishing, Mining & Quarrying, Hotels &
Restaurants and Electricity & Water Supply.
Bank of Jamaica Quarterly Monetary Policy Report, January to March 2012
vi
For FY2012/13, headline inflation is currently forecasted to
be within the 6.0 per cent to 8.0 per cent range. The
anticipated rate of increase in the general price level partly
reflects expected general improvement in weather patterns
in the major grain producing countries. Inflation could also
be impacted by increased oil prices, given the improved
prospects for global growth and the continuing geopolitical
risks in some oil producing countries. However, inflation
could fall outside of the forecast range with the
implementation of measures to return the fiscal account to a
sustainable path.
Economic output for FY2012/13 is currently forecasted to
expand in the range of 0.0 per cent to 1.0 per cent. This
outlook reflects the expectation of continued weak
domestic demand, albeit improving relative to the crisis
period, coupled with a slower rate of expansion in global
growth in calendar year 2012 relative to 2011. Nonetheless,
the forecasted growth in the global economy is expected to
generate improved external demand for Jamaican goods
and services and acceleration in remittance flows to
Jamaica.
For FY2012/13 and beyond, strong and sustainable
improvement in domestic economic performance rests
critically on significant enhancement of the country’s
external competitiveness. This can be achieved through
adjustments to relative prices and the amelioration of
structural issues that impede competitiveness. Importantly,
attempts to address the issue of external competiveness
solely through adjustments to relative prices would be
inadequate.
Against this background, the Bank’s monetary policy
stance will continue to be supportive of the maintenance of
a stable macroeconomic environment within the context of
relatively stable financial markets and continued GOJ fiscal
consolidation.

Bank of Jamaica Quarterly Monetary Policy Report, January to March 2012
vii

Bank of Jamaica Quarterly Monetary Policy Report, January to March 2012
International Developments 1
Table 1.1
Selected GDP Growth Rates***
Sep-11 Dec-11 Mar-12
Advanced Economies
USA 1.8 3.0 2.2
Canada 4.2 1.8 2.1*
Japan 7.1 -0.7 0.0
UK 0.3 0.5 0.6*
Euro area 1.3 0.7 -0.3*
Emerging Market Economies
China 9.1 8.9 8.1
Russia 5.0 4.8 3.7*
Brazil 2.1 1.4 1.8*
Sources: Central Statistics Offices *Bloomberg Consensus Forecasts **BOJ Forecasts
***Quarter-over-Quarter percentage change at annual rates
Global economic growth is estimated to have decelerated during the
March 2012 quarter
The pace of global economic growth is estimated to have
slowed in the March 2012 quarter reflecting a slower pace of
growth in some advanced and emerging market economies.
With respect to the advanced economies, the deceleration
largely reflected an estimated contraction in the Euro area as
well as a reduced pace of growth in the USA. For emerging
markets, the slowdown was mainly reflected in China.
Jamaica’s terms of trade (TOT) is estimated to have improved
for the March quarter. This primarily emanated from an
estimated rise in export prices, the impact of which was partly
offset by an increase in import prices.
In the context of weak domestic economic activity, central
banks in most advanced economies kept their target interest
rates unchanged and provided necessary liquidity to alleviate
credit constraints in financial markets. The central banks of
some emerging market economies also employed expansionary
monetary policy measures to mitigate the effects of a weak
global environment.
Market interest rates for US dollar-denominated assets rose
during the review quarter, primarily driven by reduced
concerns about Greece and the impact of the European debt
crisis on international financial markets. Against this
background, emerging market bonds yields declined during the
quarter.
Global Economic Growth
The pace of global economic growth in the March 2012 quarter
is estimated to have decelerated relative to the previous
quarter. The slower pace of growth largely reflected an
estimated contraction in the economies in the Eurozone as well
as a reduced pace of economic growth in USA. This was
however, partly offset by a rebound in economic output of the
Japanese economy. Growth among emerging economies,
particularly China is also estimated to have slowed during the
quarter (see Table 1.1).
11.. IInntteerrnnaattiioonnaall DDeevveellooppmmeennttss

Bank of Jamaica Quarterly Monetary Policy Report, January to March 2012
International Developments 2
Table 1.2
Source: Central statistics offices * Bloomberg Consensus forecasts
Real GDP growth in the Euro area is estimated to have
contracted by 0.3 per cent in the March 2012 quarter following
a marginal expansion of 0.7 per cent in the preceding quarter.
This estimated contraction reflected the impact of the
implementation of fiscal austerity measures in some Euro area
countries affected by the sovereign debt crisis. In particular,
growth in Europe’s two largest economies, Germany and
France, is estimated to have decelerated to 0.8 per cent and 0.3
per cent, respectively, during the March quarter from 2.0 per
cent and 1.3 per cent in the December 2011 quarter.
For the USA, real GDP growth is estimated to have
decelerated to 2.2 per cent in the March 2012 quarter, relative
to a 3.0 per cent expansion in the December 2011 quarter. This
performance largely reflected an estimated reduction in net
export earnings stemming from a slowdown in global trade.
Similarly, investment expenditure declined during the quarter,
largely reflecting a deceleration in new home sales. The sale of
new homes, on an annualised basis, is estimated to have
moderated to 5.6 per cent from 11.7 per cent in the preceding
quarter. Growth in consumption expenditure, however,
accelerated reflecting more favourable labour market
conditions as well as an improvement in business and
consumer confidence during the quarter. The Japanese economy is estimated to have grown, on an
annualised basis, by 1.7 per cent in the March 2012 quarter,
following a contraction of 0.7 per cent in the previous quarter.
This rebound in growth reflected an improvement in the
manufacturing sector associated with increased domestic
demand influenced by reconstruction activities following the
natural disaster in 2011. Additionally, a 5.7 per cent
depreciation in the value of the Japanese Yen contributed to
the acceleration in export-led growth in that country.
With respect to emerging economies, real GDP for China
decelerated to 8.1 per cent in the March 2012 quarter, relative
to growth of 8.9 per cent in the previous quarter. This also
compares to average growth of 10.6 per cent in the previous
five March quarters. The deceleration in the rate of growth
Average Unemployment Rate for Selected Economies
Jun. 11 – Mar. 12
USA Canada Euro
area
Jun-11 9.0 7.5 10.0
Sept-11 9.1 7.3 10.2
Dec-11 8.7 7.5 10.5
Mar-12 8.3 7.4 10.7*
Bank of Jamaica Quarterly Monetary Policy Report, January to March 2012
International Developments 3
Employment in the USA improved in the March 2012 quarter.
Table 1.3
Source: Central statistics offices * BOJ forecasts
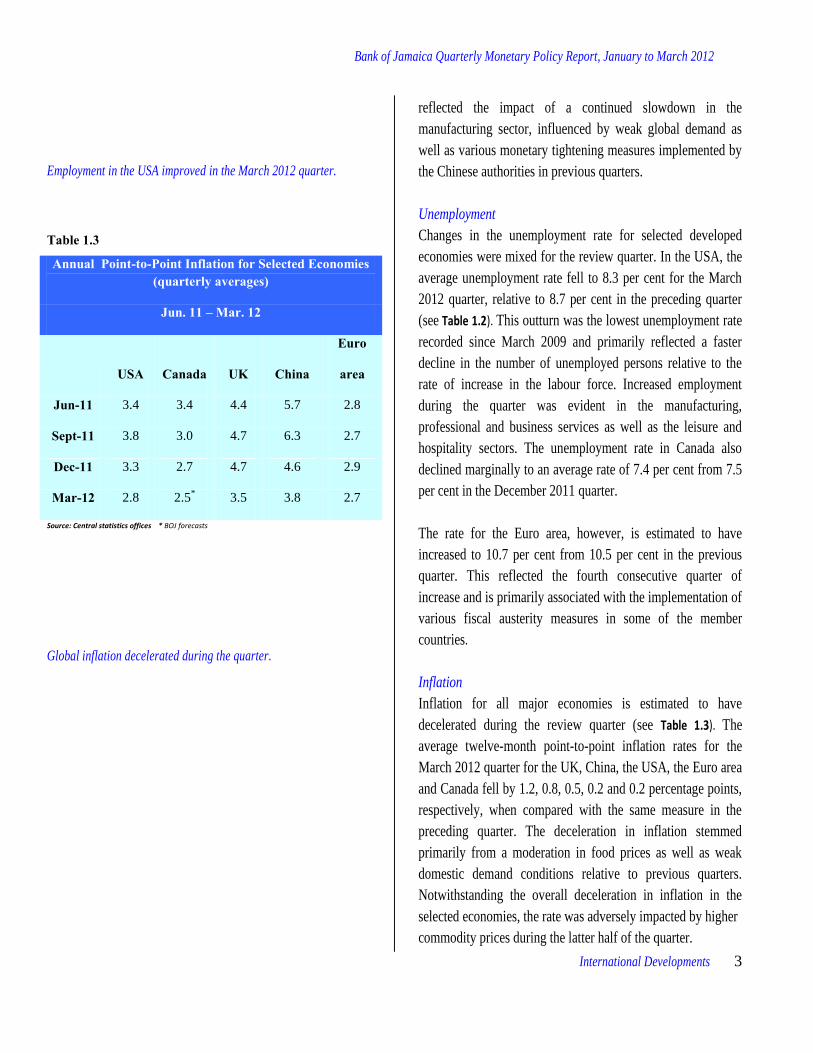
Global inflation decelerated during the quarter.
reflected the impact of a continued slowdown in the
manufacturing sector, influenced by weak global demand as
well as various monetary tightening measures implemented by
the Chinese authorities in previous quarters.
Unemployment
Changes in the unemployment rate for selected developed
economies were mixed for the review quarter. In the USA, the
average unemployment rate fell to 8.3 per cent for the March
2012 quarter, relative to 8.7 per cent in the preceding quarter
(see Table 1.2). This outturn was the lowest unemployment rate
recorded since March 2009 and primarily reflected a faster
decline in the number of unemployed persons relative to the
rate of increase in the labour force. Increased employment
during the quarter was evident in the manufacturing,
professional and business services as well as the leisure and
hospitality sectors. The unemployment rate in Canada also
declined marginally to an average rate of 7.4 per cent from 7.5
per cent in the December 2011 quarter.
The rate for the Euro area, however, is estimated to have
increased to 10.7 per cent from 10.5 per cent in the previous
quarter. This reflected the fourth consecutive quarter of
increase and is primarily associated with the implementation of
various fiscal austerity measures in some of the member
countries.
Inflation
Inflation for all major economies is estimated to have
decelerated during the review quarter (see Table 1.3). The
average twelve-month point-to-point inflation rates for the
March 2012 quarter for the UK, China, the USA, the Euro area
and Canada fell by 1.2, 0.8, 0.5, 0.2 and 0.2 percentage points,
respectively, when compared with the same measure in the
preceding quarter. The deceleration in inflation stemmed
primarily from a moderation in food prices as well as weak
domestic demand conditions relative to previous quarters.
Notwithstanding the overall deceleration in inflation in the
selected economies, the rate was adversely impacted by higher
commodity prices during the latter half of the quarter.
Annual Point-to-Point Inflation for Selected Economies (quarterly averages)
Jun. 11 – Mar. 12
USA Canada UK China
Euro
area
Jun-11 3.4 3.4 4.4 5.7 2.8
Sept-11 3.8 3.0 4.7 6.3 2.7
Dec-11 3.3 2.7 4.7 4.6 2.9
Mar-12 2.8 2.5* 3.5 3.8 2.7

Bank of Jamaica Quarterly Monetary Policy Report, January to March 2012
International Developments 4
Higher crude oil and agricultural commodity prices characterized
the March 2012 quarter.
Table 1.4
Source: IMF Pink Sheets
* Tourism Implicit Price Index, **Aluminium is the proxy used for alumina prices
Jamaica’s Terms of Trade
Jamaica’s terms of trade (TOT), increased by an estimated 3.7
per cent for the March 2012 quarter, relative to the December
2011 quarter (see Table 1.4).1 This compares to an average
increase of 14.1 per cent over the past five March quarters. On
an annual basis, the TOT however, declined by 5.7 per cent.
The improvement during the review quarter was attributed to
an 8.3 per cent rise in the Export Price Index (EPI), which was
partly tempered by a 4.4 per cent increase in the Import Price
Index (IPI).
The rise in the EPI emanated from an estimated 77.2 per cent
increase in sugar prices. This was associated with a change in
the contractual arrangements to a higher priced private investor
during the quarter. The performance of the IPI was
underpinned by higher fuel and agricultural raw materials
prices during the review period. Notably, average crude oil
prices as measured by the West Texas Intermediate
benchmark, rose by 9.4 per cent during the March 2012 quarter
to average US$102.94 per barrel. This compares to a five-year
seasonal average increase of 4.8 per cent. Higher fuel prices
largely stemmed from concerns regarding possible supply
disruptions due to the implementation of sanctions against Iran
and the threat of a closure of the Strait of Hormuz, the transit
point for approximately 20.0 per cent of global oil. Price
movements were also influenced by the impact of favourable
macroeconomic conditions in the USA and the approval of a
second Greek bailout package in the latter half of the quarter.
Higher agricultural raw material prices were underpinned by
reduced yields in South America reflecting the impact of
drought conditions in Argentina and Brazil since late
December 2011. Average soybean, corn and wheat prices
therefore rose by 6.0 per cent, 3.1 per cent and 1.4 per cent,
respectively, and contributed to a 1.1 per cent increase in the
Bank’s agricultural raw material sub-index for the quarter.
1 The quarterly TOT index is measured by a 3-month average of BOJ’s monthly
index over the referenced period.
Selected Import/Export Prices (period averages)
(Per cent changes relative to previous period)
Sept-11 Dec-11 Mar-12
TOT -2.8 -1.3 3.7
IPI -5.7 0.1 4.4
Crude Oil -12.5 4.8 9.4
Soybeans -1.4 -11.1 6.0
Corn -3.4 -10.9 3.1
Rice 14.8 5.9 -9.3
Wheat -8.6 -9.6 1.4
EPI -8.4 1.2 8.3
Sugar -8.0 0 77.2
Aluminium** -7.2 -13.3 5.0
Bank of Jamaica Quarterly Monetary Policy Report, January to March 2012
International Developments 5
Table 1.5
a Fed Funds rate b Repo rate c Discount rate d Benchmark lending rate
Table 1.6
Source: Central Banks
a Benchmark lending rate b Refinancing rate c Repo rate d Special System of Clearance and Custody (SELIC) rate
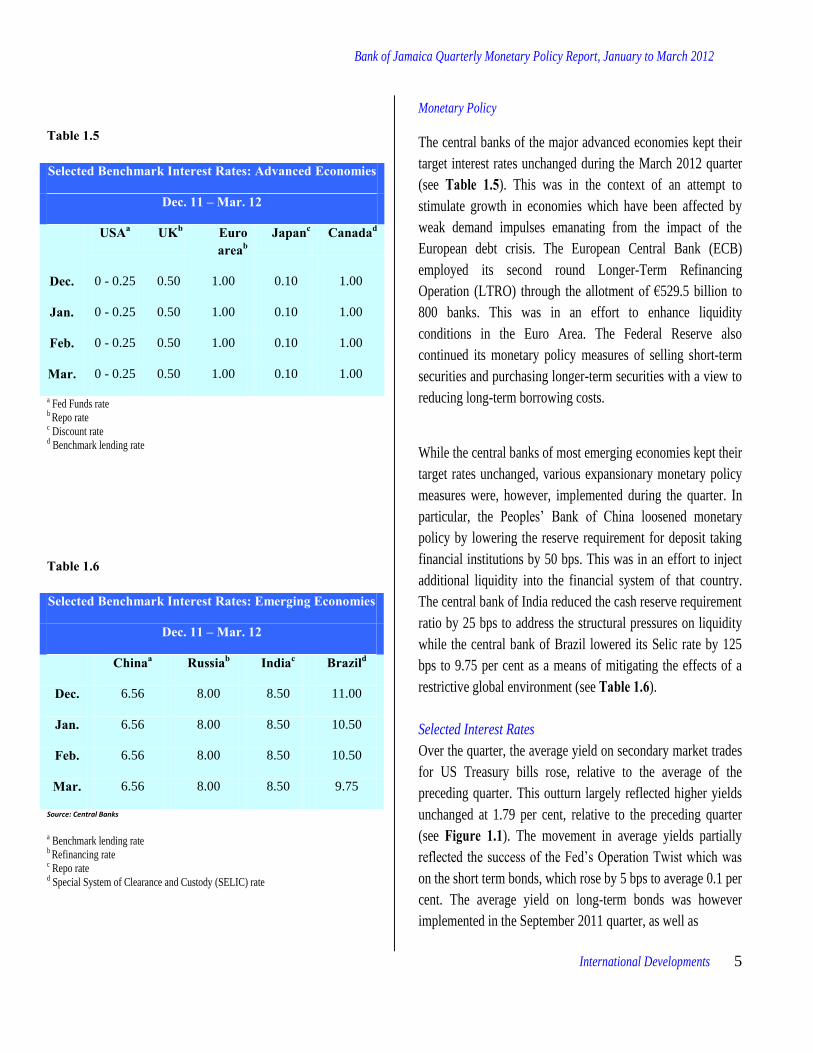
Monetary Policy
The central banks of the major advanced economies kept their
target interest rates unchanged during the March 2012 quarter
(see Table 1.5). This was in the context of an attempt to
stimulate growth in economies which have been affected by
weak demand impulses emanating from the impact of the
European debt crisis. The European Central Bank (ECB)
employed its second round Longer-Term Refinancing
Operation (LTRO) through the allotment of €529.5 billion to
800 banks. This was in an effort to enhance liquidity
conditions in the Euro Area. The Federal Reserve also
continued its monetary policy measures of selling short-term
securities and purchasing longer-term securities with a view to
reducing long-term borrowing costs.
While the central banks of most emerging economies kept their
target rates unchanged, various expansionary monetary policy
measures were, however, implemented during the quarter. In
particular, the Peoples’ Bank of China loosened monetary
policy by lowering the reserve requirement for deposit taking
financial institutions by 50 bps. This was in an effort to inject
additional liquidity into the financial system of that country.
The central bank of India reduced the cash reserve requirement
ratio by 25 bps to address the structural pressures on liquidity
while the central bank of Brazil lowered its Selic rate by 125
bps to 9.75 per cent as a means of mitigating the effects of a
restrictive global environment (see Table 1.6).
Selected Interest Rates
Over the quarter, the average yield on secondary market trades
for US Treasury bills rose, relative to the average of the
preceding quarter. This outturn largely reflected higher yields
unchanged at 1.79 per cent, relative to the preceding quarter
(see Figure 1.1). The movement in average yields partially
reflected the success of the Fed’s Operation Twist which was
on the short term bonds, which rose by 5 bps to average 0.1 per
cent. The average yield on long-term bonds was however
implemented in the September 2011 quarter, as well as
Selected Benchmark Interest Rates: Advanced Economies
Dec. 11 – Mar. 12
USAa UKb Euro areab
Japanc Canadad
Dec. 0 - 0.25 0.50 1.00 0.10 1.00
Jan. 0 - 0.25 0.50 1.00 0.10 1.00
Feb. 0 - 0.25 0.50 1.00 0.10 1.00
Mar. 0 - 0.25 0.50 1.00 0.10 1.00
Selected Benchmark Interest Rates: Emerging Economies
Dec. 11 – Mar. 12
Chinaa Russiab Indiac Brazild
Dec. 6.56 8.00 8.50 11.00
Jan. 6.56 8.00 8.50 10.50
Feb. 6.56 8.00 8.50 10.50
Mar. 6.56 8.00 8.50 9.75

Bank of Jamaica Quarterly Monetary Policy Report, January to March 2012
International Developments 6
Figure 1.1 US Treasury Yield Curve
Table 1.7
Source: British Bankers’ Association
improvements in the US labour and equity markets. This
resulted in reduced demand for the relative safety of
Treasuries, particularly in the short-term.
Credit risk in US financial markets declined during the review
period. The average spread between the 3-month USD LIBOR
and the 3-month US Treasury bill (TED spread), an indicator
of this risk, fell by 2 bps, relative to the previous quarter, to
average 44.5 bps (see Table 1.7). This decline reflected
reduced concerns about the instability in the financial markets
and an upward revision to the pace of global economic growth,
particularly in the context of the approval of the second bailout
package for Greece during the quarter.
Emerging Market Bonds
The average yield on the EMBI+ declined by 28 bps to 5.54
per cent during the quarter. As a result, the spread between the
EMBI+ and US Treasury bond yields (USTB) narrowed by 30
bps during the review period. Notwithstanding, the spread
between GOJ global bond yields and the USTB yields widened
by 4 bps to 5.56 per cent during the March 2012 quarter
reflecting the impact of domestic factors on investors’
perceptions.2
Equities
Selected stock market indices rose during the review period. In
the USA, the Dow Jones Industrial Average (DJIA) and the
Standard & Poor’s 500 index(S&P 500) rose by 8.0 per cent
and 12.0 per cent, respectively, during the quarter.
The rise in the indices reflected increased investor preference
for equities during the quarter against the background of
improved macro-economic conditions, particularly in the
labour market. The FTSE 100 Index, UK’s main index, also
2The GOJGB composite bond index is calculated as a weighted average of the
yields on currently outstanding Government of Jamaica global bonds. The weights
used, are based on Basis Point Value (BPV) estimates, a derivative of duration
statistics. BPV quantifies the interest rate risk in a portfolio for small changes in
interest rates.
Selected Market Interest Rates
(period averages)
3-month USD
LIBOR
3-month US
Treasury Bill
TED Spread
(bps)
Jun-11 0.26 0.05 21.7
Sep-11 0.30 0.02 27.4
Dec-11 0.48 0.01 46.6
Mar-12 0.51 0.07 44.5

Bank of Jamaica Quarterly Monetary Policy Report, January to March 2012
International Developments 7
Figure 1.2 Selected Stock Market Indices
increased by 3.5 per cent against the background of the
approval of the second bailout package for Greece as well as
monetary policy initiatives employed by the ECB during the
quarter. Japan’s main index, the Nikkei 225, also rose by 19.3 per cent as the depreciation in the Yen and increased demand
for Japanese exports heightened growth prospects in that
country (see Figure 1.2).
Foreign Exchange Market
The US dollar strengthened against some major currencies
during the review period. Notably, the Euro and the Yen
depreciated by 2.6 per cent and 2.4 per cent, respectively,
reflecting the impact of financial market instability,
particularly during the first half of the quarter. The Great
British Pound was unchanged relative to the previous quarter.
Higher oil and agricultural commodity prices resulted in
appreciation of the currencies of Canada, Brazil, and Mexico
relative to the US dollar during the quarter.
Bank of Jamaica Quarterly Monetary Policy Report, January to March 2012
8
Box 1: External Competitiveness in Jamaica Introduction In a context of persistently weak economic growth and high current
account deficits over the past decade, there has been heightened
focus among policy makers on the external competitiveness of the
Jamaican economy.3 It has been argued that Jamaica could see
significant improvements in these and other macroeconomic
indicators by producing goods and services at prices and qualities,
which are at least comparable to those of other producers in the
world. This would induce both domestic and external consumers to
demand more locally produced goods and services.
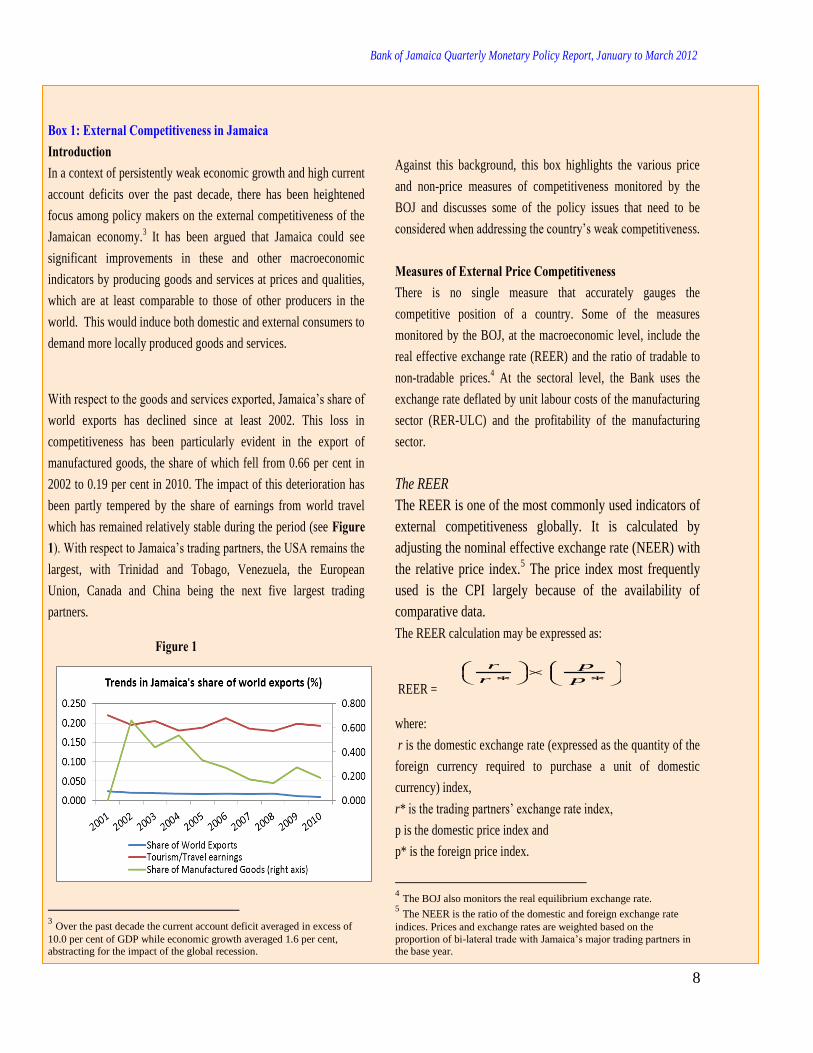
With respect to the goods and services exported, Jamaica’s share of
world exports has declined since at least 2002. This loss in
competitiveness has been particularly evident in the export of
manufactured goods, the share of which fell from 0.66 per cent in
2002 to 0.19 per cent in 2010. The impact of this deterioration has
been partly tempered by the share of earnings from world travel
which has remained relatively stable during the period (see Figure 1). With respect to Jamaica’s trading partners, the USA remains the
largest, with Trinidad and Tobago, Venezuela, the European
Union, Canada and China being the next five largest trading
partners.
Figure 1
3 Over the past decade the current account deficit averaged in excess of
10.0 per cent of GDP while economic growth averaged 1.6 per cent, abstracting for the impact of the global recession.
Against this background, this box highlights the various price
and non-price measures of competitiveness monitored by the
BOJ and discusses some of the policy issues that need to be
considered when addressing the country’s weak competitiveness. Measures of External Price Competitiveness There is no single measure that accurately gauges the
competitive position of a country. Some of the measures
monitored by the BOJ, at the macroeconomic level, include the
real effective exchange rate (REER) and the ratio of tradable to
non-tradable prices.4 At the sectoral level, the Bank uses the
exchange rate deflated by unit labour costs of the manufacturing
sector (RER-ULC) and the profitability of the manufacturing
sector.
The REER
The REER is one of the most commonly used indicators of
external competitiveness globally. It is calculated by
adjusting the nominal effective exchange rate (NEER) with
the relative price index.5 The price index most frequently
used is the CPI largely because of the availability of
comparative data.
The REER calculation may be expressed as:
REER =
where:
r is the domestic exchange rate (expressed as the quantity of the
foreign currency required to purchase a unit of domestic
currency) index,
r* is the trading partners’ exchange rate index,
p is the domestic price index and
p* is the foreign price index.
4 The BOJ also monitors the real equilibrium exchange rate.
5 The NEER is the ratio of the domestic and foreign exchange rate
indices. Prices and exchange rates are weighted based on the
proportion of bi-lateral trade with Jamaica’s major trading partners in the base year.
** p
p
r
r
Bank of Jamaica Quarterly Monetary Policy Report, January to March 2012
9
An improvement in competitiveness, as measured by a decline in
the REER, emanates from either depreciation in the NEER or a
decline in relative prices. A depreciation in the NEER is
represented by a decline in the value of the domestic currency vis-
à-vis the foreign currency or an appreciation of the currencies of
the country’s main trading partners against the US dollar.
Similarly, the REER would decline if the rate of inflation for the
domestic economy is below that of the country’s main trading
partners.
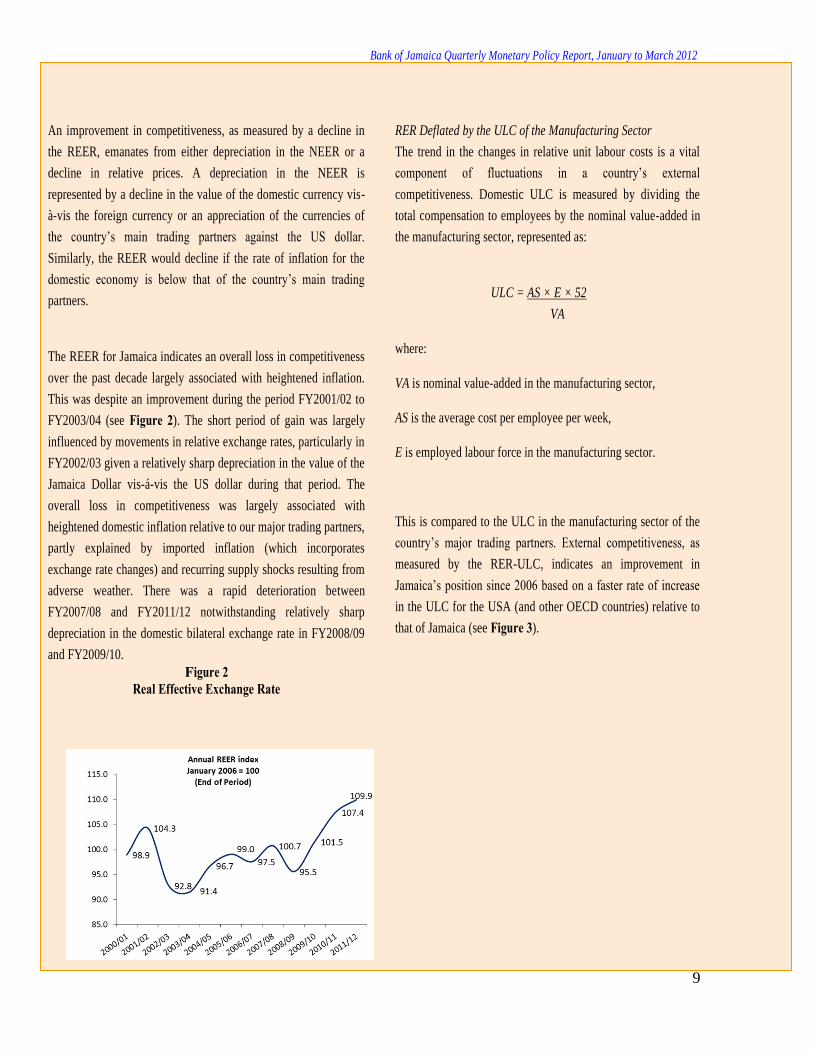
The REER for Jamaica indicates an overall loss in competitiveness
over the past decade largely associated with heightened inflation.
This was despite an improvement during the period FY2001/02 to
FY2003/04 (see Figure 2). The short period of gain was largely
influenced by movements in relative exchange rates, particularly in
FY2002/03 given a relatively sharp depreciation in the value of the
Jamaica Dollar vis-á-vis the US dollar during that period. The
overall loss in competitiveness was largely associated with
heightened domestic inflation relative to our major trading partners,
partly explained by imported inflation (which incorporates
exchange rate changes) and recurring supply shocks resulting from
adverse weather. There was a rapid deterioration between
FY2007/08 and FY2011/12 notwithstanding relatively sharp
depreciation in the domestic bilateral exchange rate in FY2008/09
and FY2009/10.
Figure 2 Real Effective Exchange Rate
RER Deflated by the ULC of the Manufacturing Sector
The trend in the changes in relative unit labour costs is a vital
component of fluctuations in a country’s external
competitiveness. Domestic ULC is measured by dividing the
total compensation to employees by the nominal value-added in
the manufacturing sector, represented as:
ULC = AS × E × 52
VA
where:
VA is nominal value-added in the manufacturing sector,
AS is the average cost per employee per week,
E is employed labour force in the manufacturing sector.
This is compared to the ULC in the manufacturing sector of the
country’s major trading partners. External competitiveness, as
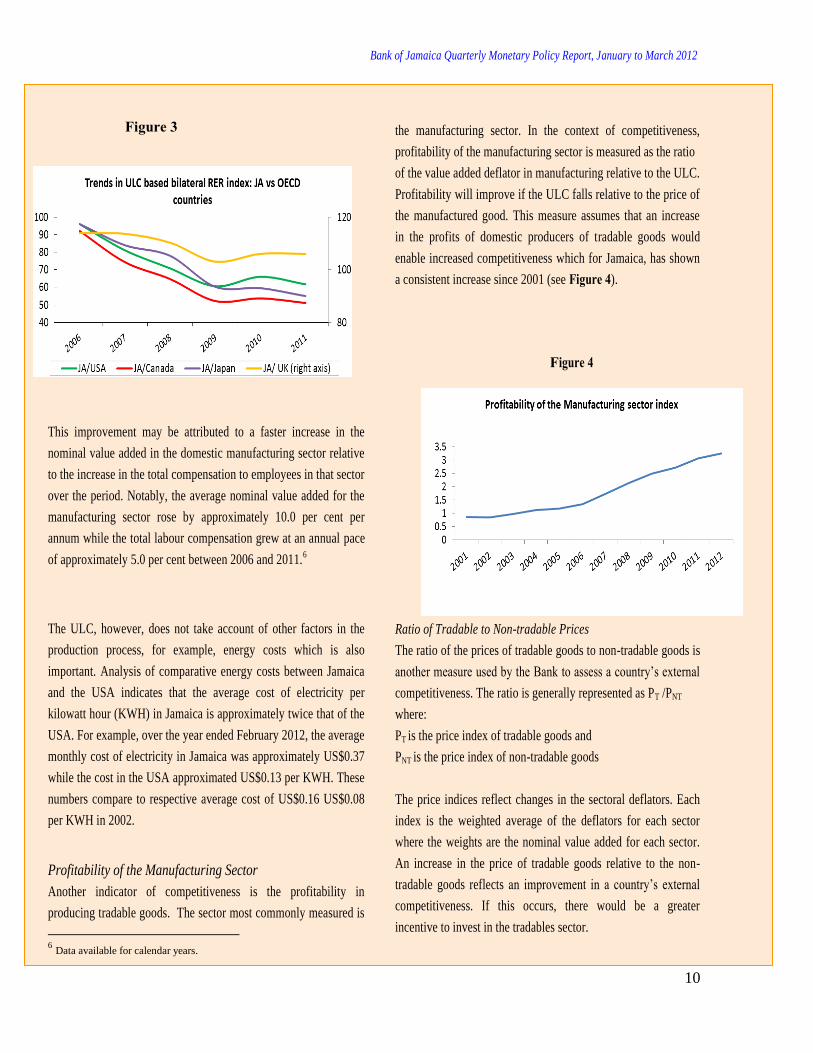
measured by the RER-ULC, indicates an improvement in
Jamaica’s position since 2006 based on a faster rate of increase
in the ULC for the USA (and other OECD countries) relative to
that of Jamaica (see Figure 3).
Bank of Jamaica Quarterly Monetary Policy Report, January to March 2012
10
Figure 3
This improvement may be attributed to a faster increase in the
nominal value added in the domestic manufacturing sector relative
to the increase in the total compensation to employees in that sector
over the period. Notably, the average nominal value added for the
manufacturing sector rose by approximately 10.0 per cent per
annum while the total labour compensation grew at an annual pace
of approximately 5.0 per cent between 2006 and 2011.6
The ULC, however, does not take account of other factors in the
production process, for example, energy costs which is also
important. Analysis of comparative energy costs between Jamaica
and the USA indicates that the average cost of electricity per
kilowatt hour (KWH) in Jamaica is approximately twice that of the
USA. For example, over the year ended February 2012, the average
monthly cost of electricity in Jamaica was approximately US$0.37
while the cost in the USA approximated US$0.13 per KWH. These
numbers compare to respective average cost of US$0.16 US$0.08
per KWH in 2002.
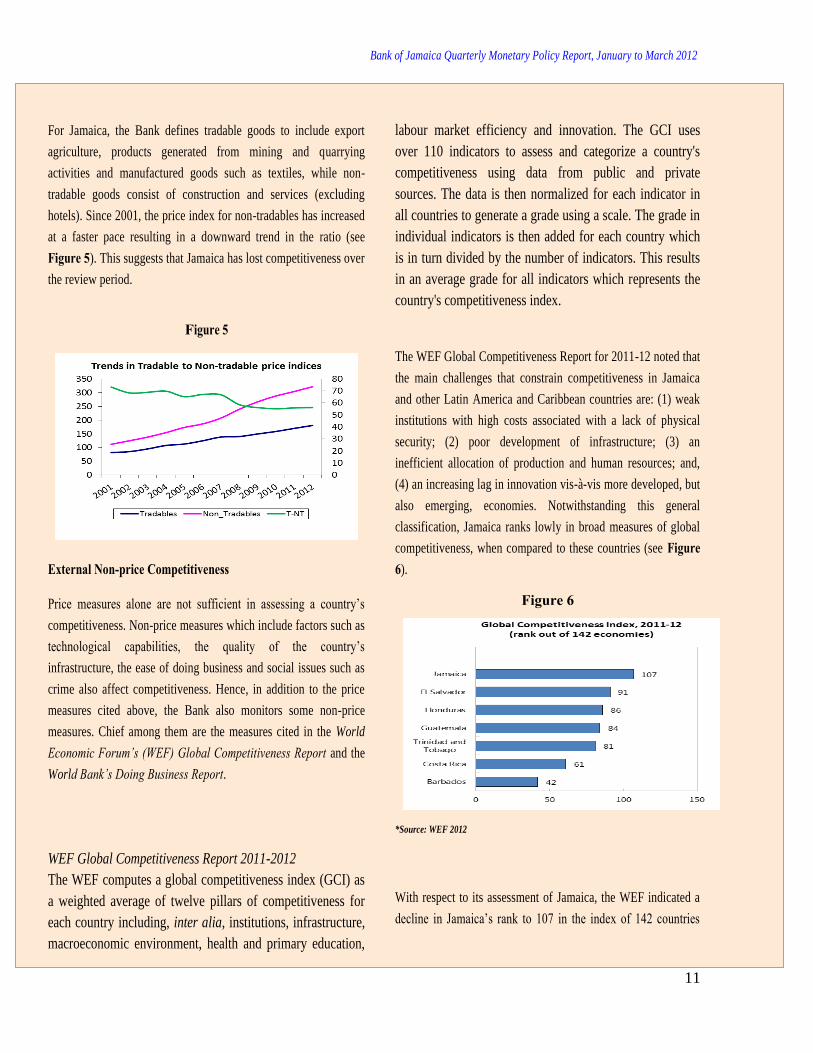
Profitability of the Manufacturing Sector
Another indicator of competitiveness is the profitability in
producing tradable goods. The sector most commonly measured is
6 Data available for calendar years.
the manufacturing sector. In the context of competitiveness,
profitability of the manufacturing sector is measured as the ratio
of the value added deflator in manufacturing relative to the ULC.
Profitability will improve if the ULC falls relative to the price of
the manufactured good. This measure assumes that an increase
in the profits of domestic producers of tradable goods would
enable increased competitiveness which for Jamaica, has shown
a consistent increase since 2001 (see Figure 4).
Figure 4
Ratio of Tradable to Non-tradable Prices
The ratio of the prices of tradable goods to non-tradable goods is
another measure used by the Bank to assess a country’s external
competitiveness. The ratio is generally represented as PT /PNT
where:
PT is the price index of tradable goods and
PNT is the price index of non-tradable goods
The price indices reflect changes in the sectoral deflators. Each
index is the weighted average of the deflators for each sector
where the weights are the nominal value added for each sector.
An increase in the price of tradable goods relative to the non-
tradable goods reflects an improvement in a country’s external
competitiveness. If this occurs, there would be a greater
incentive to invest in the tradables sector.
Bank of Jamaica Quarterly Monetary Policy Report, January to March 2012
11
For Jamaica, the Bank defines tradable goods to include export
agriculture, products generated from mining and quarrying
activities and manufactured goods such as textiles, while non-
tradable goods consist of construction and services (excluding
hotels). Since 2001, the price index for non-tradables has increased
at a faster pace resulting in a downward trend in the ratio (see
Figure 5). This suggests that Jamaica has lost competitiveness over
the review period.
Figure 5
External Non-price Competitiveness
Price measures alone are not sufficient in assessing a country’s
competitiveness. Non-price measures which include factors such as
technological capabilities, the quality of the country’s
infrastructure, the ease of doing business and social issues such as
crime also affect competitiveness. Hence, in addition to the price
measures cited above, the Bank also monitors some non-price
measures. Chief among them are the measures cited in the World
Economic Forum’s (WEF) Global Competitiveness Report and the
World Bank’s Doing Business Report.
WEF Global Competitiveness Report 2011-2012
The WEF computes a global competitiveness index (GCI) as
a weighted average of twelve pillars of competitiveness for
each country including, inter alia, institutions, infrastructure,
macroeconomic environment, health and primary education,
labour market efficiency and innovation. The GCI uses
over 110 indicators to assess and categorize a country's
competitiveness using data from public and private
sources. The data is then normalized for each indicator in
all countries to generate a grade using a scale. The grade in
individual indicators is then added for each country which
is in turn divided by the number of indicators. This results
in an average grade for all indicators which represents the
country's competitiveness index.
The WEF Global Competitiveness Report for 2011-12 noted that
the main challenges that constrain competitiveness in Jamaica
and other Latin America and Caribbean countries are: (1) weak
institutions with high costs associated with a lack of physical
security; (2) poor development of infrastructure; (3) an
inefficient allocation of production and human resources; and,
(4) an increasing lag in innovation vis-à-vis more developed, but
also emerging, economies. Notwithstanding this general
classification, Jamaica ranks lowly in broad measures of global
competitiveness, when compared to these countries (see Figure 6).
Figure 6
*Source: WEF 2012
With respect to its assessment of Jamaica, the WEF indicated a
decline in Jamaica’s rank to 107 in the index of 142 countries

Bank of Jamaica Quarterly Monetary Policy Report, January to March 2012
12
relative to 95 out of the 139 countries in the 2010 survey.7
Analysis of previous years shows that for a number of indicators,
the ranking was partly influenced by a lower score. For example in
2008, Jamaica scored 3.6 in innovation. However, this score was
reduced to 3.4 by 2011. There were also a few indicators, for
example infrastructure, in which Jamaica gained a higher score but
received a lower rank.
For 2011, the decline in Jamaica’s ranking was primarily evidenced
in the Basic Requirement Pillar, representing a fall in Jamaica’s
rank to 116 from 103. With respect to the basic requirement index,
all the component rankings deteriorated. In this regard, Jamaica’s
ranking for the level of development of its infrastructure
deteriorated from a ranking of 65 to 79 in the 2011-12 report. The
country’s rankings in terms of the quality of roads, available airline
seats, fixed telephone lines and mobile telephone subscriptions all
deteriorated. There was also some deterioration in the Efficiency
Enhancer Index largely due to reduced rankings for financial
market development and technological readiness. The lower
ranking for financial market development was largely associated
with a downgrade of Jamaica’s status in relation to the availability
of venture capital while that for technological readiness reflected a
lower ranking for internet penetration. The most significant
deterrent to doing business in Jamaica continued to be crime and
theft, which deteriorated further relative to 2010-2011 (see
Figure 7).
Figure 7
*Source: World Bank 2012
7 In 2002, Jamaica was ranked 60th among a total of 80 countries.
World Bank Doing Business Report – 2012
The World Bank Doing Business Report for 2012 also
highlighted some major obstacles to doing business in Jamaica,
relative to the rest of the world. Chief among them were paying
taxes, enforcing contracts and registering property (See Figure 8). These factors mainly contributed to an overall ranking of 88
for Jamaica compared to a previous ranking of 85 for 2011 and
43 in 20068.
Figure 8
**Source: World Bank 2012
Summary and Policy Issues Most measures of competitiveness monitored by the BOJ
indicate that Jamaica has lost competitiveness over the past
decade. This loss in competitiveness can be addressed through
adjusting relative prices and the structural issues impeding
competitiveness. In this regard, any attempt to reverse this loss
in competitiveness through a reliance on relative price
adjustments alone would be insufficient.
With respect to relative prices, one avenue to regain
competitiveness is through a relatively sharp depreciation of the
8 The 2006 report reflects the least recent comparative ranking for each
country out of 155 countries.
Bank of Jamaica Quarterly Monetary Policy Report, January to March 2012
13
exchange rate which would have to significantly outweigh relative
price increases. However, this mechanism is dependent on the
extent of the pass through of exchange rate changes to domestic
inflation and the impact of the depreciation on the import cost in
the production process.9 In addition, elasticity estimates for
Jamaica show that the responsiveness of imports and exports to
exchange rate changes is generally low.10
In this regard, a sharp
depreciation of the exchange rate may not generate the required
response. Moreover, the exchange rate has traditionally served as
an important anchor to inflation expectations in Jamaica.
Given the impact of adverse weather on inflation, further measures
should be put in place to reduce the country’s vulnerability to these
types of shocks. A continuation of the drive towards cheaper and
more reliable sources of energy would also contribute to lower
inflation and an improvement in competitiveness.
Jamaica should also aim at improving the non-price measures and
structural problems that challenge or constrain competitiveness, as
cited by the World Bank Doing Business and the WEF Global
Competitiveness Reports. In doing so, Jamaica could likely see
significant improvement in its macroeconomic indicators, including
economic growth and the current account deficit.
9 McFarlene (2002) estimated that 80.0 per cent of the exchange rate
depreciation in the pre-1995 period was passed through within six
months. The BOJ estimates that this has now slowed to around 50 per cent. 10
See Henry, C. and Longmore, R., (2003) “Current Account Dynamics
and the Real Effective Exchange Rate: The Jamaican Experience.” Bank
of Jamaica Working Paper.
Bank of Jamaica Quarterly Monetary Policy Report, January to March 2012
Monetary Policy and Financial Markets 14
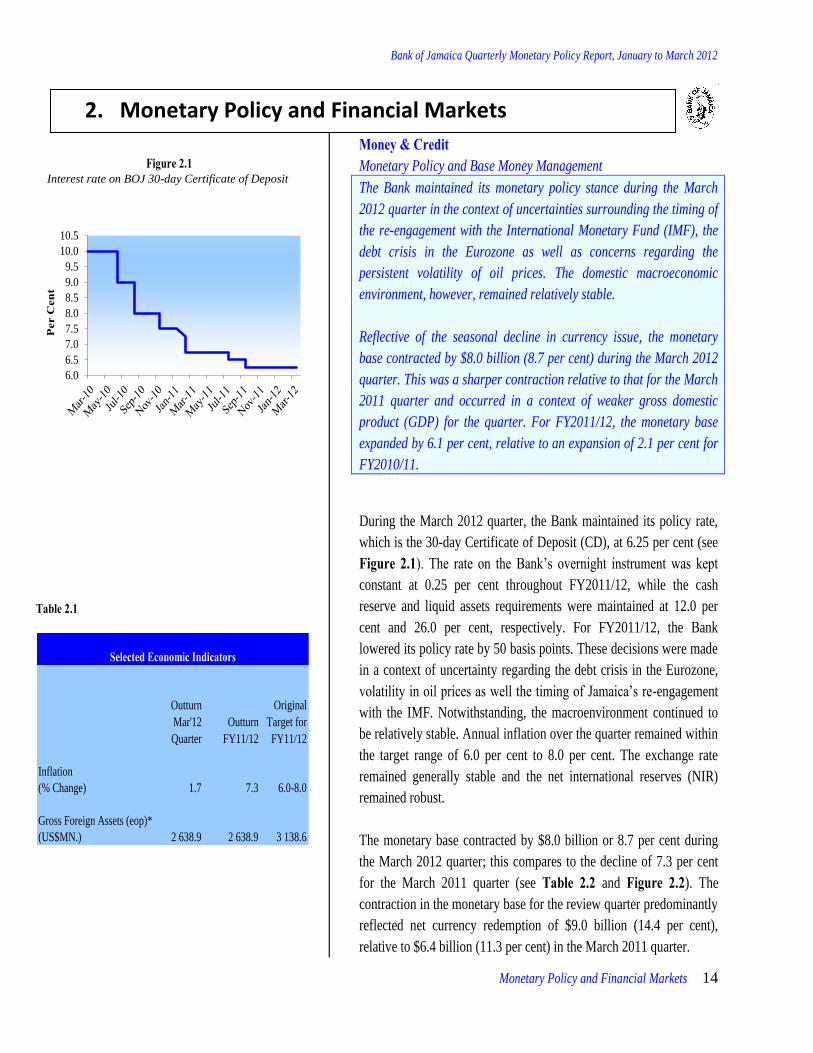
Figure 2.1 Interest rate on BOJ 30-day Certificate of Deposit
6.0
6.5
7.0
7.5
8.0
8.5
9.0
9.5
10.0
10.5
Per
Cen
t
Table 2.1
Outturn
Mar'12
Quarter
Outturn
FY11/12
Original
Target for
FY11/12
Inflation
(% Change) 1.7 7.3 6.0-8.0
Gross Foreign Assets (eop)*
(US$MN.) 2 638.9 2 638.9 3 138.6
Selected Economic Indicators
Money & Credit Monetary Policy and Base Money Management
The Bank maintained its monetary policy stance during the March
2012 quarter in the context of uncertainties surrounding the timing of
the re-engagement with the International Monetary Fund (IMF), the
debt crisis in the Eurozone as well as concerns regarding the
persistent volatility of oil prices. The domestic macroeconomic
environment, however, remained relatively stable.
Reflective of the seasonal decline in currency issue, the monetary
base contracted by $8.0 billion (8.7 per cent) during the March 2012
quarter. This was a sharper contraction relative to that for the March
2011 quarter and occurred in a context of weaker gross domestic
product (GDP) for the quarter. For FY2011/12, the monetary base
expanded by 6.1 per cent, relative to an expansion of 2.1 per cent for
FY2010/11.
During the March 2012 quarter, the Bank maintained its policy rate,
which is the 30-day Certificate of Deposit (CD), at 6.25 per cent (see
Figure 2.1). The rate on the Bank’s overnight instrument was kept
constant at 0.25 per cent throughout FY2011/12, while the cash
reserve and liquid assets requirements were maintained at 12.0 per
cent and 26.0 per cent, respectively. For FY2011/12, the Bank
lowered its policy rate by 50 basis points. These decisions were made
in a context of uncertainty regarding the debt crisis in the Eurozone,
volatility in oil prices as well the timing of Jamaica’s re-engagement
with the IMF. Notwithstanding, the macroenvironment continued to
be relatively stable. Annual inflation over the quarter remained within
the target range of 6.0 per cent to 8.0 per cent. The exchange rate
remained generally stable and the net international reserves (NIR)
remained robust.
The monetary base contracted by $8.0 billion or 8.7 per cent during
the March 2012 quarter; this compares to the decline of 7.3 per cent
for the March 2011 quarter (see Table 2.2 and Figure 2.2). The
contraction in the monetary base for the review quarter predominantly
reflected net currency redemption of $9.0 billion (14.4 per cent),
relative to $6.4 billion (11.3 per cent) in the March 2011 quarter.
2. Monetary Policy and Financial Markets

Bank of Jamaica Quarterly Monetary Policy Report, January to March 2012
Monetary Policy and Financial Markets 15
Figure 2.2 Base Money
(Quarterly Change)
Figure 2.3 Effects of the NIR, GOJ & OMO on Liquidity*
* Absorption – negative; Injection – positive
Table 2.2
*The original target for the NIR was US$1 800.7 million for
FY2011/12.
An increase of $1.0 billion in commercial banks’ cash reserves
partially offset the impact of the contraction in currency on the
monetary base. The sharp fall in currency was consistent with an
estimated deceleration in economic activity for the review quarter.
The contraction in the monetary base was largely influenced by a
decline of $16.9 billion (US$189.0 million) in the NIR, which was
partly offset by an increase of $8.9 billion in the net domestic assets
(NDA) (see Figure 2.3). For the NIR, the decline mainly reflected
intervention sales to the market as well as debt payments on behalf of
the Central Government. Within the NDA, there was net drawdown of
$20.5 billion in Central Government deposits, reflective of debt
payments, particularly in February. This liquidity impact was partially
offset by net placements of $12.7 billion on open market operation
(OMO) instruments.
For FY2011/12, the monetary base expanded by $4.8 billion (6.1 per
cent) relative to an expansion of 2.1 per cent for FY2010/11. This
growth largely reflected net currency issue of $3.3 billion (6.6 per
cent) as well as an increase of $2.4 billion (8.6 per cent) in
commercial banks’ cash reserves. The impact of these transactions
was partially offset by a decline of $920.1 million in commercial
banks’ current account. The main sources of the expansion in the
monetary base were net drawdown of $37.3 billion in Central
Government deposits at the Bank and net unwinding of $32.1 billion
in OMO securities. There was, however, a decline of $69.3 billion
(US$776.0 million) in the NIR.
Outturn
Dec'11
Quarter
Outturn
Mar'12
Quarter
%
Change
Net International Reserves 1 966.1 1 777.1 -9.6
(US$ MN.)
Net Domestic Assets
(J$MN.) -83 961.8 -75 089.9 10.6
Monetary Base
(J$MN.) 91 710.1 83 696.7 -8.7
Base Money Indicators
-20000
-10000
0
10000
20000
30000
J$ M
illio
n
NIR OMO GOJ
-15.0
-5.0
5.0
15.0
25.0
Mar-08 Mar-09 Mar-10 Mar-11 Mar-12
Per
cen
t
Quarter
Unadjusted Seasonally adjusted
Bank of Jamaica Quarterly Monetary Policy Report, January to March 2012
Monetary Policy and Financial Markets 16
Figure 2.4 Money Supply
(Quarterly Growth Rates)
March 2006 to March 2012
-6.0-4.0-2.00.02.04.06.08.0
10.012.0
Pe
r C
en
t
M3J M3*
Table 2.3
Figure 2.5 Deposits in Commercial Banks
(Quarterly Growth Rates)
March 2009 to March 2012
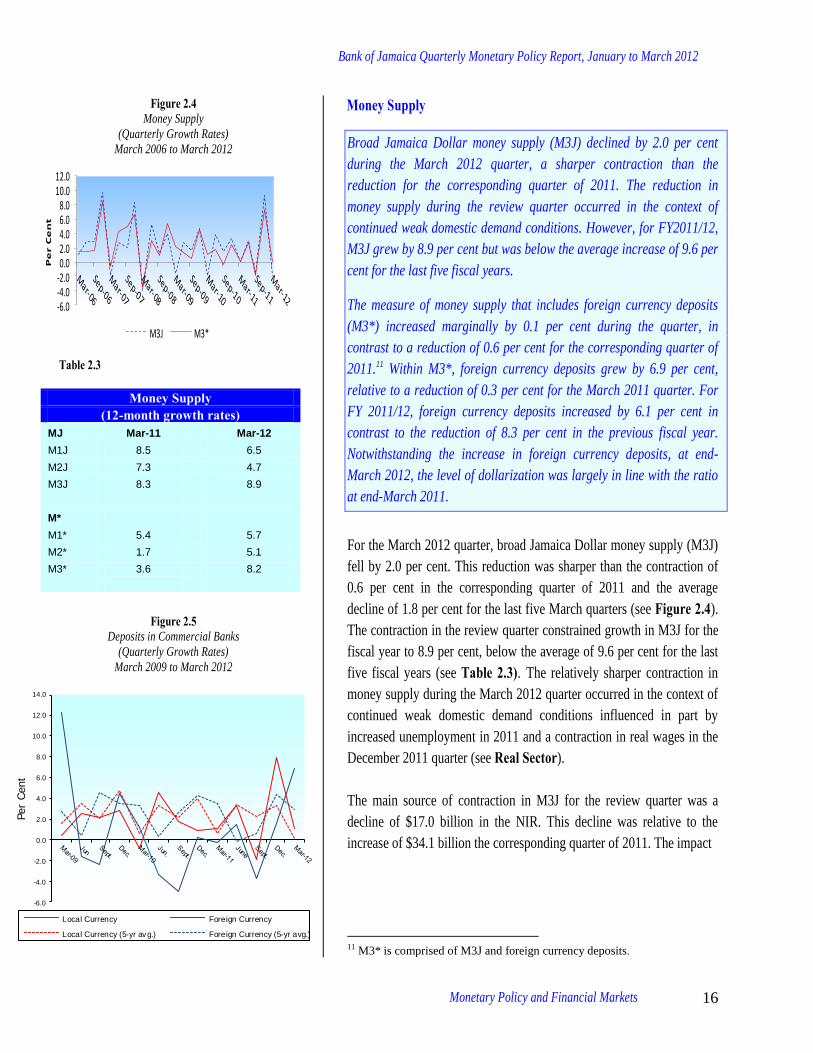
Money Supply
Broad Jamaica Dollar money supply (M3J) declined by 2.0 per cent
during the March 2012 quarter, a sharper contraction than the
reduction for the corresponding quarter of 2011. The reduction in
money supply during the review quarter occurred in the context of
continued weak domestic demand conditions. However, for FY2011/12,
M3J grew by 8.9 per cent but was below the average increase of 9.6 per
cent for the last five fiscal years.
The measure of money supply that includes foreign currency deposits
(M3*) increased marginally by 0.1 per cent during the quarter, in
contrast to a reduction of 0.6 per cent for the corresponding quarter of
2011.11 Within M3*, foreign currency deposits grew by 6.9 per cent,
relative to a reduction of 0.3 per cent for the March 2011 quarter. For
FY 2011/12, foreign currency deposits increased by 6.1 per cent in
contrast to the reduction of 8.3 per cent in the previous fiscal year.
Notwithstanding the increase in foreign currency deposits, at end-
March 2012, the level of dollarization was largely in line with the ratio
at end-March 2011.
For the March 2012 quarter, broad Jamaica Dollar money supply (M3J)
fell by 2.0 per cent. This reduction was sharper than the contraction of
0.6 per cent in the corresponding quarter of 2011 and the average
decline of 1.8 per cent for the last five March quarters (see Figure 2.4).
The contraction in the review quarter constrained growth in M3J for the
fiscal year to 8.9 per cent, below the average of 9.6 per cent for the last
five fiscal years (see Table 2.3). The relatively sharper contraction in
money supply during the March 2012 quarter occurred in the context of
continued weak domestic demand conditions influenced in part by
increased unemployment in 2011 and a contraction in real wages in the
December 2011 quarter (see Real Sector).
The main source of contraction in M3J for the review quarter was a
decline of $17.0 billion in the NIR. This decline was relative to the
increase of $34.1 billion the corresponding quarter of 2011. The impact
11 M3* is comprised of M3J and foreign currency deposits.
Money Supply (12-month growth rates)
MJ Mar-11 Mar-12
M1J 8.5 6.5
M2J 7.3 4.7
M3J 8.3 8.9
M*
M1* 5.4 5.7
M2* 1.7 5.1
M3* 3.6 8.2
-6.0
-4.0
-2.0
0.0
2.0
4.0
6.0
8.0
10.0
12.0
14.0
Per
Cent
Local Currency Foreign Currency
Local Currency (5-yr avg.) Foreign Currency (5-yr avg.)
Bank of Jamaica Quarterly Monetary Policy Report, January to March 2012
Monetary Policy and Financial Markets 17
Table 2.4
Mar-11 Mar-12
Local Currency Deposits 1.2 -0.5
Demand deposits -1.3 -5.9
Savings deposits 0.3 0.3
Time deposits 3.3 -0.9
Other Deposits 2.9 1.6
Local Currency DepositsQuarterly Growth ( % )
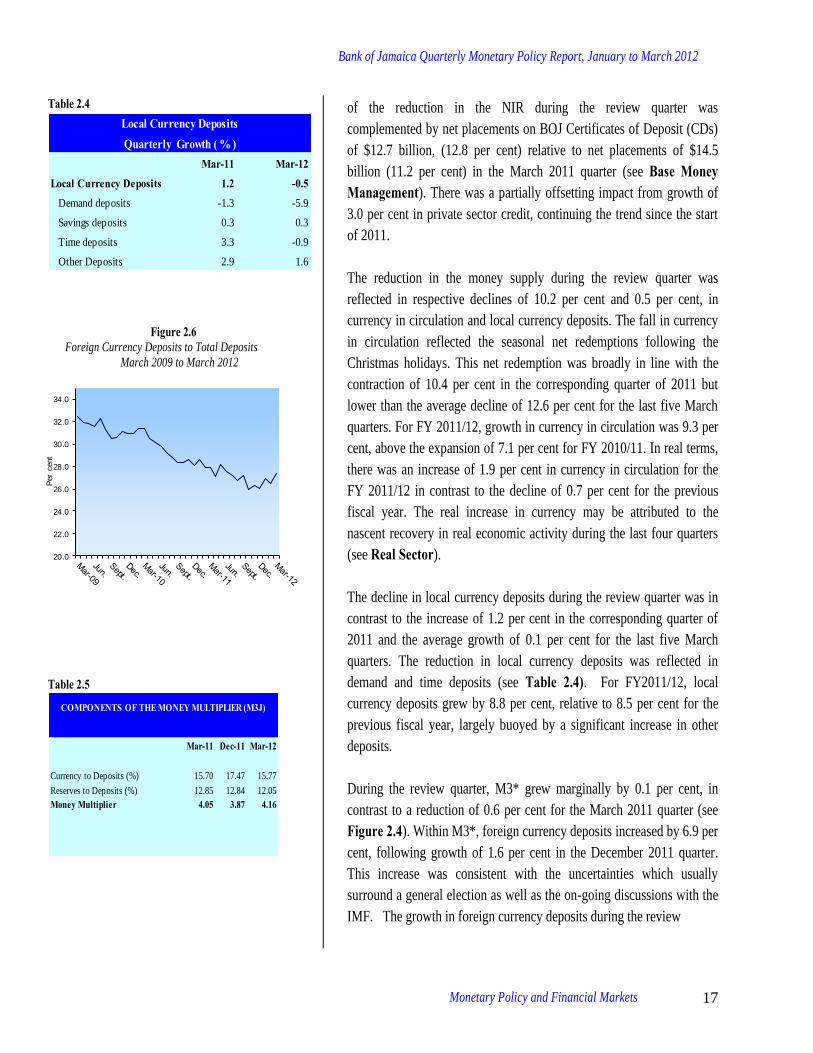
Figure 2.6 Foreign Currency Deposits to Total Deposits
March 2009 to March 2012
Table 2.5
of the reduction in the NIR during the review quarter was
complemented by net placements on BOJ Certificates of Deposit (CDs)
of $12.7 billion, (12.8 per cent) relative to net placements of $14.5
billion (11.2 per cent) in the March 2011 quarter (see Base Money Management). There was a partially offsetting impact from growth of
3.0 per cent in private sector credit, continuing the trend since the start
of 2011.
The reduction in the money supply during the review quarter was
reflected in respective declines of 10.2 per cent and 0.5 per cent, in
currency in circulation and local currency deposits. The fall in currency
in circulation reflected the seasonal net redemptions following the
Christmas holidays. This net redemption was broadly in line with the
contraction of 10.4 per cent in the corresponding quarter of 2011 but
lower than the average decline of 12.6 per cent for the last five March
quarters. For FY 2011/12, growth in currency in circulation was 9.3 per
cent, above the expansion of 7.1 per cent for FY 2010/11. In real terms,
there was an increase of 1.9 per cent in currency in circulation for the
FY 2011/12 in contrast to the decline of 0.7 per cent for the previous
fiscal year. The real increase in currency may be attributed to the
nascent recovery in real economic activity during the last four quarters
(see Real Sector).
The decline in local currency deposits during the review quarter was in
contrast to the increase of 1.2 per cent in the corresponding quarter of
2011 and the average growth of 0.1 per cent for the last five March
quarters. The reduction in local currency deposits was reflected in
demand and time deposits (see Table 2.4). For FY2011/12, local
currency deposits grew by 8.8 per cent, relative to 8.5 per cent for the
previous fiscal year, largely buoyed by a significant increase in other
deposits.
During the review quarter, M3* grew marginally by 0.1 per cent, in
contrast to a reduction of 0.6 per cent for the March 2011 quarter (see
Figure 2.4). Within M3*, foreign currency deposits increased by 6.9 per
cent, following growth of 1.6 per cent in the December 2011 quarter.
This increase was consistent with the uncertainties which usually
surround a general election as well as the on-going discussions with the
IMF. The growth in foreign currency deposits during the review
20.0
22.0
24.0
26.0
28.0
30.0
32.0
34.0
Per
cent
Mar-11 Dec-11 Mar-12
Currency to Deposits (%) 15.70 17.47 15.77
Reserves to Deposits (%) 12.85 12.84 12.05
Money Multiplier 4.05 3.87 4.16
COMPONENTS OF THE MONEY MULTIPLIER (M3J)
Bank of Jamaica Quarterly Monetary Policy Report, January to March 2012
Monetary Policy and Financial Markets 18
Table 2.6
quarter was reflected in all components, particularly the savings
deposits of non-profit organizations. There was also a modest increase
in the foreign currency demand deposits held by business firms. For FY
2011/12, foreign currency deposits increased by 6.1 per cent, in contrast
to the reduction of 8.3 per cent in the previous fiscal year. At end-March
2012, the ratio of foreign currency deposits to total deposits was 27.4
per cent, relative to 26.0 per cent at end-December 2011 and 27.9 per
cent at end-March 2011 (see Figure 2.6). This increase occurred in a
context of a faster increase in foreign currency deposits relative to the
growth in total deposits.
At end-March 2012, the money multiplier corresponding to M3J was 4.16,
relative to 3.87 at end-December 2011. This increase reflected declines in
both the currency to deposit and the reserve to deposit ratios (see Table 2.5). The decline in the currency to deposit ratio was largely as a
consequence of the seasonal net currency redemption during the period.
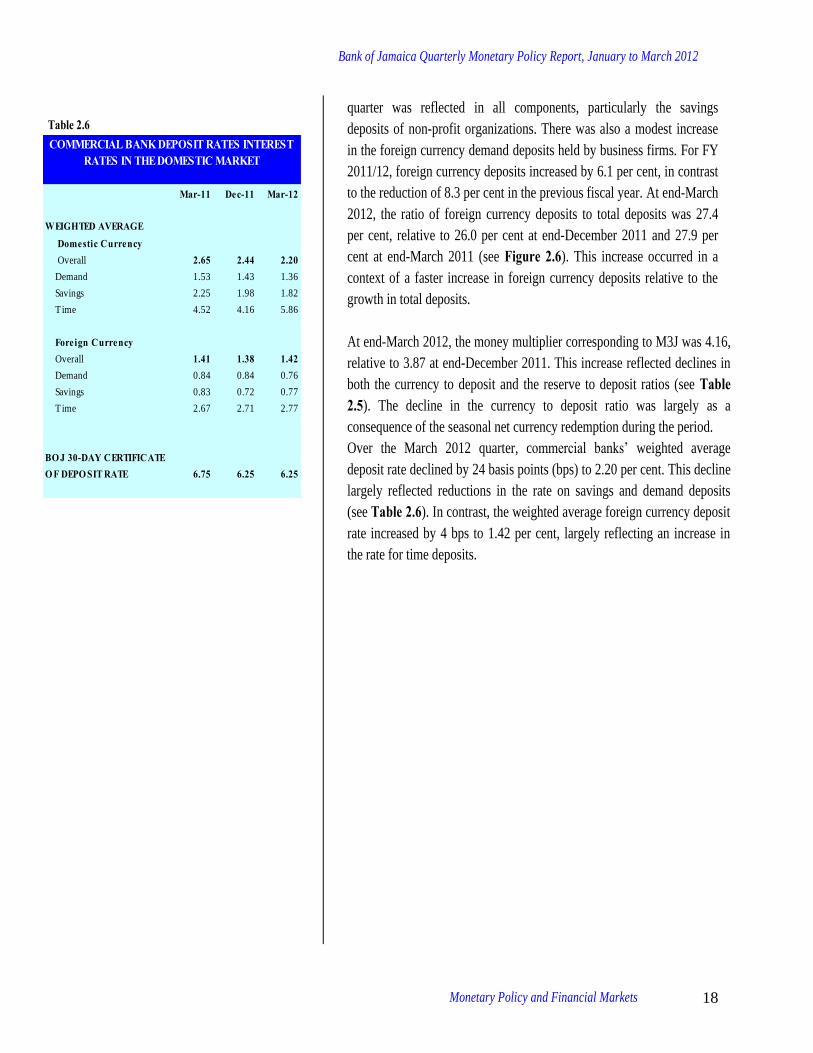
Over the March 2012 quarter, commercial banks’ weighted average
deposit rate declined by 24 basis points (bps) to 2.20 per cent. This decline
largely reflected reductions in the rate on savings and demand deposits
(see Table 2.6). In contrast, the weighted average foreign currency deposit
rate increased by 4 bps to 1.42 per cent, largely reflecting an increase in
the rate for time deposits.
Mar-11 Dec-11 Mar-12
WEIGHTED AVERAGE Domestic Currency Overall 2.65 2.44 2.20
Demand 1.53 1.43 1.36
Savings 2.25 1.98 1.82
Time 4.52 4.16 5.86
Foreign Currency Overall 1.41 1.38 1.42Demand 0.84 0.84 0.76
Savings 0.83 0.72 0.77
Time 2.67 2.71 2.77
BO J 30-DAY CERTIFICATEO F DEPO SIT RATE 6.75 6.25 6.25
COMMERCIAL BANK DEPOSIT RATES INTEREST RATES IN THE DOMESTIC MARKET
Bank of Jamaica Quarterly Monetary Policy Report, January to March 2012
Monetary Policy and Financial Markets 19
Mar-11 Dec-11 Mar-12
Business Lending -767.1 9 021.6 5 189.3Agriculture & Fishing -99.0 456.2 972.5
Mining & Quarrying 5.4 101.5 -74.3
Manufacturing 180.7 -21.4 595.0
Construction & Land Dev. -1 972.8 1 263.1 1 508.5
Transport, Storage & Comm. -75.3 2 815.8 -493.8
Tourism -551.0 -104.5 -1 565.8
Distribution 99.2 3 522.0 4 523.3
Professional & Other Services 240.0 897.0 -963.1
Electricity, Gas & Water 1 435.7 61.8 626.0
Entertainment -29.9 30.0 60.9
Personal & Other Lending 813.6 4 904.6 4 059.7Personal 829.2 4 917.1 4 279.4
Overseas Residents -15.7 -12.4 -219.7
Net Lending/(Repayment) 46.4 13 926.2 9 249.0
Commercial Bank Distribution of Total Loans & Advances to the Private Sector
(Quarterly Flows J$MN)
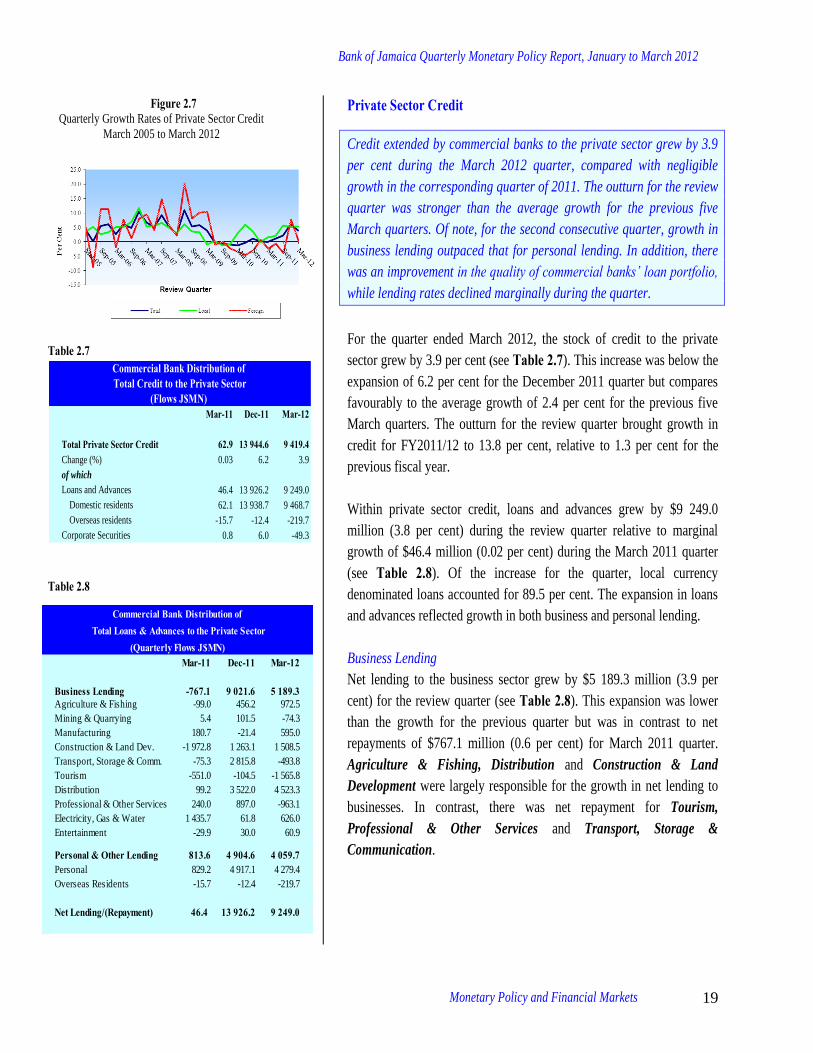
Figure 2.7 Quarterly Growth Rates of Private Sector Credit
March 2005 to March 2012
Table 2.7
Mar-11 Dec-11 Mar-12
Total Private Sector Credit 62.9 13 944.6 9 419.4Change (%) 0.03 6.2 3.9
of which
Loans and Advances 46.4 13 926.2 9 249.0
Domestic residents 62.1 13 938.7 9 468.7
Overseas residents -15.7 -12.4 -219.7
Corporate Securities 0.8 6.0 -49.3
Commercial Bank Distribution of Total Credit to the Private Sector
(Flows J$MN)
Table 2.8
Private Sector Credit
Credit extended by commercial banks to the private sector grew by 3.9
per cent during the March 2012 quarter, compared with negligible
growth in the corresponding quarter of 2011. The outturn for the review
quarter was stronger than the average growth for the previous five
March quarters. Of note, for the second consecutive quarter, growth in
business lending outpaced that for personal lending. In addition, there
was an improvement in the quality of commercial banks’ loan portfolio,
while lending rates declined marginally during the quarter.
For the quarter ended March 2012, the stock of credit to the private
sector grew by 3.9 per cent (see Table 2.7). This increase was below the
expansion of 6.2 per cent for the December 2011 quarter but compares
favourably to the average growth of 2.4 per cent for the previous five
March quarters. The outturn for the review quarter brought growth in
credit for FY2011/12 to 13.8 per cent, relative to 1.3 per cent for the
previous fiscal year.
Within private sector credit, loans and advances grew by $9 249.0
million (3.8 per cent) during the review quarter relative to marginal
growth of $46.4 million (0.02 per cent) during the March 2011 quarter
(see Table 2.8). Of the increase for the quarter, local currency
denominated loans accounted for 89.5 per cent. The expansion in loans
and advances reflected growth in both business and personal lending.
Business Lending
Net lending to the business sector grew by $5 189.3 million (3.9 per
cent) for the review quarter (see Table 2.8). This expansion was lower
than the growth for the previous quarter but was in contrast to net
repayments of $767.1 million (0.6 per cent) for March 2011 quarter.
Agriculture & Fishing, Distribution and Construction & Land
Development were largely responsible for the growth in net lending to
businesses. In contrast, there was net repayment for Tourism,
Professional & Other Services and Transport, Storage &
Communication.

Bank of Jamaica Quarterly Monetary Policy Report, January to March 2012
Monetary Policy and Financial Markets 20
Table 2.9
Table 2.10
The expansion in Distribution was largely denominated in foreign
currency and represented a syndicated facility to a group for loan re-
financing and the provision of working capital (see Tables 2.9 and 2.10). The growth in Agriculture & Fishing is consistent with the
outlook for the real sector (see Economic Outlook and Monetary Policy Perspectives).
Personal and Other Lending
Personal loans expanded by $4 279.4 million (4.2 per cent) during the
review quarter, continuing the pattern of strong growth observed since
the June 2011 quarter (see Table 2.8). The expansion in the review
quarter was reflected in local currency denominated loans.
Within personal loans, term loans expanded by $2 660.6 million (8.4 per
cent), a continuation of the significant growth observed since June 2009
quarter. Instalment credit, another component of personal loans,
increased by $748.0 million (2.2 per cent) during the March 2012
quarter, approximately the same rate of growth realised in the March
2011 quarter. This increase was largely reflected in loans for motor cars
and debt consolidation, which grew by 4.8 per cent and 1.4 per cent,
respectively (see Table 2.11). Consistent with the growth in loans for
debt consolidation, growth in commercial banks’ credit card receivables
remained flat.
Interest Rates
The weighted average interest rate on commercial bank loans reflected
further reduction in sectoral lending rates during the March 2012
quarter. In particular, the weighted average rate on public sector loans
declined by 13 basis points (bps), while the equivalent rate on private
sector loans declined by 35 bps. These movements facilitated a decline
in the overall weighted average rate by 33 bps to 17.70 per cent (see
Table 2.12).
The decline in the weighted average lending rate on private sector loans
for the review quarter was reflected in all categories. The largest
decline of 58 bps was observed in the weighted average rate on
commercial loans, which has been falling consistently since the March
2011 quarter. There was also a notable decline in the weighted average
interest rate on mortgage financing, which followed a much sharper
reduction during the previous quarter. The continuous declines in
mortgage rates may be attributed to increased competition among
Mar-11 Dec-11 Mar-12Business Lending 876.0 2 779.1 3 703.9Agriculture & Fishing 344.9 364.7 855.6
Mining & Quarrying 7.7 110.8 -82.9
Manufacturing 118.1 -364.4 1 179.4
Construction & Land Dev. 292.4 -147.4 1 107.4
Transport, Storage & Comm. 89.1 -81.2 -452.0
Tourism 55.4 148.4 -309.3
Distribution 232.0 1 845.8 1 480.6
Professional & Other Services -234.4 707.2 -492.4
Electricity, Gas & Water 31.1 150.8 445.3
Entertainment -60.3 44.5 -27.8
Personal & Other Lending 1 274.2 4 686.4 4 573.5Personal 1 297.1 4 713.3 4 595.1
Overseas Residents -22.8 -26.9 -21.6
Net Lending/(Repayment) 2 150.2 7 465.5 8 277.4
Commercial Bank Distribution of Local Currency Loans & Advances to the Private Sector
(Quarterly Flows J$MN)
Mar-11 Dec-11 Mar-12Business Lending -18.3 69.8 10.1Agriculture & Fishing -5.2 1.0 1.2
Mining & Quarrying 0.0 -0.1 0.1
Manufacturing 0.8 3.9 -6.9
Construction & Land Development -26.3 15.9 3.2
Transport, Storage & Comm. -1.9 33.4 -1.1
Tourism -6.7 -4.0 -17.1
Distribution -1.4 19.1 34.1
Electricity, Gas & Water 16.5 -1.2 1.6
Entertainment 0.4 -0.2 1.0
Professional & Other Services 5.6 2.0 -6.0
Persoanl & Other Lending -5.2 2.0 -7.1Personal -5.4 2.1 -4.2
Overseas Residents 0.2 -0.1 -2.9
Total Net Lending/(Repayment) Flows -23.5 71.8 2.9
Commercial Bank Distribution of Foreign Currency Loans & Advances to the
Private Sector (Quarterly Flows US$MN)
Bank of Jamaica Quarterly Monetary Policy Report, January to March 2012
Monetary Policy and Financial Markets 21
Table 2.11
Table 2.12
2011 2012Mar Jun Sep Dec Mar
Overall 20.52 20.10 18.34 18.03 17.70
Public Sector 11.58 10.13 10.40 9.98 9.85 Local Govt. & Other
Public Entities 12.94 10.17 11.14 10.61 9.95
Central Government 11.00 10.12 10.12 9.77 9.80
Private Sector 20.97 20.54 18.65 18.31 17.96 Instalment 20.63 20.20 19.56 19.20 18.92
Mortgage 15.83 15.05 13.40 12.36 12.20
Personal 25.70 25.48 21.73 21.66 21.57
Commercial 16.63 15.91 15.12 14.63 14.05
Commercial BankDomestic Currency Average Weighted
Lending Rates by Loan Type(Per Cent)
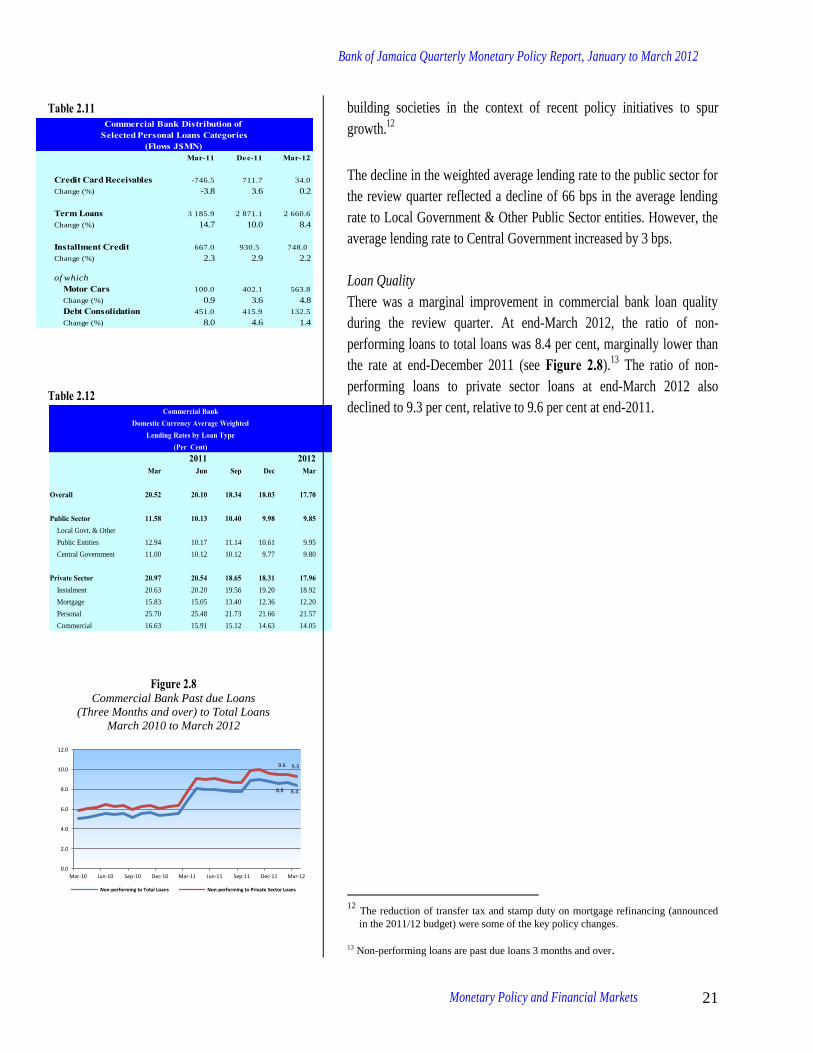
Figure 2.8
Commercial Bank Past due Loans
(Three Months and over) to Total Loans
March 2010 to March 2012
building societies in the context of recent policy initiatives to spur
growth.12
The decline in the weighted average lending rate to the public sector for
the review quarter reflected a decline of 66 bps in the average lending
rate to Local Government & Other Public Sector entities. However, the
average lending rate to Central Government increased by 3 bps.
Loan Quality
There was a marginal improvement in commercial bank loan quality
during the review quarter. At end-March 2012, the ratio of non-
performing loans to total loans was 8.4 per cent, marginally lower than
the rate at end-December 2011 (see Figure 2.8).13
The ratio of non-
performing loans to private sector loans at end-March 2012 also
declined to 9.3 per cent, relative to 9.6 per cent at end-2011.
12
The reduction of transfer tax and stamp duty on mortgage refinancing (announced
in the 2011/12 budget) were some of the key policy changes.
13 Non-performing loans are past due loans 3 months and over.
8.8 8.4
9.6 9.3
0.0
2.0
4.0
6.0
8.0
10.0
12.0
Mar-10 Jun-10 Sep-10 Dec-10 Mar-11 Jun-11 Sep-11 Dec-11 Mar-12
Non-performing to Total Loans Non-performing to Private Sector Loans
Mar-11 Dec-11 Mar-12
Credit Card Receivables -746.5 711.7 34.0
Change (%) -3.8 3.6 0.2
Term Loans 3 185.9 2 871.1 2 660.6
Change (%) 14.7 10.0 8.4
Installment Credit 667.0 930.5 748.0
Change (%) 2.3 2.9 2.2
of which
Motor Cars 100.0 402.1 563.8
Change (%) 0.9 3.6 4.8
Debt Consolidation 451.0 415.9 132.5
Change (%) 8.0 4.6 1.4
Commercial Bank Distribution of Selected Personal Loans Categories
(Flows J$MN)
Bank of Jamaica Quarterly Monetary Policy Report, January to March 2012
Monetary Policy and Financial Markets 22
Table 2.13
Issue Date Tenor Avg. yield Amount AmountAllotted Maturing
(days) (%) (J$MN) (J$MN)
14-Dec-11 28 6.49 400.0 400.0
23-Dec-11 91 6.21 400.0 400.0
23-Dec-11 182 6.46 400.0 400.0
18-Jan-12 28 6.41 400.0 400.0
25-Jan-12 91 6.22 400.0 400.0
25-Jan-12 182 6.53 400.0 400.0
15-Feb-12 28 6.36 400.0 400.0
15-Feb-12 91 6.21 400.0 400.0
15-Feb-12 182 6.57 400.0 400.0
21-Mar-12 28 6.24 400.0 400.0
21-Mar-12 91 6.27 400.0 400.0
21-Mar-12 182 6.47 400.0 400.0
Treasury Bill Auctions and MaturitiesDecember 2011 - March 2012
Bond Market
During the March 2012 quarter, market-determined interest rates
exhibited mixed movements. While the average yields on the GOJ 30-
day Treasury Bill declined over the quarter, the average yield on the 90-
day increased and the 180-day remained relatively flat. These
movements reflected a convergence to BOJ’s policy rate. However,
private money market rates increased, on average during the review
quarter, reflecting increased concentration of liquidity in a few
institutions as well as the impact on liquidity of GOJ debt-raising
activities.
There were net maturities on GOJ debt instruments for the review
quarter, mainly reflecting the maturity of a 2-year Fixed Rate (FR)
Benchmark Investment (BMI) Note. The GOJ issued seven debt
instruments during the quarter, two of which were new. The preference
for variable rate instruments by investors continued during the quarter,
as reflected in the stronger level of subscriptions.
In the context of an improvement in the prospects for the Euro area,
there was a decline in the average yield on GOJ global bonds during
the review quarter relative to the December 2011 quarter.
Notwithstanding, the spread between the yields on GOJ global bonds
and the US Treasury bills widened, largely related to market
perceptions of increased domestic risk factors.
There were mixed movements in the average yields on GOJ Treasury
Bills during the March 2012 quarter. The average yield on the 30-day
Treasury Bill was lower by 25 basis points (bps) at end-March 2012,
relative to end-December 2011. In contrast, the average yields on the
90-day and 180-day Treasury Bills increased by 6 bps and 1 bp
respectively, over the same period (see Table 2.13). The movements in
the yield on the 90-day instrument reflected a convergence towards the
rate on the BOJ’s 30-day Certificate of Deposit (CD). At the end of the
review quarter, the yield on the 30-day Treasury Bill was 1 bp below the
yield on the Bank’s corresponding OMO instrument.
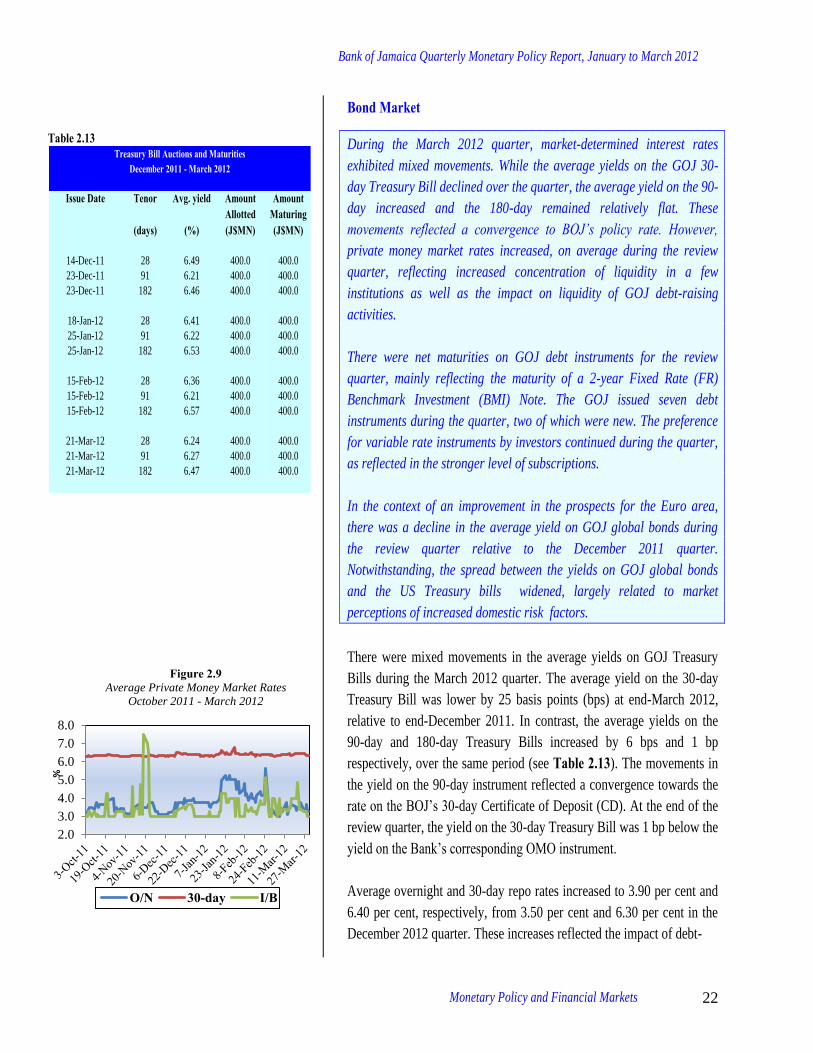
Average overnight and 30-day repo rates increased to 3.90 per cent and
6.40 per cent, respectively, from 3.50 per cent and 6.30 per cent in the
December 2012 quarter. These increases reflected the impact of debt-
2.0
3.0
4.0
5.0
6.0
7.0
8.0
%
Figure 2.9 Average Private Money Market Rates
October 2011 - March 2012
O/N 30-day I/B
Bank of Jamaica Quarterly Monetary Policy Report, January to March 2012
Monetary Policy and Financial Markets 23
Table 2.14
Table 2.15
raising activities of the Government in mid-January and February. In
addition, the increases in rates were due to the concentration of domestic
liquidity emanating from OMO maturities in a few institutions during
the review period. In contrast to the movements in the other private
money market rates, average inter-bank rates declined to 3.50 per cent
in the March 2012 quarter from 3.60 per cent for the previous quarter.
There was an overall net placement of $14.9 billion on the Bank’s 30-
day CD during the review quarter, compared to net maturity of $28.2
billion the previous quarter (see Table 2.14). The net placement on
BOJ’s 30-day CD was partly financed from currency reflows as well as
proceeds from the maturity of the FR BMI Note in February. The Bank
continued to offer the 30-day and overnight instruments at 6.25 per cent
and 0.25 per cent, respectively, throughout the review quarter (see
Monetary Policy and Base Money Management).
The Government net redeemed approximately $7.7 billion in domestic
debt for the quarter, compared with a net issue of $14.4 billion for the
December 2011 quarter. Seven instruments were issued during the
quarter, two of which were new primary issues; a FR 7.20% BMI Note,
scheduled to mature in 2015 and an 8-year Variable Rate (VR) BMI
Note (see Appendix, Tables 8A and 8B). The FR 7.20% BMI Note
was a limited auction of $4.0 billion and was oversubscribed by 90.1 per
cent. The average yield on this instrument was 7.22 per cent.14
In
relation to the VR instrument, the re-pricing margin was set at 1.375
percentage points above the yield on the 180-day Treasury Bill, relative
to previously issued VR BMIs that were linked to the 90-day Treasury
Bill. Including the new primary issue, a total of four VR BMI Notes
were issued, representing 81.0 per cent of gross financing for the period.
With regards to amortisation, the FR 12.0% BMI Note which matured in
February yielding liquidity of $33.0 billion, represented the first
maturity of the debt instruments created in the Jamaica Debt Exchange
(see Table 2.15).
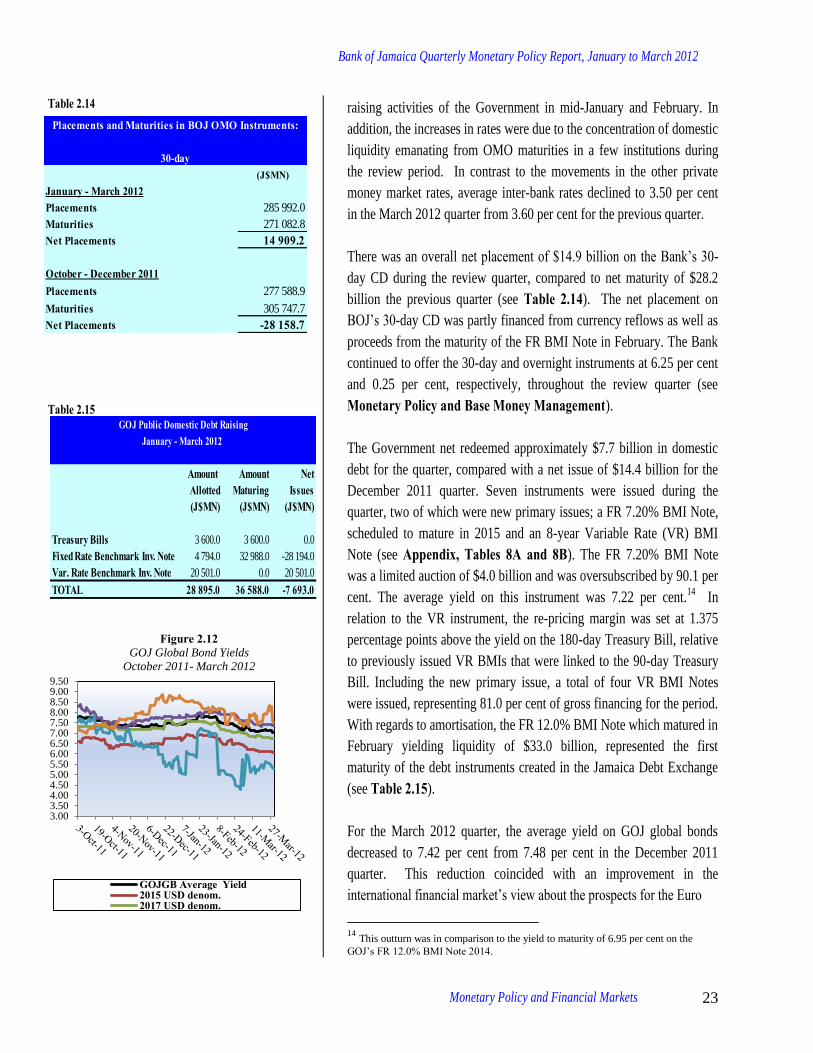
For the March 2012 quarter, the average yield on GOJ global bonds
decreased to 7.42 per cent from 7.48 per cent in the December 2011
quarter. This reduction coincided with an improvement in the
international financial market’s view about the prospects for the Euro
14
This outturn was in comparison to the yield to maturity of 6.95 per cent on the
GOJ’s FR 12.0% BMI Note 2014.
3.003.504.004.505.005.506.006.507.007.508.008.509.009.50
Figure 2.12 GOJ Global Bond Yields
October 2011- March 2012
GOJGB Average Yield2015 USD denom.2017 USD denom.
(J$MN)January - March 2012Placements 285 992.0
Maturities 271 082.8
Net Placements 14 909.2
October - December 2011Placements 277 588.9
Maturities 305 747.7
Net Placements -28 158.7
Placements and Maturities in BOJ OMO Instruments:
30-day
Amount Amount NetAllotted Maturing Issues(J$MN) (J$MN) (J$MN)
Treasury Bills 3 600.0 3 600.0 0.0
Fixed Rate Benchmark Inv. Note 4 794.0 32 988.0 -28 194.0
Var. Rate Benchmark Inv. Note 20 501.0 0.0 20 501.0
TOTAL 28 895.0 36 588.0 -7 693.0
GOJ Public Domestic Debt RaisingJanuary - March 2012

Bank of Jamaica Quarterly Monetary Policy Report, January to March 2012
Monetary Policy and Financial Markets 24
0.0
1.0
2.0
3.0
4.0
5.0
6.0
7.0
Per
cen
tage
poi
nts
Figure 2.11Interest Rate Spread
GOJ Globals vs EMBI and US Treasuries
GOJ Global - EMBI
GOJ Global - US Treasuries
area in the context of the finalization of a second bailout package for
Greece. The decline in the average yield on GOJ global bonds was
largely reflected in the yields of the two euro-denominated bonds.
Notwithstanding the fall, the average spread between the yields on GOJ
global bonds and those on US Treasury bonds of a similar maturity
increased by 4 bps to 5.56 percentage points. The average yield spread
between the GOJ global bonds and the EMBI+ also increased by 34 bps
points to 2.05 percentage points, relative to the same measure at the end
of the previous quarter. This suggests that domestic risk factors affected
the market’s perception of Jamaican bonds over the quarter.

Bank of Jamaica Quarterly Monetary Policy Report, January to March 2012
Monetary Policy and Financial Markets 25
-15.0
-5.0
5.0
15.0
25.0
35.0
-10.0
-6.0
-2.0
2.0
6.0
10.0
14.0
Per
cen
t
JSE Index All JamaicaJSE Select Cross ListedJuniour Mrk (right axis)
0.0
2.0
4.0
6.0
8.0
10.0
12.0
0.0
100.0
200.0
300.0
400.0
500.0
600.0
J$BN
unit
s tr
aded
(MN
)
volumes traded values traded
-2.0
-1.5
-1.0
-0.5
0.0
0.5
1.0
1.5
2.0
Retu
rn (%
)
Equities 30-day Repo Foreign Exchange
Stock Market All the JSE indices recorded declines for the March 2012 quarter, despite
improved earnings results of several listed companies, the continued low
domestic interest rates and relatively stable conditions in the foreign exchange
market. This decline in the local equities market was influenced by uncertainties
regarding the upcoming fiscal budget and the timing of a signing of a new
agreement between Jamaica and the International Monetary Fund.
For the March 2012 quarter, declines were recorded across all JSE indices within
a range of 1.2 per cent to 12.5 per cent. Notably, the Junior Market Index
recorded the sharpest decline among the indices.15
The sharp decline in the Junior
Market Index, which consistently outperformed the Main Market (JSE) Index
since its inception, can be attributed to uncertainty associated with the proposed
removal of the 50.0 per cent tax credit to companies during their second five
years as listed entities on the junior market. With respect to the JSE Index, for the
review quarter, the index declined by 4.1 per cent to close at 91 369.0 points. This
was in contrast to growth of 3.9 per cent and 1.5 per cent for the December 2011
and March 2011 quarters, respectively (see Figure 2.12). The decline occurred
despite improved earnings of several listed companies, relatively low domestic
interest rates and general stability in the foreign exchange market.16
The performance of the local equities market was reflected in declines in market
activity indicators during the review quarter. Specifically, the volume of stocks
traded, the value of transactions and the number of transactions declined by 42.9
per cent, 57.0 per cent and 17.7 per cent, respectively, relative to respective
growth of 20.0 per cent, 111.8 per cent and 3.2 per cent for the prior quarter (see
Figure 2.13). In addition, the advance-to-decline ratio was 6:25 which compares
unfavourably to a ratio of 26:6 recorded in the previous quarter. Stocks from
Finance and Manufacturing accounted for seven of the top ten declining stocks
and recorded respective average price depreciations of 18.7 per cent and 18.5 per
cent for the review quarter (see Table 2.16). Finance and Other accounted for
four of the six advancing stocks on the Main Market Index and recorded average
price increases of 6.6 per cent and 5.1 per cent, respectively, for the review
quarter (see Table 2.17).
15
Of note, for the quarter the All Jamaica, JSE Select, Cross-listed and Combined indices declined by 5.7
per cent, 5.2 per cent, 1.2 per cent and 4.4 per cent, respectively.
16 See Money and Credit and Foreign Exchange Market.
Figure 2.12 Quarterly Growth of the JSE Indices
March 2011 – March 2012
Figure 2.14
Average Monthly Returns from Equities,
Foreign Currency and Fixed Income
Investments
Figure 2.13 Quarterly Movements in Volumes & Values Traded
March 2011 – March 2012

Bank of Jamaica Quarterly Monetary Policy Report, January to March 2012
Monetary Policy and Financial Markets 26
Table 2.16
Price $ Qtr. Change
Companies ($) (%)
ManufacturingCaribbean Cement Company 2.4 -20.7
Jamaica Broilers Group 4.8 -18.6
Desnoes & Geddes 4.3 -16.2
FinanceJamaica Money Market Broker 9.8 -21.0
Scotia Investments Jamaica Ltd 23.2 -19.8
Barita Investments Limited 3.9 -17.2
Mayberry Investment Limited 2.7 -16.9
CommunicationsCable & Wireless 0.2 -20.0
TourismCiboney Group 0.04 -20.0
O therPulse Investments Ltd. 1.8 -27.8
Declining Stocks as at end-March 2012
Table 2.17
Price Qtr. Change Companies ($) (%)
Finance
Scotia Group Jamaica 26.7 11.3
Capital & Credit Financial Grp. 4.6 2.0
InsuranceSagicor Life Jamaica 10.8 8.3
O therPalace Amusement 55.0 10.0
Kingston Properties Limited 4.5 0.2
RetailCarreras Limited 63.0 2.4
Advancing Stocks as at end-March 2012
The poor performance of the JSE indices occurred within a context of negative
investor sentiments associated with uncertainty regarding the measures that might
be announced in the upcoming fiscal budget presentation and the timing and
terms of a new agreement between the International Monetary Fund and the
Government of Jamaica.17
17
Generally, when there is uncertainty in the economy, sentiment (investor) often turns negative resulting in
investors becoming more cautious and exiting asset classes that have higher risk.

Bank of Jamaica Quarterly Monetary Policy Report, January to March 2012
Monetary Policy and Financial Markets 29
(*) Volatility is calculated as the standard deviation of the daily
logarithmic returns, based on the WASR.
Foreign Exchange Market The foreign exchange rate remained relatively stable during the March
2012 quarter, as reflected in a marginal depreciation of 0.80 per cent in the
weighted average selling rate (WASR) of the US dollar vis-à-vis the
Jamaica Dollar. This followed a 0.34 per cent depreciation in the
preceding quarter (see Figure 2.15). The increased pace of depreciation
was principally influenced by periods of excess demand for foreign
currency associated with a decline in net private capital (NPC) inflows.
Against this background, the Bank sold US$102.1 million (net), to the
market during the quarter. This contributed to a decline in the net
international reserves (NIR) of US$189.0 million to US$1 777.1 million for
the March 2012 quarter.
The WASR of the US dollar vis-á-vis the Jamaica Dollar depreciated by
0.80 per cent for the review quarter to J$87.30 = US$1.00 at end-March
2012. This was in comparison to a depreciation of 0.34 per cent in the
December 2011 quarter. The overall decline in the value of the domestic
currency, for the quarter, reflected depreciations of 0.27 per cent, 0.26 per
cent and 0.28 per cent in January, February and March, respectively (see
Figure 2.15). For FY2011/12, the value of the Jamaica Dollar depreciated
by 1.8 per cent vis-à-vis the US dollar, relative to an appreciation of 4.2 per
cent in FY2010/11.
Changes in the measures of foreign exchange market volatility were mixed.
The standard deviation of daily returns from holding US dollars declined
compared to the preceding quarter (See Figure 2.17). However, the average
bid-ask spread expressed as a percentage of the buying rate increased when
compared with the same measure for the previous quarter (see Figure 2.18).
The average weekly trading range for the selling rate was largely
unchanged (see Figure 2.16).18
The Bank estimates that NPC inflows declined by US$308.7 million,
relative to the previous quarter. NPC inflows were, however, nearly
sufficient to finance the demand for BOP current account transactions (see
Table 2.18). Notwithstanding this outturn, the pressures that emerged
during the quarter reflected periods when the demand to finance current
18 The trading range for the exchange rate is an indicator of risk or uncertainty. It is the difference
between the high and low quotes for the sale of US dollars over a particular period. A narrowing of
the spread is an indicator of more stable conditions in the foreign exchange market.
Figure 2.15 Percentage Change in Weighted Average
Selling Exchange Rate (e.o.p.)
(J$1.00= US$)
Figure 2.17 Exchange Rate Volatility (*)
Figure 2.16 Exchange Rate Trading Range
0.00
0.05
0.10
0.15
0.20
0.25
J$ =
US
$1
Quarter
Figure 2.18 Exchange Rate Spread as a
Percentage of the Buying Rate
0.380.400.420.440.460.480.500.520.540.560.58
Pe
r c
en
t (%
)
Quarter
-1.0
-0.5
0.0
0.5
1.0
1.5
2.0
2.5
3.0
3.5
Per
cen
t (%
)
Month
0.00900.00950.01000.01050.01100.01150.01200.01250.01300.01350.0140
Per
cen
t (%
)
Quarter

Bank of Jamaica Quarterly Monetary Policy Report, January to March 2012
Monetary Policy and Financial Markets 30
Table 2.18
* BOJ estimates of cash flows within the private domestic economy
Table 2.19
account transactions exceeded NPC inflows. Portfolio
inflows were constrained by increased investor
uncertainty regarding the status of an IMF programme.
In addition, there was heightened Jamaica Dollar
liquidity associated with the net maturity of a local currency denominated
GOJ bond in February. This liquidity reduced the need to convert foreign
currency to meet the seasonal tax payments and other obligations in March.
The Bank estimates that there was, however, a US$463.8 million decline in
foreign currency demand to satisfy BOP current account transactions,
relative to the December 2011 quarter. This was largely related to a
seasonal decline in payments for imports of consumer goods and raw
materials. In addition, foreign currency inflows were buoyed by a seasonal
uptick in earnings from tourism as well as higher revenue from sugar and
non-traditional exports, relative to the previous quarter. These changes
coincided with a 2.9 per cent increase in average per diem purchases by the
authorized dealers to US$29.1 million. Concurrently, average per diem
sales increased by 13.8 per cent to US$30.7 million, relative to the
preceding quarter.
To moderate the intermittent pressures that emerged in the foreign
exchange market during the quarter, the Bank sold a total of US$102.1
million, of which US$68.3 million (net) was sold in January and US$33.8
million (net) in March. At end-March 2012, the NIR was US$1 777.1
million, a decline of US$189.0 million, relative to end-December 2011 (see
Table 2.19). The Bank’s gross reserves at end-March 2012 amounted to
US$2 638.9 million, representing 17.0 weeks of projected goods and
services imports. This compared favourably with the international minimum
benchmark of 12.0 weeks (see Figure 2.19).
Net International Reserves (US$MN)
Month Stock One Month
Change
Oct – 11 2 032.2 -48.4
Nov – 11 1 961.7 -70.4
Dec – 11 1 966.1 4.4
Jan – 12 1 882.6 -83.5
Feb – 12 1 874.7 -8.0
Mar – 12 1 777.1 -97.5
Foreign Exchange Cash Flows*
US$MN
Change Relative
to Previous 2011 2011 2012
Jan –
Mar
Oct –
Dec
Jan –
Mar
Quarter Year
Net Current Inflows -451.0 -741.8 -278.0 463.8 173.0
Current Inflows 874.6 915.7 1 051.4 135.7 176.8
Current Outflows 1 325.6 1 657.5 1 329.4 -328.1 3.8
Net Private Capital Inflows
Balance
650.3 582.9 274.2 -308.7 -376.0
199.3 -158.9 -3.8 155.1 -203.1
5.0
10.0
15.0
20.0
25.0
0.0
500.0
1000.0
1500.0
2000.0
2500.0
3000.0
3500.0
4000.0
Mar-
10
Jun-
10
Sep-
10
Dec-
10
Mar-
11
Jun-
11
Sep-
11
Dec-
11
Mar-
12
WE
EK
S
US
$M
N
Quarter
Gross ReservesWks of Goods and Services ImportsMinimum Reserves Benchmark
Figure 2.19 Gross Reserves and Weeks of Goods
and Services Imports
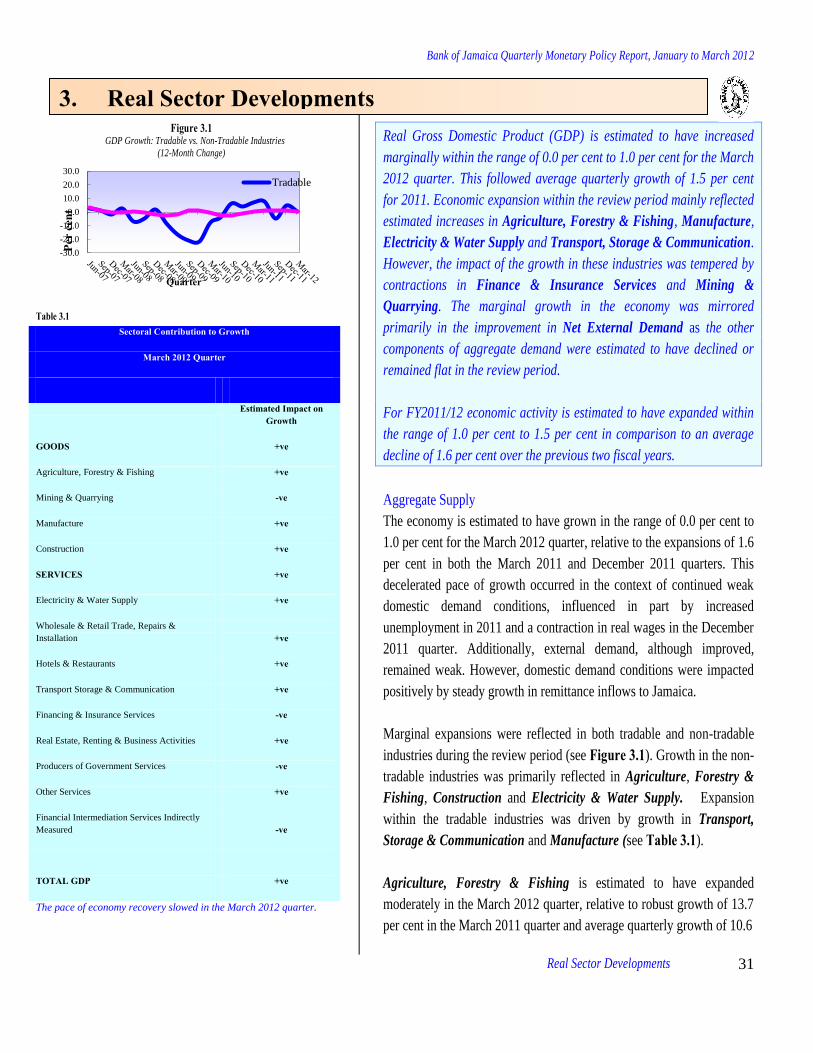
Bank of Jamaica Quarterly Monetary Policy Report, January to March 2012
Real Sector Developments
31
Figure 3.1
GDP Growth: Tradable vs. Non-Tradable Industries
(12-Month Change)
Table 3.1
The pace of economy recovery slowed in the March 2012 quarter.
Real Gross Domestic Product (GDP) is estimated to have increased
marginally within the range of 0.0 per cent to 1.0 per cent for the March
2012 quarter. This followed average quarterly growth of 1.5 per cent
for 2011. Economic expansion within the review period mainly reflected
estimated increases in Agriculture, Forestry & Fishing, Manufacture,
Electricity & Water Supply and Transport, Storage & Communication.
However, the impact of the growth in these industries was tempered by
contractions in Finance & Insurance Services and Mining &
Quarrying. The marginal growth in the economy was mirrored
primarily in the improvement in Net External Demand as the other
components of aggregate demand were estimated to have declined or
remained flat in the review period.
For FY2011/12 economic activity is estimated to have expanded within
the range of 1.0 per cent to 1.5 per cent in comparison to an average
decline of 1.6 per cent over the previous two fiscal years.
Aggregate Supply
The economy is estimated to have grown in the range of 0.0 per cent to
1.0 per cent for the March 2012 quarter, relative to the expansions of 1.6
per cent in both the March 2011 and December 2011 quarters. This
decelerated pace of growth occurred in the context of continued weak
domestic demand conditions, influenced in part by increased
unemployment in 2011 and a contraction in real wages in the December
2011 quarter. Additionally, external demand, although improved,
remained weak. However, domestic demand conditions were impacted
positively by steady growth in remittance inflows to Jamaica.
Marginal expansions were reflected in both tradable and non-tradable
industries during the review period (see Figure 3.1). Growth in the non-
tradable industries was primarily reflected in Agriculture, Forestry &
Fishing, Construction and Electricity & Water Supply. Expansion
within the tradable industries was driven by growth in Transport,
Storage & Communication and Manufacture (see Table 3.1).
Agriculture, Forestry & Fishing is estimated to have expanded
moderately in the March 2012 quarter, relative to robust growth of 13.7
per cent in the March 2011 quarter and average quarterly growth of 10.6
-30.0
-20.0
-10.0
0.0
10.0
20.0
30.0
Per
cent
Quarter
Tradable
Sectoral Contribution to Growth
March 2012 Quarter
Estimated Impact on
Growth
GOODS +ve
Agriculture, Forestry & Fishing +ve
Mining & Quarrying -ve
Manufacture +ve
Construction +ve
SERVICES +ve
Electricity & Water Supply +ve
Wholesale & Retail Trade, Repairs &
Installation +ve
Hotels & Restaurants +ve
Transport Storage & Communication +ve
Financing & Insurance Services -ve
Real Estate, Renting & Business Activities +ve
Producers of Government Services -ve
Other Services +ve
Financial Intermediation Services Indirectly
Measured -ve
TOTAL GDP +ve
3. Real Sector Developments
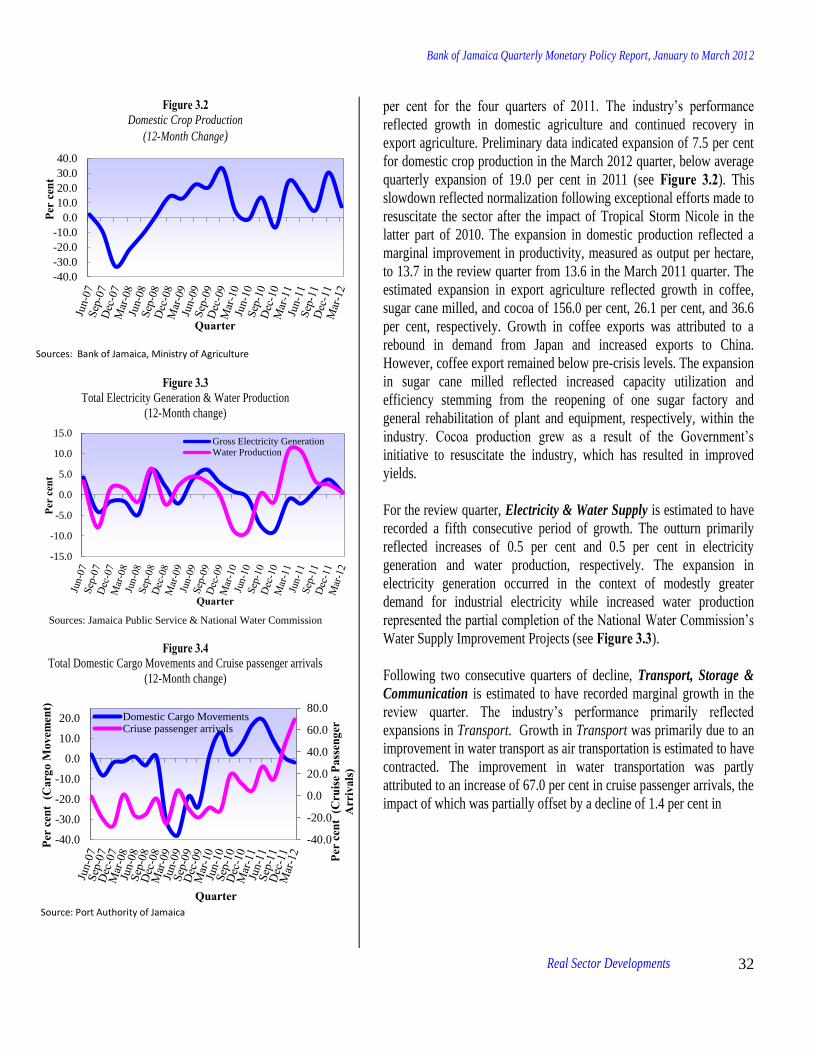
Bank of Jamaica Quarterly Monetary Policy Report, January to March 2012
Real Sector Developments
32
Figure 3.2 Domestic Crop Production
(12-Month Change)
Sources: Bank of Jamaica, Ministry of Agriculture
Figure 3.3 Total Electricity Generation & Water Production
(12-Month change)
Sources: Jamaica Public Service & National Water Commission
Figure 3.4 Total Domestic Cargo Movements and Cruise passenger arrivals
(12-Month change)
Source: Port Authority of Jamaica
per cent for the four quarters of 2011. The industry’s performance
reflected growth in domestic agriculture and continued recovery in
export agriculture. Preliminary data indicated expansion of 7.5 per cent
for domestic crop production in the March 2012 quarter, below average
quarterly expansion of 19.0 per cent in 2011 (see Figure 3.2). This
slowdown reflected normalization following exceptional efforts made to
resuscitate the sector after the impact of Tropical Storm Nicole in the
latter part of 2010. The expansion in domestic production reflected a
marginal improvement in productivity, measured as output per hectare,
to 13.7 in the review quarter from 13.6 in the March 2011 quarter. The
estimated expansion in export agriculture reflected growth in coffee,
sugar cane milled, and cocoa of 156.0 per cent, 26.1 per cent, and 36.6
per cent, respectively. Growth in coffee exports was attributed to a
rebound in demand from Japan and increased exports to China.
However, coffee export remained below pre-crisis levels. The expansion
in sugar cane milled reflected increased capacity utilization and
efficiency stemming from the reopening of one sugar factory and
general rehabilitation of plant and equipment, respectively, within the
industry. Cocoa production grew as a result of the Government’s
initiative to resuscitate the industry, which has resulted in improved
yields.
For the review quarter, Electricity & Water Supply is estimated to have
recorded a fifth consecutive period of growth. The outturn primarily
reflected increases of 0.5 per cent and 0.5 per cent in electricity
generation and water production, respectively. The expansion in
electricity generation occurred in the context of modestly greater
demand for industrial electricity while increased water production
represented the partial completion of the National Water Commission’s
Water Supply Improvement Projects (see Figure 3.3).
Following two consecutive quarters of decline, Transport, Storage &
Communication is estimated to have recorded marginal growth in the
review quarter. The industry’s performance primarily reflected
expansions in Transport. Growth in Transport was primarily due to an
improvement in water transport as air transportation is estimated to have
contracted. The improvement in water transportation was partly
attributed to an increase of 67.0 per cent in cruise passenger arrivals, the
impact of which was partially offset by a decline of 1.4 per cent in
-40.0
-30.0
-20.0
-10.0
0.0
10.0
20.0
30.0
40.0
Per
cent
Quarter
-15.0
-10.0
-5.0
0.0
5.0
10.0
15.0
Per
cent
Quarter
Gross Electricity GenerationWater Production
-40.0
-20.0
0.0
20.0
40.0
60.0
80.0
-40.0
-30.0
-20.0
-10.0
0.0
10.0
20.0
Per
cent
(C
ruis
e Pa
ssen
ger
Arr
ival
s)
Per
cent
(C
argo
Mov
emen
t)
Quarter
Domestic Cargo MovementsCriuse passenger arrivals

Bank of Jamaica Quarterly Monetary Policy Report, January to March 2012
Real Sector Developments
33
Figure 3.5 Trends in Alumina &Total Bauxite Production
(12-Month Change)
Source: Jamaica Bauxite Institute
Figure 3.6 Total Stop-over Visitor Arrivals & Visitor Expenditure
(12-Month Change)
Source: Jamaica Tourist Board
domestic cargo movements. Increased cruise passenger arrivals continue
to reflect the opening of the Falmouth Pier in March 2011. Lower cargo
movements resulted from a slowdown in global trade (see Figure 3.4).
For the third consecutive quarter Manufacture is estimated to have
expanded, albeit at a slower pace than the average quarterly growth of
3.4 per cent for the second half of 2011. Expansions were estimated for
both Food & Beverages and Other Manufacturing. Within Food &
Beverages, higher output is estimated primarily for Sugar & Molasses
while the expansion in Other Manufacturing mainly reflected greater
production of chemical products, particularly ethanol.
Construction is estimated to have grown for the fourth consecutive
quarter in line with the average quarterly expansion of 0.6 per cent for
2011. The estimated growth is associated with the continuation of
infrastructural development programmes such as Jamaica Development
Infrastructure Programme, road improvement projects financed through
the Road Maintenance Fund as well as activities to rehabilitate and
protect the Palisados shoreline. Additionally, residential construction
expanded in the review period based on preliminary estimates of an
increase of 67.5 per cent in housing starts from the National Housing
Trust, relative to the corresponding period in 2011.
Following seven consecutive quarters of growth, Mining & Quarrying
is estimated to have contracted in the review period. The decline in the
quarter was attributed to lower capacity utilization in the alumina and
bauxite industries of 42.1 per cent and 91.7 per cent, respectively,
relative to 44.7 per cent and 100.0 per cent in the March 2011 quarter.
Lower capacity utilization in the alumina industry was attributed to a
disruption in production due to electrical and mechanical difficulties at
one alumina plant. Reduced capacity utilization in bauxite production
was attributed to loss of man-hours due to protests during the review
quarter. In this context, total bauxite and alumina production declined
by 7.7 per cent and 5.2 per cent, respectively, for the review quarter (see
Figure 3.5).
-80.0
-60.0
-40.0
-20.0
0.0
20.0
40.0
60.0
Per
cent
Quarter
Alumina
-10.0
-5.0
0.0
5.0
10.0
15.0
Per
cent
Quarter
Stop Over Visitor Arrivals
Visitor Expenditure

Bank of Jamaica Quarterly Monetary Policy Report, January to March 2012
Real Sector Developments
34
Figure 3.7 Trends in Exports and Imports
Source: BOJ & STATIN
Figure 3.8 Production & Consumption Tax, Direct Investment and Capital Goods
Imports
(12-Month Change)
Source: BOJ & STATIN
In the context of lower airlifts to the Island and warmer winter
conditions in the main source markets relative to the comparable period
of 2011, Hotels & Restaurants is estimated to have expanded
marginally in the review quarter. While Restaurants is estimated to have
grown moderately Hotels declined marginally during the quarter. The
estimated decline in Hotels reflected contractions of 0.3 per cent in stop-
over visitor arrivals, relative to the corresponding quarter in 2011. There
was, however, an increase of 1.7 per cent in visitor expenditure (see
Figure 3.6). The marginal growth in Restaurants was attributed to weak
demand for restaurant services given the level of unemployment and
low real disposable income.
Aggregate Demand
Estimates of aggregate spending suggest a marginal increase in
aggregate demand for the March 2012 quarter. This modest growth was
driven primarily by improvements in Net External Demand as Gross
Fixed Capital Formation and Public Consumption are estimated to
have declined while Private Consumption remained flat.
The improvement in Net External Demand emanated from an estimated
increase of 5.8 per cent in exports of goods and services and reduced
demand for imports of goods and services of 5.9 per cent (see Figure 3.7). The performance of exports mainly reflected increases of 1.5 per
cent and 346.9 per cent in alumina and ethanol exports, respectively.
Additionally, coffee, cocoa and sugar grew by 165.9 per cent, 36.6 per
cent and 24.6 per cent, respectively. These increases were attributed to
greater demand in the respective markets and the impact of intensified
marketing activities. The overall contraction in imports was mainly
attributed to declines of 16.8 per cent and 13.7 per cent in raw material
imports and fuels, respectively, due to lower investment activities
associated with the uncertainty in the domestic economy during the
quarter.
Gross Fixed Capital Formation declined marginally in the review
quarter, relative to the corresponding period of 2011. The decline in
investment spending was reflected in a contraction in public investment,
the impact of which was partly offset by growth in private investment.
The estimated contraction in public investment reflected a decline of
30.6 per cent in Central Government’s capital expenditure due to fiscal
constraints. Growth in private investment was inferred from increases of
-100.0
-50.0
0.0
50.0
100.0
150.0
200.0
J$ M
n
Quarter
Imports Exports Net Exports
-80.0
-60.0
-40.0
-20.0
0.0
20.0
40.0
Per
cent
Quarter
Direct investment (J$Mn)
Production & Consumption Tax (J$Mn)
Capital Goods Import (J$Mn)

Bank of Jamaica Quarterly Monetary Policy Report, January to March 2012
Real Sector Developments
35
Figure 3.9 Government Recurrent Expenditure (less interest payments)
Figure 3.10 Indicators of Spending
29.0 per cent and 1.4 per cent, respectively, in foreign direct investment
and capital goods imports, the impact of which was partly offset by a
marginal decline of 0.4 per cent in production & consumption tax
receipts (see Figure 3.8). Growth in foreign direct investment was
driven primarily by capital expenditure in the mining and sugar
industries as well as spending for Highway 2000 projects.
For the second consecutive quarter, there was a moderate decline in
Government Consumption. The contraction reflected declines of 8.4
per cent in Government recurrent expenditure (less interest payments),
relative to the corresponding quarter in 2011. Lower expenditure
reflected the continuation of fiscal consolidation (see Figure 3.9).
For the March 2012 quarter, Private Consumption is estimated to have
remained flat, due to the persistence of weak domestic demand. This
performance was reflected in relatively weak disposable income
associated with the increasing trend in unemployment as well as the
decline in real wages in the previous quarter. Two indicators of
consumption spending, consumption tax receipts and total credit card
transactions increased by 3.4 per cent and 11.0 per cent, respectively, in
the review period. However, the impact of these expansions was offset
primarily by a decline of 4.7 per cent in consumer goods imports during
the period, another indicator of spending (see Figure 3.10).
-30.0
-20.0
-10.0
0.0
10.0
20.0
30.0
Jun
-07
Sep
-07
Dec-0
7
Mar-0
8
Jun
-08
Sep
-08
Dec-0
8
Mar-0
9
Jun
-09
Sep
-09
Dec-0
9
Mar-1
0
Jun
-10
Sep
-10
Dec-1
0
Mar-1
1
Jun
-11
Sep
-11
Dec-1
1
Mar-1
2
Per
cent
Quarter
Government Recurrent Expenditure
-40.0
-30.0
-20.0
-10.0
0.0
10.0
20.0
30.0
40.0
50.0
Per
cent
Quarter
Consumption Tax Receipts
Total Credit Cards
Transaction
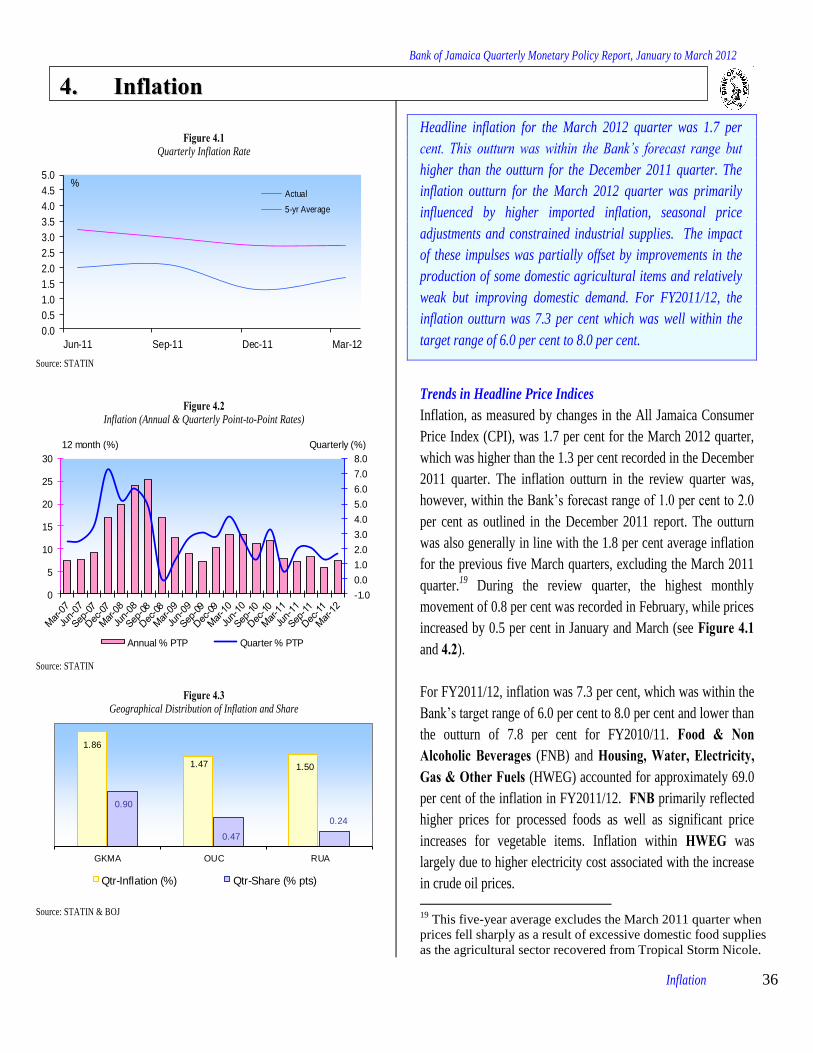
Bank of Jamaica Quarterly Monetary Policy Report, January to March 2012
Inflation 36
Figure 4.1 Quarterly Inflation Rate
0.0
0.5
1.0
1.5
2.0
2.5
3.0
3.5
4.0
4.5
5.0
Jun-11 Sep-11 Dec-11 Mar-12
%Actual
5-yr Average
Source: STATIN
Figure 4.2 Inflation (Annual & Quarterly Point-to-Point Rates)
-1.0
0.0
1.0
2.0
3.0
4.0
5.0
6.0
7.0
8.0
0
5
10
15
20
25
30
Quarterly (%)12 month (%)
Annual % PTP Quarter % PTP
Source: STATIN
Figure 4.3 Geographical Distribution of Inflation and Share
1.86
1.47 1.50
0.90
0.47
0.24
GKMA OUC RUA
Qtr-Inflation (%) Qtr-Share (% pts)
Source: STATIN & BOJ
Headline inflation for the March 2012 quarter was 1.7 per
cent. This outturn was within the Bank’s forecast range but
higher than the outturn for the December 2011 quarter. The
inflation outturn for the March 2012 quarter was primarily
influenced by higher imported inflation, seasonal price
adjustments and constrained industrial supplies. The impact
of these impulses was partially offset by improvements in the
production of some domestic agricultural items and relatively
weak but improving domestic demand. For FY2011/12, the
inflation outturn was 7.3 per cent which was well within the
target range of 6.0 per cent to 8.0 per cent.
Trends in Headline Price Indices
Inflation, as measured by changes in the All Jamaica Consumer
Price Index (CPI), was 1.7 per cent for the March 2012 quarter,
which was higher than the 1.3 per cent recorded in the December
2011 quarter. The inflation outturn in the review quarter was,
however, within the Bank’s forecast range of 1.0 per cent to 2.0
per cent as outlined in the December 2011 report. The outturn
was also generally in line with the 1.8 per cent average inflation
for the previous five March quarters, excluding the March 2011
quarter.19
During the review quarter, the highest monthly
movement of 0.8 per cent was recorded in February, while prices
increased by 0.5 per cent in January and March (see Figure 4.1
and 4.2).
For FY2011/12, inflation was 7.3 per cent, which was within the
Bank’s target range of 6.0 per cent to 8.0 per cent and lower than
the outturn of 7.8 per cent for FY2010/11. Food & Non Alcoholic Beverages (FNB) and Housing, Water, Electricity, Gas & Other Fuels (HWEG) accounted for approximately 69.0
per cent of the inflation in FY2011/12. FNB primarily reflected
higher prices for processed foods as well as significant price
increases for vegetable items. Inflation within HWEG was
largely due to higher electricity cost associated with the increase
in crude oil prices.
19
This five-year average excludes the March 2011 quarter when
prices fell sharply as a result of excessive domestic food supplies
as the agricultural sector recovered from Tropical Storm Nicole.
44.. IInnffllaattiioonn
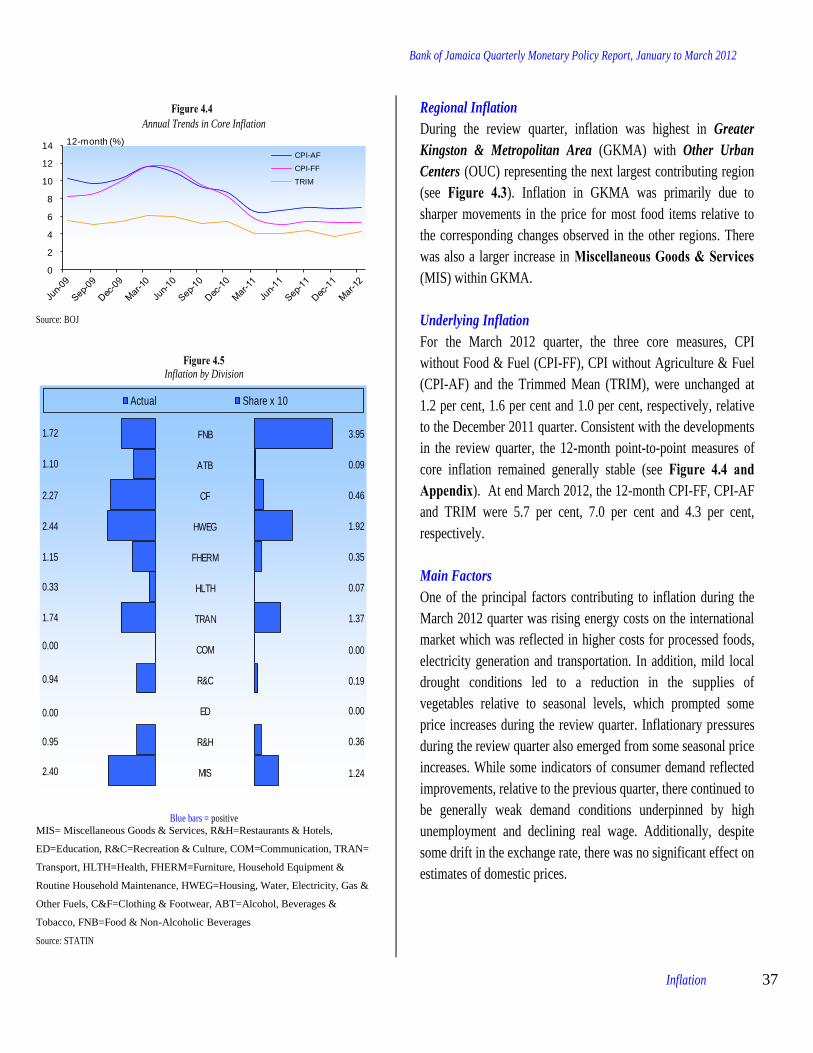
Bank of Jamaica Quarterly Monetary Policy Report, January to March 2012
Inflation 37
Figure 4.4 Annual Trends in Core Inflation
0
2
4
6
8
10
12
14 12-month (%)
CPI-AF
CPI-FF
TRIM
Source: BOJ
Figure 4.5 Inflation by Division
1.72
1.10
2.27
2.44
1.15
0.33
1.74
0.00
0.94
0.00
0.95
2.40
FNB
ATB
CF
HWEG
FHERM
HLTH
TRAN
COM
R&C
ED
R&H
MIS
3.95
0.09
0.46
1.92
0.35
0.07
1.37
0.00
0.19
0.00
0.36
1.24
Actual Share x 10
Blue bars = positive
MIS= Miscellaneous Goods & Services, R&H=Restaurants & Hotels,
ED=Education, R&C=Recreation & Culture, COM=Communication, TRAN=
Transport, HLTH=Health, FHERM=Furniture, Household Equipment &
Routine Household Maintenance, HWEG=Housing, Water, Electricity, Gas &
Other Fuels, C&F=Clothing & Footwear, ABT=Alcohol, Beverages &
Tobacco, FNB=Food & Non-Alcoholic Beverages
Source: STATIN
Regional Inflation
During the review quarter, inflation was highest in Greater
Kingston & Metropolitan Area (GKMA) with Other Urban
Centers (OUC) representing the next largest contributing region
(see Figure 4.3). Inflation in GKMA was primarily due to
sharper movements in the price for most food items relative to
the corresponding changes observed in the other regions. There
was also a larger increase in Miscellaneous Goods & Services (MIS) within GKMA.
Underlying Inflation
For the March 2012 quarter, the three core measures, CPI
without Food & Fuel (CPI-FF), CPI without Agriculture & Fuel
(CPI-AF) and the Trimmed Mean (TRIM), were unchanged at
1.2 per cent, 1.6 per cent and 1.0 per cent, respectively, relative
to the December 2011 quarter. Consistent with the developments
in the review quarter, the 12-month point-to-point measures of
core inflation remained generally stable (see Figure 4.4 and Appendix). At end March 2012, the 12-month CPI-FF, CPI-AF
and TRIM were 5.7 per cent, 7.0 per cent and 4.3 per cent,
respectively.
Main Factors
One of the principal factors contributing to inflation during the
March 2012 quarter was rising energy costs on the international
market which was reflected in higher costs for processed foods,
electricity generation and transportation. In addition, mild local
drought conditions led to a reduction in the supplies of
vegetables relative to seasonal levels, which prompted some
price increases during the review quarter. Inflationary pressures
during the review quarter also emerged from some seasonal price
increases. While some indicators of consumer demand reflected
improvements, relative to the previous quarter, there continued to
be generally weak demand conditions underpinned by high
unemployment and declining real wage. Additionally, despite
some drift in the exchange rate, there was no significant effect on
estimates of domestic prices.

Bank of Jamaica Quarterly Monetary Policy Report, January to March 2012
Inflation 38
Figure 4.6 Quarterly Change EGOF Index and WTI
-80
-60
-40
-20
0
20
40
60
80
100
-80
-60
-40
-20
0
20
40
60
80
100Fuel Index (%
Qtr)WTI (% Qtr
Chg)
WTI
Fuel
Source: STATIN, Bloomberg
Figure 4.7 Monthly End of Period Exchange Rate (JMD per USD)
85.0
85.5
86.0
86.5
87.0
87.5
J$ per US$
EOP ExRate
Average
Source: BOJ
Figure 4.8
Import Value (monthly c.i.f)
0
50
100
150
200
250
300
350
400
450US$Million
Real Import Value
Polynomial Trend
Source: STATIN
International Commodity Prices
During the March 2012 quarter, inflation was largely induced by
rising international oil prices as average grain prices were lower
when compared to the December 2011 quarter. In particular, the
benchmark West Texas Intermediate (WTI) crude oil price
increased by 9.4 per cent when compared to the 4.8 per cent in
the December 2011 quarter (see Figure 4.6 and International Developments). The impact of this increase resulted in higher
costs for processed foods, fuel for electricity generation and
petrol within FNB, HWEG and TRAN, respectively (see Figure 4.5).
The BOJ Grains Price Index declined by 3.4 per cent in the
March 2012 quarter following a 2.8 per cent fall in the December
2011 quarter. The decline in grain prices for the review quarter
reflected a significant contraction in the price of rice which
outweighed increases in the prices of corn and wheat (see
International Developments).20
In this regard, the decline in
index over the past two quarters had a moderating impact on
inflation in the review quarter.
Exchange Rates
The Jamaica Dollar vis-à-vis the US dollar depreciated by 0.8
per cent over the March 2012 quarter, to close at J$87.30:
US$1.00, following a 0.4 per cent depreciation in the December
2011 quarter (see Figure 4.7 and Foreign Exchange Market). The relatively stable exchange rate over the past two quarters did
not have any noticeable impact on domestic prices.
Demand Conditions
Indicators of consumer demand for the March 2012 quarter
reflected some improvement relative to the December 2011
quarter, albeit remaining weak, relative to the pre-crisis period.
The improvement was reflected in estimates of both real
consumer loans and PAYE contributions (see Figures 4.10 and 4.11). Additionally, the narrowing of the output gap since the
December 2011 quarter, may indicate an expansion in demand in
the review quarter (see Economic Outlook and Monetary 20
The Bank’s Grain Index is a composite of the prices of rice, wheat and corn.
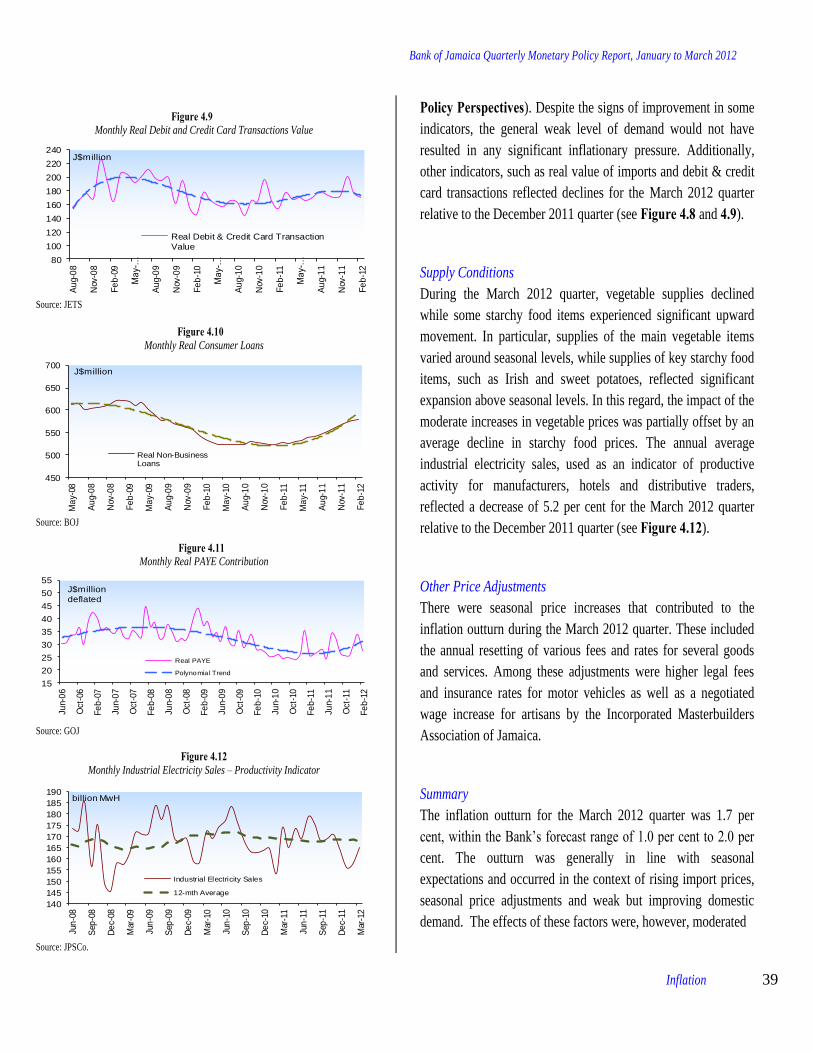
Bank of Jamaica Quarterly Monetary Policy Report, January to March 2012
Inflation 39
Figure 4.9
Monthly Real Debit and Credit Card Transactions Value
80
100
120
140
160
180
200
220
240
Au
g-0
8
Nov
-08
Fe
b-0
9
Ma
y-…
Au
g-0
9
Nov
-09
Fe
b-1
0
Ma
y-…
Au
g-1
0
Nov
-10
Fe
b-1
1
Ma
y-…
Au
g-1
1
Nov
-11
Fe
b-1
2
J$million
Real Debit & Credit Card TransactionValue
Source: JETS
Figure 4.10
Monthly Real Consumer Loans
450
500
550
600
650
700
Ma
y-08
Au
g-0
8
Nov
-08
Fe
b-0
9
Ma
y-09
Au
g-0
9
Nov
-09
Fe
b-1
0
Ma
y-10
Au
g-1
0
Nov
-10
Fe
b-1
1
Ma
y-11
Au
g-1
1
Nov
-11
Fe
b-1
2
J$million
Real Non-BusinessLoans
Source: BOJ
Figure 4.11 Monthly Real PAYE Contribution
15
20
25
30
35
40
45
50
55
Jun-
06
Oct
-06
Fe
b-0
7
Jun-
07
Oct
-07
Fe
b-0
8
Jun-
08
Oct
-08
Fe
b-0
9
Jun-
09
Oct
-09
Fe
b-1
0
Jun-
10
Oct
-10
Fe
b-1
1
Jun-
11
Oct
-11
Fe
b-1
2
J$million deflated
Real PAYE
Polynomial Trend
Source: GOJ
Figure 4.12 Monthly Industrial Electricity Sales – Productivity Indicator
140
145
150
155
160
165
170
175
180
185
190
Jun
-08
Sep
-08
De
c-08
Mar
-09
Jun
-09
Sep
-09
De
c-09
Mar
-10
Jun
-10
Sep
-10
De
c-10
Mar
-11
Jun
-11
Sep
-11
De
c-11
Mar
-12
billion MwH
Industrial Electricity Sales
12-mth Average
Source: JPSCo.
Policy Perspectives). Despite the signs of improvement in some
indicators, the general weak level of demand would not have
resulted in any significant inflationary pressure. Additionally,
other indicators, such as real value of imports and debit & credit
card transactions reflected declines for the March 2012 quarter
relative to the December 2011 quarter (see Figure 4.8 and 4.9).
Supply Conditions
During the March 2012 quarter, vegetable supplies declined while some starchy food items experienced significant upward
movement. In particular, supplies of the main vegetable items
varied around seasonal levels, while supplies of key starchy food
items, such as Irish and sweet potatoes, reflected significant
expansion above seasonal levels. In this regard, the impact of the
moderate increases in vegetable prices was partially offset by an
average decline in starchy food prices. The annual average
industrial electricity sales, used as an indicator of productive
activity for manufacturers, hotels and distributive traders,
reflected a decrease of 5.2 per cent for the March 2012 quarter
relative to the December 2011 quarter (see Figure 4.12).
Other Price Adjustments
There were seasonal price increases that contributed to the
inflation outturn during the March 2012 quarter. These included
the annual resetting of various fees and rates for several goods
and services. Among these adjustments were higher legal fees
and insurance rates for motor vehicles as well as a negotiated
wage increase for artisans by the Incorporated Masterbuilders
Association of Jamaica.
Summary
The inflation outturn for the March 2012 quarter was 1.7 per
cent, within the Bank’s forecast range of 1.0 per cent to 2.0 per
cent. The outturn was generally in line with seasonal
expectations and occurred in the context of rising import prices,
seasonal price adjustments and weak but improving domestic
demand. The effects of these factors were, however, moderated

Bank of Jamaica Quarterly Monetary Policy Report, January to March 2012
Inflation 40
by the impact of improvements in the supply of some domestic
agriculture commodities and steady inflation expectations
anchored by relatively stable exchange rate.
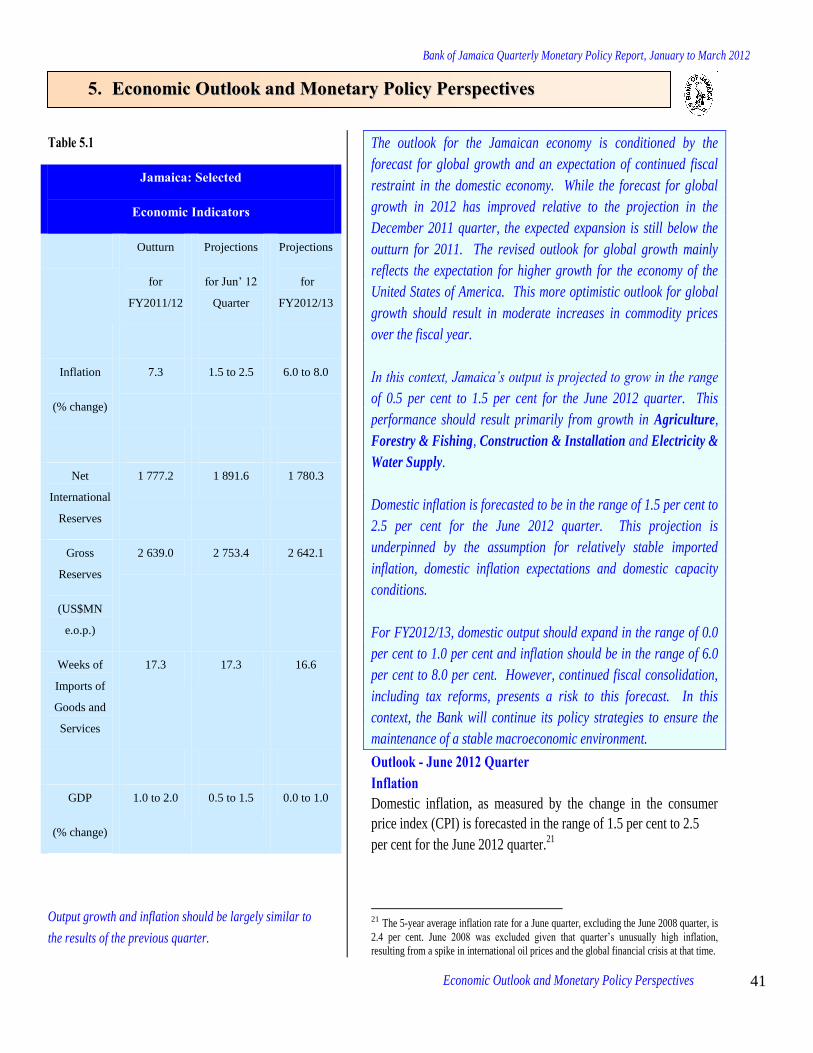
Bank of Jamaica Quarterly Monetary Policy Report, January to March 2012
Economic Outlook and Monetary Policy Perspectives
41
Table 5.1
Jamaica: Selected
Economic Indicators
Outturn
for
FY2011/12
Projections
for Jun’ 12
Quarter
Projections
for
FY2012/13
Inflation
(% change)
7.3 1.5 to 2.5 6.0 to 8.0
Net
International
Reserves
1 777.2 1 891.6 1 780.3
Gross
Reserves
(US$MN
e.o.p.)
2 639.0 2 753.4 2 642.1
Weeks of
Imports of
Goods and
Services
17.3 17.3 16.6
GDP
(% change)
1.0 to 2.0 0.5 to 1.5 0.0 to 1.0
Output growth and inflation should be largely similar to
the results of the previous quarter.
The outlook for the Jamaican economy is conditioned by the
forecast for global growth and an expectation of continued fiscal
restraint in the domestic economy. While the forecast for global
growth in 2012 has improved relative to the projection in the
December 2011 quarter, the expected expansion is still below the
outturn for 2011. The revised outlook for global growth mainly
reflects the expectation for higher growth for the economy of the
United States of America. This more optimistic outlook for global
growth should result in moderate increases in commodity prices
over the fiscal year.
In this context, Jamaica’s output is projected to grow in the range
of 0.5 per cent to 1.5 per cent for the June 2012 quarter. This
performance should result primarily from growth in Agriculture,
Forestry & Fishing, Construction & Installation and Electricity &
Water Supply.
Domestic inflation is forecasted to be in the range of 1.5 per cent to
2.5 per cent for the June 2012 quarter. This projection is
underpinned by the assumption for relatively stable imported
inflation, domestic inflation expectations and domestic capacity
conditions.
For FY2012/13, domestic output should expand in the range of 0.0
per cent to 1.0 per cent and inflation should be in the range of 6.0
per cent to 8.0 per cent. However, continued fiscal consolidation,
including tax reforms, presents a risk to this forecast. In this
context, the Bank will continue its policy strategies to ensure the
maintenance of a stable macroeconomic environment.
Outlook - June 2012 Quarter Inflation Domestic inflation, as measured by the change in the consumer
price index (CPI) is forecasted in the range of 1.5 per cent to 2.5
per cent for the June 2012 quarter.21
21 The 5-year average inflation rate for a June quarter, excluding the June 2008 quarter, is
2.4 per cent. June 2008 was excluded given that quarter’s unusually high inflation,
resulting from a spike in international oil prices and the global financial crisis at that time.
5. EEccoonnoommiicc OOuuttllooookk aanndd MMoonneettaarryy PPoolliiccyy PPeerrssppeeccttiivveess

Bank of Jamaica Quarterly Monetary Policy Report, January to March 2012
Economic Outlook and Monetary Policy Perspectives 42
Figure 5.1 Trends in Changes in Exchange Rate and Headline
Inflation
International commodity prices are projected to
decline in the June 2012 quarter.
This follows inflation of 1.7 per cent recorded for the March 2012
quarter. The projected inflation rate in the June 2012 quarter is
underpinned by a forecast for relatively stable imported inflation,
domestic inflation expectations and capacity conditions.
Imported Inflation
Imported prices are not projected to have a significant impact on
inflation in the June 2012 quarter. This is in the context of
expected changes in imported prices being projected to be lower
than the average increase of 6.0 per cent in the five previous June
quarters.22
In particular, oil prices should be relatively unchanged
for the June quarter reflecting the impact of the slight easing of
geopolitical tensions related to Iran’s nuclear programme being
largely offset by the effect of the improved outlook for the
economy of the USA. Additionally, oil prices should reflect the
impact of the downward revision of the growth forecast for China
as well as continuing concerns about the European economies.
With respect to agricultural commodities, the prices of corn and
wheat are expected to decline by approximately 3.0 per cent and
2.0 per cent, respectively, for the quarter. These projections are
consistent with increased optimism regarding supplies in major
grains producing countries.
The price of the Jamaica Dollar vis-à-vis the US dollar is expected to
remain relatively stable in the June 2012 quarter. This is in a context
of the forecast for increased net private capital inflows which should
have a positive impact on the foreign exchange market. These flows
are expected to be sufficient to offset the higher demand associated
with current account transactions. The projected improvement in
private capital inflows reflects normalization from the low levels that
prevailed in the previous quarter.
Domestic Capacity Conditions
Domestic output should largely be in line with potential in the June
2012 quarter, resulting in a smaller output gap than estimated for
22 The imported inflation in the June 2008 quarter also was excluded due to that quarter’s
unusual inflation due to the spike oil prices and the global financial crisis at that time.
-4.0
-2.0
0.0
2.0
4.0
6.0
8.0
exchange rate CPI
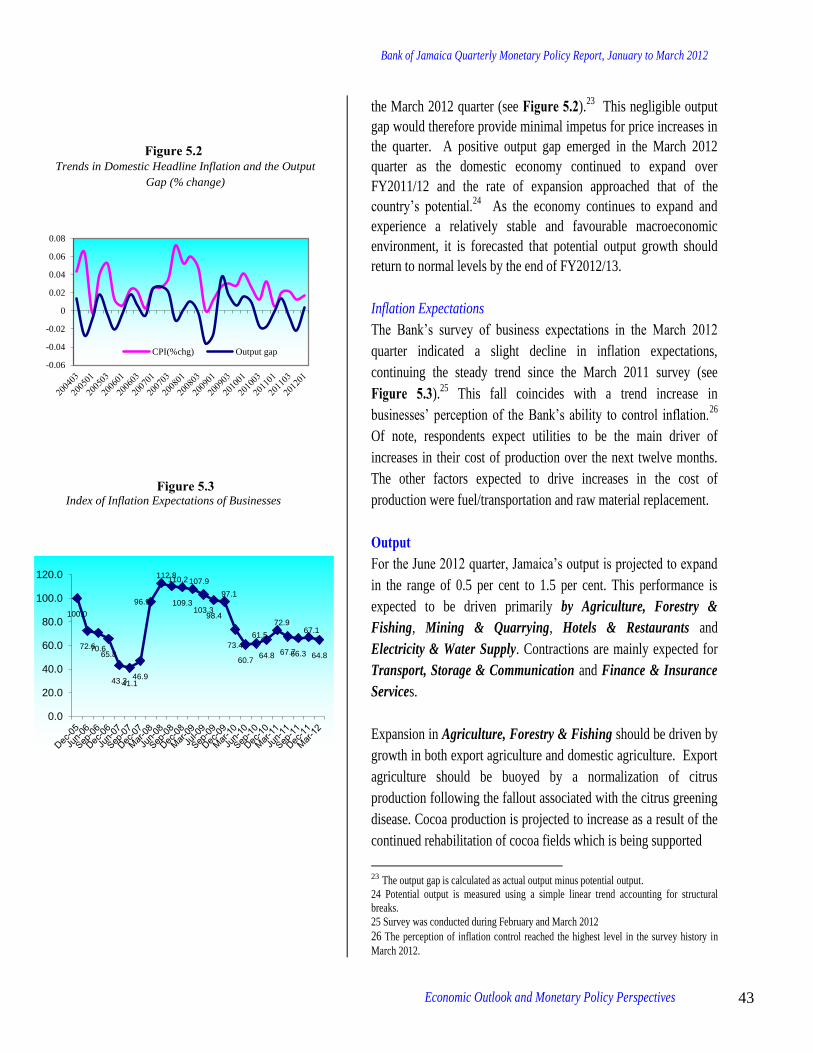
Bank of Jamaica Quarterly Monetary Policy Report, January to March 2012
Economic Outlook and Monetary Policy Perspectives 43
100.0
72.6 70.6 65.8
43.3 41.1 46.9
96.9
112.8 110.2
109.3
107.9
103.3 98.4
97.1
73.4
60.7
61.5
64.8
72.9
67.7 66.3
67.1
64.8
0.0
20.0
40.0
60.0
80.0
100.0
120.0
-0.06
-0.04
-0.02
0
0.02
0.04
0.06
0.08
CPI(%chg) Output gap
Figure 5.2 Trends in Domestic Headline Inflation and the Output
Gap (% change)
Figure 5.3 Index of Inflation Expectations of Businesses
the March 2012 quarter (see Figure 5.2).23
This negligible output
gap would therefore provide minimal impetus for price increases in
the quarter. A positive output gap emerged in the March 2012
quarter as the domestic economy continued to expand over
FY2011/12 and the rate of expansion approached that of the
country’s potential.24
As the economy continues to expand and
experience a relatively stable and favourable macroeconomic
environment, it is forecasted that potential output growth should
return to normal levels by the end of FY2012/13.
Inflation Expectations
The Bank’s survey of business expectations in the March 2012
quarter indicated a slight decline in inflation expectations,
continuing the steady trend since the March 2011 survey (see
Figure 5.3).25
This fall coincides with a trend increase in
businesses’ perception of the Bank’s ability to control inflation.26
Of note, respondents expect utilities to be the main driver of
increases in their cost of production over the next twelve months.
The other factors expected to drive increases in the cost of
production were fuel/transportation and raw material replacement.
Output For the June 2012 quarter, Jamaica’s output is projected to expand
in the range of 0.5 per cent to 1.5 per cent. This performance is
expected to be driven primarily by Agriculture, Forestry &
Fishing, Mining & Quarrying, Hotels & Restaurants and
Electricity & Water Supply. Contractions are mainly expected for
Transport, Storage & Communication and Finance & Insurance
Services.
Expansion in Agriculture, Forestry & Fishing should be driven by
growth in both export agriculture and domestic agriculture. Export
agriculture should be buoyed by a normalization of citrus
production following the fallout associated with the citrus greening
disease. Cocoa production is projected to increase as a result of the
continued rehabilitation of cocoa fields which is being supported
23 The output gap is calculated as actual output minus potential output.
24 Potential output is measured using a simple linear trend accounting for structural
breaks.
25 Survey was conducted during February and March 2012
26 The perception of inflation control reached the highest level in the survey history in
March 2012.

Bank of Jamaica Quarterly Monetary Policy Report, January to March 2012
Economic Outlook and Monetary Policy Perspectives 44
100.0
122.8 129.8
138.0
122.8
166.9
140.5
119.5
100.0
111.3
95.4
109.0
107.7 117.8
92.3
111.5
160.6
151.8
152.0
154.0
154.9
140.6
147.4
144.4
0.0
20.0
40.0
60.0
80.0
100.0
120.0
140.0
160.0
180.0
Figure 5.4 Index of Present Conditions of Businesses
Figure 5.5 Index of Future Business Conditions
by the Government. With respect to domestic agriculture, growth is
expected to reflect continued improvement in productivity.
The anticipated growth in Mining & Quarrying is premised on an
increase in capacity utilization in the alumina industry, reflecting
increased efficiency at one alumina plant. Capacity utilization in
the bauxite industry is, however, expected to contract reflecting
normalization of production to average capacity utilization.
Electricity & Water Supply should grow consequent on the
continuation of the National Water Commission’s Water Supply
Improvement Project. In addition, electricity generation is expected
to normalize in the review quarter following contraction in the
comparable period of 2011.27
Transport, Storage & Communication is expected to contract in
the June 2012 quarter given the reduced domestic earnings from air
transport associated with the transfer of ownership of the national
airline to a foreign entity in the September 2011 quarter. The
projected decline for Finance & Insurance Services largely
reflects the continued fall in net interest income.
Despite the projection for continued expansion in domestic output
in the June 2012 quarter, the results of the BOJ’s Survey of
Expectations suggests that businesses perception of the overall
health of the economy had declined. In particular, the index of the
perception of present conditions fell to 136.4 in the March 2012
survey from 157.9 in the December 2011 survey. The index of the
perception of future business conditions recorded a more modest
decline, falling to 144.4 from 147.4. In contrast to these results, the
Jamaica Conference Board’s Survey of Business and Consumer
Confidence for the March 2012 quarter indicated a sharp increase
in both business and consumer confidence. The increases in the
indices for both businesses and consumers were attributed to sharp
increases in perceptions of future prospects for the economy.
27 Electricity production in the June 2011 quarter declined due to a sharp falloff in
demand from both residential and domestic demand.
100.0
119.2
153.4
168.4
155.7
183.1
131.6 121.6
85.1 93.5
62.8
40.0 38.7 48.3 52.9
67.0
95.2
117.6
142.3
132.8
140.2
144.4
157.9
136.4
0.0
20.0
40.0
60.0
80.0
100.0
120.0
140.0
160.0
180.0
200.0
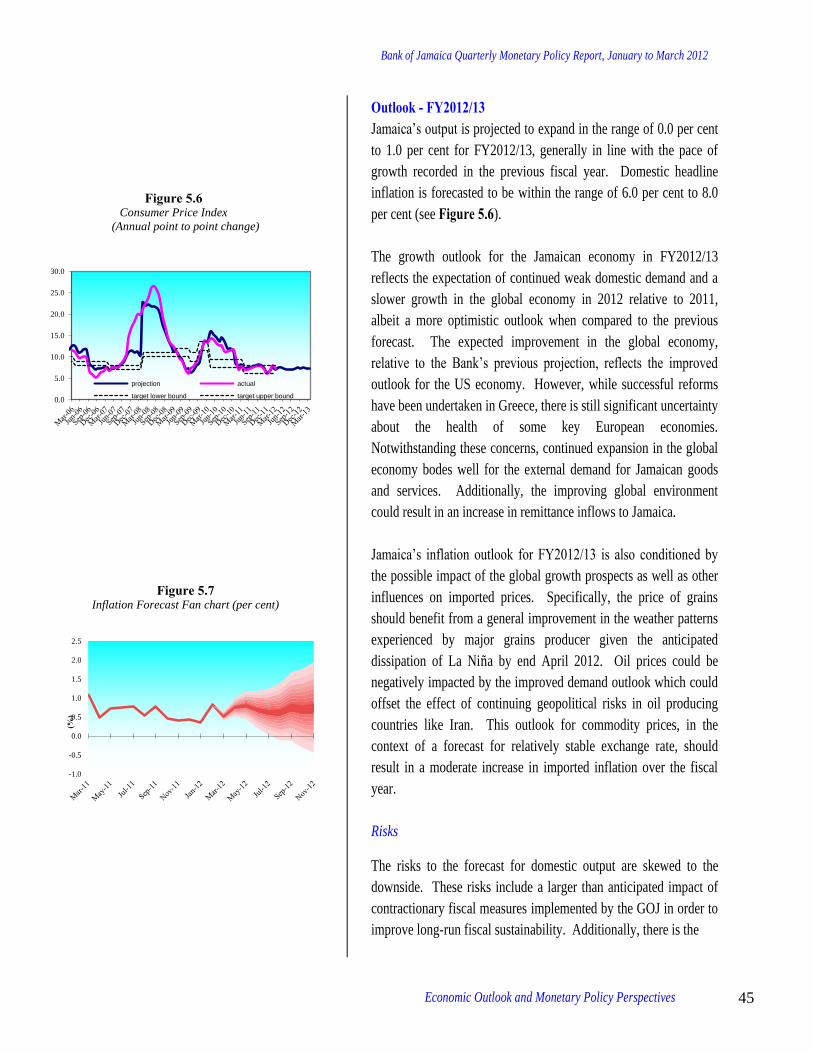
Bank of Jamaica Quarterly Monetary Policy Report, January to March 2012
Economic Outlook and Monetary Policy Perspectives 45
-1.0
-0.5
0.0
0.5
1.0
1.5
2.0
2.5
(%)
Figure 5.6 Consumer Price Index
(Annual point to point change)
Figure 5.7 Inflation Forecast Fan chart (per cent)
Outlook - FY2012/13 Jamaica’s output is projected to expand in the range of 0.0 per cent
to 1.0 per cent for FY2012/13, generally in line with the pace of
growth recorded in the previous fiscal year. Domestic headline
inflation is forecasted to be within the range of 6.0 per cent to 8.0
per cent (see Figure 5.6).
The growth outlook for the Jamaican economy in FY2012/13
reflects the expectation of continued weak domestic demand and a
slower growth in the global economy in 2012 relative to 2011,
albeit a more optimistic outlook when compared to the previous
forecast. The expected improvement in the global economy,
relative to the Bank’s previous projection, reflects the improved
outlook for the US economy. However, while successful reforms
have been undertaken in Greece, there is still significant uncertainty
about the health of some key European economies.
Notwithstanding these concerns, continued expansion in the global
economy bodes well for the external demand for Jamaican goods
and services. Additionally, the improving global environment
could result in an increase in remittance inflows to Jamaica.
Jamaica’s inflation outlook for FY2012/13 is also conditioned by
the possible impact of the global growth prospects as well as other
influences on imported prices. Specifically, the price of grains
should benefit from a general improvement in the weather patterns
experienced by major grains producer given the anticipated
dissipation of La Niña by end April 2012. Oil prices could be
negatively impacted by the improved demand outlook which could
offset the effect of continuing geopolitical risks in oil producing
countries like Iran. This outlook for commodity prices, in the
context of a forecast for relatively stable exchange rate, should
result in a moderate increase in imported inflation over the fiscal
year.
Risks
The risks to the forecast for domestic output are skewed to the
downside. These risks include a larger than anticipated impact of
contractionary fiscal measures implemented by the GOJ in order to
improve long-run fiscal sustainability. Additionally, there is the
0.0
5.0
10.0
15.0
20.0
25.0
30.0
projection actual
target lower bound target upper bound

Bank of Jamaica Quarterly Monetary Policy Report, January to March 2012
Economic Outlook and Monetary Policy Perspectives 46
possibility that adverse weather could impact output since the 2012
Atlantic Hurricane Season is projected to be average.28
Upside
risks include a greater than anticipated impact of the various
infrastructure projects and a stronger than expected expansion in
the global economy, in particular, the economies of the USA and
China.
The risks to the inflation forecast are skewed to the upside (see
Figure 5.7). These mainly include the possibility of a larger than
expected impact of domestic fiscal policy measures on prices. In
particular, fiscal measures could result in inflation exceeding the
upper end of the forecast range. Additionally, the possible impact
of adverse weather on domestic crop production and a greater than
anticipated impact on oil prices arising from renewed geopolitical
tensions and stronger global could result in the target being
breached. The downside risk largely relates to a weaker than
expected domestic demand constraining potential upward price
impulses.
Monetary Policy
The domestic macroeconomic environment should continue to
display the positive trend displayed over FY2011/12. Output is
projected to continue to expand, prices should record relatively
modest increases and the financial markets should remain relatively
stable. The GOJ is expected to continue its path of fiscal
consolidation which poses some downside risk to output and upside
risk to inflation. In that context, the BOJ will continue its monetary
policy adjustments to ensure the maintenance of a stable
macroeconomic environment.
28 Average storm activity calculated with data from 1950 to 2000 is for
9.6 storms, 5.9 hurricanes with 2.3 being major hurricanes. In April
2012, the Colorado State University forecasting team projected 10
Storms, 4 hurricanes with two being major hurricanes.

Bank of Jamaica Quarterly Monetary Policy Report, January to March 2012
47
Bank of Jamaica Quarterly Monetary Policy Report, January to March 2012
Appendices, A. Fiscal Developments 48
A. Fiscal Developments: Preliminary March 2012 Quarter
Provisional data indicate that Central Government recorded a fiscal deficit of $24.3 billion or 1.9
per cent of GDP for the March 2012 quarter relative to the budgeted29
deficit of $16.2 billion or
1.3 per cent of GDP. The outturn for the quarter largely reflected higher than budgeted
Expenditure as well as a shortfall in Revenue & Grants. The primary surplus was
approximately $13.4 billion or 1.0 per cent of GDP for the quarter compared to the budgeted
surplus of $21.5 billion or 1.7 per cent of GDP. Concurrently, the current deficit was
approximately $9.1 billion or 0.7 per cent of GDP relative to a current deficit of $6.3 billion or
0.5 per cent of GDP implied in the budget (see Table).
Expenditure for the quarter exceeded budget by $6.0 billion and reflected higher than budget
Capital and Recurrent Expenditure. The higher than anticipated Recurrent Expenditure was
reflected in Programmes which exceeded budget by $1.3 billion, the impact of which was partly
countered by lower than budgeted wages and salaries and interest payments. The negative
deviation in Programmes was due to the Government’s increased outlay on operational expenses.
Capital Expenditure was $5.1 billion higher than budget mainly as a result of payments made to
liquidate obligations due to the Road Maintenance Fund and National Works Agency in respect
of the Jamaica Development Improvement Programme (JDIP) as well as to pay arrears for
Clarendon Alumina Partners (CAP) to Alcoa.
Revenue & Grants for the quarter was $2.1 billion below budget, largely reflecting shortfalls in
Tax Revenue and Grants as Capital Revenue exceeded budget. Of note, the deviation in Grants
from budget was due to the non-receipt of EU and other project related funds. The higher than
budgeted Capital Revenue partly reflected a reclassification of revenue previously reflected in
the Non-Tax revenue budget. Tax Revenue primarily reflected lower than budgeted receipts from
International Trade and Production & Consumption. With respect to International trade, the
shortfall reflected lower general consumption tax (GCT) on imports and Customs Duty while
Production & Consumption mainly reflected the deviation in GCT (local).
The C-Efficiency (GCT) ratio of 43.7 per cent for the quarter indicated that tax collections based
on estimated consumption for the quarter was only marginally higher relative to the 5-year
average of 43.5 per cent and also higher relative to 39.8 per cent recorded for the March 2011
quarter. The slight increase might be attributed to the positive albeit slow growth during the
quarter. The C-Efficiency (GCT/SCT) ratio for the quarter of 62.7 per cent was higher than the
29
Budget refers to Second Supplementary
AAppppeennddiicceess
Bank of Jamaica Quarterly Monetary Policy Report, January to March 2012
Appendices, A. Fiscal Developments 49
5-year average of 59.0 per cent and also higher than the 57.6 per cent recorded in the
corresponding quarter in the previous fiscal year.
For the March quarter, the Government raised $25.3 billion through the issue of 7 Benchmark
Investment (BMI) notes. Of the total BMI notes issued, 4 were variable rate (VR) instruments
which raised $20.5 billion. For the fiscal year, the Government raised $105.8 billion from 21
instruments of which 10 were FR instruments while 11 were VR instruments. In this regard, VR
debt accounted for 83.4 per cent of the value of total take-up in contrast to the Government’s
debt strategy for a debt issuance of over 90.0 per cent in FR instruments. At end-March 2012, the
weighted average age of new debt was 8.2 years relative to 8.6 years at end-December 2011 and
7.03 years at March 2011. The decline relative to the previous quarter reflects investors’ appetite
for shorter tenor instruments in the current climate of uncertainty.
For the FY 2011/12 Central Government recorded a fiscal deficit of $80.7 billion or 6.2 per cent
of GDP which was $8.1 billion above the budget of $72.6 billion (5.0 per cent of GDP). This
largely reflected lower than budgeted Revenue & Grants as well as higher than budgeted
Expenditure. Revenue & Grants was $2.1 billion below budget reflecting a $1.0 billion
shortfall in Tax Revenue as well as shortfalls in Non-tax Revenue and Grants. Expenditure for
the year exceeded budget by $6.0 billion and reflected higher than budget Capital and Recurrent
Expenditure recorded in the last quarter of the fiscal year.
The primary surplus for the fiscal year of approximately $40.0 billion or 3.1 per cent of GDP
was $8.1 billion lower than budget while the current deficit of $41.5 billion or 3.2 per cent of
GDP was $2.9 billion higher than anticipated in the budget.
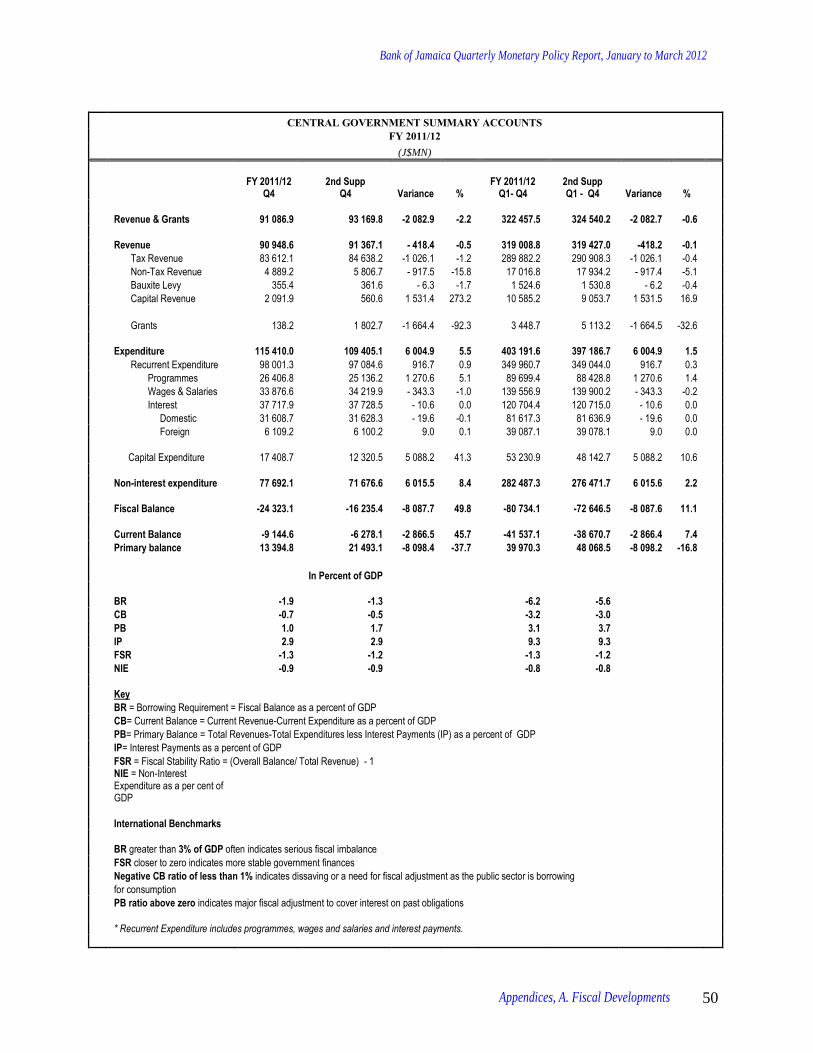
Bank of Jamaica Quarterly Monetary Policy Report, January to March 2012
Appendices, A. Fiscal Developments 50
CENTRAL GOVERNMENT SUMMARY ACCOUNTS
FY 2011/12 (J$MN)
FY 2011/12
Q4 2nd Supp
Q4 Variance % FY 2011/12
Q1- Q4 2nd Supp Q1 - Q4 Variance %
Revenue & Grants 91 086.9 93 169.8 -2 082.9 -2.2 322 457.5 324 540.2 -2 082.7 -0.6
Revenue 90 948.6 91 367.1 - 418.4 -0.5 319 008.8 319 427.0 -418.2 -0.1
Tax Revenue 83 612.1 84 638.2 -1 026.1 -1.2 289 882.2 290 908.3 -1 026.1 -0.4
Non-Tax Revenue 4 889.2 5 806.7 - 917.5 -15.8 17 016.8 17 934.2 - 917.4 -5.1
Bauxite Levy 355.4 361.6 - 6.3 -1.7 1 524.6 1 530.8 - 6.2 -0.4
Capital Revenue 2 091.9 560.6 1 531.4 273.2 10 585.2 9 053.7 1 531.5 16.9
Grants 138.2 1 802.7 -1 664.4 -92.3 3 448.7 5 113.2 -1 664.5 -32.6
Expenditure 115 410.0 109 405.1 6 004.9 5.5 403 191.6 397 186.7 6 004.9 1.5
Recurrent Expenditure 98 001.3 97 084.6 916.7 0.9 349 960.7 349 044.0 916.7 0.3
Programmes 26 406.8 25 136.2 1 270.6 5.1 89 699.4 88 428.8 1 270.6 1.4
Wages & Salaries 33 876.6 34 219.9 - 343.3 -1.0 139 556.9 139 900.2 - 343.3 -0.2
Interest 37 717.9 37 728.5 - 10.6 0.0 120 704.4 120 715.0 - 10.6 0.0
Domestic 31 608.7 31 628.3 - 19.6 -0.1 81 617.3 81 636.9 - 19.6 0.0
Foreign 6 109.2 6 100.2 9.0 0.1 39 087.1 39 078.1 9.0 0.0
Capital Expenditure 17 408.7 12 320.5 5 088.2 41.3 53 230.9 48 142.7 5 088.2 10.6
Non-interest expenditure 77 692.1 71 676.6 6 015.5 8.4 282 487.3 276 471.7 6 015.6 2.2
Fiscal Balance -24 323.1 -16 235.4 -8 087.7 49.8 -80 734.1 -72 646.5 -8 087.6 11.1
Current Balance -9 144.6 -6 278.1 -2 866.5 45.7 -41 537.1 -38 670.7 -2 866.4 7.4
Primary balance 13 394.8 21 493.1 -8 098.4 -37.7 39 970.3 48 068.5 -8 098.2 -16.8
In Percent of GDP
BR -1.9 -1.3 -6.2 -5.6
CB -0.7 -0.5 -3.2 -3.0
PB 1.0 1.7 3.1 3.7
IP 2.9 2.9 9.3 9.3
FSR -1.3 -1.2 -1.3 -1.2
NIE -0.9 -0.9 -0.8 -0.8
Key
BR = Borrowing Requirement = Fiscal Balance as a percent of GDP
CB= Current Balance = Current Revenue-Current Expenditure as a percent of GDP
PB= Primary Balance = Total Revenues-Total Expenditures less Interest Payments (IP) as a percent of GDP
IP= Interest Payments as a percent of GDP
FSR = Fiscal Stability Ratio = (Overall Balance/ Total Revenue) - 1
NIE = Non-Interest Expenditure as a per cent of GDP
International Benchmarks
BR greater than 3% of GDP often indicates serious fiscal imbalance
FSR closer to zero indicates more stable government finances
Negative CB ratio of less than 1% indicates dissaving or a need for fiscal adjustment as the public sector is borrowing
for consumption
PB ratio above zero indicates major fiscal adjustment to cover interest on past obligations
* Recurrent Expenditure includes programmes, wages and salaries and interest payments.
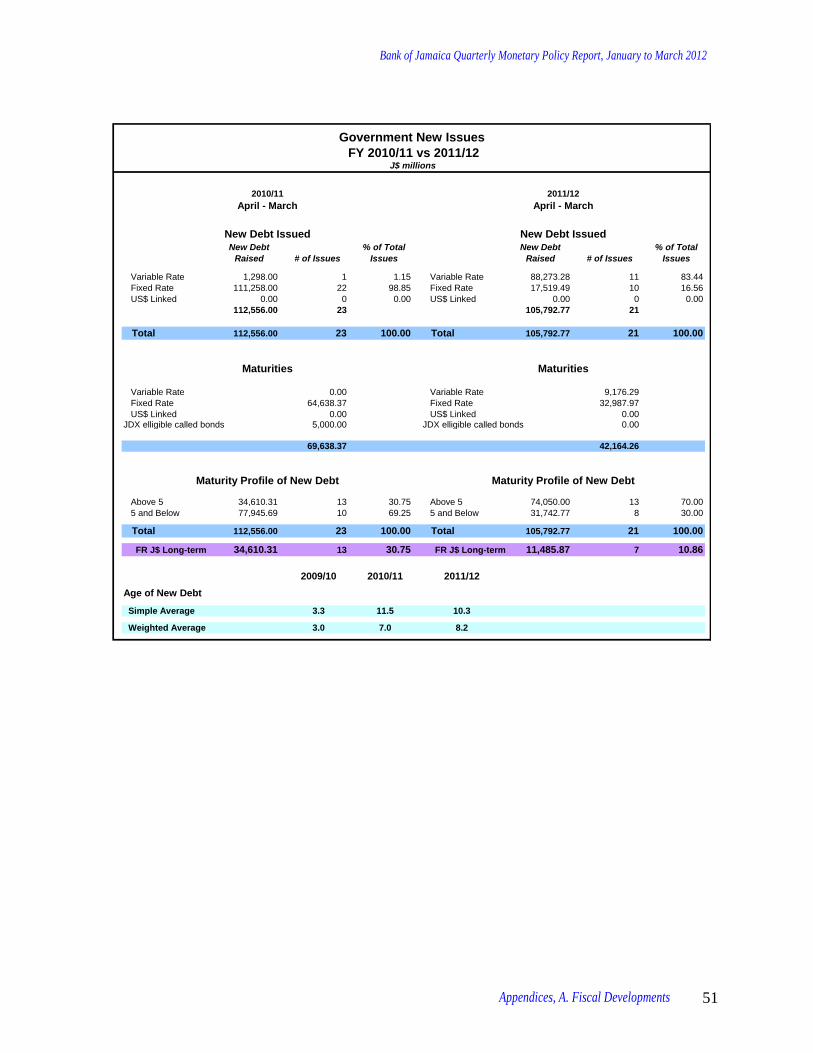
Bank of Jamaica Quarterly Monetary Policy Report, January to March 2012
Appendices, A. Fiscal Developments 51
Government New Issues
FY 2010/11 vs 2011/12J$ millions
New Debt
Raised # of Issues
% of Total
Issues
New Debt
Raised # of Issues
% of Total
Issues
Variable Rate 1,298.00 1 1.15 Variable Rate 88,273.28 11 83.44
Fixed Rate 111,258.00 22 98.85 Fixed Rate 17,519.49 10 16.56
US$ Linked 0.00 0 0.00 US$ Linked 0.00 0 0.00
112,556.00 23 105,792.77 21
Total 112,556.00 23 100.00 Total 105,792.77 21 100.00
Variable Rate 0.00 Variable Rate 9,176.29
Fixed Rate 64,638.37 Fixed Rate 32,987.97
US$ Linked 0.00 US$ Linked 0.00JDX elligible called bonds 5,000.00 JDX elligible called bonds 0.00
69,638.37 42,164.26
Above 5 34,610.31 13 30.75 Above 5 74,050.00 13 70.00
5 and Below 77,945.69 10 69.25 5 and Below 31,742.77 8 30.00
Total 112,556.00 23 100.00 Total 105,792.77 21 100.00
FR J$ Long-term 34,610.31 13 30.75 FR J$ Long-term 11,485.87 7 10.86
2009/10 2010/11 2011/12
Age of New Debt
Simple Average 3.3 11.5 10.3
Weighted Average 3.0 7.0 8.2
Maturities Maturities
Maturity Profile of New Debt Maturity Profile of New Debt
2010/11 2011/12
April - March April - March
New Debt Issued New Debt Issued

Bank of Jamaica Quarterly Monetary Policy Report, January to March 2012
Appendices, B. Monetary Policy Developments 52
B. MONETARY POLICY DEVELOPMENTS 27/04/2000 30-day Reverse Repurchase Rate was reduced from 17.30 per cent to 17.00 per cent.
01/06/2000 Liquid assets ratio of commercial banks’ and FIA institutions in respect of local and foreign currency
liabilities reduced from thirty-three per cent (33%) to thirty-two per cent (32%).
Cash reserve ratio of commercial banks’ and FIA institutions in respect of local and foreign currency
liabilities reduced from fifteen per cent (15%) to fourteen per cent (14%).
The maximum liquid asset ratio for Building societies was reduced by one percentage point resulting
in the dual liquid asset ratios of five per cent and thirty-two per cent (5% and 32%) for Building
Societies.
The maximum cash reserve ratio for Building Societies was reduced by one percentage point resulting
in dual cash reserve ratios of one per cent and fourteen per cent (1% and 14%) in respect of local and
foreign currency deposits.
28/07/2000 30-day Reverse Repurchase Rate was reduced from 17.00 per cent to 16.75 per cent.
11/08/2000 30-day Reverse Repurchase Rate was reduced from 16.75 per cent to 16.45 per cent.
01/09/2000 Liquid assets ratio of commercial banks’ and FIA institutions in respect of local and foreign currency
liabilities reduced from thirty-two per cent (32%) to thirty-one per cent (31%).
Cash reserve ratio of commercial banks’ and FIA institutions in respect of local and foreign currency
liabilities reduced from fourteen per cent (14%) to thirteen per cent (13%).
The maximum liquid asset ratio for Building societies was reduced by one percentage point resulting
in the dual liquid asset ratios of five per cent and thirty-one per cent (5% and 31%) for Building
Societies.
The maximum cash reserve ratio for Building Societies was reduced by one percentage point resulting
in dual cash reserve ratios of one per cent and thirteen per cent (1% and 13%) in respect of local and
foreign currency deposits.
18/09/20000 Bank of Jamaica introduces 270-day and 365-day reverse repurchase instruments at 17.6 and 18.0 per cent respectively.
04/10/20000 Interest rates on the 270-day and 365-day instruments were increased to 20.0 and 22.0 per cent
respectively.
23/10/2000 Interest rates on the 270-day and 365-day instruments were reduced to 17.6 and 18.0 per cent
respectively.

Bank of Jamaica Quarterly Monetary Policy Report, January to March 2012
Appendices, B. Monetary Policy Developments 53
24/11/2000 Interest rates on the 270-day and 365-day instruments were increased to 20.0 and 22.0 per cent
respectively.
28/12/2000 Interest rate on the 365-day instrument was reduced to 21 per cent.
14/02/2001 Interest rates on the 365-day and 270-day instruments were reduced to 20.00 per cent and 19.25 per
cent respectively.
20/02/2001 Interest rates on the 365-day and 270-day instruments were reduced to 19.50 per cent, and 18.75 per
cent respectively.
01/03/2001 Liquid assets ratio of commercial banks’ and FIA institutions in respect of local and foreign currency
liabilities reduced from thirty-one per cent (31%) to thirty per cent (30%).
Cash reserve ratio of commercial banks’ and FIA institutions in respect of local and foreign currency
liabilities reduced from thirteen per cent (13%) to twelve per cent (12%).
The maximum liquid asset ratio for Building societies was reduced by one percentage point resulting
in the dual liquid asset ratios of five per cent and thirty per cent (5% and 30%) for Building Societies.
The maximum cash reserve ratio for Building Societies was reduced by one percentage point resulting
in dual cash reserve ratios of one per cent and twelve per cent (1% and 12%) in respect of local and
foreign currency deposits.
08/03/2001 Interest rates on the 365-day, 270-day instruments were reduced to 19.00 per cent, 18.25 per cent per
cent respectively.
12/03/2001 Interest rates on the 365-day, 270-day, 180-day, 120-day, 90-day, 60-day and 30-day instruments were
reduced to 18.50 per cent, 17.75 per cent, 16.70 per cent, 16.40 per cent, 16.25 per cent, 16.15 per cent
and 16.00 per cent respectively.
22/03/2001 Interest rates on the 365-day, 270-day, 180-day, 120-day, 90-day, 60-day and 30-day instruments were
reduced to 17.75 per cent, 17.00 per cent, 16.15 per cent, 15.80 per cent, 15.70 per cent, 15.60 per cent
and 15.50 per cent respectively.
11/04/2001 Interest rates on the 365-day and 270-day instruments were reduced to 17.50 per cent and 16.75 per
cent respectively.
21/05/2001 Interest rates on the 365-day, 270-day, 180-day, 120-day, 90-day, 60-day and 30-day instruments were
reduced to 16.50 per cent, 15.70 per cent, 15.30 per cent, 15.05 per cent, 14.95 per cent, 14.85 per cent
and 14.75 per cent respectively.
01/06/2001 Liquid assets ratio of commercial banks’ and FIA institutions in respect of local and foreign currency
liabilities reduced from thirty per cent (30%) to twenty nine per cent (29%).
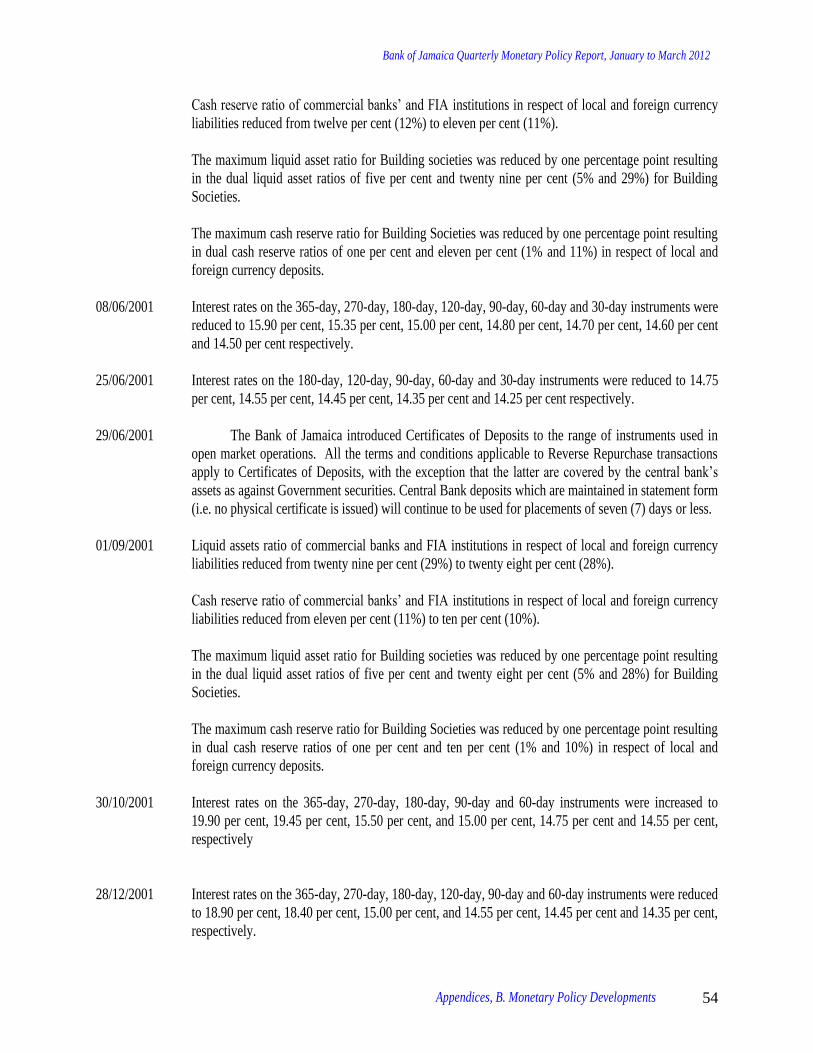
Bank of Jamaica Quarterly Monetary Policy Report, January to March 2012
Appendices, B. Monetary Policy Developments 54
Cash reserve ratio of commercial banks’ and FIA institutions in respect of local and foreign currency
liabilities reduced from twelve per cent (12%) to eleven per cent (11%).
The maximum liquid asset ratio for Building societies was reduced by one percentage point resulting
in the dual liquid asset ratios of five per cent and twenty nine per cent (5% and 29%) for Building
Societies.
The maximum cash reserve ratio for Building Societies was reduced by one percentage point resulting
in dual cash reserve ratios of one per cent and eleven per cent (1% and 11%) in respect of local and
foreign currency deposits.
08/06/2001 Interest rates on the 365-day, 270-day, 180-day, 120-day, 90-day, 60-day and 30-day instruments were
reduced to 15.90 per cent, 15.35 per cent, 15.00 per cent, 14.80 per cent, 14.70 per cent, 14.60 per cent
and 14.50 per cent respectively.
25/06/2001 Interest rates on the 180-day, 120-day, 90-day, 60-day and 30-day instruments were reduced to 14.75
per cent, 14.55 per cent, 14.45 per cent, 14.35 per cent and 14.25 per cent respectively.
29/06/2001 The Bank of Jamaica introduced Certificates of Deposits to the range of instruments used in
open market operations. All the terms and conditions applicable to Reverse Repurchase transactions
apply to Certificates of Deposits, with the exception that the latter are covered by the central bank’s
assets as against Government securities. Central Bank deposits which are maintained in statement form
(i.e. no physical certificate is issued) will continue to be used for placements of seven (7) days or less.
01/09/2001 Liquid assets ratio of commercial banks and FIA institutions in respect of local and foreign currency
liabilities reduced from twenty nine per cent (29%) to twenty eight per cent (28%).
Cash reserve ratio of commercial banks’ and FIA institutions in respect of local and foreign currency
liabilities reduced from eleven per cent (11%) to ten per cent (10%).
The maximum liquid asset ratio for Building societies was reduced by one percentage point resulting
in the dual liquid asset ratios of five per cent and twenty eight per cent (5% and 28%) for Building
Societies.
The maximum cash reserve ratio for Building Societies was reduced by one percentage point resulting
in dual cash reserve ratios of one per cent and ten per cent (1% and 10%) in respect of local and
foreign currency deposits.
30/10/2001 Interest rates on the 365-day, 270-day, 180-day, 90-day and 60-day instruments were increased to
19.90 per cent, 19.45 per cent, 15.50 per cent, and 15.00 per cent, 14.75 per cent and 14.55 per cent,
respectively
28/12/2001 Interest rates on the 365-day, 270-day, 180-day, 120-day, 90-day and 60-day instruments were reduced
to 18.90 per cent, 18.40 per cent, 15.00 per cent, and 14.55 per cent, 14.45 per cent and 14.35 per cent,
respectively.

Bank of Jamaica Quarterly Monetary Policy Report, January to March 2012
Appendices, B. Monetary Policy Developments 55
09/01/2002 Interest rates on the 365-day and 270-day instruments were reduced to 17.90 per cent and 17.00per
cent, respectively.
06/02/2002 Interest rates on the 365-day, 270-day, 180-day, 120-day, 90-day, 60-day and 30-day instruments were
reduced to 16.70 per cent, 15.90 per cent, 14.70 per cent, 14.30 per cent, 14.20 per cent, 14.10 per cent
and 14.00 per cent, respectively.
14/02/2002 Interest rates on the 365-day, 270-day, 180-day, 120-day, 90-day, 60-day and 30-day instruments were
reduced to 15.80 per cent, 15.00 per cent, 14.40 per cent, 14.05 per cent, 13.95 per cent, 13.85 per cent
and 13.95 per cent, respectively.
01/03/2002 Liquid assets ratio of commercial banks and FIA institutions in respect of local and foreign currency
liabilities were reduced from twenty eight per cent (28%) to twenty seven per cent (27%).
Cash reserve ratio of commercial banks and FIA institutions in respect of local and foreign currency
liabilities reduced from ten per cent (10%) to nine per cent (9%).
11/03/2002 Interest rates on Bank of Jamaica 30-day, 60-day, 90-day, 120-day, 180-day, 270-day and 365-day
open market instruments were reduced from 13.75 per cent, 13.85 per cent, 13.95 per cent, 14.05 per
cent, 14.40 per cent, 15.00 per cent and 15.80 per cent to 13.25 per cent, 13.35 per cent, 13.45 per cent,
13.55 per cent, 13.80 per cent, 14.20 per cent, and 15.00 per cent, respectively.
11/07/2002 Interest rates on Bank of Jamaica 30-day, 60-day, 90-day, 120-day, 180-day, 270-day, and 365-day
open market instruments were reduced from 13.25 per cent, 13.35 per cent, 13.45 per cent, 13.55 per
cent, 13.80 per cent, 14.20 per cent, and 15.00 per cent to 12.95 per cent, 13.05 per cent, 13.15 per
cent, 13.25 per cent, 13.45 per cent, 14.00 per cent, and 14.90 per cent, respectively.
01/09/2002 Liquid Assets ratio of commercial banks, FIA institutions and of building societies, in respect of local
and foreign currency liabilities was reduced from twenty seven per cent (27%) to twenty three per cent
(23%).
07/08/2002 Interest rates on Bank of Jamaica 270-day and 365-day open market instruments were reduced from
14.00 per cent to 13.85 per cent and from 14.90 per cent to 14.50 per cent, respectively.
09/09/2002 Interest rates on Bank of Jamaica 90-day and 120-day open market instruments were increased from
13.15 per cent to 17.25 per cent and from 13.25 per cent to 17.05 per cent, respectively.
09/10/2002 Interest rates on Bank of Jamaica 90-day and 120-day open market instruments were increased from
17.25 per cent to 19.25 per cent and from 17.05 per cent to 19.40 per cent, respectively.
28/10/2002 Interest rates on Bank of Jamaica 90-day and 120-day open market instruments were reduced from
19.25 per cent to 18.25 per cent and from 19.40 per cent to 18.40 per cent, respectively.
Bank of Jamaica Quarterly Monetary Policy Report, January to March 2012
Appendices, B. Monetary Policy Developments 56
01/11/2002 The interest rate chargeable in respect of breaches by commercial banks, of the cash reserve and liquid
assets ratios in respect of Jamaica Dollar liabilities, was reduced from 69 per cent per annum to 45 per
cent per annum.
The interest rate chargeable in respect of breaches by building societies and institutions licensed under
the Financial Institutions Act, of the cash reserve and liquid assets ratios in respect of Jamaica Dollar
liabilities, was adjusted from one-sixth of one per centum per day to 45 per cent per annum.
10/01/2003 The Bank of Jamaica instituted a “Special Deposit” requirement for Commercial Banks and
institutions licensed under the Financial Institutions Act. Each institution will be required to place
cash deposits with the Central Bank equivalent to 5% of its Jamaican Dollar prescribed liabilities.
10/02/2003 The Bank of Jamaica introduced a special five-month open market instrument which earned interest at
30% per annum. This instrument was introduced in a context of significant Jamaica dollar liquidity
and protracted instability in the foreign exchange market.
14/02/2003 The Bank of Jamaica withdrew the special five- month open market instrument which was introduced
on 10 February 2003. The decision to remove this instrument came against the background of tight
Jamaica dollar liquidity and the appreciation in the exchange rate over the previous four days. The
removal was also in response to representations made to the Bank of Jamaica by financial institutions
and understandings reached with respect to the development of foreign exchange market protocols.
19/03/2003 Interest rates on Bank of Jamaica’s 180-day, 270-day and 365-day open market instruments were
increased to 19.65 per cent, 21.50 per cent and 24.0 per cent, respectively.
26/03/2003 Interest rates on Bank of Jamaica 30-day, 60-day, 90-day, 120-day, 180-day, 270-day and 365-day
open market instruments were increased to 15.00 per cent, 15.30 per cent, 20.00 per cent, 24.00 per
cent, 33.15 per cent, 34.50 per cent and 35.95 per cent, respectively.
25/04/2003 Interest rates on Bank of Jamaica 180-day, 270-day and 365-day open market instruments were
reduced to 28.00 per cent, 32.50 per cent and 33.00 per cent, respectively.
19/05/2003 The interest rate applicable to overdrafts on accounts held with the Bank of Jamaica was increased to
65.0 per cent per annum.
24/06/2003 Interest rates on Bank of Jamaica 180-day, 270-day and 365-day open market instruments were
reduced to 26.50 per cent, 29.50 per cent and 30.00 per cent, respectively.
08/07/2003 Interest rates on Bank of Jamaica 270-day and 365-day open market instruments were reduced to
27.50 per cent and 28.00 per cent, respectively.
04/08/2003 Interest rates on Bank of Jamaica 90-day, 120-day, 180-day, 270-day and 365-day open market
instruments were reduced to 18.00 per cent, 22.00 per cent, 25.00 per cent, 25.75 per cent and 26.00
per cent, respectively.

Bank of Jamaica Quarterly Monetary Policy Report, January to March 2012
Appendices, B. Monetary Policy Developments 57
09/09/2003 Interest rates on Bank of Jamaica 120-day, 180-day, 270-day and 365-day open market instruments
were reduced to 21.00 per cent, 23.50 per cent, 23.75 per cent and 24.00 per cent, respectively.
17/10/2003 Bank of Jamaica withdrew its 270-day and 365-day instruments from open market trading.
29/10/2003 Bank of Jamaica returned its 270-day and 365-day instruments to open market trading at 23.75 per
cent and 24.00 per cent respectively.
10/12/2003 Interest rates on Bank of Jamaica 90-day 120-day, 180-day, 270-day and 365-day open market
instruments were reduced to 17.00 per cent, 20.00 per cent, 21.00 per cent, 22.00 per cent and 23.00
per cent, respectively.
09/01/2004 Interest rates on Bank of Jamaica 90-day 120-day, 180-day, 270-day and 365-day open market
instruments were reduced to 16.00 per cent, 18.00 per cent, 19.50 per cent, 21.00 per cent and 22.00
per cent, respectively.
21/01/2004 Interest rates on Bank of Jamaica 60-day, 90-day, 120-day, 180-day, 270-day and 365-day open
market instruments were reduced to 15.20 per cent, 15.50 per cent, 17.00 per cent, 18.25 per cent,
20.00 per cent and 21.00 per cent respectively.
26/01/2004 Interest rates on Bank of Jamaica 30-day, 60-day, 90-day, 120-day, 180-day, 270-day and 365-day
open market instruments were reduced to 14.85 per cent, 15.00 per cent, 15.10 per cent, 16.00 per cent,
17.25 per cent, 18.75 per cent and 20.00 per cent, respectively.
16/02/2004 Interest rates on Bank of Jamaica 120-day, 180-day, 270-day and 365-day open market instruments
were reduced to 15.50 per cent, 16.25 per cent, 17.75 per cent and 19.00 per cent, respectively.
27/02/2004 Interest rates on Bank of Jamaica 180-day, 270-day and 365-day open market instruments were
reduced to 16.00 per cent, 17.25 per cent and 18.50 per cent, respectively.
10/03/2004 Interest rates on Bank of Jamaica 270-day and 365-day open market instruments were reduced to
16.95 per cent and 17.95 per cent, respectively.
10/03/2004 Pursuant to Section 15 (2) (h) of the Banking Act and the Financial Institutions Act, and Regulation 38
(h) of the Bank of Jamaica (Building Societies) Regulation, the Minister of Finance determined that all
debt securities or instruments issued by the Government of Jamaica, whether denominated in Jamaican
dollars or in a foreign currency and irrespective of their original maturity terms, shall, within nine
months of their maturity date be designated Liquid Assets.
02/04/2004 Interest rates on Bank of Jamaica 30-day, 60-day, 90-day, 120-day, 180-day, 270-day and 365-day
open market instruments were reduced to 14.60 per cent, 14.70 per cent, 14.80 per cent, 15.10 per cent,
15.60 per cent, 16.50 per cent and 17.40 per cent, respectively.
Bank of Jamaica Quarterly Monetary Policy Report, January to March 2012
Appendices, B. Monetary Policy Developments 58
19/04/2004 Interest rates on Bank of Jamaica 30-day, 60-day, 90-day, 120-day, 180-day, 270-day and 365-day
open market instruments were reduced to 14.40 per cent, 14.50 per cent, 14.60 per cent, 14.85 per cent,
15.30 per cent, 16.00 per cent and 16.90 per cent, respectively.
05/05/2004 Interest rates on Bank of Jamaica 30-day, 60-day, 90-day, 120-day, 180-day, 270-day and 365-day
open market instruments were reduced to 14.20 per cent, 14.30 per cent, 14.40 per cent, 14.55 per cent,
15.05 per cent, 15.65 per cent and 16.40 per cent, respectively.
03/09/2004 Interest rates on Bank of Jamaica 30-day, 60-day, 90-day, 120-day, 180-day, 270-day and 365-day
open market instruments were reduced to 14.00 per cent, 14.10 per cent, 14.20 per cent, 14.35 per cent,
14.80 per cent, 15.35 per cent and 16.00 per cent, respectively.
28/12/2004 Interest rates on Bank of Jamaica 30-day, 60-day, 90-day, 120-day, 180-day, 270-day and 365-day
open market instruments were reduced to 13.80 per cent, 13.95 per cent, 14.05 per cent, 14.15 per cent,
14.30 per cent, 15.00 per cent and 15.50 per cent, respectively.
07/02/2005 Interest rates on Bank of Jamaica 30-day, 60-day, 90-day, 120-day, 180-day, 270-day and 365-day
open market instruments were reduced to 13.50 per cent, 13.65 per cent, 13.75 per cent, 13.85 per cent,
14.00 per cent, 14.50 per cent and 15.00 per cent, respectively.
07/02/2005 The Bank of Jamaica reduced the Special Deposit holdings for commercial banks and FIA licensees by
two (2) percentage points. Accordingly, these institutions, until further notified, are required to
maintain with the Bank of Jamaica as a Special Deposit, an amount wholly in the form of cash,
representing three (3) per cent of their prescribed liabilities.
07/03/2005 Interest rates on Bank of Jamaica 30-day, 60-day, 90-day, 120-day, 180-day, 270-day and 365-day
open market instruments were reduced to 12.95 per cent, 13.10 per cent, 13.20 per cent, 13.30 per cent,
13.45 per cent, 14.00 per cent and 14.50 per cent, respectively.
These rate adjustments were underpinned by continued stability in the exchange rate, reflecting
buoyant foreign exchange inflows from tourism and remittances. Also, the Bank’s net international
reserves remained around US$1.8 billion, a level that was more than adequate to underwrite near term
stability. In addition, inflation in the first quarter of 2005 was expected to continue on a downward
trend engendering a return to single digit inflation in the forthcoming fiscal year.
16/05/2005 The Bank of Jamaica reduced the Special Deposit holdings for commercial banks and FIA licensees by
two (2) percentage points. Accordingly, these institutions, until further notified, are required to
maintain with the Bank of Jamaica as a Special Deposit, an amount wholly in the form of cash,
representing one (1) per cent of their prescribed liabilities.
26/05/2005 Interest rates on Bank of Jamaica 30-day, 60-day, 90-day, 120-day, 180-day, 270-day and 365-day
open market instruments were reduced to 12.60 per cent, 12.70 per cent, 12.75 per cent, 12.85 per cent,
13.00 per cent, 13.25 per cent and 13.60 per cent, respectively.
The adjustments were consistent with the steady improvement in Jamaica’s economic environment as
reflected in buoyant foreign exchange inflows, stability in the money and foreign exchange markets
Bank of Jamaica Quarterly Monetary Policy Report, January to March 2012
Appendices, B. Monetary Policy Developments 59
and a strong international reserve position. Furthermore, the near-term prospects for production and
prices continued to be very favourable with strong recovery expected in domestic agriculture as well as
ongoing expansion in tourism and mining activities. In addition, it was expected that the
normalization of food supplies and continued stability in the foreign exchange market would help to
contain inflation during the 2005/2006 fiscal year.
27/05/2005 The Bank phased out its reverse repurchase agreements. This facilitated consistency in the accounting
treatment (under International Financial Reporting Standards) of open market instruments by holders.
18/04/2006 The Bank suspended the acceptance of placements on its open market operations (OMO) instruments
with tenors of 270 days and 365 days, until further advised. The OMO instruments, along with
corresponding interest rates, that remained on offer were 30-days: 12.6 per cent; 60-days: 12.70 per
cent; 90-days: 12.75 per cent; 120-days: 12.85 per cent; and 180-days: 13.00 per cent.
01/05/2006 The Bank removed the requirement that deposit-taking institutions must hold some portion of their
assets as a Special Deposit with the Central Bank. This requirement was introduced in January 2003 to
stabilize the financial markets. The initial deposit requirement was set at 5 per cent of prescribed
liabilities and this was reduced to 1 per cent in two steps between February and May 2005. The
significant improvement in macroeconomic conditions and the positive outlook for fiscal year 2006/07
allowed for the return of the remaining deposits. The sum due to financial institutions as at 28 April
2006 was J$1 564.1 million.
12/05/2006 Interest rates on Bank of Jamaica 30-day, 60-day, 90-day, 120-day and 180-day open market
instruments were reduced to 12.45 per cent, 12.50 per cent, 12.60 per cent, 12.65 per cent and 12.80
per cent, respectively.
01/09/2006 Interest rates on Bank of Jamaica 30-day, 60-day, 90-day, 120-day and 180-day open market
instruments were reduced to 12.15 per cent, 12.2 per cent, 12.30 per cent, 12.35 per cent and 12.50 per
cent, respectively.
22/09/2006 Interest rates on Bank of Jamaica 30-day, 60-day, 90-day, 120-day and 180-day open market
instruments were reduced to 11.95 per cent, 12.00 per cent, 12.10 per cent, 12.15 per cent and 12.30
per cent, respectively.
22/12/2006 Interest rates on Bank of Jamaica 30-day, 60-day, 90-day, 120-day and 180-day open market
instruments were reduced to 11.65 per cent, 11.70 per cent, 11.80 per cent, 11.85 per cent and 12.00
per cent, respectively. This policy action comes against the background of continued robust economic
performance and favourable medium term economic outlook.
18/01/2007 The Bank of Jamaica offered a Special One-Year Variable rate Instrument to Primary Dealers and
Commercial Banks. Interest payments on this instrument will be made quarterly. The initial coupon is
11.80 per cent per annum, the rate being paid on a Bank of Jamaica 90-day Certificate of Deposit.
Subsequent interest payments will be calculated at 1.00 percentage point above the Bank of Jamaica
90-day rate applicable at the beginning of each quarterly interest period.

Bank of Jamaica Quarterly Monetary Policy Report, January to March 2012
Appendices, B. Monetary Policy Developments 60
The offer was made in the context of the redemption of Government of Jamaica domestic debt
instruments on 18 January 2007 which would increase the level of liquidity in the financial system
beyond normal requirements. The Bank continues to offer its regular issues of Certificates of Deposits
ranging from 30 days to 180 days.
19/06/2007 The Bank of Jamaica offered a Special Two-Year Variable rate Instrument to Primary Dealers and
Commercial Banks during the period 19-22 June 2007. The instrument will be amortized in two equal
tranches on 19 June 2008 and 19 June 2009 with quarterly interest payments. The initial coupon is
11.80 per cent per annum, the rate being paid on a Bank of Jamaica 90-day Certificate of Deposit.
Subsequent interest payments will be calculated at 1.25 percentage point above the Bank of Jamaica
90-day rate applicable at the beginning of each quarterly interest period.
The offer was made in the context of the exceptionally high level of liquidity of Jamaica Dollar
liquidity anticipated during the offer period. The Bank continues to offer its regular issues of
Certificates of Deposits ranging from 30 days to 180 days.
04/07/2007 As part of its liquidity management strategy, the Bank of Jamaica offered a Special Two-Year
Variable Rate Instrument to Primary Dealers and Commercial Banks from 04 July 2007 to 09 July
2007. The instrument, with an initial coupon of 11.98 per cent, will be amortized in two equal tranches
on 02 January 2009 and 03 July 2009 with quarterly interest payments. Subsequent interest payments
will be calculated at 2.00 percentage points above the Bank of Jamaica 90-day rate applicable at the
beginning of each quarterly interest period.
The Bank of Jamaica will continue to offer its regular issues of Certificates of Deposit
ranging from 30 days to 180 days
06/09/2007 As part of its liquidity management strategy, the Bank of Jamaica offered a Special Two-Year
Variable Rate Instrument to Primary Dealers and Commercial Banks commencing from 06 September
2007 to 12 September 2007. The instrument, with an initial coupon of 12.21 per cent per annum, will
be amortized in two equal tranches on 05 September 2008 and 04 September 2009 with quarterly
interest payments. Subsequent interest payments will be calculated at 2.00 percentage points above the
Bank of Jamaica 90-day rate applicable at the beginning of each quarterly interest period.
The Bank of Jamaica will continue to offer its regular issues of Certificates of Deposit ranging from 30
days to 180 days.
18/09/2007 The Bank of Jamaica accepted subscriptions on a Special One-Year Certificate of Deposit from 18
September 2007 to 26 September 2007. As is customary, this instrument was offered to Primary
Dealers and Commercial Banks. Interest on this instrument will be payable semi-annually at a fixed
rate of 14.00 per cent per annum. The offer was designed to effectively manage the level of Jamaica
Dollar liquidity anticipated in the financial system.
12/10/2007 The Bank of Jamaica, as part of its liquidity management strategy, offered a Special Eighteen-Month
Variable Rate Instrument to Primary Dealers and Commercial Banks. The instrument will be
amortized in two equal tranches on 11 July 2008 and 14 April 2009 with quarterly interest payments.
The initial coupon is 14.34 per cent per annum. Subsequent interest payments will be calculated at
Bank of Jamaica Quarterly Monetary Policy Report, January to March 2012
Appendices, B. Monetary Policy Developments 61
1.625 percentage points above the Government of Jamaica 90-day weighted average Treasury Bill
yield applicable at the beginning of each quarterly interest period.
The Bank of Jamaica will continue to offer its regular issues of Certificates of Deposit ranging from 30
days to 180 days.
16/11/2007 The Bank of Jamaica, as part of its liquidity management strategy, offered a Special Twelve-Month
Variable Rate Instrument to Primary Dealers and Commercial Banks. The instrument will be
amortized on 14 November 2008 with quarterly interest payments. The initial coupon is 13.46 per cent
per annum. Subsequent interest payments will be calculated at 1.5 percentage points above the
Government of Jamaica 90-day weighted average Treasury Bill yield applicable at the beginning of
each quarterly interest period.
The Bank of Jamaica will continue to offer its regular issues of Certificates of Deposit ranging from 30
days to 180 days.
09/01/2008 The Bank of Jamaica implemented the following changes to interest rates payable on open-market
instruments:
The realignment of rates placed the Bank in a better position to manage the Jamaica Dollar liquidity
that emanated from the maturity of both of both Bank of Jamaica and Government of Jamaica
instruments as well as the reflow of currency issued for the Christmas season. The revised rate
structure offered investors a range of options that more closely reflected the then existing money
market rates.
16//01/2008 Bank of Jamaica offered a 365-day Certificate of Deposit in addition to its regular suite of instruments.
This offer attracted a rate of 13.50 per cent per annum, which was consistent with the Bank’s then
existing interest rate structure. The rates on 30-day to 180-day instruments remain unchanged.
18/01/2008 Bank of Jamaica offered a special 18-month, variable rate certificate of deposit (CD) to banks and
primary dealers. The CD attracted a rate of 12.80 per cent for the first 3 months. Thereafter, quarterly
interest payments at the 90-day weighted average Treasury Bill rate applicable at the beginning of each
interest period plus a margin of 1.5 percentage points apply.
The rates applicable to all other BOJ instruments remained unchanged.
04/02/2008 Interest rates paid on open market instruments issued by the Bank of Jamaica were revised as follows:
Tenor 30 days 60 days 90 days 120 days 180 days
Previous Rates
(%)
11.65 11.70 11.80 11.85 12.00
New Rate 12.65 12.70 12.80 12.85 13.00

Bank of Jamaica Quarterly Monetary Policy Report, January to March 2012
Appendices, B. Monetary Policy Developments 62
Tenor 30 days
60 days
90 days 120 days 180 days 365 days
Previous Rates
(%)
12.65 12.70 12.70 12.85 13.00 13.50
New rate 13.50 13.70 13.90 14.00 14.20 15.00 Difference 85
bps
100 bps 120 bps 115 bps 120 bps 150 bps
The revisions reflected concerns about the rising trend in inflation and its impact on the attractiveness
of Jamaica Dollar investments.
26/06/2008 Interest rates paid on Bank of Jamaica open market operations instruments were adjusted as follows:
Tenor 30
days
60
days
90
days 120 days
180 days 365
days
New rates (%) 14.00 14.20 14.40 14.50
14.70 15.50
Previous
rates 13.50 13.70 13.90 14.00
14.20
15.00
The adjustment in rates was aimed at guiding domestic inflation towards a range of 12 – 15 per cent by
March 2009, based on current projections for commodity prices.
01/09/2008 Bank of Jamaica offered a special 18-month, variable rate certificate of deposit (CD) to banks and
primary dealers. The CD attracted a rate of 14.58 per cent for the first 3 months. Thereafter, quarterly
interest payments at the 90-day weighted average Treasury Bill rate applicable at the beginning of each
interest period plus a margin of 1.25 percentage points apply.
The rates applicable to all other BOJ instruments remained unchanged.
17/10/2008 Interest rates payable on Bank of Jamaica Certificates of Deposit were adjusted as follows:
Tenor 30
days
60
days
90
days
120
days
180 days 365
days
New rates 14.65 14.85 15.05 15.15 15.35 16.70 Previous rates 14.00 14.20 14.40 14.50 14.70 15.50
The adjustment will bring rates offered by the Central Bank in line with yields applicable to
Government of Jamaica Treasury Bills and other short-dated market instruments.

Bank of Jamaica Quarterly Monetary Policy Report, January to March 2012
Appendices, B. Monetary Policy Developments 63
12/11/2008 The Bank of Jamaica established “Intermediation Facilities” in foreign and domestic currencies, with a
view to enhance the flow of credit to the financial market. The domestic currency section of the
facility became operational on 24 November.
18/11/2008 In an effort to remove liquidity overhang arising from the maturity of both BOJ and GOJ securities,
and preserve order in financial markets, the Bank of Jamaica implemented the following measures:
The Bank offered a Special Certificate of Deposit to Primary Dealers and Commercial Banks,
which matured on 3 December 2008. Interest payable on this instrument was 20.50% per
annum. This instrument was offered from Tuesday, 18 November to Wednesday, 19
November 2008.
BOJ’s regular menu of CDs ranging from 30 days to 365 days remain
Effective 3 December, 2008, on the expiration of a 15 day notice period, the cash reserve
requirement of commercial banks, merchant banks and building societies was increased by 2
percentage points to 11 per cent of Jamaica Dollar liabilities. As a consequence, the liquid
asset requirement rose to 25 per cent from 23 per cent. It was intended to increase these
requirements by a further 3 percentage points.
These monetary policy actions are intended to support the achievement of the inflation objective and
the maintenance of macro-economic stability.
01/12/2008 Interest rates payable on Bank of Jamaica Certificates of Deposit were adjusted as follows:
Tenor 30
days 60-days
90
days
120
days
180
days 365 days
New rates (%) 17.00 17.50 20.00 20.20
21.50 24.00
Previous
rates 14.65 14.85 15.05 15.15 15.35
16.70
The increase in interest rates occurred in the context of instability in the foreign exchange market,
which was related to the sharp rise in the yields on Government of Jamaica (GOJ) Global Bonds and
USD Bonds issued by Jamaican companies. The resulting spike in demand for foreign exchange by
securities dealers to meet margin calls from overseas creditors, together with incremental demand for
foreign exchange by a wider cross-section of persons triggered a disorderly depreciation in the
exchange rate. If this condition persisted, it would precipitate higher inflation and greater
macroeconomic instability.
In context of the foregoing, the Jamaica Dollar liquidity resulting from the maturity of significant sums
in BOJ securities over the next three weeks makes it necessary for BOJ to take this action.
Accordingly, the rise in interest rates is expected to dampen the extraordinary demand related to
portfolio decisions and thereby restore predictability and order to local financial markets.

Bank of Jamaica Quarterly Monetary Policy Report, January to March 2012
Appendices, B. Monetary Policy Developments 64
03/12/2008 The cash reserve ratio (CRR) and the liquid assets ratio (LAR) in respect of only domestic currency
liabilities of commercial banks, building societies and institutions licensed under the Financial
Institutions Act were increased by 2 percentage points to 11% and 25% respectively.
02/01/2009 The CRR and the LAR for both domestic and foreign currency liabilities of commercial banks,
institutions licensed under the Financial Institutions Act and building societies were increased by 2
percentage points to 13% and 27% respectively in the case of domestic currency liabilities and 11%
and 25%, respectively in the case of foreign currency liabilities.
03/02/2009 The Bank of Jamaica established the Foreign Exchange Surrender Facility for public sector entities
(PSE Facility). The aim of the facility is to centralize foreign currency demand of the public sector,
especially Port Authority of Jamaica (PAJ), National Water Commission (NWC) and Petrojam. Under
this facility Commercial Banks agreed to surrender fifteen per cent (15%) of foreign currency
purchases daily. The pre-existing requirement where Authorized Dealers and Cambios surrender
within a range of five per cent (5%) to ten per cent (10%) of their gross foreign currency purchases
from commercial clients remains in effect. Therefore commercial banks are to surrender, in total
between twenty per cent (20%) to twenty-five per cent (25%) of foreign currency purchases daily.
06/02/2009 The CRR and the LAR in respect of Jamaica Dollar liabilities of deposit-taking institutions were
increased by 1 percentage point to 14% and 28% respectively. The respective ratios relating to foreign
currency liabilities remained unchanged at 11% and 25%.
The CRR and LAR are differentially applied to Building Societies. Domestic currency reserve
requirements are based on meeting the 40% threshold of domestic currency denominated qualifying
assets in relation to domestic currency deposits and withdrawable shares. Foreign currency
requirements are determined by meeting the 40% threshold of all (domestic and foreign currency)
qualifying assets against all deposits and withdrawable shares. Accordingly, cash reserve ratios of one
per cent and fourteen per cent (1% and 14%) and the liquid assets ratios of five per cent and 28 per
cent (5.0% and 28%) apply to Building Societies, depending on whether they meet the aforementioned
40 per cent (40%) threshold in respect of the above-mentioned prescribed domestic currency liabilities.
Similarly, in the case of liabilities payable in foreign currency, cash reserve ratios of one per cent and
eleven per cent (1% and 11%) and the liquid assets ratios of five per cent and 25 per cent (5.0% and
25%) apply, depending on whether the Societies meet the 40 per cent (40%) threshold. Societies that
meet the prescribed 'qualifying assets' threshold attract the lower cash reserve and liquid assets
requirements. The higher requirements apply to those Societies which fail to meet the prescribed
thresholds.
08/04/2009 The rate payable on a 1-year Certificate of Deposit issued by Bank of Jamaica was reduced to 22.67 per
cent. Rates on other tenors remained unchanged.
Tenor 30 days 60 days 90 days 120 days 180 days 365 days
New rates (%) 17.00 17.50 20.00 20.20 21.50 22.67 Previous rates 17.00% 17.50% 20.00% 20.20 21.50% 24.00%
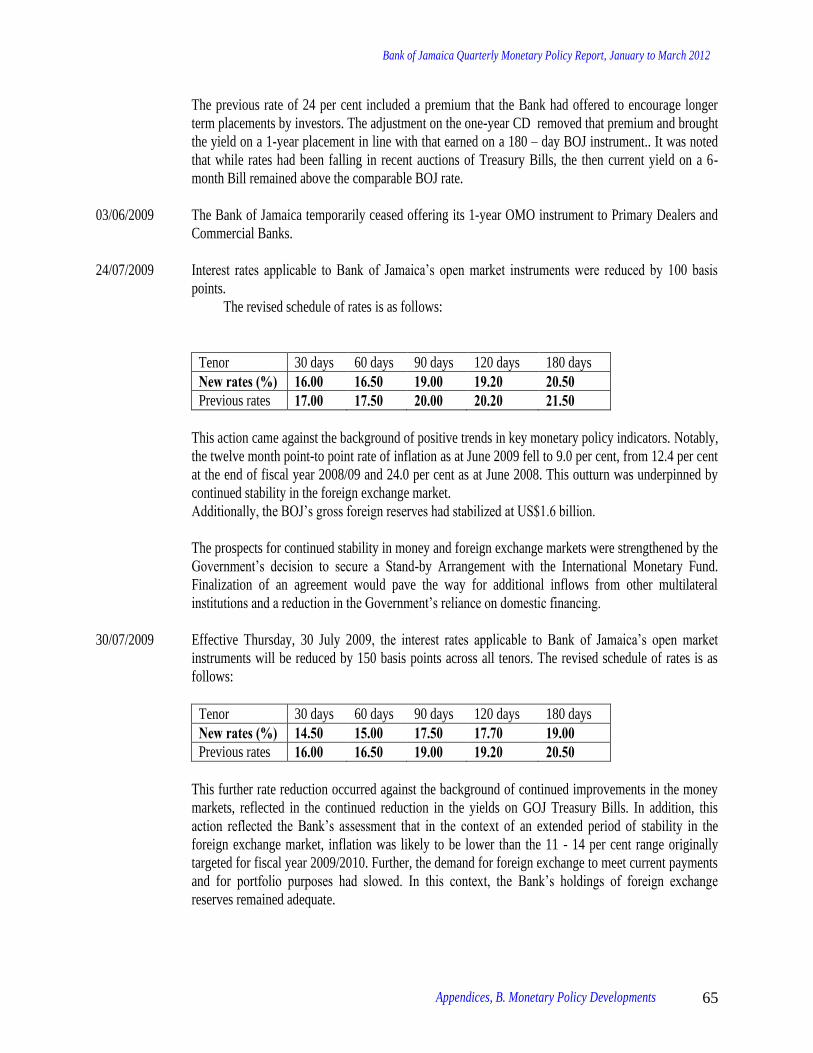
Bank of Jamaica Quarterly Monetary Policy Report, January to March 2012
Appendices, B. Monetary Policy Developments 65
The previous rate of 24 per cent included a premium that the Bank had offered to encourage longer
term placements by investors. The adjustment on the one-year CD removed that premium and brought
the yield on a 1-year placement in line with that earned on a 180 – day BOJ instrument.. It was noted
that while rates had been falling in recent auctions of Treasury Bills, the then current yield on a 6-
month Bill remained above the comparable BOJ rate.
03/06/2009 The Bank of Jamaica temporarily ceased offering its 1-year OMO instrument to Primary Dealers and
Commercial Banks.
24/07/2009 Interest rates applicable to Bank of Jamaica’s open market instruments were reduced by 100 basis
points.
The revised schedule of rates is as follows:
Tenor 30 days 60 days 90 days 120 days 180 days
New rates (%) 16.00 16.50 19.00 19.20 20.50 Previous rates 17.00 17.50 20.00 20.20 21.50
This action came against the background of positive trends in key monetary policy indicators. Notably,
the twelve month point-to point rate of inflation as at June 2009 fell to 9.0 per cent, from 12.4 per cent
at the end of fiscal year 2008/09 and 24.0 per cent as at June 2008. This outturn was underpinned by
continued stability in the foreign exchange market.
Additionally, the BOJ’s gross foreign reserves had stabilized at US$1.6 billion.
The prospects for continued stability in money and foreign exchange markets were strengthened by the
Government’s decision to secure a Stand-by Arrangement with the International Monetary Fund.
Finalization of an agreement would pave the way for additional inflows from other multilateral
institutions and a reduction in the Government’s reliance on domestic financing.
30/07/2009 Effective Thursday, 30 July 2009, the interest rates applicable to Bank of Jamaica’s open market
instruments will be reduced by 150 basis points across all tenors. The revised schedule of rates is as
follows:
Tenor 30 days 60 days 90 days 120 days 180 days
New rates (%) 14.50 15.00 17.50 17.70 19.00 Previous rates 16.00 16.50 19.00 19.20 20.50
This further rate reduction occurred against the background of continued improvements in the money
markets, reflected in the continued reduction in the yields on GOJ Treasury Bills. In addition, this
action reflected the Bank’s assessment that in the context of an extended period of stability in the
foreign exchange market, inflation was likely to be lower than the 11 - 14 per cent range originally
targeted for fiscal year 2009/2010. Further, the demand for foreign exchange to meet current payments
and for portfolio purposes had slowed. In this context, the Bank’s holdings of foreign exchange
reserves remained adequate.

Bank of Jamaica Quarterly Monetary Policy Report, January to March 2012
Appendices, B. Monetary Policy Developments 66
20/08/2009 Interest rates applicable to Bank of Jamaica’s open market instruments were reduced by 100
basis points. The revised schedule of rates is as follows:
Tenor 30 days 60 days 90 days 120 days 180 days
New rates (%) 13.50 14.00 16.50 16.70 18.00 Previous rates 14.50 15.00 17.50 17.70 19.00
This rate adjustment came against the background of a notable decline in inflation and continued
stability in the foreign currency market. The twelve month point-to point rate of inflation as at July
2009 declined further to 7.0 per cent, from 8.9 per cent in June 2009.
Inflation expectations, measured by regular surveys of the business sector, continued to fall as input
costs had also stabilized over the past six months. This trend was expected to continue and, in
conjunction with weak aggregate demand, should temper underlying inflation impulses.
17/09/2009 The rates offered on Certificates of Deposit issued by Bank of Jamaica were reduced by 100 basis
points. The six-month benchmark rate therefore moved from 18.00 per cent per annum to 17.00 per
cent. The full schedule of BOJ rates is set out below.
Tenor 30 days 60 days 90 days 120 days 180 days
New rates (%) 12.50 13.00 15.50 15.70 17.00 Previous rates 13.50 14.00 16.50 16.70 18.00
The adjustment to policy rates followed the better than expected inflation outturn for August 2009,
which showed a further drop in the 12-month point-to-point inflation to 6.1 per cent from the 7.0 per
cent reported for July. The stability of the exchange rate, the improvement in domestic agricultural
supplies, and the moderate growth in domestic money supply, all point to the likelihood of single-digit
inflation for fiscal year 2009/2010. The improved prospects for inflation and macroeconomic stability
were reflected in market rates, with the downward trend in Treasury Bill yields and other short term
rates. The easing of monetary policy was supported by the relatively strong position of the net
international reserves of the Bank of Jamaica which stood at US$1.95 billion.
18/12/2009 Interest rates applicable to Bank of Jamaica’s open market instruments were reduced by 200 basis
points. The benchmark six-month rate will therefore move from 17 per cent per annum to 15 per cent.
The full schedule of BOJ rates is set out below.
30 days 60 days 90 days 120 days 180 days New Rates (%)
10.50 11.00 13.50 13.70 15.00
Previous Rates (%) 12.50 13.00 15.50 15.70 17.00
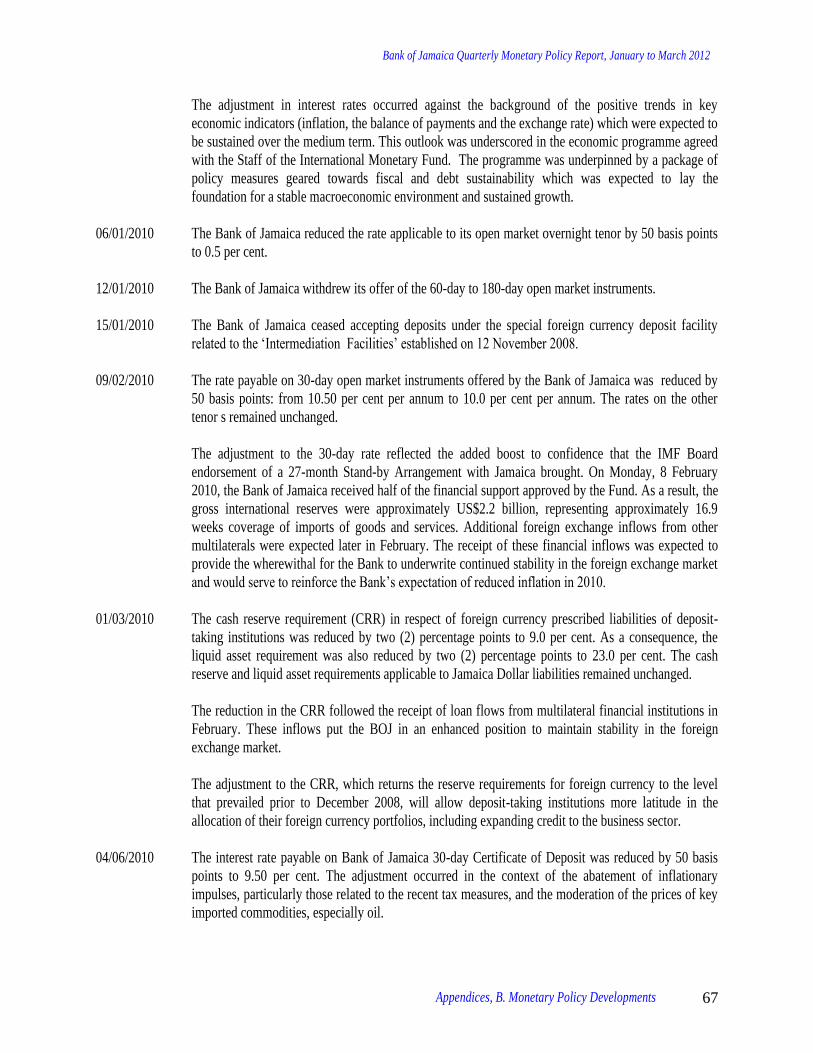
Bank of Jamaica Quarterly Monetary Policy Report, January to March 2012
Appendices, B. Monetary Policy Developments 67
The adjustment in interest rates occurred against the background of the positive trends in key
economic indicators (inflation, the balance of payments and the exchange rate) which were expected to
be sustained over the medium term. This outlook was underscored in the economic programme agreed
with the Staff of the International Monetary Fund. The programme was underpinned by a package of
policy measures geared towards fiscal and debt sustainability which was expected to lay the
foundation for a stable macroeconomic environment and sustained growth.
06/01/2010 The Bank of Jamaica reduced the rate applicable to its open market overnight tenor by 50 basis points
to 0.5 per cent.
12/01/2010 The Bank of Jamaica withdrew its offer of the 60-day to 180-day open market instruments.
15/01/2010 The Bank of Jamaica ceased accepting deposits under the special foreign currency deposit facility
related to the ‘Intermediation Facilities’ established on 12 November 2008.
09/02/2010 The rate payable on 30-day open market instruments offered by the Bank of Jamaica was reduced by
50 basis points: from 10.50 per cent per annum to 10.0 per cent per annum. The rates on the other
tenor s remained unchanged.
The adjustment to the 30-day rate reflected the added boost to confidence that the IMF Board
endorsement of a 27-month Stand-by Arrangement with Jamaica brought. On Monday, 8 February
2010, the Bank of Jamaica received half of the financial support approved by the Fund. As a result, the
gross international reserves were approximately US$2.2 billion, representing approximately 16.9
weeks coverage of imports of goods and services. Additional foreign exchange inflows from other
multilaterals were expected later in February. The receipt of these financial inflows was expected to
provide the wherewithal for the Bank to underwrite continued stability in the foreign exchange market
and would serve to reinforce the Bank’s expectation of reduced inflation in 2010.
01/03/2010 The cash reserve requirement (CRR) in respect of foreign currency prescribed liabilities of deposit-
taking institutions was reduced by two (2) percentage points to 9.0 per cent. As a consequence, the
liquid asset requirement was also reduced by two (2) percentage points to 23.0 per cent. The cash
reserve and liquid asset requirements applicable to Jamaica Dollar liabilities remained unchanged.
The reduction in the CRR followed the receipt of loan flows from multilateral financial institutions in
February. These inflows put the BOJ in an enhanced position to maintain stability in the foreign
exchange market.
The adjustment to the CRR, which returns the reserve requirements for foreign currency to the level
that prevailed prior to December 2008, will allow deposit-taking institutions more latitude in the
allocation of their foreign currency portfolios, including expanding credit to the business sector.
04/06/2010 The interest rate payable on Bank of Jamaica 30-day Certificate of Deposit was reduced by 50 basis
points to 9.50 per cent. The adjustment occurred in the context of the abatement of inflationary
impulses, particularly those related to the recent tax measures, and the moderation of the prices of key
imported commodities, especially oil.

Bank of Jamaica Quarterly Monetary Policy Report, January to March 2012
Appendices, B. Monetary Policy Developments 68
Secondary trading of securities as well as successive auctions of Treasury Bills indicated an
endorsement of the new interest rate norms by the market. Additionally, the entrenchment of the lower
interest rate structure was supported by the appreciation of the exchange rate and the reduction of
sovereign credit risk as reflected in falling yields on internationally traded GOJ bonds.
Despite the interruption to economic activity in the Kingston Metropolitan Area during the week of 24
May, the Bank’s assessment of the outlook for growth in FY2010/11 remained largely unchanged.
Some fall-out in tourism-related earnings was anticipated in the short run but the prospective
reopening of a major alumina processing plant in June 2010 and the maintenance of business activity
throughout most of Jamaica was expected to contribute to a modest recovery in GDP growth in the
current fiscal year.
The Bank believes that current reforms embedded in the Government’s economic programme will lead
to lasting improvements in public finances and debt management and the creation of a basis for longer
term financial stability.
17/06/2010 The rate payable on Bank of Jamaica 30-day Certificate of Deposit was reduced by 50 basis points to
9.00 per cent.
The adjustment in the rate followed a better-than-expected inflation outturn for the preceding month.
The fall in the general price level, together with the recent strengthening of the Jamaica Dollar,
reinforced the likelihood that inflation would tend toward the lower end-point of the target range of 7.5
per cent to 9.5 per cent for fiscal year 2010/2011. Furthermore, the Bank’s net international reserves
which stood at US$1.75 billion were expected to outperform the benchmark set under the current IMF
Stand-By Arrangement for end-June 2010. These resources constituted a strong buffer against
financial or weather-related shocks that might otherwise threaten the achievement of the
macroeconomic objectives.
01/07/2010 The Bank of Jamaica reduced the Jamaica Dollar cash reserve requirements of its supervised deposit-
taking institutions by two percentage points (2%) to twelve per cent (12%). The cash reserve
requirement applicable to foreign currency deposits which was reduced in March 2010 remains at
nine per cent (9%).
The reduction in the domestic currency cash reserve requirements also resulted in a two percentage
point (2%) contraction in the liquid assets requirements against Jamaica Dollar liabilities to twenty-six
per cent (26%). The liquid assets requirements against foreign currency liabilities remained at twenty-
three per cent (23%).
Reserve requirements were increased in 2008/09 as part of the Bank’s response to the deterioration in
financial market conditions triggered by the global economic downturn. The Bank observed that those
global market conditions were improving and domestic financial markets were stable.
The release of the cash reserves increased the pool of loanable funds by some J$4.5 billion and
allowed for a further easing in credit conditions.

Bank of Jamaica Quarterly Monetary Policy Report, January to March 2012
Appendices, B. Monetary Policy Developments 69
These adjustments formed part of a general easing of monetary policy that was consistent with the
improved outlook for inflation and the relatively weak demand conditions in the economy. The
projected path for inflation for fiscal year 2010/2011 continued to trend towards the lower end of the
target range of 7.5 per cent to 9.5 per cent.
04/08/2010 The Bank reduced the rate of interest payable on its 30-day Certificate of Deposit to 8.50 per cent from
9.00 per cent. The reduction in the Bank’s policy rate occurred against the background of the benign
outlook for inflation. Money supply and bank credit expanded slower than expected during the first
quarter of the fiscal year and kept domestic core or underlying inflation stable. Other contributing
factors to local price stability were the sluggish recovery in global demand for commodities and the
appreciation in the exchange rate since the start of the fiscal year.
Given the foregoing, the Bank expected that inflation outturn for FY2010/2011 would be toward the
lower end of the 7.5 per cent – 9.5 per cent target range. The Bank contended that the main risk to this
forecast was the disruption to supply that a hurricane or other severe weather conditions might cause.
26/08/2010 The Bank of Jamaica reduced its policy rate by a further 50 basis points to 8.0 per cent. This reduction
in its 30-day Certificate of Deposit was accompanied by a 0.25 basis point contraction to 0.25 per cent,
in the rate of interest payable on overnight placements of financial institutions held at the Bank.
The reduction in the policy rate was supported by the inflation outturn for July and the appreciation in
the Jamaica Dollar, both of which pointed to a more favourable outlook for domestic inflation for
FY2010/2011. Furthermore, net international reserves which stood at US$1.9 billion would possibly
outperform the benchmarks set under the current IMF Stand-By Arrangement. These resources
constituted a strong buffer against financial or weather related shocks that might otherwise threaten the
achievement of the macroeconomic targets.
15/11/2010 The interest rate payable on Bank of Jamaica 30-day Certificates of Deposit was reduced by 50 basis
points to 7.50 per cent.
This revision to the Bank’s policy rate reflected the continued decline in inflation towards the
programme projections for the fiscal year and beyond. Risks to a reversal in this trend were abating as
the hurricane season drew to a close while domestic demand conditions were weaker than earlier
anticipated. Core, or underlying, inflation was also declining steadily.
The progress made in implementing fiscal and financial sector reforms led to repeated observance of
performance benchmarks related to the economic programme for fiscal 201/2011. These successes
continued to be reflected in financial market prices generally and in money market interest rates in
particular. The change in the Bank’s policy rate endorsed the positive outlook for continued stability
and the relatively benign prospects for inflation over the forthcoming year.
01/02/2011 The interest rate payable on Bank of Jamaica 30-day Certificates of Deposit was reduced by 25 basis
points to 7.25 per cent. This reduction in the Bank’s policy rate was consistent with the expectation
that domestic inflation for FY2010/2011 would be within the programme projections of 7.5 to 9.5 per
cent. It was expected that, while there was an increase in commodity prices worldwide, the relative
weakness in domestic demand conditions and the extended stability in the exchange rate would
dampen the prospect of an upturn in inflation.
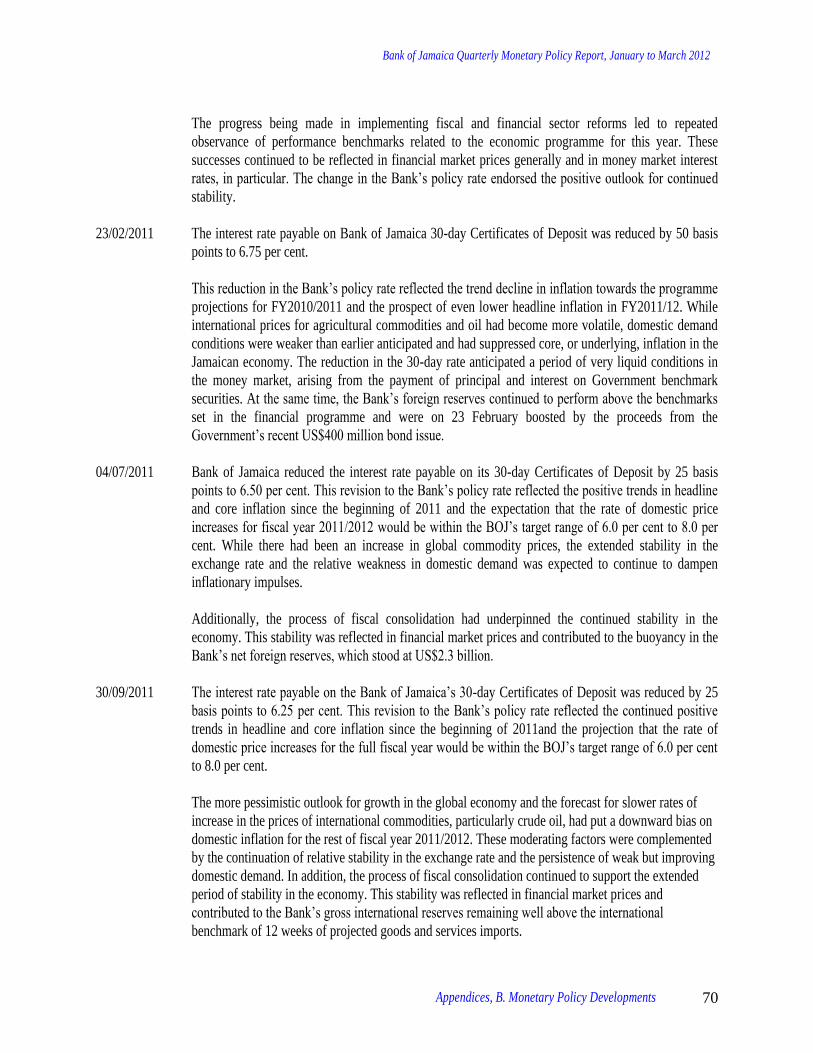
Bank of Jamaica Quarterly Monetary Policy Report, January to March 2012
Appendices, B. Monetary Policy Developments 70
The progress being made in implementing fiscal and financial sector reforms led to repeated
observance of performance benchmarks related to the economic programme for this year. These
successes continued to be reflected in financial market prices generally and in money market interest
rates, in particular. The change in the Bank’s policy rate endorsed the positive outlook for continued
stability.
23/02/2011 The interest rate payable on Bank of Jamaica 30-day Certificates of Deposit was reduced by 50 basis
points to 6.75 per cent.
This reduction in the Bank’s policy rate reflected the trend decline in inflation towards the programme
projections for FY2010/2011 and the prospect of even lower headline inflation in FY2011/12. While
international prices for agricultural commodities and oil had become more volatile, domestic demand
conditions were weaker than earlier anticipated and had suppressed core, or underlying, inflation in the
Jamaican economy. The reduction in the 30-day rate anticipated a period of very liquid conditions in
the money market, arising from the payment of principal and interest on Government benchmark
securities. At the same time, the Bank’s foreign reserves continued to perform above the benchmarks
set in the financial programme and were on 23 February boosted by the proceeds from the
Government’s recent US$400 million bond issue.
04/07/2011 Bank of Jamaica reduced the interest rate payable on its 30-day Certificates of Deposit by 25 basis
points to 6.50 per cent. This revision to the Bank’s policy rate reflected the positive trends in headline
and core inflation since the beginning of 2011 and the expectation that the rate of domestic price
increases for fiscal year 2011/2012 would be within the BOJ’s target range of 6.0 per cent to 8.0 per
cent. While there had been an increase in global commodity prices, the extended stability in the
exchange rate and the relative weakness in domestic demand was expected to continue to dampen
inflationary impulses.
Additionally, the process of fiscal consolidation had underpinned the continued stability in the
economy. This stability was reflected in financial market prices and contributed to the buoyancy in the
Bank’s net foreign reserves, which stood at US$2.3 billion.
30/09/2011 The interest rate payable on the Bank of Jamaica’s 30-day Certificates of Deposit was reduced by 25
basis points to 6.25 per cent. This revision to the Bank’s policy rate reflected the continued positive
trends in headline and core inflation since the beginning of 2011and the projection that the rate of
domestic price increases for the full fiscal year would be within the BOJ’s target range of 6.0 per cent
to 8.0 per cent.
The more pessimistic outlook for growth in the global economy and the forecast for slower rates of
increase in the prices of international commodities, particularly crude oil, had put a downward bias on
domestic inflation for the rest of fiscal year 2011/2012. These moderating factors were complemented
by the continuation of relative stability in the exchange rate and the persistence of weak but improving
domestic demand. In addition, the process of fiscal consolidation continued to support the extended
period of stability in the economy. This stability was reflected in financial market prices and
contributed to the Bank’s gross international reserves remaining well above the international
benchmark of 12 weeks of projected goods and services imports.

Bank of Jamaica Quarterly Monetary Policy Report, January to March 2012
Appendices, C. Summary Tables 71
…
LIST OF SUMMARY TABLES
Table Page
1 Inflation Rates 70 2A Component Contribution to Inflation 71 2B Regional Inflation 72 3 Bank of Jamaica Operating Targets 73 4 Monetary Aggregates 73 5 Components and Sources of Change in Local Currency Money Supply 74 6A Commercial Banks’ Selected Interest Rates 75 6B GOJ Treasury Bill Yields 76 7 Bank of Jamaica Open Market Interest Rates 77 8A Jamaica: Government Bond Market GOJ Domestic Market Maturities 78 8B Jamaica: Government Bond Market GOJ Domestic Market Issues 79
9 External Trade - Goods Exports (f.o.b.) 80 10 Balance of Payments Summary 81 11 Foreign Exchange Selling Rates 82 12 Bank of Jamaica: Net International Reserves 83 13 Jamaica Stock Exchange Activities 84 14 Public Sector Domestic Securities 85 15 Production of Selected Commodities 86 16A Quarterly GDP: Value Added by Industry (seasonally unadjusted) 87
16B Quarterly GDP: Value Added by Industry (seasonally adjusted) 87 D. Bank of Jamaica Balance Sheet 88
E. Commercial Banks’ Balance Sheet 89 F.1 International Indicators:- London Interbank Offer Rate – LIBOR 90 2 London Money Rates-Interbank Sterling 91 3 Prime Lending Rates 92
4A International Exchange Rate US$ vs Other Major Currencies 93 4B International Exchange Rates Exchange Cross Rates 93
4C International Exchange Rates Sterling vs Other Major Currencies 93 5A World Commodity Prices- Key Crude Oil Price 94 5B World Commodity Prices- Food 94 6 Major Stock Market Indices 94

Bank of Jamaica Quarterly Monetary Policy Report, January to March 2012
Appendices, C. Summary Tables 72
C. Summary Tables 1
INFLATION RATES (%)
CPI Index
(e.o.p) Head-line (Quarter)
Core (Trimmed-Mean) (Quarter)
2004/2005
June 76.8 1.9 1.1
September 79.0 2.9 2.3
December 84.1 6.4 2.6
March 85.3 1.5 0.7
2005/2006
June 90.0 5.5 2.1
September 93.8 4.2 1.2
December 94.6 0.9 0.6
March 94.9 0.2 0.9
2006/2007
June 97.6 2.9 1.3
September 99.9 2.4 1.4
December 100.0 0.1 0.2
March 102.5 2.5 1.9
2007/2008
June 105.1 2.5 1.3
September 108.9 3.6 1.9
December 116.8 7.3 4.0
March 122.9 5.2 3.5
2008/2009
June 130.3 6.0 3.4
September 136.5 4.7 2.0
December 136.5 0.0 1.1
March 138.2 1.3 1.1
2009/2010
June 142.0 2.7 1.3 September 146.3 3.1 1.5 December 150.4 2.8 1.4 March 156.6 4.1 1.8 2010/2011 June 160.7 2.6 1.1 September 162.8 1.3 0.8 December 168.1 3.3 1.6 March 168.9 0.5 0.5 2011/2012 June 172.3 2.0 1.1 September 175.9 2.1 1.1 December 178.2 1.3 1.0 March 181.2 1.7 1.0
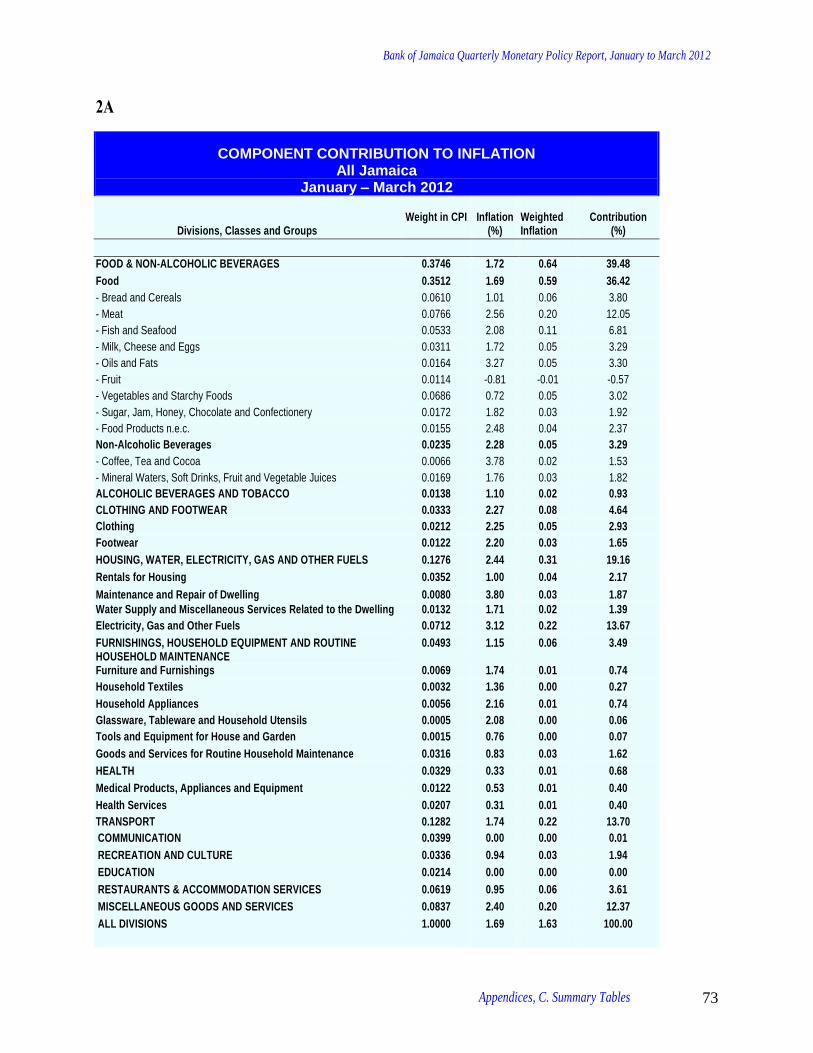
Bank of Jamaica Quarterly Monetary Policy Report, January to March 2012
Appendices, C. Summary Tables 73
2A
COMPONENT CONTRIBUTION TO INFLATION All Jamaica
January – March 2012
Divisions, Classes and Groups
Weight in CPI
Inflation
(%)
Weighted Inflation
Contribution
(%)
FOOD & NON-ALCOHOLIC BEVERAGES 0.3746 1.72 0.64 39.48
Food 0.3512 1.69 0.59 36.42
- Bread and Cereals 0.0610 1.01 0.06 3.80
- Meat 0.0766 2.56 0.20 12.05
- Fish and Seafood 0.0533 2.08 0.11 6.81
- Milk, Cheese and Eggs 0.0311 1.72 0.05 3.29
- Oils and Fats 0.0164 3.27 0.05 3.30
- Fruit 0.0114 -0.81 -0.01 -0.57
- Vegetables and Starchy Foods 0.0686 0.72 0.05 3.02
- Sugar, Jam, Honey, Chocolate and Confectionery 0.0172 1.82 0.03 1.92
- Food Products n.e.c. 0.0155 2.48 0.04 2.37
Non-Alcoholic Beverages 0.0235 2.28 0.05 3.29
- Coffee, Tea and Cocoa 0.0066 3.78 0.02 1.53
- Mineral Waters, Soft Drinks, Fruit and Vegetable Juices 0.0169 1.76 0.03 1.82
ALCOHOLIC BEVERAGES AND TOBACCO 0.0138 1.10 0.02 0.93
CLOTHING AND FOOTWEAR 0.0333 2.27 0.08 4.64
Clothing 0.0212 2.25 0.05 2.93
Footwear 0.0122 2.20 0.03 1.65
HOUSING, WATER, ELECTRICITY, GAS AND OTHER FUELS 0.1276 2.44 0.31 19.16
Rentals for Housing 0.0352 1.00 0.04 2.17
Maintenance and Repair of Dwelling 0.0080 3.80 0.03 1.87
Water Supply and Miscellaneous Services Related to the Dwelling 0.0132 1.71 0.02 1.39
Electricity, Gas and Other Fuels 0.0712 3.12 0.22 13.67
FURNISHINGS, HOUSEHOLD EQUIPMENT AND ROUTINE HOUSEHOLD MAINTENANCE
0.0493 1.15 0.06 3.49
Furniture and Furnishings 0.0069 1.74 0.01 0.74
Household Textiles 0.0032 1.36 0.00 0.27
Household Appliances 0.0056 2.16 0.01 0.74
Glassware, Tableware and Household Utensils 0.0005 2.08 0.00 0.06
Tools and Equipment for House and Garden 0.0015 0.76 0.00 0.07
Goods and Services for Routine Household Maintenance 0.0316 0.83 0.03 1.62
HEALTH 0.0329 0.33 0.01 0.68
Medical Products, Appliances and Equipment 0.0122 0.53 0.01 0.40
Health Services 0.0207 0.31 0.01 0.40
TRANSPORT 0.1282 1.74 0.22 13.70
COMMUNICATION 0.0399 0.00 0.00 0.01
RECREATION AND CULTURE 0.0336 0.94 0.03 1.94
EDUCATION 0.0214 0.00 0.00 0.00
RESTAURANTS & ACCOMMODATION SERVICES 0.0619 0.95 0.06 3.61
MISCELLANEOUS GOODS AND SERVICES 0.0837 2.40 0.20 12.37
ALL DIVISIONS 1.0000 1.69 1.63 100.00
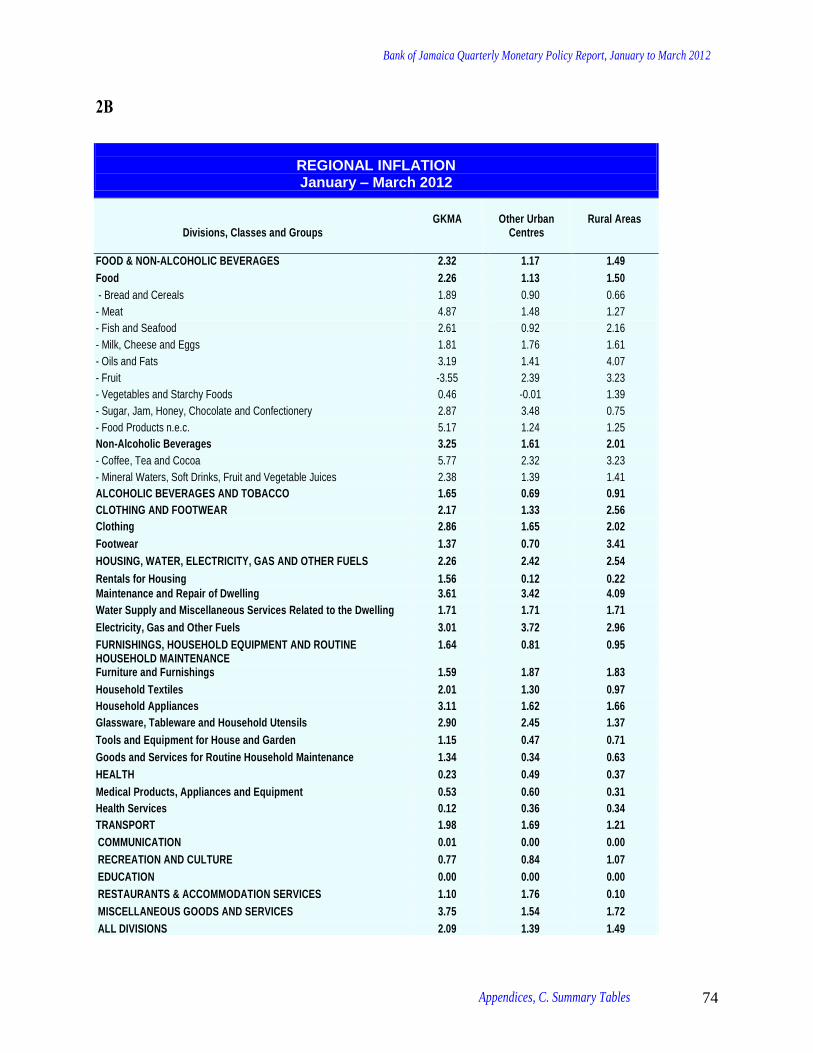
Bank of Jamaica Quarterly Monetary Policy Report, January to March 2012
Appendices, C. Summary Tables 74
2B
REGIONAL INFLATION January – March 2012
Divisions, Classes and Groups
GKMA
Other Urban
Centres
Rural Areas
FOOD & NON-ALCOHOLIC BEVERAGES 2.32 1.17 1.49
Food 2.26 1.13 1.50
- Bread and Cereals 1.89 0.90 0.66
- Meat 4.87 1.48 1.27
- Fish and Seafood 2.61 0.92 2.16
- Milk, Cheese and Eggs 1.81 1.76 1.61
- Oils and Fats 3.19 1.41 4.07
- Fruit -3.55 2.39 3.23
- Vegetables and Starchy Foods 0.46 -0.01 1.39
- Sugar, Jam, Honey, Chocolate and Confectionery 2.87 3.48 0.75
- Food Products n.e.c. 5.17 1.24 1.25
Non-Alcoholic Beverages 3.25 1.61 2.01
- Coffee, Tea and Cocoa 5.77 2.32 3.23
- Mineral Waters, Soft Drinks, Fruit and Vegetable Juices 2.38 1.39 1.41
ALCOHOLIC BEVERAGES AND TOBACCO 1.65 0.69 0.91
CLOTHING AND FOOTWEAR 2.17 1.33 2.56
Clothing 2.86 1.65 2.02
Footwear 1.37 0.70 3.41
HOUSING, WATER, ELECTRICITY, GAS AND OTHER FUELS 2.26 2.42 2.54
Rentals for Housing 1.56 0.12 0.22
Maintenance and Repair of Dwelling 3.61 3.42 4.09
Water Supply and Miscellaneous Services Related to the Dwelling 1.71 1.71 1.71
Electricity, Gas and Other Fuels 3.01 3.72 2.96
FURNISHINGS, HOUSEHOLD EQUIPMENT AND ROUTINE HOUSEHOLD MAINTENANCE
1.64 0.81 0.95
Furniture and Furnishings 1.59 1.87 1.83
Household Textiles 2.01 1.30 0.97
Household Appliances 3.11 1.62 1.66
Glassware, Tableware and Household Utensils 2.90 2.45 1.37
Tools and Equipment for House and Garden 1.15 0.47 0.71
Goods and Services for Routine Household Maintenance 1.34 0.34 0.63
HEALTH 0.23 0.49 0.37
Medical Products, Appliances and Equipment 0.53 0.60 0.31
Health Services 0.12 0.36 0.34
TRANSPORT 1.98 1.69 1.21
COMMUNICATION 0.01 0.00 0.00
RECREATION AND CULTURE 0.77 0.84 1.07
EDUCATION 0.00 0.00 0.00
RESTAURANTS & ACCOMMODATION SERVICES 1.10 1.76 0.10
MISCELLANEOUS GOODS AND SERVICES 3.75 1.54 1.72
ALL DIVISIONS 2.09 1.39 1.49

Bank of Jamaica Quarterly Monetary Policy Report, January to March 2012
Appendices, C. Summary Tables 75
3
4
BANK OF JAMAICA OPERATING TARGETS
Sep-10
Dec-10
Mar-11
Jun-11
Sep-11
Dec-11
Mar-12
Net International Reserves (US$MN) 1 973.7 2 171.41 2 553.2 2 267.1 2 087.6 1 966.1 1,777.1
Net International Reserves ($JMN) 176 347.4 194 015.5 228 124.8 202 567.5 185 898.9 175 671.9 158 786.6
- Assets 249 257.0 266 188.8 306 888.7 282 055.4 263 507.4 252 004.5 235 788.4
- Liabilities -72 909.6 -72 173.4 -78 763.8 -79 487.9 -77 608.5 -76 332.6 -77 001.8 Net Domestic Assets -102 116.5 -108 922.5 -149 205.7 - 122 007.0 - 105 419.5 -83 961.8 -75 089.9
-Net Claims on the Public Sector 115 712.7 101 374.0 75 721.2 94 900.4 97 214.7 96 540.4 118 844.8 - Net Credit to Banks -14 289.5 -13 844.2 -13 934.0 -14 053..5 -13 886.9 -14 167.6 -15 188.5 - Open Market Operations -136 206.2 -129 180.1 -143 694.0 -135 415.3 -121 500.5 -98 899.8 -111 572.0
- Other -67 333.5 -67 272.2 -67 298.9 -67 438.6 -67 246.9 -67 434.9 -67 174.2 Monetary Base 74 230.9 85 093.0 78 919.2 80 560.5 80 479.4 91 710.1 83 696.7
- Currency Issue * 47 295.8 56 710.7 50 310.4 50 886.8 50 892.7 62 646.7 53 778.1 - Cash Reserve 26 660.0 27 713.5 27 494.5 28 913.6 29 374.5 28 822.7 29 847.4 - Current Account 275.1 668.8 1 114.3 760.1 212.2 240.7 194.2 % Change Monetary Base (F-Y-T-D) -4.0 10.0 2.1 2.1 2.0 16.2 6.1
* Excludes BOJ’s teller cash; p: preliminary
MONETARY AGGREGATES (End-of-Period)
(J$MN)
M1J M1* M2J M2* M3J M3*
2008/2009 June 82 507.0 89 946.4 197 782.9 291 010.2 265 442.6 358 669.8 September 83 536.5 90 900.7 199 542.5 292 918.6 268 505.6 361 867.2 December 91 017.9 100 097.1 210 962.0 313 194.9 279 396.0 381 628.9 March
85 515.2 96 779.2 202 838.0 317 676.1 275 187.2 390 025.3
2009/2010
June
88 256.7
98 380.5
206 295.9
319 337.5
282 473.0
395 514.7
September 87 911.6 97 379.0 206 828.6 316 834.7 287 586.8 397 593.0
December 97 733.4 107 958.9 216 803.4 332 151.2 301 336.5 416 684.3 March 89 918.9 101 450.8 210 444.8 327 227.5 295 316.8 412 099.6 2010/2011 June 93 074.2 102 810.4 218 702.2 331 549.5 306 741.3 419 588.6 September 95 445.0 104 817.7 221 386.8 328 598.3 311 289.0 418 502.4 December 103 252.1 112 234.4 230 232.1 337 664.4 321 728.8 429 161.1 March 97 448.7 106 887.0 225 682.0 332 828.2 319 837.1 426 983.3 2010/2011 June 102 219.9 111 089.4 232 910.8 341 652.1 329 909.5 438 650.9 September December
97 967.0 112 757.2
105 551.6 120 569.9
227 561.9 245 020.0
332 330.1 351 418.5
325 013.2 355 367.8
429 781.5 461 766.3
March 103 826.7 112 954.1 236 177.3 349 882.9 348 302.0 462 007.6
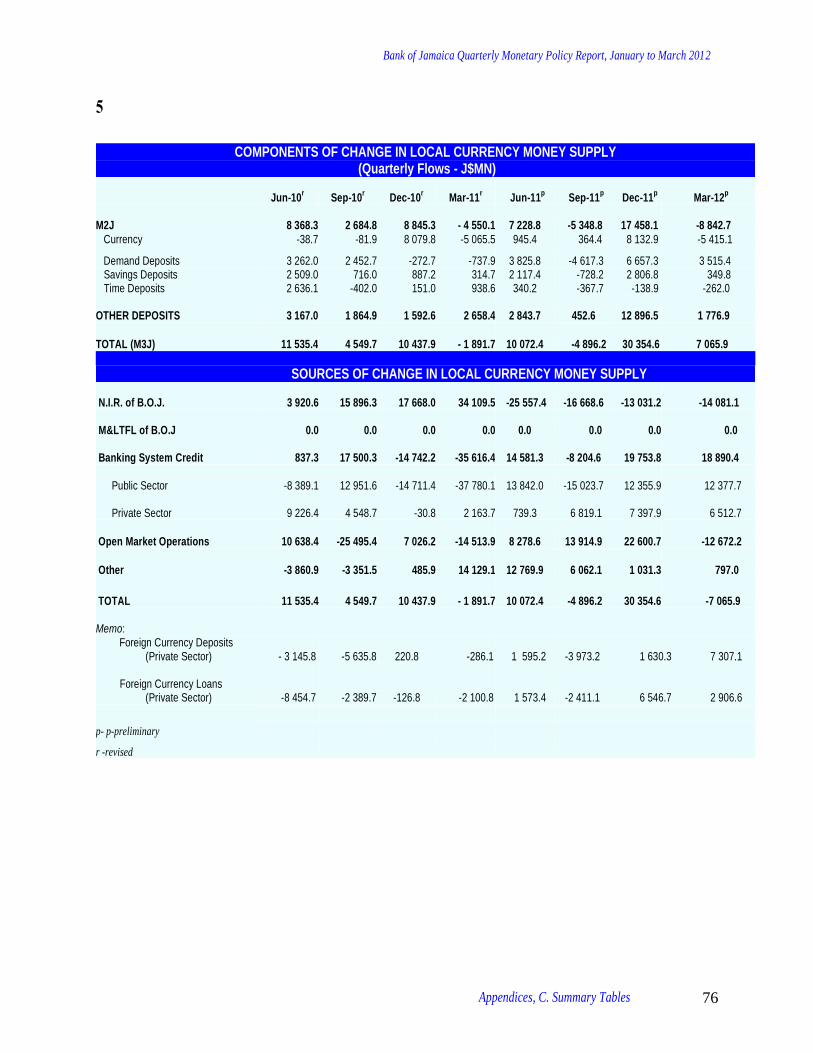
Bank of Jamaica Quarterly Monetary Policy Report, January to March 2012
Appendices, C. Summary Tables 76
5
COMPONENTS OF CHANGE IN LOCAL CURRENCY MONEY SUPPLY (Quarterly Flows - J$MN)
Jun-10r Sep-10
r Dec-10
r
Mar-11
r Jun-11
p Sep-11
p Dec-11
p Mar-12
p
M2J 8 368.3
2 684.8 8 845.3 - 4 550.1 7 228.8 -5 348.8
17 458.1 -8 842.7
Currency -38.7 -81.9 8 079.8 -5 065.5 945.4 364.4 8 132.9 -5 415.1
Demand Deposits 3 262.0 2 452.7 -272.7 -737.9 3 825.8 -4 617.3 6 657.3 3 515.4 Savings Deposits 2 509.0 716.0 887.2 314.7 2 117.4 -728.2 2 806.8 349.8 Time Deposits 2 636.1 -402.0 151.0 938.6 340.2 -367.7 -138.9 -262.0
OTHER DEPOSITS 3 167.0 1 864.9 1 592.6 2 658.4 2 843.7
452.6 12 896.5 1 776.9
TOTAL (M3J) 11 535.4 4 549.7 10 437.9 - 1 891.7 10 072.4
-4 896.2 30 354.6 7 065.9
SOURCES OF CHANGE IN LOCAL CURRENCY MONEY SUPPLY
N.I.R. of B.O.J. 3 920.6 15 896.3 17 668.0 34 109.5 -25 557.4
-16 668.6
-13 031.2 -14 081.1
M<FL of B.O.J 0.0 0.0 0.0 0.0 0.0 0.0
0.0 0.0
Banking System Credit 837.3 17 500.3 -14 742.2 -35 616.4 14 581.3
-8 204.6
19 753.8 18 890.4
Public Sector -8 389.1 12 951.6 -14 711.4 -37 780.1 13 842.0
-15 023.7
12 355.9 12 377.7
Private Sector 9 226.4 4 548.7 -30.8 2 163.7 739.3
6 819.1
7 397.9 6 512.7
Open Market Operations 10 638.4 -25 495.4 7 026.2 -14 513.9 8 278.6
13 914.9
22 600.7 -12 672.2
Other -3 860.9 -3 351.5 485.9 14 129.1 12 769.9
6 062.1
1 031.3 797.0
TOTAL 11 535.4 4 549.7 10 437.9 - 1 891.7 10 072.4
-4 896.2
30 354.6 -7 065.9
Memo:
Foreign Currency Deposits (Private Sector) - 3 145.8 -5 635.8
220.8 -286.1 1 595.2 -3 973.2 1 630.3 7 307.1
Foreign Currency Loans (Private Sector) -8 454.7 -2 389.7
-126.8 -2 100.8 1 573.4 -2 411.1 6 546.7 2 906.6
p- p-preliminary
r -revised
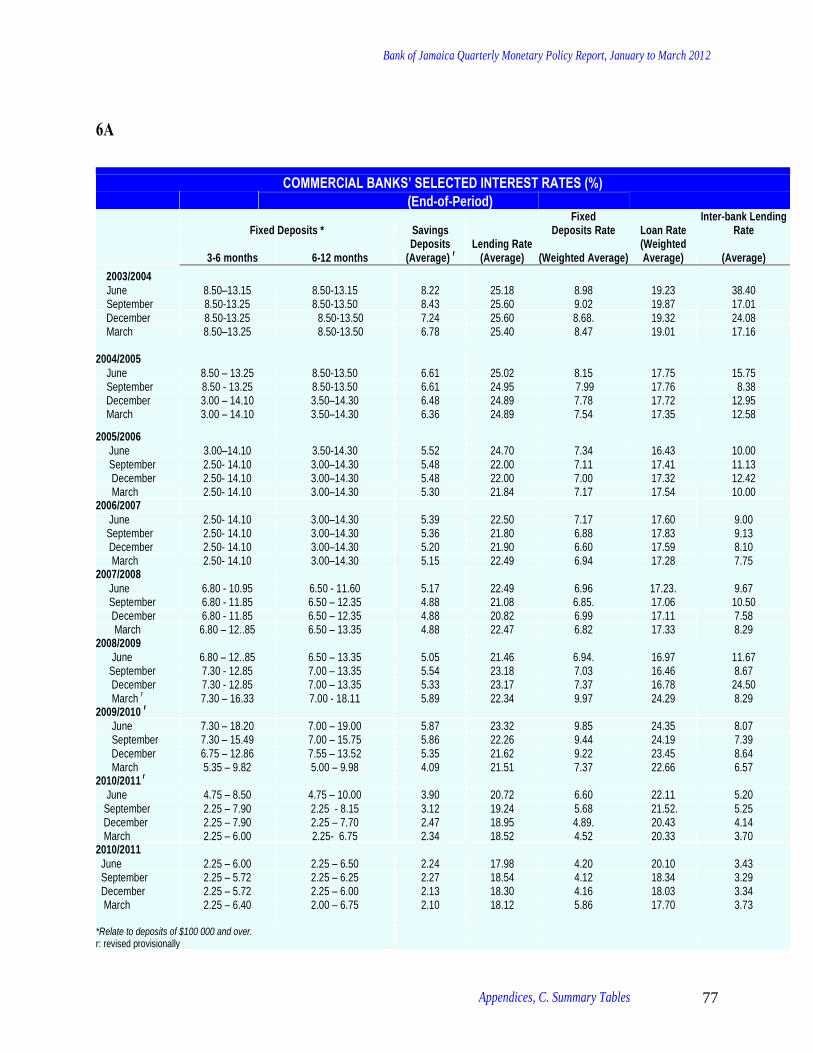
Bank of Jamaica Quarterly Monetary Policy Report, January to March 2012
Appendices, C. Summary Tables 77
6A
COMMERCIAL BANKS’ SELECTED INTEREST RATES (%)
(End-of-Period)
Fixed Deposits * Savings Deposits
(Average) r
Lending Rate (Average)
Fixed Deposits Rate Loan Rate
Inter-bank Lending Rate
3-6 months 6-12 months (Weighted Average) (Weighted Average) (Average)
2003/2004 June 8.50–13.15 8.50-13.15 8.22 25.18 8.98 19.23 38.40 September 8.50-13.25 8.50-13.50 8.43 25.60 9.02 19.87 17.01 December 8.50-13.25 8.50-13.50 7.24 25.60 8.68. 19.32 24.08 March 8.50–13.25 8.50-13.50 6.78 25.40 8.47 19.01 17.16 2004/2005 June 8.50 – 13.25 8.50-13.50 6.61 25.02 8.15 17.75 15.75 September 8.50 - 13.25 8.50-13.50 6.61 24.95 7.99 17.76 8.38 December 3.00 – 14.10 3.50–14.30 6.48 24.89 7.78 17.72 12.95 March 3.00 – 14.10 3.50–14.30 6.36 24.89 7.54 17.35 12.58
2005/2006 June 3.00–14.10 3.50-14.30 5.52 24.70 7.34 16.43 10.00 September 2.50- 14.10 3.00–14.30 5.48 22.00 7.11 17.41 11.13 December 2.50- 14.10 3.00–14.30 5.48 22.00 7.00 17.32 12.42 March 2.50- 14.10 3.00–14.30 5.30 21.84 7.17 17.54 10.00 2006/2007 June 2.50- 14.10 3.00–14.30 5.39 22.50 7.17 17.60 9.00 September 2.50- 14.10 3.00–14.30 5.36 21.80 6.88 17.83 9.13 December 2.50- 14.10 3.00–14.30 5.20 21.90 6.60 17.59 8.10 March 2.50- 14.10 3.00–14.30 5.15 22.49 6.94 17.28 7.75 2007/2008 June 6.80 - 10.95 6.50 - 11.60 5.17 22.49 6.96 17.23. 9.67 September 6.80 - 11.85 6.50 – 12.35 4.88 21.08 6.85. 17.06 10.50 December 6.80 - 11.85 6.50 – 12.35 4.88 20.82 6.99 17.11 7.58 March 6.80 – 12..85 6.50 – 13.35 4.88 22.47 6.82 17.33 8.29 2008/2009 June 6.80 – 12..85 6.50 – 13.35 5.05 21.46 6.94. 16.97 11.67 September 7.30 - 12.85 7.00 – 13.35 5.54 23.18 7.03 16.46 8.67 December 7.30 - 12.85 7.00 – 13.35 5.33 23.17 7.37 16.78 24.50 March
r 7.30 – 16.33 7.00 - 18.11 5.89 22.34 9.97 24.29 8.29
2009/2010 r
June 7.30 – 18.20 7.00 – 19.00 5.87 23.32 9.85 24.35 8.07 September 7.30 – 15.49 7.00 – 15.75 5.86 22.26 9.44 24.19 7.39 December 6.75 – 12.86 7.55 – 13.52 5.35 21.62 9.22 23.45 8.64 March 5.35 – 9.82 5.00 – 9.98 4.09 21.51 7.37 22.66 6.57 2010/2011
r
June 4.75 – 8.50 4.75 – 10.00 3.90 20.72 6.60 22.11 5.20 September 2.25 – 7.90 2.25 - 8.15 3.12 19.24 5.68 21.52. 5.25 December 2.25 – 7.90 2.25 – 7.70 2.47 18.95 4.89. 20.43 4.14 March 2.25 – 6.00 2.25- 6.75 2.34 18.52 4.52 20.33 3.70 2010/2011
June 2.25 – 6.00 2.25 – 6.50 2.24 17.98 4.20 20.10 3.43 September December March
2.25 – 5.72 2.25 – 5.72 2.25 – 6.40
2.25 – 6.25 2.25 – 6.00 2.00 – 6.75
2.27 2.13 2.10
18.54 18.30 18.12
4.12 4.16 5.86
18.34 18.03 17.70
3.29 3.34 3.73
*Relate to deposits of $100 000 and over. r: revised provisionally

Bank of Jamaica Quarterly Monetary Policy Report, January to March 2012
Appendices, C. Summary Tables 78
6B
GOJ TREASURY BILL YIELDS (End of Period)
1-month 3-month 6-month 9-month 12-month
2002/2003 June 13.81 14.77 September 16.69 16.98 December 17.01 March 33.47 2003/04 June 28.46 September 23.42 23.87 December 22.05 March 15.23 15.57 2004/05 June 15.04 14.98 15.18 September 14.41 14.80 16.36 December 14.41 14.94 March 13.21 13.46 14.00 2005/2006 June 12.85 12.88 September 12.96 13.15 December 13.34 13.55 March 13.16 13.18 2006/2007 June 12.64 12.82 September 12.44 12.49 December 12.26 12.31 March 11.55 11.65 2007/2008 June 11.98 12.13 September 14.34 14.29 December 12.89 13.34 March 13.97 14.22 2008/2009 June 14.19 14.43 September 14.81 15.35 December 22.01 24.45 March 20.51 21.77 2009/2010 June 19.58 21.05 September 16.39 17.35 December 15.95 16.80 March 10.18 10.49 2010/2011 June 8.98 8.52 9.26 September 8.26 7.75 7.99 December 7.48 7.40 7.48 March 6.67 6.46 6.63 2011/2012 June 6.67 6.56 6.61 September December March
6.47 6.45 6.24
6.37 6.21 6.27
6.56 6.46 6.47

Bank of Jamaica Quarterly Monetary Policy Report, January to March 2012
Appendices, C. Summary Tables 79
7
Note: Bank of Jamaica ceased accepting placements for 270-day tenors on 18 April 2006.
BANK OF JAMAICA OPEN MARKET INTEREST RATES
(End of Period)
Tenor of Instruments
End Period
30 days
60 days
90 days
120 days
180 days
270 days
365 days
2003/2004
June 15.00 15.30 20.00 24.00 26.50 29.50 30.00 September 15.00 15.30 18.00 21.00 23.50 23.75 24.00 December 15.00 15.30 17.00 20.00 21.00 22.00 23.00 March 14.85 15.00 15.10 15.50 16.00 16.95 17.95
2004/2005
June 14.20 14.30 14.40 14.55 15.05 15.65 16.40 September 14.00 14.10 14.20 14.35 14.80 15.35 16.00 December 13.80 13.95 14.05 14.15 14.30 15.00 15.50 March 12.95 13.10 13.20 13.30 13.45 14.00 14.50
2005/2006
June 12.60 12.70 12.75 12.85 13.00 13.25 13.60 September 12.60 12.70 12.75 12.85 13.00 13.25 13.60 December 12.60 12.70 12.75 12.85 13.00 13.25 13.60 March 12.60 12.70 12.75 12.85 13.00 13.25 13.60
2006/2007
June* 12.45 12.50 12.60 12.65 12.80 … … September 11.95 12.00 12.10 12.15 12.30 … … December 11.65 11.70 11.80 11.85 12.00 … … March 11.65 11.70 11.80 11.85 12.00 … …
2007/2008
June 11.65 11.70 11.80 11.85 12.00 … … September 11.65 11.70 11.80 11.85 12.00 … 14.00 December 11.65 11.70 11.80 11.85 12.00 … 13.46 March 13.50 13.70 13.90 14.00 14.20 … 15.00
2008/2009
June 14.00 14.20 14.40 14.50 14.70 … 15.50 September 14.00 14.20 14.40 14.50 14.70 … 15.50 December 17.00 17.50 20.00 20.20 21.50 … 24.00 March 17.00 17.50 20.00 20.20 21.50 … 24.00
2009/2010
June 17.00 17.50 20.00 20.20 21.50 … 22.67 September 12.50 13.00 15.50 15.70 17.00 … …
December 10.50 11.00 13.50 13.70 15.00 … …
March 10.00 … … … … … … 2010/2011
June 9.00 … … … … … …
September 8.00 … … … … … …
December 7.50
March 6.75 … … … … … … 2010/2011 June
6.75
…
…
…
…
…
…
September December March
6.25 6.25 6.25

Bank of Jamaica Quarterly Monetary Policy Report, January to March 2012
Appendices, C. Summary Tables 80
8A
JAMAICA: GOVERNMENT BOND MARKET GOJ Maturities
January – March 2012
Applicable Interest Rate
b/
Maturity Date
Amount J$M
24 February FR BMI Note 2012 32 987.97 12.00
Notes: a/ Rate above Treasury is the relevant Treasury bill rate in effect at the beginning of the interest period. b/ The withholding tax of 25% on interest income has been in effect since May 1, 2000. c/ FR – Fixed Rate d VR-Variable Rate N.I.B. Non interest bearing Source: Debt Management Unit, Ministry of Finance & The Public Service

Bank of Jamaica Quarterly Monetary Policy Report, January to March 2012
Appendices, C. Summary Tables 81
8B
JAMAICA: GOVERNMENT BOND MARKET
GOJ Domestic Market Issues
January – March 2012
Amount raised
J$M Issue Date Stock Name Features
18 January VR BMI Note 2013A(re-opened) First issued 03 August 2011. Tenor of one year and seven months. Fixed at 7.22% for the first three months, thereafter interest will be paid quarterly at a variable rate of 1.00 percentage points above the “Benchmark Rate”. First interest payment will become due and payable on 05 February 2012.
2 357.98
18 January VR BMI Note 2020 (re-opened) First issued 24 February 2010. Tenor of seven years and eleven months. Fixed at 7.72% for the first three months, thereafter interest will be paid quarterly at a variable rate of 1.50 percentage point above the “Benchmark Rate”. First interest payment will become due and payable on 24 February 2012.
2 854.95
18 January FR 12.0% BMI Note 2014 (re-opened) First issued 14 May 2010. Tenor of two years and four months. First interest payment will become due and payable on 14 May 2012. Thereafter, interest will become due and payable semi-annually, until maturity. .
54.21
8 February VR BMI Note 2017 (re-opened) First issued 24 February 2010. Tenor of five years. Fixed at 7.595% for the first three months, thereafter interest will be paid quarterly at a variable rate of 1.375 percentage points above the “Benchmark Rate”. First interest payment will become due and payable on 24 February 2012.
4 101.26
23 February VR BMI Note 2020A Tenor of eight years and six months. Fixed at 6.57% for the first six months, thereafter interest will be paid semi-annually at a variable rate of 1.375 percentage points above the “Benchmark Rate”. First interest payment will become due and payable on 24 August 2012.
11 186.77
24 February FR 7.2% BMI Note 2015 Tenor of three years. First interest payment will become due and payable on 24 August 2012. Thereafter, interest will become due and payable semi-annually, until maturity.
4 000.00
27 March FR 13.25% BMI Note 2040 (re-opened) First issued 24 February 2010. Tenor of twenty-seven years and eleven months. First interest payment will become due and payable on 24 August 2012. Thereafter, interest will become due and payable semi-annually, until maturity.
739.78
Notes:
a/ Rate above Treasury is the relevant Treasury bill rate in effect at the beginning of the interest period.
b/ The withholding tax of 25% on interest income has been in effect since May 1, 2000.
c/ FR – Fixed Rate
d VR-Variable Rate
N.I.B. Non-interest bearing
Source: Debt Management Unit, Ministry of Finance & The Public Service

Bank of Jamaica Quarterly Monetary Policy Report, January to March 2012
Appendices, C. Summary Tables 82
9
EXTERNAL TRADE – GOODS EXPORTS (f.o.b) (Flows - US$MN)
Bauxite Alumina Sugar Bananas
Other Non- Other Total
Traditional Traditional Goods
Exports
2006/2007 115.2 1 083.7 90.4 13.3 79.1 631.5 188.5 2 201.7
June
29.4
258.8
43.0
3.2
25.0
144.8
46.0 550.2
September 29.4 268.7 2.6 3.8 20.1 166.0 44.2 534.8
December 27.0 265.2 0.0 3.4 14.8 161.4
47.2 519.0 March 29.4 291.0 44.8 2.9 19.2 159.3 51.1 597.7 2007/2008
r 112.7 1 213.7 104.9 6.4 83.8 797.1 225.3 2 543.9
June 28.5
315.3
42.4
4.5
21.8
173.3
47.6 633.4
September
28.3
267.7
13.1
1.9
22.6
155.7
54.5 543.8
December 26.7 320.0 0.0 0.0 21.2 162.3 57.6 587.8
Marchr 29.2 310.7 49.4 0.0 18.2 305.8 65.6 778.9
2008/2009
r 105.5 1 039.3 92.6 0.0 82.6 727.5 267.2 2 314.7
June 29.6 366.9 43.0 0.0 24.9 251.6 80.4 796.4 September 28.8 304.1 11.8 0.0 25.6 253.4 77.8 701.5
December
26.9
248.8
0.0
0.0
11.9
128.8
50.8 467.2
March 20.2 119.5 37.8 0.0 20.2 93.7
58.2 349.6 2009/2010 95.7 334.5 57.8 0.0 90.8 578.8 248.6 1 406.2
June 14.4 81.6 26.7 0.0 26.7 153.3 55.9 358.6 September 23.9 84.5 7.8 0.0 26.0 168.8 60.3 371.3 December
r 26.9 82.4 0.0 0.0 17.5 114.7 66.7 308.2
March 30.5 86.0 23.3 0.0 20.6 142.0 65.7 368.1
2010/2011 133.1 441.7 47.9 0.0 76.6 442.2 267.5 1 409.0
June 31.6 83.6 13.3 0.0 22.4 109.5 59.4 319.8
September r 37.0 87.1 7.7 0.0 22.4 110.7 64.6 329.5
Decemberr 29.6 146.0 0.0 0.0 13.5 101.0 63.7 353.8
March r 34.9 130.0 26.9 0.0 18.3 127.0 81.5 418.6
2010/2011 June September December
1112J
33.5 38.7 34.8
163.2 141.8 145.8
28.9 28.9
6.4
0.0 0.0 0.0
22.7 19.9 14.6
137.3 117.2 110.8
76.3 60.9 62.3
461.9 407.4 374.7
r-revised; p-preliminary

Bank of Jamaica Quarterly Monetary Policy Report, January to March 2012
Appendices, C. Summary Tables 83
10
r: revised
p: provisional
BALANCE OF PAYMENTS QUARTERLY SUMMARY (US$MN)
Jun-10r Sep-10r Dec-10r Mar-11r Jun-11r Sep-11r Dec-11r 1. Current Account -229.2 -254.2 -418.3 -330.5 -483.9 -540.0 -714.5 A. Goods Balance -804.6 -798.2 -963.0 -971.5 -980.4 -1 115.6 -1 193.4 Exports (f.o.b.) 319.8 329.5 350.6 418.6 461.9 407.4 374.7 Imports (f.o.b.) 1 124.4 1 127.7 1 313.6 1 390.1 1 442.4 1 523.0 1 568.0 B. Services Balance 194.7 163.5 141.4 291.9 187.0 120.1 98.7
Transportation -105.9 -111.1 -131.3 -108.7 -126.4 -156.6 -162.2 Travel 436.7 410.1 410.6 561.7 455.1 415.1 401.4 Other Services -136.1 -135.5 -138.0 -161.1 -141.7 -138.4 -140.4 Goods & Services Balance -609.9 -634.6 -821.6 -679.7 -793.4 -64.0 -1 095.6
C. Income -129.2 -109.6 -137.7 -146.8 -197.6 -64.0 -139.9 Compensation of Employees 9.0 30.2 46.3 3.0 4.8 14.8 26.1 Investment Income -138.2 -139.8 -184.0 -149.7 -202.4 -78.9 -165.9 D. Current Transfers 510.0 490.0 541.0 496.0 507.1 519.5 520.0 General Government 59.4 44.2 62.3 35.3 28.0 32.6 25.4 Other Sectors 450.6 445.8 478.7 460.7 479.1 486.9 494.6 2. Capital & Financial Account 229.2 254.2 418.3 330.5 483.9 540.0 714.5
A. Capital Account -7.0 -6.1 -5.9 -2.6 -1.6 4.4 2.4
Capital Transfers -7.0 -6.1 -5.9 -2.6 -1.6 4.4 2.4 General Government 0.0 0.2 0.0 4.6 5.4 10.7 8.3 Other Sectors -7.0 -6.3 -5.9 -7.2 -7.0 -6.3 -5.9 Acq./disp. Of non-produced non-fin. Assets 0.0 0.0 0.0 0.0 0.0 0.0 0.0
B. Financial Account 236.2 260.3 424.1 714.8 485.5 535.6 712.1
Official Investment 60.1 199.4 237.5 474.8 -346.5 177.8 146.6 Private Investment (including net errors & omissions)
219.9 238.8 384.4 240.0 545.9 171.2 451.1
Reserves -43.8 -177.9 -197.7 -381.8 286.1 186.5 114.5

Bank of Jamaica Quarterly Monetary Policy Report, January to March 2012
Appendices, C. Summary Tables 84
11
FOREIGN EXCHANGE SELLING RATES
(J$ per unit of foreign currency-end of period)
US$ Can$ GB£ 2004/2005 September 61.89 49.05 111.62 December 61.63 50.66 117.92 March 61.54 50.61 115.35 2005/2006 June
61.84 50.52 110.52 September 62.89 53.61 110.02 December 64.58 54.95 110.40 March 65.50 56.14 112.94 2006/2007 June 66.03 59.50 120.19 September 66.06 59.10 123.48 December 67.15 57.53 131.53 March 67.80 58.75 132.40 2007/2008 June 68.58 64.81 136.60 September 70.41 70.38 142.28 December 70.62 71.39 140.32 March 71.09 69.75 141.15 2008/2009 June 71.89 71.49 142.55 September 72.68 69.49 130.35 December 80.47 65.54 116.84 March 88.82 71.97 129.02 2009/2010 June 89.07 76.84 148.08 September 89.08 82.76 142.16 December 89.60 84.57 143.55 March 89.51 88.06 135.07 2010/2011 June 86.02 82.26 128.58 September 86.25 83.84 135.87 December 85.86 85.34 133.74 March 85.75 88.14 137.28 2011/2012 June 85.91 88.61 137.77 September December March
86.30 86.60
87.30
83.31 84.20 87.65
134.69 134.44 139.28

Bank of Jamaica Quarterly Monetary Policy Report, January to March 2012
Appendices, C. Summary Tables 85
12
BANK OF JAMAICA: NET INTERNATIONAL RESERVES
(End-of-Period)
Gross Foreign
Assets (US$MN)
Gross
Foreign Liabilities (US$MN)
International Reserves
(Net) (US$MN)
Weeks of Imports
Goods Goods & Services
2003/2004
September 1216.6 34.0 1182.6 19.0 12.8
December 1 196.3 31.4 1 164.9 18.3 12.5
March 1 596.9 28.2 1 568.7 25.0 16.6
2004/2005
June 1630.3 26.2 1604.1 22.5 15.3
September 1 640.7 24.2 1 616.5 23.5 16.0
December 1 881.9 23.4 1 858.5 27.5 18.7
March 1 924.1 22.5 1901.6 27.5 18.8
2005/2006
June 2 179.3 22.5 2 156.8 28.1 19.5
September 2 243.0 124.0 2 119.0 27.0 19.1
December 2 169.0 81.6 2 087.4 27.0 19.0
March 2 372.9 294.8 2 078.1 28.3 20.1
2006/2007
June 2 293.2 183.2 2 110.0 22.9 16.7
September 2 474.7 132.7 2 342.0 26.1 18.8
December 2 399.1 81.6 2 317.5 25.2 18.2
March 2 613.6 284.3 2 329.3 27.1 19.5
2007/2008
June 2 472.3 233.4 2 238.9 24.5 17.7
September 1 943.2 27.0 1 916.2 18.2 13.2
December 1 905.8 28.1 1 877.7 16.8 12.3
March 2 105.9 22.5 2 083.4 18.0 13.3
2008/2009
June 2 476.8 248.0 2 228.8 21.2 15.6
September 2 280.5 29.4 2 251.1 18.0 13.3
December 1 795.4 22.5 1 772.9 14.8 10.9
March 1 663.4 34.8 1 628.6 12.2 9.2
2009/2010
June 1 660.6 41.2 1 619.4 18.5 13.1
September 2 007.2 74.0 1 933.2 22.1 15.6 December 1 758.9 22.5 1 736.4 19.2 13.5 March 2 414.4 662.5 1 751.9 26.5 18.6
2010/2011
June 2 526.7 730.9 1 795.8 25.4 18.6
September 2 789.7 816.0 1 973.7 29.6 21.5
December 2 979.2 807.8 2 171.4 31.9 23.2
March
2011/2012 June
September
December
March
3 434.7
3 156.7
2 949.2
2 820.4
2 638.9
881.5
889.6
868.6
854.3
861.8
2 553.2
2 267.1
2 080.6
1 966.1
1 777.1
37.2
28.5
27.8
25.5
23.5
26.7
21.4
20.7
19.2
17.8
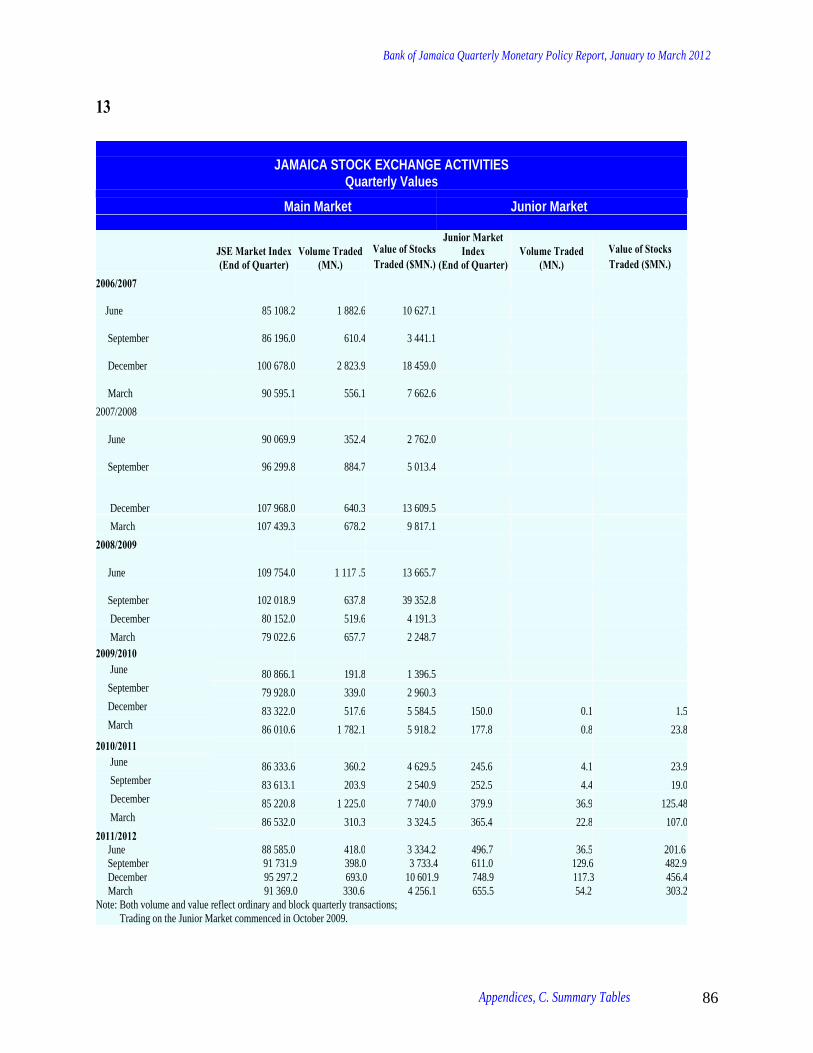
Bank of Jamaica Quarterly Monetary Policy Report, January to March 2012
Appendices, C. Summary Tables 86
13
JAMAICA STOCK EXCHANGE ACTIVITIES
Quarterly Values
Main Market Junior Market
JSE Market Index (End of Quarter)
Volume Traded (MN.)
Value of Stocks Traded ($MN.)
Junior Market Index
(End of Quarter) Volume Traded
(MN.) Value of Stocks Traded ($MN.)
2006/2007
June 85 108.2
1 882.6
10 627.1
September 86 196.0
610.4
3 441.1
December 100 678.0
2 823.9
18 459.0
March 90 595.1
556.1
7 662.6
2007/2008
June 90 069.9
352.4
2 762.0
September 96 299.8
884.7
5 013.4
December 107 968.0
640.3
13 609.5
March 107 439.3 678.2 9 817.1
2008/2009
June 109 754.0
1 117 .5
13 665.7
September 102 018.9
637.8
39 352.8
December 80 152.0 519.6 4 191.3
March 79 022.6 657.7 2 248.7
2009/2010
June 80 866.1 191.8 1 396.5
September 79 928.0 339.0 2 960.3
December 83 322.0 517.6 5 584.5 150.0 0.1 1.5
March 86 010.6 1 782.1 5 918.2 177.8 0.8 23.8
2010/2011
June 86 333.6 360.2 4 629.5 245.6 4.1 23.9
September 83 613.1 203.9 2 540.9 252.5 4.4 19.0
December 85 220.8 1 225.0 7 740.0 379.9 36.9 125.48
March 86 532.0 310.3 3 324.5 365.4 22.8 107.0
2011/2012 June 88 585.0 418.0 3 334.2
496.7 36.5 201.6
September 91 731.9 398.0 3 733.4 611.0 129.6 482.9
December 95 297.2 693.0 10 601.9 748.9 117.3 456.4
March 91 369.0 330.6 4 256.1 655.5 54.2 303.2
Note: Both volume and value reflect ordinary and block quarterly transactions;
Trading on the Junior Market commenced in October 2009.

Bank of Jamaica Quarterly Monetary Policy Report, January to March 2012
Appendices, C. Summary Tables 87
14
PUBLIC SECTOR DOMESTIC SECURITIES Outstanding Stocks
(J$MN)
End Period
Local Registered Stocks Treasury Bills
Bonds
GOJ Benchmark
Notes
BOJ Open Market Operations
Securities
2003/2004
September 232 914.5 2 400.0
160 594.3
83 700.3 December 228 509.3 4 400.0 178 308.3 81 969.4 March 220 819.2 3 750.0 184 219.0 108 281.7 March 240 923.0 2 950.0 114 524.1 86 203.8 2004/2005
June 222 372.2 3 950.0
187 932.0
123 222.1 September 222 522.4 3 750.0 197 847.6. 127 629.3 December 220 290.5 3 750.0 210 300.0. 130 692.1 March 218 412.6 4 050.0 214 565.6 143 854.8 2005/2006
June 220 529.2 4 050.0
231 749.8
167 485.1 September 220 059.0 3 800.0 244 195.7 168 108.2 December 225 762.8 3 500.0 240 934.0 149 806.5 March 235 632.7 3 800.0 233 643.7 157 357.6 2006/2007
June 236 668.6 4 200.0
249 662.1
159 438.0 September 231 237.9 4 600.0 285 901.2 166 018.9 December 229 978.3 4 700.0 294 773.2 154 757.0 March 226 631.1 4 200.0 276 155.1 165 704.0 20007/2008 June 232 363.8 4 200.0 297 276.0 150 758.3 September 226 746.9 4 200.0 315 256.5 129 771.5 December 224 228.4 4700.0 324 929.2 114 741.3 March 223 581.6 4 200.0 330 008.5 138 179.1 2008/2009 June 218 100.0 4 200.0 344 170.3 150 835.7 September 213 495.2 4 300.0 357 755.7 146 219.8 December 205 120.1 4 194.5 392 220.6 131 928.8 March 201 936.1 4 094.5 438 381.6 119 337.6 2009/2010 June 196 457.9 3 955.7 469 957.3 120 774.3 September 185 922.4 4 066.9 525 540.7 118 502.6 December 180 573.5 3 813.4 564 076.7 112 011.3 March 168.1 4 000.0 53 869.1. 695 389.9 121 349.2 2010/2011 June 0.0 4 400.0 33 068.2 731 602.4 110 710.8 September 0.0 4 400.0 31 547.2 750 423.9 136 206.2 December 0.0 4 000.0 31 116.4 760 285.9 129 180.1 March 0.0 4 000.0 29 981.8 769 759.3 143 694.0 2011/2012 June September December March
0.0 0.0 0.0 0.0
4 000.0 4 000.0 4 000.0 4 000.0
29 645.0 28 497.1 28 182.5 64 400.3
792 017.9 831 394.5 846 266.4 839 483.3
135 415.3 121 500.5 98 899.8 111 572.0

Bank of Jamaica Quarterly Monetary Policy Report, January to March 2012
Appendices, C. Summary Tables 88
15
PRODUCTION OF SELECTED COMMODITIES
( Quarterly Flows- ‘000 tonnes)
Crude Bauxite* Alumina Total Bauxite** Sugar
Bananas***
2004/2005 3 451.4 4 028.5 13 411.9 142.0 18.1
December 398.5 1 062.6 3 030.0 3.6 0.0
March 1 074.6 1 052.8 3 620.1 74.7 0.0
2005/2006 4 099.7 4 048.7 14 167.4 151.0 18.8
June 916.0 1 061.8 3 508.3 51.6 4.5
September 1 022.3 1 013.7 3 544.5 0.0 3.6
December 1 035.9 957.4 3 442.6 5.4 3.5
March 1 125.5 1 015.8 3 672.0 94.0 7.2
2006/2007 4 594.3 4 105.2 14 905.5 144.0 30.5
June 1 136.3 1 053.4 3 779.2 46.3 6.9
September 1 186.5 1 003.9 3 724.6 0.0 9.4
December 1 099.7 1 026.5 3 675.2 2.3 8.4
March 1 171.8 1 021.4 3 726.5 95.4 5.8
2007/2008 4 386.2 3 897.8 14 523.0 156.9 11.7
June 1 089.7 1 044.3 3 775.3 59.7 8.1
September 1 123.1 908.9 3 489.6 6.9 3.6
December 1 033.3 966.4 3 597.2 9.4 0.0
March 1 140.1 978.2 3 660.9 80.9 0.0
2008/2009 3 916.7 3 856.3 13 614.4 139.4 0.0
June 1 020.4 1 153..9 3 794.4 54.8 0.0
September 1 115.0 980.5 3 6 18.7 4.2 0.0
December 1 043.0 1 011.8 3 622.5 0.2 0.0
March 738.3 710.1 2 575.2 80.2 0.0 2009/2010 3 465.3 1 513.5 7 347.5 133.9 0.0
June 546.2 471.0 1 698.6 42.9 0.0 September 883.6 337.8 1 765.4 2.4 0.0 December 1 032.2 353.9 1 968.0 4.9 0.0 March 1 003.3 350.8 1 915.5 83.7 0.0
2010/2011 4 630.0 1 738.3 9 226.3 123.1 0.0 June 1 109.4 332.9 2 047.8 30.9 0.0 September 1 220.2 447.0 2 367.3 2.5 0.0 December 985.8 460.7 2 208.9 4.1 0.0 March 1 314.6 497.7 2 602.3 85.6 0.0 2011/2012 June 1 240.5
476.5 2 438.5 47.9 0.0
September
December
March
1 346.8 1 228.5 1 154.7
482.9 490.4 476.5
2 580.4 2 549.4 2 392.2
2.0 7.7
92.0
0.0 0.0 0.0
* Crude Bauxite = Bauxite mined for export **Total Bauxite Exports = Crude bauxite + bauxite converted to alumina ***Banana Exports

Bank of Jamaica Quarterly Monetary Policy Report, January to March 2012
Appendices, C. Summary Tables 89
16A
Source: Statistical Institute of Jamaica 16B
Source: Statistical Institute of Jamaica
Dec-09 Mar-10 Jun-10 Sep-10 Dec-10 Mar-11 Jun-11 Sep-11 Dec-11
Total Value Added at Basic Prices -2.4 -1.6 -2.5 -1.1 -0.6 1.6 2.2 0.7 1.6
Agriculture, Forestry & Fishing 19.4 5.6 -6.0 3.7 -4.7 13.7 10.7 2.9 15.0
Mining & Quarrying -57.5 -42.1 1.4 30.3 22.4 37.5 33.3 7.7 8.0
Manufacturing -1.0 -0.4 -2.4 -5.3 -3.5 -0.5 -0.4 2.1 4.7
Food, Beverages & Tobacco -2.6 -2.5 -0.9 1.4 0.6 1.6 5.7 2.4 0.5
Other Manufacturing 0.6 2.2 -4.2 -12.2 -7.4 -2.9 -8.1 1.6 9.0
Construction & Installation -4.1 -1.0 -2.2 -1.3 0.3 -0.2 1.4 1.4 0.1
Electricity & Water 2.5 -1.2 -2.5 -5.8 -7.6 1.6 0.3 1.1 3.5
Wholesale & Retail Trade; Repairs; Installation Of Machinery -2.3 -3.6 -4.1 -3.7 -2.2 0.0 0.0 0.1 0.7
Hotels and Restaurants 2.3 6.7 -1.0 2.4 5.5 4.3 2.4 0.0 0.8
Transport, Storage & Communication 1.9 2.2 -3.2 -3.9 -2.9 -1.1 3.3 -2.0 -1.6
Finance & Insurance Services 0.3 -5.9 -6.0 -5.1 -2.5 -3.0 -0.1 -1.1 -0.7
Real Estate & Business Services -1.3 -1.1 -0.9 -1.2 -1.6 0.0 0.7 0.8 0.5
Government Services -2.0 0.4 -0.9 -0.4 1.5 -0.4 0.3 0.5 -0.5
Other Services -1.1 -1.7 -2.6 -1.1 -0.7 0.6 0.7 -0.8 -0.3
Less Financial Intermediation Services Indirectly Measured (FISIM) 1.1 -9.0 -11.3 -15.1 -14.2 -5.2 -4.1 -5.4 -3.6
(Percentage Change (% ) Over the Corresponding Quarter of Previous Year)
VALUE ADDED BY INDUSTRY AT CONSTANT (2007) PRICES (% CHANGE)
December 2009 - December 2011 (Seasonally Unadjusted)
Dec-09 Mar-10 Jun-10 Sep-10 Dec-10 Mar-11 Jun-11 Sep-11 Dec-11
Total Value Added at Basic Prices -1.6 -1.1 -0.4 2.0 -1.1 1.0 0.2 0.5 0.0
Agriculture, Forestry & Fishing 1.4 -5.8 -4.9 13.3 -5.6 12.3 -7.4 4.4 6.0
Mining & Quarrying 6.5 -1.0 -1.4 25.3 0.0 11.2 -4.4 1.3 0.4
Manufacturing -1.4 -3.3 -1.7 1.2 -0.1 -0.1 -1.6 3.9 2.9
Food, Beverages & Tobacco -1.7 -2.5 -0.8 6.2 -2.3 -1.0 3.3 2.3 -4.2
Other Manufacturing -1.1 -4.2 -2.6 -4.4 2.6 1.0 -7.2 6.0 11.6
Construction & Installation -2.1 -4.0 0.2 -0.3 -3.7 5.5 -1.1 0.5 -1.2
Electricity & Water -1.8 1.6 -1.2 0.3 0.1 0.3 0.7 0.2 -0.9
Wholesale & Retail Trade; Repairs; Installation Of Machinery -0.4 -2.2 -0.8 -0.2 1.1 -0.1 -0.7 -0.2 1.8
Hotels and Restaurants 2.6 8.3 -3.8 -3.8 5.6 6.2 -4.7 -6.2 6.3
Transport, Storage & Communication -1.1 0.7 -2.5 -1.2 -0.1 3.1 1.6 -6.4 0.3
Finance & Insurance Services -1.4 -3.0 -0.5 -0.1 0.3 -2.2 1.7 -1.1 0.6
Real Estate & Business Services -1.4 -0.5 0.0 0.6 -1.7 1.2 0.7 0.7 -2.0
Government Services -9.1 -2.6 6.3 5.9 -7.4 -4.4 7.1 6.1 -8.3
Other Services -0.8 -0.5 -0.4 0.6 -0.4 0.7 -0.2 -1.0 0.3
Less Financial Intermediation Services Indirectly Measured (FISIM) -4.5 -5.3 -2.2 -4.1 -3.4 4.6 -1.0 -5.3 -1.6
December 2009 - December 2011 (Seasonally Adjusted)(Percentage Change (% ) Over the Preceding Quarter)
VALUE ADDED BY INDUSTRY AT CONSTANT (2007) PRICES (% CHANGE)
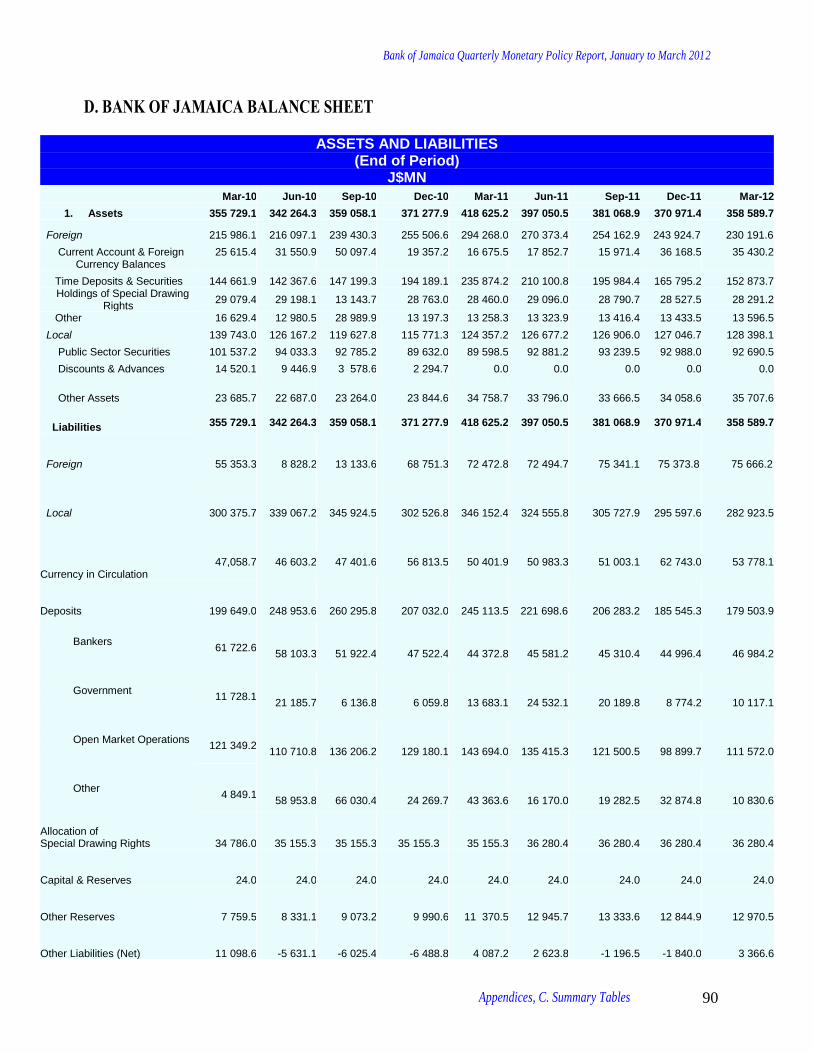
Bank of Jamaica Quarterly Monetary Policy Report, January to March 2012
Appendices, C. Summary Tables 90
D. BANK OF JAMAICA BALANCE SHEET
ASSETS AND LIABILITIES (End of Period)
J$MN
Mar-10 Jun-10 Sep-10 Dec-10 Mar-11 Jun-11 Sep-11 Dec-11 Mar-12
1. Assets 355 729.1 342 264.3 359 058.1 371 277.9 418 625.2 397 050.5 381 068.9 370 971.4 358 589.7
Foreign 215 986.1 216 097.1 239 430.3 255 506.6 294 268.0 270 373.4 254 162.9 243 924.7 230 191.6
Current Account & Foreign 25 615.4 31 550.9 50 097.4 19 357.2 16 675.5 17 852.7 15 971.4 36 168.5 35 430.2 Currency Balances
Time Deposits & Securities 144 661.9 142 367.6 147 199.3 194 189.1 235 874.2 210 100.8 195 984.4 165 795.2 152 873.7 Holdings of Special Drawing
Rights 29 079.4 29 198.1 13 143.7 28 763.0 28 460.0 29 096.0 28 790.7 28 527.5 28 291.2
Other 16 629.4 12 980.5 28 989.9 13 197.3 13 258.3 13 323.9 13 416.4 13 433.5 13 596.5
Local 139 743.0 126 167.2 119 627.8 115 771.3 124 357.2 126 677.2 126 906.0 127 046.7 128 398.1
Public Sector Securities 101 537.2 94 033.3 92 785.2 89 632.0 89 598.5 92 881.2 93 239.5 92 988.0 92 690.5
Discounts & Advances 14 520.1 9 446.9 3 578.6 2 294.7 0.0 0.0 0.0 0.0 0.0
Other Assets 23 685.7 22 687.0 23 264.0 23 844.6 34 758.7 33 796.0 33 666.5 34 058.6 35 707.6
Liabilities
355 729.1
342 264.3
359 058.1
371 277.9
418 625.2
397 050.5
381 068.9
370 971.4
358 589.7
Foreign
55 353.3
8 828.2
13 133.6
68 751.3
72 472.8
72 494.7
75 341.1
75 373.8
75 666.2
Local
300 375.7
339 067.2
345 924.5
302 526.8
346 152.4
324 555.8
305 727.9
295 597.6
282 923.5
Currency in Circulation
47,058.7
46 603.2
47 401.6
56 813.5
50 401.9
50 983.3
51 003.1
62 743.0
53 778.1
Deposits
199 649.0
248 953.6
260 295.8
207 032.0
245 113.5
221 698.6
206 283.2
185 545.3
179 503.9
Bankers
61 722.6
58 103.3
51 922.4
47 522.4
44 372.8
45 581.2
45 310.4
44 996.4
46 984.2
Government
11 728.1
21 185.7
6 136.8
6 059.8
13 683.1
24 532.1
20 189.8
8 774.2
10 117.1
Open Market Operations
121 349.2
110 710.8
136 206.2
129 180.1
143 694.0
135 415.3
121 500.5
98 899.7
111 572.0
Other
4 849.1
58 953.8
66 030.4
24 269.7
43 363.6
16 170.0
19 282.5
32 874.8
10 830.6
Allocation of Special Drawing Rights
34 786.0
35 155.3
35 155.3
35 155.3
35 155.3
36 280.4
36 280.4
36 280.4
36 280.4
Capital & Reserves
24.0
24.0
24.0
24.0
24.0
24.0
24.0
24.0
24.0
Other Reserves
7 759.5
8 331.1
9 073.2
9 990.6
11 370.5
12 945.7
13 333.6
12 844.9
12 970.5
Other Liabilities (Net)
11 098.6
-5 631.1
-6 025.4
-6 488.8
4 087.2
2 623.8
-1 196.5
-1 840.0
3 366.6

Bank of Jamaica Quarterly Monetary Policy Report, January to March 2012
Appendices, C. Summary Tables 91
E. COMMERCIAL BANKS’ BALANCE SHEET
ASSETS AND LIABILITIES (End-of -period)
J$MN
Mar-10
Jun-10
Sep-10
Dec-10
Mar-11
Jun-11
Sep-11
Dec-11
Mar-12
p
Assets
591 766.5
575 364.0
579 474.8
585 820.2
587 133.9
581 913.6
581 727.8
608 392.2
624 244.5 Cash 6 447.5 6 044.8 6 898.9 8 234.0 6 899.2 6 530.2 6 171.7 9 792.9 6 216.4 Balances with BOJ 90 568.3 88 926.4 92 596.2 97 328.7 107 811.5 99 324.4 93 457.6 81 915.2 94 140.1 Foreign Assets 129 647.7 121 103.3 116 867.6 115 612.9 114 393.2 105 771.3 111 954.7 115 335.1 113 782.9 Loans & Advances 256 993.7 249 855.6 252 195.0 251 361.0 248 924.3 253 372.9 253 683.1 266 044.2 277 204.9 Private Sector 219 459.4 218 683.5 220 947.9 221 222.3 221 238.4 223 545.6 228 897.2 243 206.9 251 915.9 Public Sector 37 534.3 31 172.1 31 247.1 30 138.7 27 685.9 29 827.3 24 785.9 22 837.3 25 289.0 Public Sector Securities 62 028.3 65 798.5 67 581.2 69 400.0 64 174.9 69 850.0 69 667.4 82 529.7 79 374.5
Cheques in the Process of Collection
4 671.2
4 836.3
3 123.9
3 340.6
2 015.1
3 244.1
2 887.6
2 476.1
2 779.5 Other Assets 41 409.8 38 799.1 40 212.0 40 543.0 42 915.7 43 820.7 43 905.7 50 298.9 50 746.2 Liabilities 591 766.5 575364.0 579 474.8 585 820.2 587 133.9 581 913.5 581 727.8 608 392.2 624 244.5 Deposits
Local Currency Foreign Currency
378 413.5 219 801.2 158 612.3
373 667.1 224 310.8 149 356.3
372 891.6 226 608.6 146 283.0
379 094.1 237 205.0 141 889.1
382 636.7 237 956.0 144 680.7
383 679.1 238 574.4 145 104.7
387 584.8 239 026.6 148 558.2
400 120.1 237 205.0 141 889.1
409 844.6 251 981.8 157 862.8
Foreign Liabilities
77 845.8
65 985.8
64 469.3
62 870.4
56 148.3
56 464.8
53 882.0
54 771.1 54 016.4
Discounts & Advances from BOJ 506.6 494.9 327.5 457.4 518.8 479.1 618.7 603.5 778 .7
Loans/Advances from Other Institutions
11 425.0
11 250.1
10 724.5
10 727.2
10 556.8
8 726.8
7 230.4
6 244.2
5 826.3
Cheques in the Process of Payment
5 292.7
4 198.5
3 441.6
3 082.5
4 995.5
3 546.5
3 583.9
3 044.8
3 065.3 Other Liabilities 118 282.9 119 767.6 127 620.3 129 588.6 132 277.8 129 017.5 128 828.0 143 608.5 150 713.2 P - preliminary
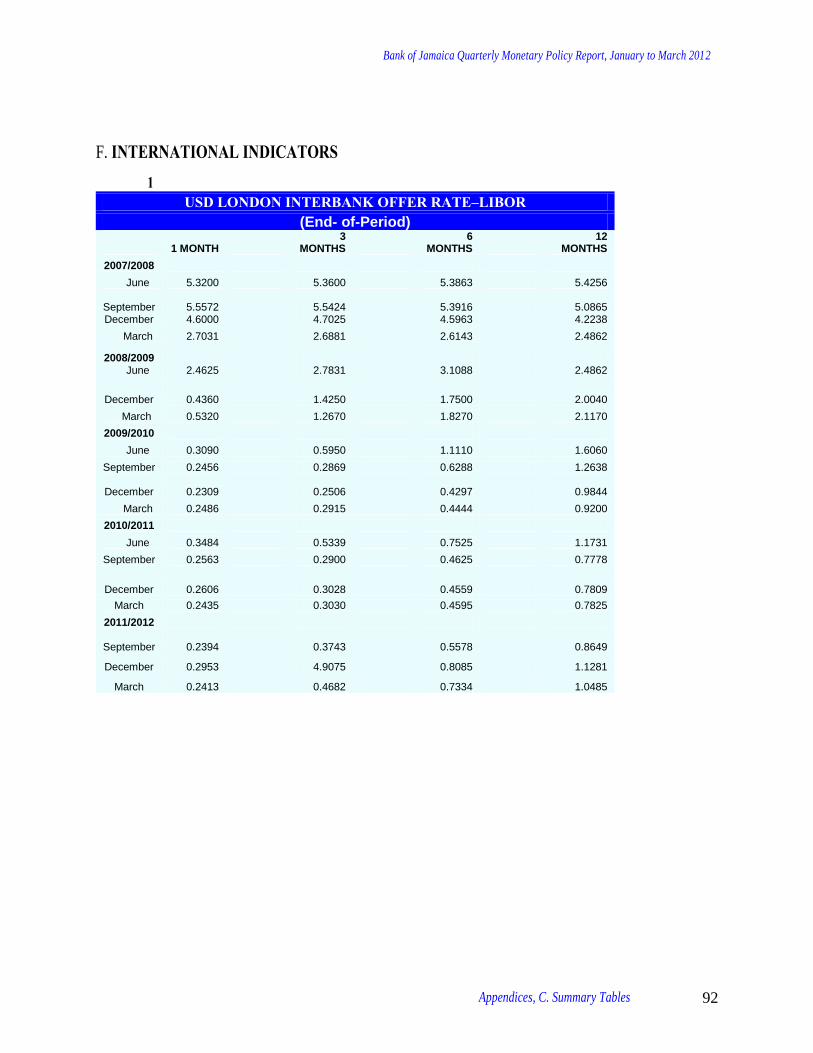
Bank of Jamaica Quarterly Monetary Policy Report, January to March 2012
Appendices, C. Summary Tables 92
F. INTERNATIONAL INDICATORS
1 USD LONDON INTERBANK OFFER RATE–LIBOR
(End- of-Period)
1 MONTH 3
MONTHS 6
MONTHS 12
MONTHS
2007/2008
June 5.3200 5.3600 5.3863 5.4256
September 5.5572 5.5424 5.3916 5.0865 December 4.6000 4.7025 4.5963 4.2238
March 2.7031 2.6881 2.6143 2.4862
2008/2009 June 2.4625 2.7831 3.1088 2.4862
December 0.4360 1.4250 1.7500 2.0040
March 0.5320 1.2670 1.8270 2.1170
2009/2010
June 0.3090 0.5950 1.1110 1.6060
September 0.2456 0.2869 0.6288 1.2638
December 0.2309 0.2506 0.4297 0.9844
March 0.2486 0.2915 0.4444 0.9200
2010/2011
June 0.3484 0.5339 0.7525 1.1731
September 0.2563 0.2900 0.4625 0.7778
December 0.2606 0.3028 0.4559 0.7809
March 0.2435 0.3030 0.4595 0.7825
2011/2012
September 0.2394 0.3743 0.5578 0.8649
December 0.2953 4.9075 0.8085 1.1281
March 0.2413 0.4682 0.7334 1.0485
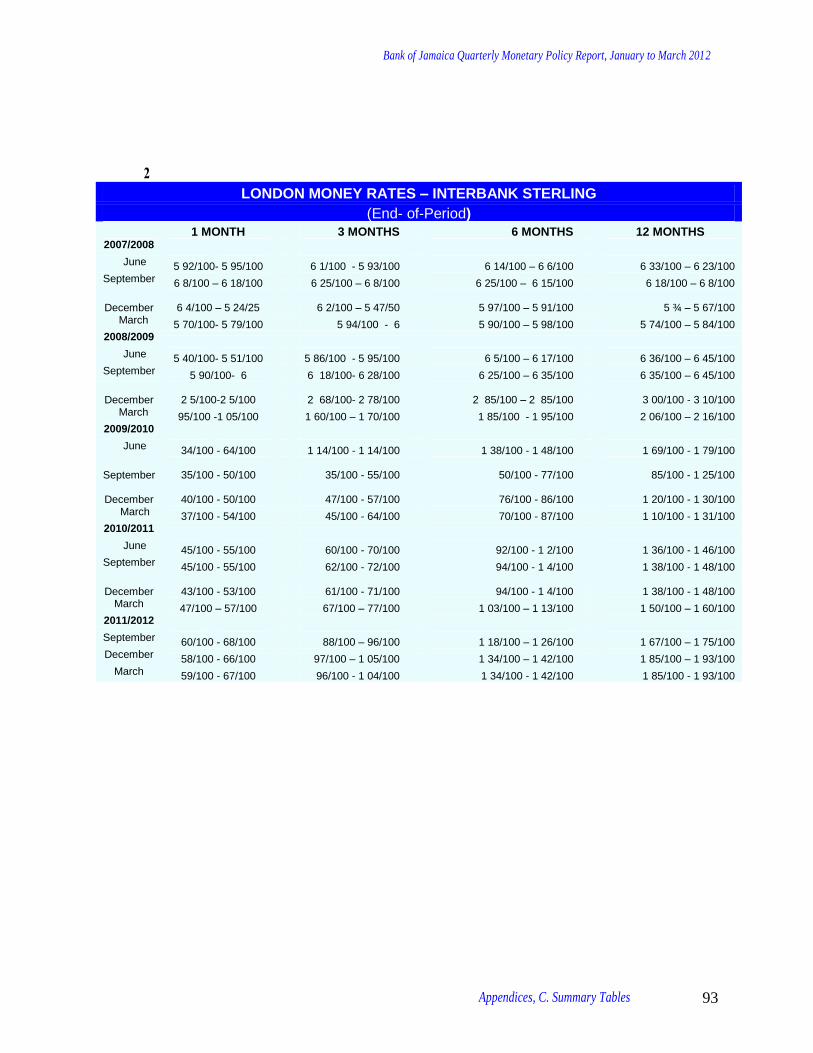
Bank of Jamaica Quarterly Monetary Policy Report, January to March 2012
Appendices, C. Summary Tables 93
2 LONDON MONEY RATES – INTERBANK STERLING
(End- of-Period)
1 MONTH 3 MONTHS 6 MONTHS 12 MONTHS 2007/2008
June 5 92/100- 5 95/100 6 1/100 - 5 93/100 6 14/100 – 6 6/100 6 33/100 – 6 23/100 September 6 8/100 – 6 18/100 6 25/100 – 6 8/100 6 25/100 – 6 15/100 6 18/100 – 6 8/100
December 6 4/100 – 5 24/25 6 2/100 – 5 47/50 5 97/100 – 5 91/100 5 ¾ – 5 67/100 March 5 70/100- 5 79/100 5 94/100 - 6 5 90/100 – 5 98/100 5 74/100 – 5 84/100
2008/2009 June 5 40/100- 5 51/100 5 86/100 - 5 95/100 6 5/100 – 6 17/100 6 36/100 – 6 45/100
September 5 90/100- 6 6 18/100- 6 28/100 6 25/100 – 6 35/100 6 35/100 – 6 45/100
December 2 5/100-2 5/100 2 68/100- 2 78/100 2 85/100 – 2 85/100 3 00/100 - 3 10/100 March 95/100 -1 05/100 1 60/100 – 1 70/100 1 85/100 - 1 95/100 2 06/100 – 2 16/100
2009/2010 June 34/100 - 64/100 1 14/100 - 1 14/100 1 38/100 - 1 48/100 1 69/100 - 1 79/100
September 35/100 - 50/100 35/100 - 55/100 50/100 - 77/100 85/100 - 1 25/100
December 40/100 - 50/100 47/100 - 57/100 76/100 - 86/100 1 20/100 - 1 30/100 March 37/100 - 54/100 45/100 - 64/100 70/100 - 87/100 1 10/100 - 1 31/100
2010/2011 June 45/100 - 55/100 60/100 - 70/100 92/100 - 1 2/100 1 36/100 - 1 46/100
September 45/100 - 55/100 62/100 - 72/100 94/100 - 1 4/100 1 38/100 - 1 48/100
December 43/100 - 53/100 61/100 - 71/100 94/100 - 1 4/100 1 38/100 - 1 48/100 March 47/100 – 57/100 67/100 – 77/100 1 03/100 – 1 13/100 1 50/100 – 1 60/100
2011/2012 September 60/100 - 68/100 88/100 – 96/100 1 18/100 – 1 26/100 1 67/100 – 1 75/100 December 58/100 - 66/100 97/100 – 1 05/100 1 34/100 – 1 42/100 1 85/100 – 1 93/100
March 59/100 - 67/100 96/100 - 1 04/100 1 34/100 - 1 42/100 1 85/100 - 1 93/100

Bank of Jamaica Quarterly Monetary Policy Report, January to March 2012
Appendices, C. Summary Tables 94
3 PRIME LENDING RATES
(End- of-Period)
EURO-ZONE UNITED STATES UNITED
KINGDOM
Repo rate Fed Funds Rate Discount Rate Prime Rate Repo rate
2007/2008
June 4.00 5.25 6.25 8.25 5.50
September 4.00 4.75 5.25 8.25 5.75 December 4.00 4.25 4.75 7.25 5.50
March 4.00 2.25 2.50 5.25 5.25
2008/2009
June 4.00 2.00 2.25 5.00 5.00
September 4.25 2.00 2.25 5.00 5.00
December 2.50 0 – 0.25 0.50 3.61 2.00
March 1.50 0 – 0.25 0.50 3.25 0.50
2009/2010
June 1.00 0 – 0.25 0.50 3.25 0.50
September 1.00 0 – 0.25 0.50 3.25 0.50
December 1.00 0 – 0.25 0.50 3.25 0.50
March 1.00 0 – 0.25 0.75 3.25 0.50
2010/2011
June 1.00 0 – 0.25 0.75 3.25 0.50
September 1.00 0 – 0.25 0.75 3.25 0.50
December 1.00 0 – 0.25 0.75 3.25 0.50
2011/2012
June 1.25 0 – 0.25 0.75 3.25 0.50
September 1.50 0 – 0.25 0.75 3.25 0.50
December 1.00 0 – 0.25 0.75 3.25 0.50
March 1.00 0 - 0.25 0.75 3.25 0.50
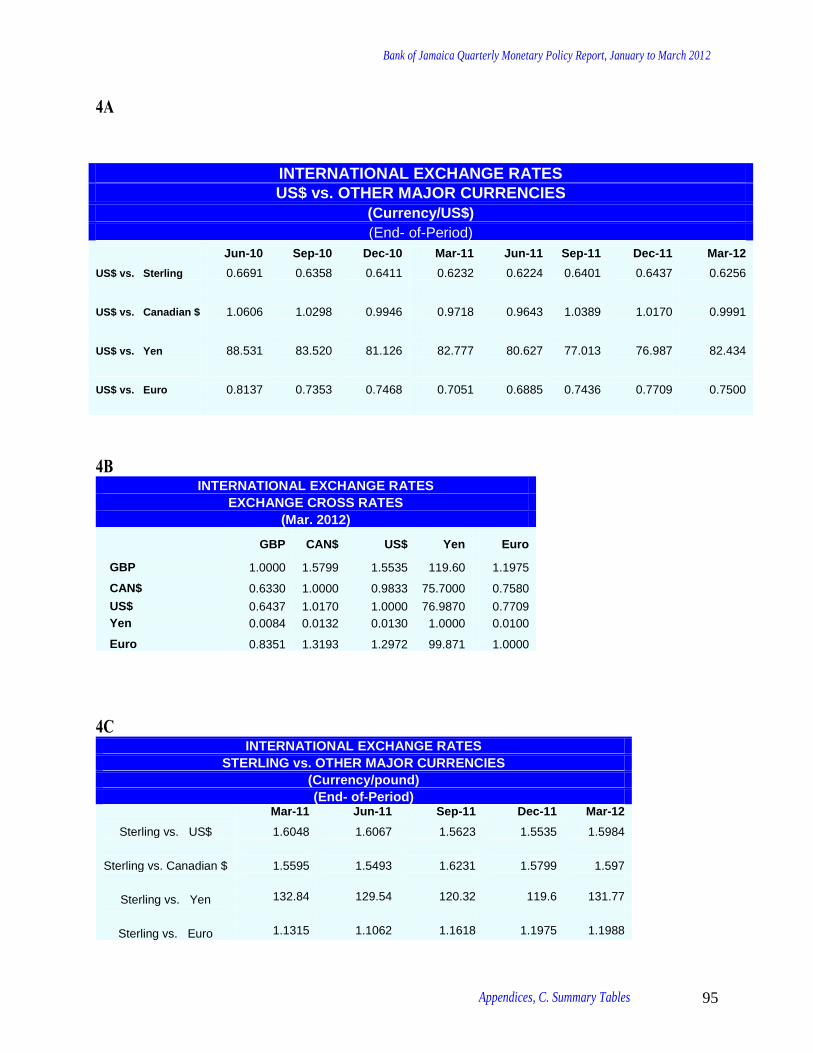
Bank of Jamaica Quarterly Monetary Policy Report, January to March 2012
Appendices, C. Summary Tables 95
4A
4B INTERNATIONAL EXCHANGE RATES
EXCHANGE CROSS RATES
(Mar. 2012)
GBP CAN$ US$ Yen Euro
GBP 1.0000 1.5799 1.5535 119.60 1.1975
CAN$ 0.6330 1.0000 0.9833 75.7000 0.7580
US$ 0.6437 1.0170 1.0000 76.9870 0.7709
Yen 0.0084 0.0132 0.0130 1.0000 0.0100
Euro 0.8351 1.3193 1.2972 99.871 1.0000
4C
INTERNATIONAL EXCHANGE RATES
STERLING vs. OTHER MAJOR CURRENCIES
(Currency/pound)
(End- of-Period)
Mar-11 Jun-11 Sep-11 Dec-11 Mar-12
Sterling vs. US$ 1.6048 1.6067 1.5623 1.5535 1.5984
Sterling vs. Canadian $ 1.5595 1.5493 1.6231 1.5799 1.597
Sterling vs. Yen
132.84 129.54 120.32 119.6 131.77
Sterling vs. Euro
1.1315 1.1062 1.1618 1.1975 1.1988
INTERNATIONAL EXCHANGE RATES
US$ vs. OTHER MAJOR CURRENCIES
(Currency/US$)
(End- of-Period)
Jun-10 Sep-10 Dec-10 Mar-11 Jun-11 Sep-11 Dec-11 Mar-12
US$ vs. Sterling 0.6691 0.6358 0.6411 0.6232 0.6224 0.6401 0.6437 0.6256
US$ vs. Canadian $ 1.0606 1.0298 0.9946 0.9718 0.9643 1.0389 1.0170 0.9991
US$ vs. Yen 88.531 83.520 81.126 82.777 80.627 77.013 76.987 82.434
US$ vs. Euro 0.8137 0.7353 0.7468 0.7051 0.6885 0.7436 0.7709 0.7500
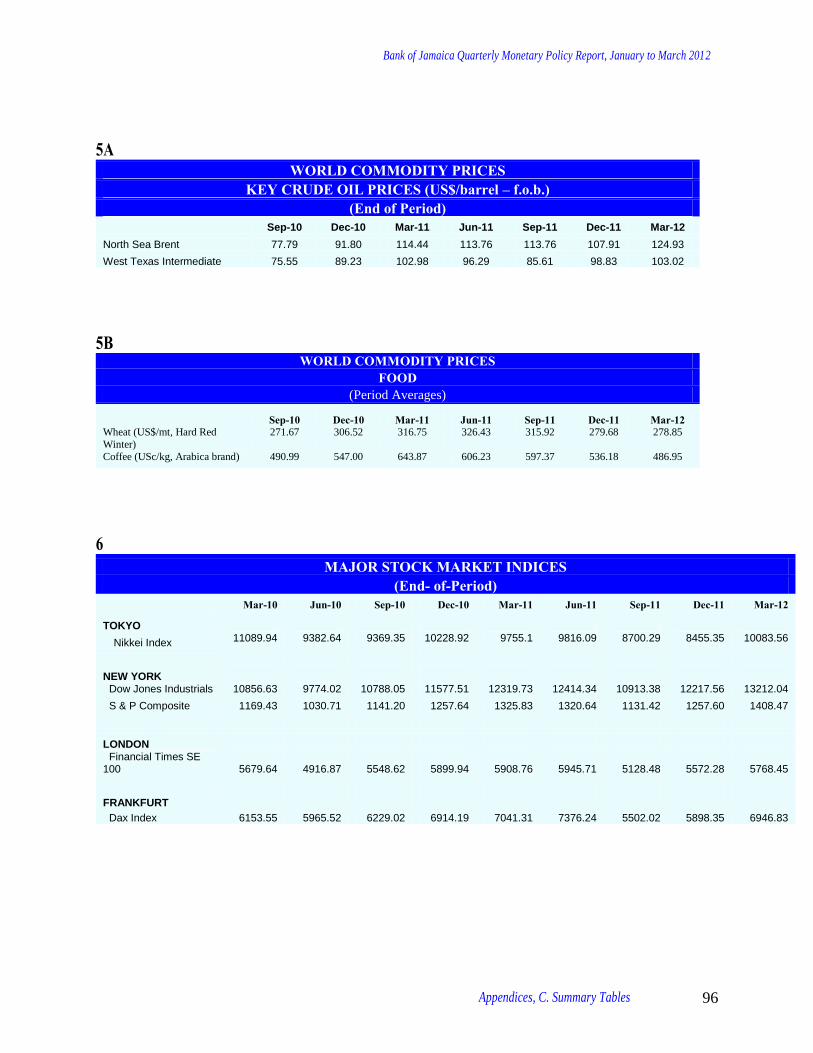
Bank of Jamaica Quarterly Monetary Policy Report, January to March 2012
Appendices, C. Summary Tables 96
5A
WORLD COMMODITY PRICES KEY CRUDE OIL PRICES (US$/barrel – f.o.b.)
(End of Period) Sep-10 Dec-10 Mar-11 Jun-11 Sep-11 Dec-11 Mar-12
North Sea Brent 77.79 91.80 114.44 113.76 113.76 107.91 124.93
West Texas Intermediate 75.55 89.23 102.98 96.29 85.61 98.83 103.02
5B
WORLD COMMODITY PRICES FOOD
(Period Averages)
Sep-10 Dec-10 Mar-11 Jun-11 Sep-11 Dec-11 Mar-12 Wheat (US$/mt, Hard Red
Winter)
271.67 306.52 316.75 326.43 315.92 279.68 278.85
Coffee (USc/kg, Arabica brand) 490.99 547.00 643.87 606.23 597.37 536.18 486.95
6
MAJOR STOCK MARKET INDICES (End- of-Period)
Mar-10 Jun-10 Sep-10 Dec-10 Mar-11 Jun-11 Sep-11 Dec-11 Mar-12
TOKYO Nikkei Index 11089.94 9382.64 9369.35 10228.92 9755.1 9816.09 8700.29 8455.35 10083.56
NEW YORK
Dow Jones Industrials 10856.63 9774.02 10788.05 11577.51 12319.73 12414.34 10913.38 12217.56 13212.04
S & P Composite 1169.43 1030.71 1141.20 1257.64 1325.83 1320.64 1131.42 1257.60 1408.47
LONDON
Financial Times SE 100 5679.64 4916.87 5548.62 5899.94 5908.76 5945.71 5128.48 5572.28 5768.45
FRANKFURT
Dax Index 6153.55 5965.52 6229.02 6914.19 7041.31 7376.24 5502.02 5898.35 6946.83

Bank of Jamaica Quarterly Monetary Policy Report, January to March 2012
Glossary 97
Amortization: The repayment of a loan in installments over an agreed period of time.
Base Money: The sum of notes and coins held by the public and the cash reserves of commercial banks (including both
their holding of cash and their deposits at the central bank). The monetary base is the operating target used in the BOJ
monetary policy framework and can be controlled through open market operations. Changes in the monetary base
emanate from sources within the net domestic assets (NDA) as well as the net international reserves (NIR).
Bond Market: The domestic bond market primarily captures debt instruments offered by the Central Government to fund
its budgetary needs.
Cash Reserve Requirement: The requirement by law that a percentage of deposit liabilities of deposit-taking institutions
must be held as interest free deposits at the Central Bank.
Core Inflation: Also called Underlying Inflation. It is that part of overall inflation that can be attributed to changes in
base money. Central Banks typically try to control core inflation because there are some parts of inflation that are outside
of their control. One example of this is the effect of changes in oil prices.
Credit: Loans extended by banks, building societies and other financial institutions.
Currency Issue: refers to Jamaican notes and coins in the hands of the public (currency in circulation) in addition to
notes and coins held by financial institutions in their vaults (vault cash). Bank of Jamaica redeems (buys) or issues (sells)
notes and coins to financial institutions when institutions have a demand for cash. The difference between currency
issued and that which is redeemed during a period of time is referred to as net currency issue.
Exchange rate (nominal): The number of units of one currency offered in exchange for another. For example a Jamaica
dollar/United States dollar exchange rate of ‘forty two dollars to one’ indicates that forty-two Jamaican dollars are needed
to obtain one United States dollar.
Exchange rate pass-through: The effect of exchange rate changes on one or more of the following: import and export
prices, consumer prices, investments and trade volumes.
Export Price Index: The export price index (EPI) is a weighted index of the prices of goods and services sold by
residents of a country to foreign buyers.
Glossary

Bank of Jamaica Quarterly Monetary Policy Report, January to March 2012
Glossary 98
Foreign exchange cash demand/supply: The amount of foreign exchange purchased by market participants from the
authorized dealers and cambios, while cash supply/inflows is the amount sold to the Bank of Jamaica, authorized dealers
and cambios by market participants, private institutions and multilateral agencies.
Financial Programme: An integrated system of macroeconomic accounts and behavioural relationships defining the set
of monetary, fiscal and exchange rate policy measures designed to achieve specified macroeconomic targets.
Financial Asset: An instrument issued by an institution (e.g. BOJ) that provides economic benefits, by (1) generating
interest income or net profits and (2) acting as a store of value. These benefits are created through a formal/informal
borrowing/lending relationship. Most common types of financial assets are money and credit.
Fiscal deficit: The excess of the Government’s expenditure over its revenue for a given period of time.
Fiscal Year: The twelve months beginning in April. Thus fiscal year 2000/2001 refers to the period April 2000 to March
2001.
Government Securities: Debt instruments issued by the Ministry of Finance either to bridge timing gaps between
revenue and expenditure or to cover any excess of expenditure over revenue. These securities include short-term
instruments such as Treasury Bills and more long term ones like Local Registered Stock, or Debentures.
Gross Domestic Product (GDP): This is the total value of all goods and services produced within an economy over a
particular time period –either a year or three month.
Import Price Index: The import price index (IPI) is a weighted index of the prices of goods and services purchased by
residents of a country from foreign sellers.
Inflation: refers to the change in the general price level. In Jamaica, this is derived as the change in the Consumer Price
Index (CPI) calculated and published by the Statistical Institute of Jamaica.
Intermediate Target: An intermediate target of policy. e.g. the money supply or the exchange rate, has three main
characteristics.
It is not directly determined by the Central Bank,
It responds, however, to a stimulus that the Central Bank can vary, and
Its behaviour should to be closely related to the ultimate target-inflation.
Jamaica Central Securities Depository (JCSD): The Principal function of the JCSD is to provide for relatively risk-free
settlement of share transactions. It accomplishes this by employing an electronic, book-entry system for registering
changes of ownership of securities which eliminates the need for physical certificates. The JCSD also provides vaulting
facilities for the safekeeping of certificates.

Bank of Jamaica Quarterly Monetary Policy Report, January to March 2012
Glossary 99
Liquid Asset: An asset is considered liquid if it can be easily and with little or no loss converted to cash. The liquid assets
of commercial banks in Jamaica include notes and coins, short-term deposits at the Bank of Jamaica, GOJ Treasury Bills,
Local Registered Stock maturing within 270 days and any GOJ security designated by the Ministry of Finance.
Money: Anything that is generally accepted in exchange for goods and services and for the payment of debt. (e.g.
example, notes and coins.). Hence money is said to be a medium of exchange. Money also serves as a means of storing
wealth as well as a standard of and unit of accounting for financial values and flows.
Money Multiplier: This defines the relationship between the monetary base (M0) and the money supply and is usually
calculated as the ratio of M3 to M0. It measures the maximum amount of money that can be created by the banking
system given the provision of an additional dollar to the system by the central bank. The money multiplier implies that
when the central bank conducts monetary policy in such a way as to increase the monetary base, the overall expansion in
the money supply is a multiple of this initial increase. This is also true if the central bank reduces the monetary base.
Money Supply: This is the stock of instruments or assets formally designated as money in a particular economy. There
are alternative measures of money supply both within and between countries. In Jamaica, the measurements of money
that are calculated and published are:
M1: Notes and coins in circulation + Demand Deposits
M2: M1+ Time and savings deposits
M3: M2 + Other Deposits.
A ‘J’ indicates that the components are Jamaican dollar liabilities only and an ‘*’ indicates that the components also
include foreign currency liabilities of the banking system.
Monetary Base: See Base Money
Monetary policy framework: This defines the transmission process through which policy actions taken by the Central
Bank make an impact on the final target - inflation. The components of a monetary policy framework are policy
instruments, operating targets, intermediate targets, and the ultimate goal/objective.
Monetary Policy Instruments: These are instruments used by the Central Bank to influence the money supply and credit.
They include open market operations and the reserve requirement ratio.
Net Domestic Assets: The difference between the monetary base and the NIR. It is comprised of the Bank’s net claims on
the public sector, mainly Central Government, open market operations liabilities and net claims on commercial banks and
other financial institutions.
Open Market Operations (OMO): Money market trading between the Bank of Jamaica and authorized dealers with the
intention of influencing money and credit in the financial system. OMO involves outright sale or purchase of GOJ
securities from the stock of securities held by BOJ, and/or repurchase and reverse repurchase transactions.

Bank of Jamaica Quarterly Monetary Policy Report, January to March 2012
Glossary 100
Operating Rate: The percentage of total production capacity of some entity, such as a country or a company that is being
utilized at a given time.
Operating Target: An operating target of policy e.g. the monetary base and interest rates, is influenced directly by the
Central Bank and is adjusted by the Bank in order to bring about the desired impact on its policy target.
Primary Dealer (PD): The set of intermediaries through which BOJ conducts open market operations. In developed
country markets, PD’s underwrite government issues as well as participate in block transactions with the central bank.
Public Sector Entities (PSE) Foreign Exchange Facility: A foreign exchange surrender facility for public sector entities
which seeks to centralize foreign currency demand. Under this facility Commercial Banks, Authorized Dealers and
Cambios agreed to surrender amounts in addition to the pre-existing requirements.
Real Appreciation: An increase in the volume of foreign goods that can be bought with a unit of domestic currency;
alternatively it is a decrease in the volume of domestic goods that can be purchased with a unit of foreign currency. Thus,
a real appreciation makes exports less attractive and imports relatively cheaper. This may ensue from a nominal
appreciation, which is the rise in the unit price of the currency, or a greater increase in domestic prices relative to foreign
prices, or both.
Real Exchange Rate: The price of one country's currency in terms of another, adjusted for the inflation differential
between the countries.
Real interest rate: This represents the rate of return on assets after accounting for the effects of inflation on the
purchasing power of the return. It is calculated by adjusting the nominal interest rate by the inflation rate.
Repurchase Agreement (repo): The purchase of a security from a primary dealer who agrees to repurchase the same at a
specified rate and an agreed future date.
Reserve Requirement: refers to the portion of deposit liabilities that financial institutions may not lend and have to retain
either as liquid assets or on deposit at the Bank of Jamaica.
Reverse Repurchase Agreements: An agreement whereby the Central Bank sells a security that it owns and agrees to buy
back same at a specified rate at an agreed future date.
Securities: Legal documents giving title to property, or claim on income e.g. bonds and stocks.
Signal Rate: Interest rate on Bank of Jamaica’s thirty-day reverse repurchase agreements. This rate provides a benchmark
for the pricing of all open market instruments negotiated between the BOJ and Primary Dealers.
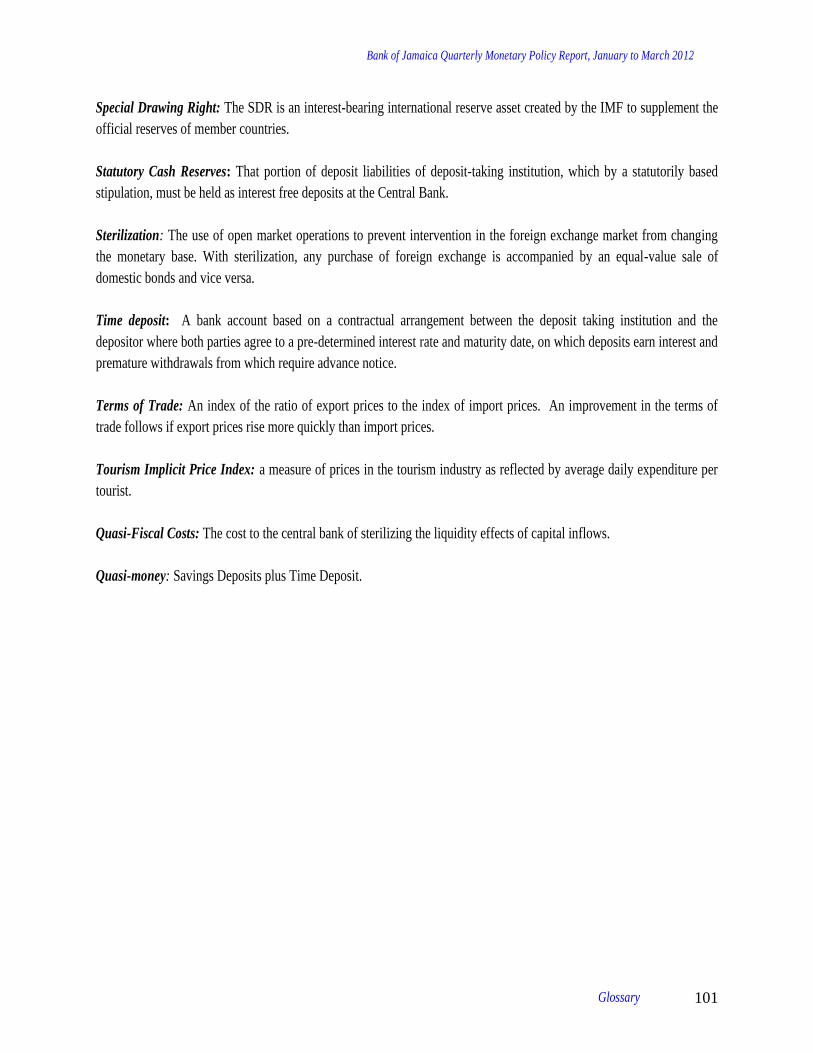
Bank of Jamaica Quarterly Monetary Policy Report, January to March 2012
Glossary 101
Special Drawing Right: The SDR is an interest-bearing international reserve asset created by the IMF to supplement the
official reserves of member countries.
Statutory Cash Reserves: That portion of deposit liabilities of deposit-taking institution, which by a statutorily based
stipulation, must be held as interest free deposits at the Central Bank.
Sterilization: The use of open market operations to prevent intervention in the foreign exchange market from changing
the monetary base. With sterilization, any purchase of foreign exchange is accompanied by an equal-value sale of
domestic bonds and vice versa.
Time deposit: A bank account based on a contractual arrangement between the deposit taking institution and the
depositor where both parties agree to a pre-determined interest rate and maturity date, on which deposits earn interest and
premature withdrawals from which require advance notice.
Terms of Trade: An index of the ratio of export prices to the index of import prices. An improvement in the terms of
trade follows if export prices rise more quickly than import prices.
Tourism Implicit Price Index: a measure of prices in the tourism industry as reflected by average daily expenditure per
tourist.
Quasi-Fiscal Costs: The cost to the central bank of sterilizing the liquidity effects of capital inflows.
Quasi-money: Savings Deposits plus Time Deposit.
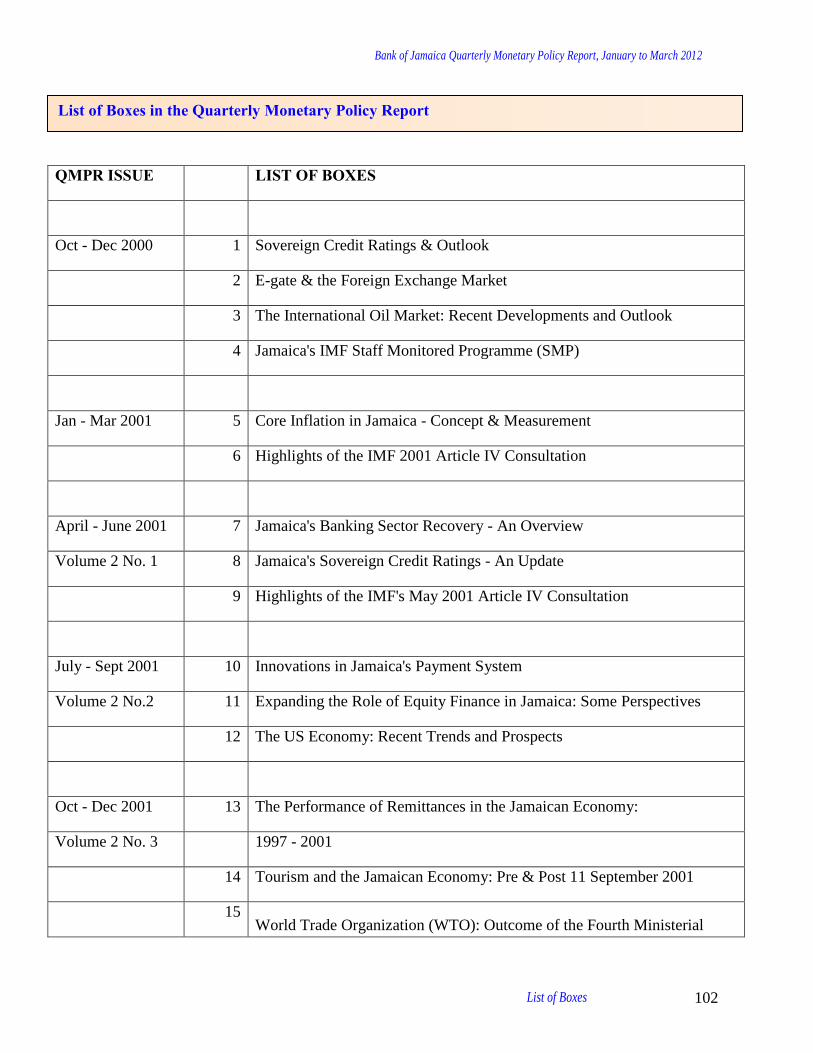
Bank of Jamaica Quarterly Monetary Policy Report, January to March 2012
List of Boxes 102
QMPR ISSUE LIST OF BOXES
Oct - Dec 2000 1 Sovereign Credit Ratings & Outlook
2 E-gate & the Foreign Exchange Market
3 The International Oil Market: Recent Developments and Outlook
4 Jamaica's IMF Staff Monitored Programme (SMP)
Jan - Mar 2001 5 Core Inflation in Jamaica - Concept & Measurement
6 Highlights of the IMF 2001 Article IV Consultation
April - June 2001 7 Jamaica's Banking Sector Recovery - An Overview
Volume 2 No. 1 8 Jamaica's Sovereign Credit Ratings - An Update
9 Highlights of the IMF's May 2001 Article IV Consultation
July - Sept 2001 10 Innovations in Jamaica's Payment System
Volume 2 No.2 11 Expanding the Role of Equity Finance in Jamaica: Some Perspectives
12 The US Economy: Recent Trends and Prospects
Oct - Dec 2001 13 The Performance of Remittances in the Jamaican Economy:
Volume 2 No. 3 1997 - 2001
14 Tourism and the Jamaican Economy: Pre & Post 11 September 2001
15 World Trade Organization (WTO): Outcome of the Fourth Ministerial
List of Boxes in the Quarterly Monetary Policy Report

Bank of Jamaica Quarterly Monetary Policy Report, January to March 2012
List of Boxes 103
Conference in Doha, Qatar and the possible Implications for Jamaica
Jan - Mar 2002 16 Commercial Bank Profitability (January to December 2001)
Volume 2 No. 4 17 Regional Disparities in Jamaica's Inflation (1997/98 to 2001/02)
18 The Argentina Debt Crisis & Implications for Jamaica
19 General Data Dissemination Standards
April - June 2002 20 The Automated Clearing House: Implications for the Payment System
Volume 3 No. 1 21
Macroeconomic Implications of Cross Border Capital Flows: Some
Scenarios
22
Performance of Remittances in the Latin American and Caribbean Region:
1997 - 2001
July - Sept 2002 23 Building Societies' New Mortgage Loans: July 2001 - June 2002
Volume 3 No. 2 24 An Overview of the CARICOM Single Market and Economy (CSME)
Oct - Dec 2002 25 The Profitability of the Banking System: 1991 - 2002
Volume 3 No. 3 26 Interest Rate Spreads in Jamaica: 1995 - 2002
27
Implications of the International Accounting Standards (IAS) for Financial
Systems and Financial Stability
Jan - Mar 2002 28
Opportunities for Savings and Investments in Jamaica: Financial
Intermediaries and Financial Instruments
Volume 3 No. 4 29 The CPI and the GDP Deflator: Concepts and Applications
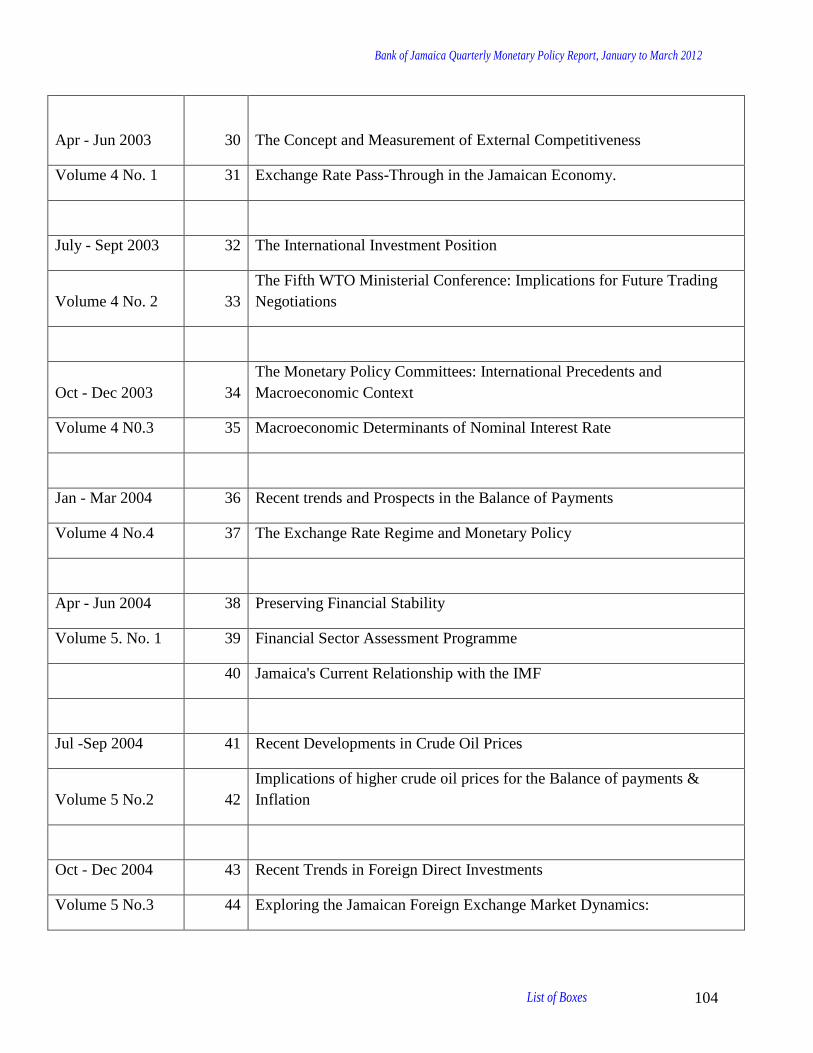
Bank of Jamaica Quarterly Monetary Policy Report, January to March 2012
List of Boxes 104
Apr - Jun 2003
30
The Concept and Measurement of External Competitiveness
Volume 4 No. 1 31 Exchange Rate Pass-Through in the Jamaican Economy.
July - Sept 2003 32 The International Investment Position
Volume 4 No. 2 33
The Fifth WTO Ministerial Conference: Implications for Future Trading
Negotiations
Oct - Dec 2003 34
The Monetary Policy Committees: International Precedents and
Macroeconomic Context
Volume 4 N0.3 35 Macroeconomic Determinants of Nominal Interest Rate
Jan - Mar 2004 36 Recent trends and Prospects in the Balance of Payments
Volume 4 No.4 37 The Exchange Rate Regime and Monetary Policy
Apr - Jun 2004 38 Preserving Financial Stability
Volume 5. No. 1 39 Financial Sector Assessment Programme
40 Jamaica's Current Relationship with the IMF
Jul -Sep 2004 41 Recent Developments in Crude Oil Prices
Volume 5 No.2 42
Implications of higher crude oil prices for the Balance of payments &
Inflation
Oct - Dec 2004 43 Recent Trends in Foreign Direct Investments
Volume 5 No.3 44 Exploring the Jamaican Foreign Exchange Market Dynamics:
Bank of Jamaica Quarterly Monetary Policy Report, January to March 2012
List of Boxes 105
2001 - 2004 (Special Feature)
Jan - Mar 2005 45
The BOJ Macroeconomic Stress Testing Programme and Financial
Stability
Volume 5 No.4 46 Issues of Foreign Reserve Adequacy
Apr - Jun 2005 47 Credit Bureaux and Financial Market Efficiency
Volume 6 No.1 48 Trends in Labour Productivity
Jul - Sep 2005 49 Inflation in Selected Caribbean Countries
Volume 6 No.2 50 Special Feature: International Developments
Oct - Dec 2005 51 Payment Systems Reform
Volume 6 No.3
Jan - Mar 2006 52
The IMF's Code of Good Practices on Transparency on Monetary policy:
A summary of the IMF's assessment report on Jamaica
Volume 6 No.4
Apr - June 2006 53 Trends in Private Sector Credit: FY 2001/02 to FY2005/06
Volume 7 No.1 54
Exploring the Interest Rate Differential between Jamaica dollar and US
dollar denominated assets: Jan 2001 - Jun 2006
55 Jamaica Labour Market: Trends and Key Indicators: 1996 - 2005

Bank of Jamaica Quarterly Monetary Policy Report, January to March 2012
List of Boxes 106
July - Sept 2006 56 Labour Market Update - June 2006
Volume 7 No.2 57 The Special (Upper Income) Consumer Price Index
58
Jamaica Interim Staff Report Under Intensified Surveillance: Executive
Summary
Oct - Dec 2006 59
Factors Influencing the Demand for Currency issued by the BOJ & the
Impact of Currency demand on the Balance sheet of Financial Institutions
Volume 7 N0. 3
Jan - Mar 2007 60 Jamaica's Financial Programme
Volume 7 No. 4 61 Inflation Expectation Survey
62 The Producer's Price Index
Apr - Jun 2007 63 Measuring Core Inflation: Emerging Issues
Volume 8 No. 1
Jul - Sept 2007 64 The Recent Turbulence in the US Subprime Mortgage Market
Volume 8 No.2 65 The Revised Consumer Price Index
Oct - Dec 2007 66 Trends in Jamaica's Fuel Demand
Volume 8 No. 3 67 Trends in Inflation
68 The EU-CARIFORUM Economic Partnership Agreement
Jan - Mar 2008 69 Impact of a potential USA recession on the Jamaican economy
Volume 8 No.4 70 Recent trends in international Commodity Prices

Bank of Jamaica Quarterly Monetary Policy Report, January to March 2012
List of Boxes 107
Apr – Jun 2008 71 Global Monetary Policy Response to Spiralling Commodity Prices
Volume 9 No. 1
Jan – Mar 2009 72 BOJ’s Monetary Policy Response to the Global Financial Crisis
Volume 9 No. 4 73 The Transmission of Monetary Policy in Jamaica
74 Monetary Policy, Economic Growth and Inflation
Apr – Jun 2009 75
The International Monetary Fund (IMF) and Jamaica’s Experience with the
IMF
Volume 10 No. 1
Jul – Sept 2009 76 Fiscal Responsibility Frameworks/Fiscal Rules
Volume 10 No. 2
Oct – Dec 2009 77
Bank of Jamaica Liquidity Support to Government
November 2009 – January 2010
Volume 10 No. 3 78 The Dynamics of Jamaica’s Interest Rate
79
Jamaica’s Medium-Term Economic & Financial Programme
FY2009/10 – FY2013/14
Jan – Mar 2010 80 Jamaica’s Inflation: How much is enough?
Volume 10 No. 4 81 The Jamaica Debt Exchange

Bank of Jamaica Quarterly Monetary Policy Report, January to March 2012
List of Boxes 108
Apr – Jun 2010 82 Exchange Rates and External Price Competitiveness
Volume 11 No. 1 83 Adequacy of BOJ’s Gross International Reserves
Jul – Sept 2010 83 Preserving Financial Stability (revisited)
Volume 11 No. 2 84 Credit Bureaux and the Efficiency of Credit Markets (updated)
Oct – Dec 2010 85 An Inflation Targeting Framework for Jamaica
Volume 11 No. 3
Jan – Mar 2011 86
The Middle East and North Africa (MENA) Crisis and its Implication for
the Jamaican Economy
Volume 11 No. 4
Apr – Jun 2011
87 Evolution of the European Debt Crisis & Its Impact on Jamaica
Volume 12 No. 1
Jul – Sept 2011 88
Electronic Small-Value Retail Payments: Recent Trends and the
Relationship with Economic Growth
Volume 12 No. 2
Oct – Dec 2011 89 Productivity and Growth
Volume 12 No. 3

Bank of Jamaica Quarterly Monetary Policy Report, January to March 2012
List of Boxes 109
Jan – Mar 2012 90 External Competitiveness in Jamaica
Volume 12 No. 4