Embed Size (px)
Citation preview

i
JANUARY 1, 2015 TO DECEMBER 31, 2015
~~
ii
CENTRAL BANK OF LIBERIA
Office of the Executive Governor January 22, 2016 Her Excellency Madam Ellen Johnson-Sirleaf PRESIDENT Republic of Liberia Madam President: In accordance with part XI Section 49(1) of the Central Bank of Liberia (CBL) Act of 1999,
I have the honor on behalf of the Board of Governors and Management of the Bank to
submit, herewith, the Annual Report of the Central Bank of Liberia to the Government of
Liberia for the period January 1 to December 31, 2015.
Respectfully yours, J. Mills Jones
P.O. BOX 2048, LYNCH & ASHMUN STREETS, MONROVIA, LIBERIA TEL.: (231) 226‐991, FAX: (231) 226‐144, TELEX: 44215

~~
iii
TABLE OF CONTENTS
Highlights
Mission and Objectives of the CBL
Board of Governors
1.0 Governance and Organizational Structure
1.1 The Board of Governors
1.2 Committees of the Board
1.3 Policy Decisions by the Board
1.4 Internal Committees
2.0 The Global Economy
2.1 World Output Growth
2.2 Global Inflation
2.3 Commodity Market
2.3.1 Crude Oil
2.3.2 Iron ore
2.3.3 Rubber
2.3.4 Round Logs
2.3.5 Rice
2.3.6 Cocoa Bean
2.4 Implication for the Liberian Economy
3.0 Developments in the Liberian Economy
3.1 Overview
3.2 GDP Performance
3.3 Real Sector Performance
3.4 Price Developments
3.5 Monetary Developments
3.5.1 Commercial Banks’ Credits to the Economy

~~
iv
3.5.2 Interest Rates
3.5.3 Monetary Policy Stance
3.5.4 Monetary Aggregates
3.5.5 Money Market Developments
3.5.6 CBL’s Foreign Exchange Auction
3.6 External Sector Developments
3.6.1 Balance of Payments
3.6.1.1 Current Account
3.6.1.2 Trade Balance
3.6.1.3 Merchandise Exports
3.6.1.4 Merchandise Imports
3.6.2 Direction of Trade
3.6.2.1 Destination of Exports
3.6.2.2 Sources of Imports
3.6.3 Services, Income & Current Transfers
3.6.3.1 Services
3.6.3.2 Income
3.6.3.3 Current Transfers
3.6.3.4 Personal Remittances
3.6.4 Capital and Financial Account
3.7 Exchange Rate Developments
3.8 National Stock of Debt
3.8.1 Stock of Public Debt
3.8.1.1 External Debt
3.8.1.2 Domestic Debt
4.0 Financial System Developments
4.1 Overview
4.2 The Banking and Non-Bank Financial Institutions
4.2.1 The Banking Sector
4.2.1.1 Balance Sheet of the Banking Sector
~~
v
4.2.1.2 Financial Soundness Indicators
4.2.1.3 Implementation of the International Financial Reporting
Standards
4.2.1.4 Rural Community Finance Institutions
4.2.2 Developments in Non-bank Financial Sector
4.2.2.1 Insurance Sector
4.2.2.2 Sub-Regional Insurance Supervisory College
4.2.2.3 Microfinance Deposit-Taking Institutions (MDI)
4.2.2.4 Liberia Enterprise Development Finance Company
4.2.2.5 Foreign Exchange Bureaux Operations
4.2.2.6 Non-Bank Financial Institution Services
4.3 Microfinance Activities
4.3.1 Overview
4.3.2 Improving the Regulatory Environment
4.3.3 Creating Opportunity for Access to Finance
4.4 CBL’s Credit Stimulus Initiatives
4.4.1 Background
4.4.2 LIBA Credit Stimulus Initiative
4.4.3 Mortgage Credit Stimulus Initiatives
4.4.4 Agriculture Stimulus Initiative
5.0 Internal Developments of the CBL
5.1 Overview
5.2 Human Resources Management
5.3 Management Information System (MIS)
5.4 Banking Operations
5.4.1 CBL Facilitates Enhancement of Revenue Collection
5.4.2 Developments in Currency Management
5.5 The National Payments System
5.5.1 National Switch
5.6 Supervisory and Regulatory Activities
5.6.1 Operations of Collateral Registry of Liberia

~~
vi
5.7 Research and Publication
5.8 CBL Accounting and Finance
5.9 Enterprise Risk Management
5.10 Internal Audit
5.11 Legal Services
5.12 Communication with Stakeholders
5.13 Treasury Operations
5.14 Central Bank of Liberia Community Outreach Initiatives 2015
6.0 External Relations
6.1 Overview
6.2 International Monetary Fund and the World Bank
6.2.1 International Monetary Fund
6.2.2 The World Bank
6.3 Regional and Sub-Regional Organizations
6.3.1 Strengthening of Supervisory Cooperation

~~
vii
List of tables
Table 1: Growth of Selected Global Output
Table 2: Liberia: Sectoral Origin of Gross Domestic Product (GDP) (At 1992
Constant Prices: 2013 – 2016)
Table 3: Key Agricultural & Forestry Production (2013-2015)
Table 4: Key Industrial Output (2013-2015)
Table 5: Year-on-Year Rate of Inflation (2013 – 2015) (December 2005 = 100)
Table 6: HCPI and Core Inflation (In Percent) (2014-2015)
Table 7: Harmonized Consumer Price Index (HCPI) by Major Groups (December
2001=100)
Table 8: Commercial Banks Loans by Economic Sectors (2013 – November, 2015)
(In Million L$)
Table 9: Average Commercial Banks’ Interest Rates (2013 – November, 2015)
Table 10: Liberian Dollar in Circulation (2013 – November, 2015) (In Millions L$)
Table 11: Money Supply and its Sources (2013 – November, 2015) (In Million L$)
Table 12: Broad Money (M2): Share of US and Liberian Dollars (2013 – November,
2015) (In Millions L$)
Table 13: GoL Treasury Bills Auction Details (January – December, 2015)
Table 14: CBL Bills Auction Details (January – December, 2015)
Table 15: CBL’s Foreign Exchange Auction (2013 – 2015) (In Million US$)
Table 16: Balance of Payments (2014 – 2015) (Million US dollars, unless otherwise
indicated)
Table 17: Commodity Composition of Exports 2013 – 2015 (In Million US$, unless
otherwise indicated)

~~
viii
Table 18: Commodity Composition of Imports 2014-2015 (Millions of US$, unless
otherwise indicated)
Table 19: Destination of Exports 2013 – 2015 (Millions US$, unless otherwise
indicated)
Table 20: Sources of Imports 2013 – 2015 (Millions of US$, unless otherwise
indicated)
Table 21: Personal Remittances: 2013-2015 (Millions of US$, unless otherwise
indicated)
Table 22: Market Exchange Rates: Liberian Dollars per US Dollar (2013– December,
2015)
Table 23: Monthly Averages of Buying and Selling Rates of Liberian Dollar per US
Dollar (2013 – December, 2015)
Table 24: Regional and Some Global Exchange Rate Movements
Table 25: Liberia’s Overall Public Debt Position by Composition As At September 30,
2015 (In Million, US$)
Table 26: Liberia’s Overall Public Debt Position by Creditors As At September 30,
2015 (In Millions, US$)
Table 27: Expansion of Bank Branches by County (2014 and 2015)
Table 28: Composition of Banking Industry’s Assets
Table 29: Industry Financial Soundness Indicators (2014 & 2015) (In Thousand L$)
Table 30: Expansion of RCFI by County at end-December, 2015
Table 31: Branch Network of Insurance Companies
Table 32: Performance of Insurance Sector (United States dollar)

~~
ix
List of charts
Chart 1: Organizational Structure as at December 31, 2015
Chart 2: Year-on-Year Rates of Inflation (2013-Nov 2015) (December, 2005 = 100)
Chart 3: HCPI and Core Inflation (In Percent) (2014 – Dec.2015)
Chart 4: Percentage Distribution of Commercial Banks’ Loans by Economic Sectors (November, 2015)
Chart 5: Liberian Dollars in Circulation (2013 – Nov. 2015) (In Millions L$)
Chart 6: Money Supply (M1) (2013 – Nov. 2015) (In Millions L$)
Chart 7: Broad Money (M2) (2013 – Nov. 2015) (In Millions L$)
Chart 8: Broad Money (M2): Share of US and Liberian Dollars (2013 – Nov. 2015) (In Percent)
Chart 9: Foreign Exchange Auction (2013 –2015) (In Million US$)
Chart 10: Gross Foreign Reserves in Months of Import Cover: 2013 – 2015
(Millions of US dollars, unless otherwise indicated)
Chart 11: Trends of Current Account Deficit as Percent of GDP: 2013 – 2015
Chart 12: Exports, Imports & Trade Balance: 2014 – 2015 (In Millions of US dollars)
Chart 13: Trends of Iron Ore & Rubber Compositions of Total Export Receipts: 2014 – 2015 (Millions of US dollars)
Chart 14: Commodity Composition of Exports 2013 – 2015 (In Millions of US dollars)
Chart 15: Commodity Composition of Imports 2013 – 2015 (In Millions of US dollars)
Chart 16: Destination of Exports 2013 – 2015 (Export Values in Millions US$)
Chart 17: Sources of Imports 2013 – 2015 (Values in Millions, US$)
Chart 18: Trends of Personal Remittances 2013-2015 (Values in Millions, US$)
Chart 19: Monthly Averages of Buying and Selling Rates of Liberian Dollars per US$ (2013 – 2015)
Chart 20 Chart 16: Regional and Some Global Exchange Rate Movements
(In Percent)
~~
x
Chart 21: Liberia’s Overall Public Debt Position by Composition As at September
30, 2015 (In Millions, US$)
Chart 22: Liberia’s Overall Public Debt Position by Creditors As at September 30, 2015 (In Millions, US$)
Chart 23: Key Balance Sheet Indicators of the Banking Sector as at October, 2015
Chart 24: Deposit Account Trend (2013- Sept, 2015)
~~
xi
Acronyms Used
AACB - Association of the African Central Banks
ABLL - AccessBank Liberia Limited
AC ACH
-
-
The Audit Committee Automated Clearing House
ACICO ACP
-
-
Accident & Casualty Insurance Company Automated Check Processing
AFBLL - Afriland First Bank Liberia Limited
AfDB - African Development Bank
AGLIC - Atlantic Life &General Insurance Company
AICOL - African Insurance Corporation of Liberia
AIIC AIO
-
-
ACTIVA International Insurance Company African Insurance Organization
ATM - Automated Teller Machine
AUG - American Underwriter Group
BCEAO BCIC BOP BPM BRAC
-
-
-
-
-
Bank Centrale des Etats de l’Afrique de l’ouest Blue Cross Insurance Company Balance of Payments Balance of Payment Manual Bangladesh Rehabilitation Assistance Committee
CAR - Capital Adequacy Ratio
CBL CBSWCA CDA CDA
-
-
-
Central Bank of Liberia Committee of Banking Supervisors of West and Central Africa Cooperative Development Agency Central Depository Act

~~
xii
CEAC CEBSA
-
-
Capital Express Assurance Company Central Bank of Liberia Staff Association
CGLIC - Continental General &Life Insurance Company
CMA - Capital Market Act
CNDRA CPI CRO CRS CSWAMZ CU DFID DMFI
-
-
-
-
-
-
-
-
Centre for National Documents and Records Agency Consumer Price Index Chief Risk Officer Collateral Registry System College of Supervisors of the West African Monetary Zone Credit Unions Department for International Development Diaconia Microfinance Deposit Taking Institution
DR EBID
-
-
Disaster Recovery ECOWAS Bank for Investment and Development
EBLL - Ecobank Liberia Limited
EC ECB
-
-
ECOWAS Commission European Central Bank
ECF - Extended Credit Facility
ECOWAS EICLL
-
-
Economic Community of West African States Equity Insurance Company Liberia Limited
EPM - Economic Policy Management
ERM - Enterprise Risk Management
ERMC - Enterprise Risk Management Committee
ERMS EVD
-
-
Enterprise Risk Management Section Ebola Virus Disease

~~
xiii
FDIC - Family Dollar Insurance Company
FIBank - First International Bank
FIU FRO
-
-
Financial Intelligence Unit Functional Risk Officer
FSC - Financial Stability Committee
FX - Foreign Exchange
GBLL
- Global Bank Liberia Limited
GDP - Gross Domestic Product
GGFC - Ghana Growth Fund Company
GoL - Government of Liberia
GTAC - Global Trust Assurance Company
GTBLL HCPI
-
-
Guaranty Trust Bank Liberia Limited Harmonized Consumer Price Index
IBLL - International Bank Liberia Limited
IC - Investment Committee
ICA - Insurance Company of Africa
IDEA - Integrated Data Extraction Analysis
IFC - International Finance Corporation
IFRS - International Financial Reporting Standards
IIA - Institute of Internal Auditors
IICL - International Insurance Corporation of Liberia
IIP - International Investment Position
IMF - International Monetary Fund
IPPF - International Professional Practice Framework
LBA - Liberia Bankers Association
LBDI
- Liberian Bank for Development and Investment
~~
xiv
LCC LCMMCI LCUNA
-
-
-
Lonestar Cell Communication Lonestar Cell Mobile Money Company Incorporated Liberia Credit Union National Association
LEAF - Loan Extension and Availability Facility
LEDFC LIBA LISGIS LNP LRA
-
-
-
-
-
Liberian Enterprise Development Finance Company Liberia Business Association Liberia Institute of Statistics and Geo-information Services Liberia National Police Liberia Revenue Authority
LRC LWG M1 M2
-
-
-
-
Law Reform Commission Liquidity Working Group Narrow Money Broad Money
M&A - Ministries and Agencies
MBA MDI MFDP MFI
-
-
-
-
Mutual Benefit Assurance Microfinance Deposit-Taking Institutions Ministry of Finance and Development Planning Microfinance Institutions
MIC MIS
-
-
Medicare Insurance Company Management Information System
MMPRC NDA NEPS
-
-
-
Money Management and Policy Review Committee Net Domestic Asset National Electronic Payment Switch
NPLs - Non-Performing Loans
OIC
- OMEGA Insurance Company
~~
xv
OPEC
Organization for Petroleum Exporting Countries
PFM - Public Financial Management
PIC POS
-
-
Palm Insurance Company Point of Sale
PSPSC - Payments System Project Steering Committee
RCFIs - Rural Community Finance Institutions
RGDP ROA ROE
-
-
-
Real Gross Domestic Product Return on Asset Return on Equity
RPPD RSD RTGS SDR SIC
-
-
-
-
-
Research, Policy and Planning Department Regulations and Supervision Department Real-Time Gross Settlement System Special Drawing Rights SAAR Insurance Company
SIIC - Sky International Insurance Company
SME - Small-Medium Enterprises
SRF - Standardized Reporting Format
SRIC SSSS T-bills
-
-
-
Secure Risk Insurance Company Scriptless Securities Settlement System Treasury bills
ToT - Terms of Trade
UBALL UK UNCDF UNDP
-
-
-
-
United Bank for Africa Liberia Limited United Kingdom United Nations Capital Development Fund United Nations Development Program

~~
xvi
UNMIL US
-
-
United Nations Mission in Liberia United States
VSLA - Village Saving and Loan Associations
WABA - West African Bankers Association
WAIFEM - West African Institute for Financial and Economic Management
WAISA WAMA
-
-
West African Insurance Supervisors Association West African Monetary Agency
WAMI - West African Monetary Institute
WAMZ - West African Monetary Zone
WB - World Bank
WEO WOCCU
-
-
World Economic Outlook World Council of Credit Union
~~
xvii
HIGHLIGHTS World Economy
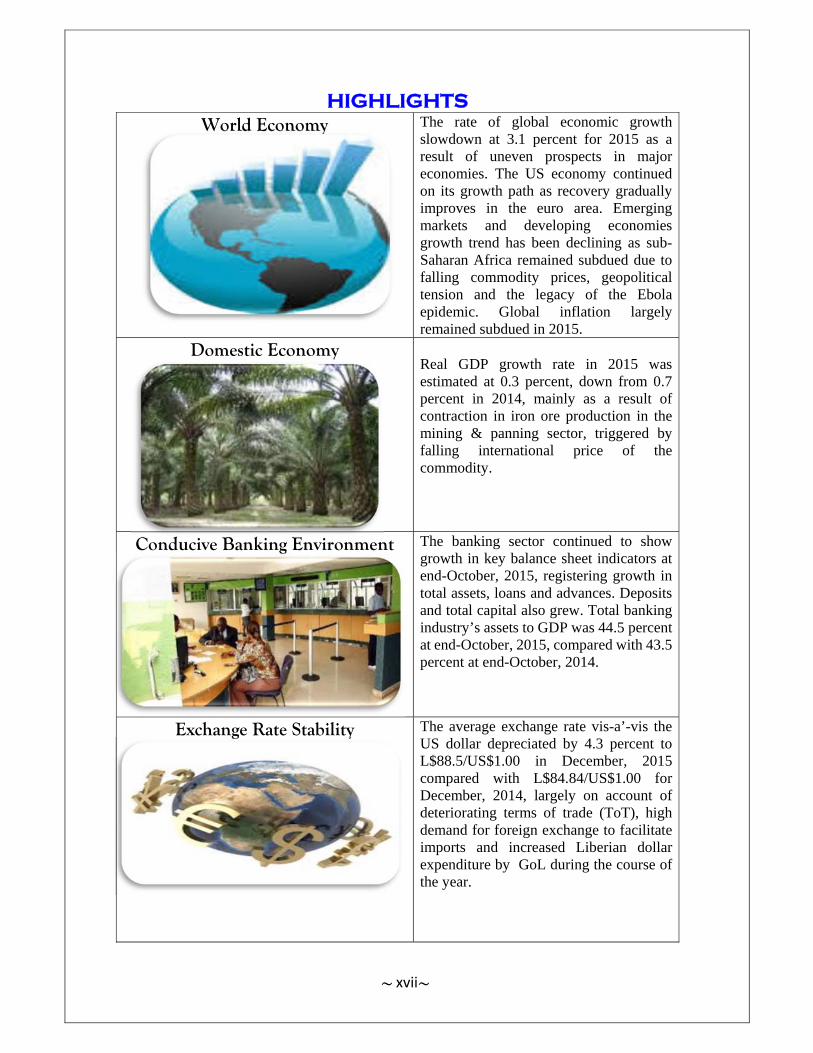
The rate of global economic growth slowdown at 3.1 percent for 2015 as a result of uneven prospects in major economies. The US economy continued on its growth path as recovery gradually improves in the euro area. Emerging markets and developing economies growth trend has been declining as sub-Saharan Africa remained subdued due to falling commodity prices, geopolitical tension and the legacy of the Ebola epidemic. Global inflation largely remained subdued in 2015.
Domestic Economy
Real GDP growth rate in 2015 was estimated at 0.3 percent, down from 0.7 percent in 2014, mainly as a result of contraction in iron ore production in the mining & panning sector, triggered by falling international price of the commodity.
Conducive Banking Environment
The banking sector continued to show growth in key balance sheet indicators at end-October, 2015, registering growth in total assets, loans and advances. Deposits and total capital also grew. Total banking industry’s assets to GDP was 44.5 percent at end-October, 2015, compared with 43.5 percent at end-October, 2014.
Exchange Rate Stability
The average exchange rate vis-a’-vis the US dollar depreciated by 4.3 percent to L$88.5/US$1.00 in December, 2015 compared with L$84.84/US$1.00 for December, 2014, largely on account of deteriorating terms of trade (ToT), high demand for foreign exchange to facilitate imports and increased Liberian dollar expenditure by GoL during the course of the year.

~~
xviii
Performance in Meeting WAMZ
Criteria
Cordial working relationship with traditional multilateral partners including the International Monetary Fund (IMF), World Bank (WB), and the African Development Bank (AfDB) was maintained during the year. The CBL collaborated with sub-regional institutions including the West African Monetary Institute (WAMI), West African Monetary Agency (WAMA), West African Institute for Financial and Economic Management (WAIFEM) and the Association of African Central Banks (AACB). Liberia’s performance on the quantitative macroeconomic convergence scale for 2015 improved, satisfying 3 primary and the 2 secondary convergence criteria, compared with 3 and 1 for 2014, respectively.
Payments System
The CBL made significant progress in the implementation of the National Payments Systems Project during the year. The upgrading of the CBL payment infrastructure has been substantially completed. The key solution components of the modernization that include Real-Time Gross Settlement System (RTGS), Scripless Securities Settlement System (SSSS), Automated Check Processing (ACP) and Automated Clearing House (ACH) system have been deployed, integrated and operationalized.
Microfinance
During the course of the year, the CBL supported the establishment of 5 additional RCFIs. The promotion and establishment of RCFIs throughout the country, particularly in places without formal financial institutions, remains a cardinal objective of the CBL’s financial inclusion agenda. The CBL completed and adopted the new Credit Union Regulations and provided support initiatives intended to enhance job creation and improve access to finance.

~~
xix
Reserve Position of the Bank
Liberia’s gross external reserves including gross SDR at end-December, 2015, stood at US$560.6 million, from US$532.2 million at end-December, 2014; while the net reserves including net SDR at end-December, 2015 was US$164.0 million, compared with US$227.9 million for 2014.
Treasury Operations
During 2015, a total of L$2.8 billion of GoL T-bills was issued with a redemption of L$766.0 million. Similarly, CBL notes issued during the year amounted to L$2.8 billion.
The Non-Bank Financial Sector
The new Insurance Law of 2013 was passed into law, replacing the 1973 Act. Several regulations, aimed at further strengthening the sector, were issued and published. At end-December, 2015, the total number of licensed foreign exchange bureaux was 122, reflecting an increase of 9.9 percent over 2014. Mobile money services are now being offered in all parts of the country.
Inflation
Inflation during the year was contained in single digit mainly on account of favorable global oil prices and prudent liquidity management by the CBL. Average annual headline inflation for 2015, stood at 7.8 percent, from 9.9 percent for the same period in 2014.
Core inflation which excludes food and transport from the overall Consumer Price Index (CPI) declined to 9.9 percent at end-December, 2015, from 6.1 percent in 2014.
Insurance The CBL, working in collaboration with development partners and other stakeholders, continued to strengthen the legal, institutional, and regulatory framework of the insurance sector. The insurance sector’s branch network increased from 30 in 2014 to 31 in 2015.
~~
xx
Enterprise Risk Management
The development of the CBL Risk Statement and Risk Management Framework and Governance Charter for the Board and its sub-committees were undertaken by of the CBL in helping to strengthen risk management and enhance governance at the CBL.
~~
1
MISSION AND OBJECTIVES
MISSION STATEMENT
The Central Bank of Liberia was created by an Act of the National Legislature in 1999 as a functionally
independent institution which seeks to carry out its statutory responsibility in the public interest. It is to
contribute to the sound economic and financial well-being of the country.
OBJECTIVES
The Bank seeks to achieve this mission by devising and pursuing policies designed to:
promote, achieve and maintain price stability in the Liberian economy;
maintain constant regulatory surveillance and effective prudential controls over the domestic
financial sector, while encouraging competition, improved financial services and accessibility
for the benefit of the public;
encourage the mobilization of domestic and foreign savings and their efficient allocation for
productive economic activities to engender sustained economic growth and development;
promote macroeconomic stability; internal and external equilibrium in the national economy;
facilitate the creation of financial and capital markets that are capable of responding to the
needs of the national economy;
foster monetary, credit and financial conditions conducive to orderly, balanced and sustained
economic growth and development and
provide sound economic and financial advice to the Government.

~~
2
BOARD OF GOVERNORS AS AT DECEMBER 31, 2015
CHAPTER I
Mr. Milton Weeks Board Member
Dr. J. Mills Jones Executive Governor and Chairman of the Board
Mr. David M. Farhat Board Member
Mrs. Melisa Emeh Board Member
~~
3
CHAPTER I GOVERNANCE AND ORGANIZATIONAL STRUCTURE
1.1 The Board of Governors
Under the CBL’s Act of 1999 in part IV Section 9, the overall responsibility for the operations
of the Bank is vested in the Board of Governors. It is responsible for the formulation and
implementation of the country’s monetary policy so as to ensure that the principal objectives
of the Bank as set out in the Act are achieved. To this end, the Board has a direct oversight in
the strategic planning and determination of the Bank’s broad policy framework. For the full
operationalization of the Bank, the Board approves the annual budget, monitors the financial
and operational performance of the Institution, receives reports from the external auditors,
and when it deems necessary, it may call for policy review. The Board of Governors
comprises 5 members who are appointed by the President of Liberia and confirmed by the
Liberian Senate. However, the current Board comprises of 4 members. The Executive
Governor steers the day-to-day activities of the Bank and Chairs the Board.
As at end-December, 2015, the Board of Governors was composed of the following:
1. Dr. J. Mills Jones – Executive Governor/Chairman
2. Mr. David M. Farhat – Member
3. Mrs. Melisa Emeh – Member
4. Mr. Milton Weeks – Member

~~
4
Chart 1: Organizational Structure As at December 31, 2015
1.2 Committees of the Board
The Board of Governors is currently composed of 2 committees, namely: the Audit and the
Investment. The Audit Committee (AC) has a mandate to supervise compliance with
operational, statutory and international standards and internal controls procedures. On the
overall, the AC ensures that appropriate and adequate accounting procedures, practices and
controls are established. For the Investment Committee (IC), it has the mandate to assist the
CBL in finding innovative investment plans regarding the placement of the Bank’s financial
resources in line with its investment policy and make recommendations to the Board for
approval.
1.3 Policy Decisions by the Board
During 2015, the Board of Governors took the following decisions in response to the real and
potential impact of the Ebola epidemic on the banking system. The policy measures were
announced by the CBL on December 31, 2014 and took effect January 1, 2015 applicable for
the period of the Ebola Crisis (defined for the purpose of the policy measures as the period
covering July 1, 2014 – June 30, 2015). Below are highlights of the policy measures:
~~
5
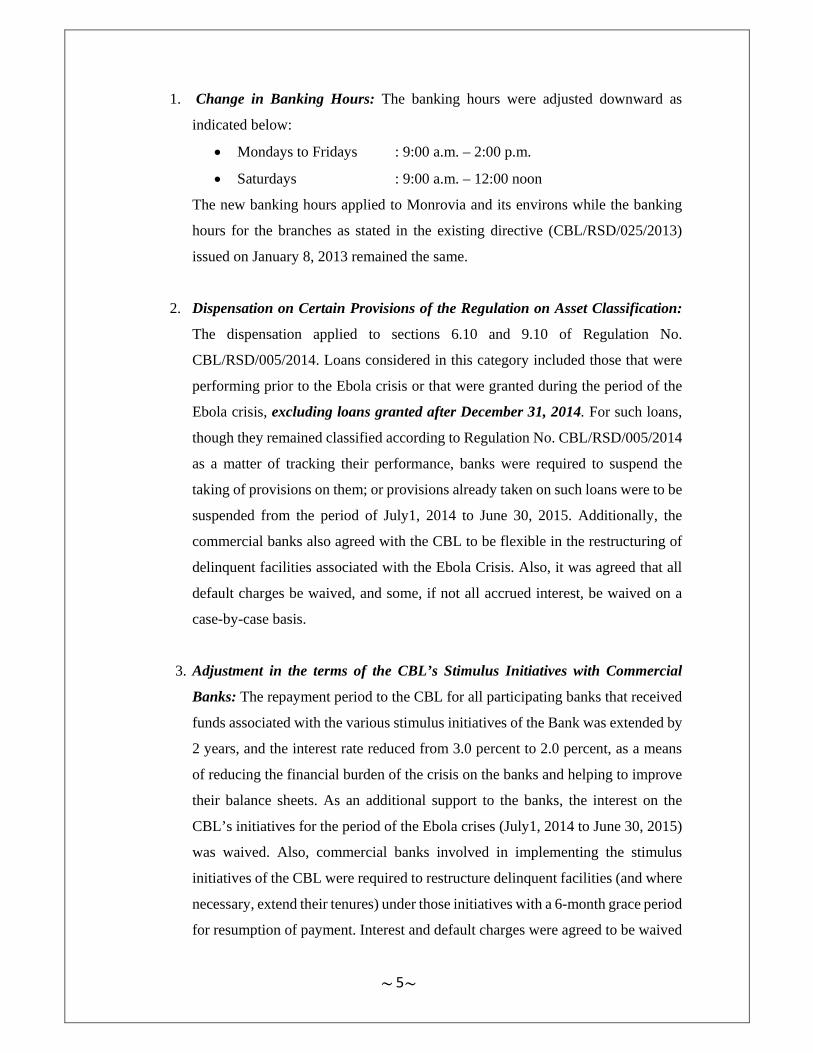
1. Change in Banking Hours: The banking hours were adjusted downward as
indicated below:
Mondays to Fridays : 9:00 a.m. – 2:00 p.m.
Saturdays : 9:00 a.m. – 12:00 noon
The new banking hours applied to Monrovia and its environs while the banking
hours for the branches as stated in the existing directive (CBL/RSD/025/2013)
issued on January 8, 2013 remained the same.
2. Dispensation on Certain Provisions of the Regulation on Asset Classification:
The dispensation applied to sections 6.10 and 9.10 of Regulation No.
CBL/RSD/005/2014. Loans considered in this category included those that were
performing prior to the Ebola crisis or that were granted during the period of the
Ebola crisis, excluding loans granted after December 31, 2014. For such loans,
though they remained classified according to Regulation No. CBL/RSD/005/2014
as a matter of tracking their performance, banks were required to suspend the
taking of provisions on them; or provisions already taken on such loans were to be
suspended from the period of July1, 2014 to June 30, 2015. Additionally, the
commercial banks also agreed with the CBL to be flexible in the restructuring of
delinquent facilities associated with the Ebola Crisis. Also, it was agreed that all
default charges be waived, and some, if not all accrued interest, be waived on a
case-by-case basis.
3. Adjustment in the terms of the CBL’s Stimulus Initiatives with Commercial
Banks: The repayment period to the CBL for all participating banks that received
funds associated with the various stimulus initiatives of the Bank was extended by
2 years, and the interest rate reduced from 3.0 percent to 2.0 percent, as a means
of reducing the financial burden of the crisis on the banks and helping to improve
their balance sheets. As an additional support to the banks, the interest on the
CBL’s initiatives for the period of the Ebola crises (July1, 2014 to June 30, 2015)
was waived. Also, commercial banks involved in implementing the stimulus
initiatives of the CBL were required to restructure delinquent facilities (and where
necessary, extend their tenures) under those initiatives with a 6-month grace period
for resumption of payment. Interest and default charges were agreed to be waived
~~
6
for the period of the Ebola crisis (July 1, 2014 to June 30, 2015). This was intended
to provide time for Liberian SMEs to restart their activities.
4. Payment of Outstanding Loan Obligations for all Private Schools: In the wake of
the prolonged closure of schools as a result of the Ebola crisis, which contributed
to increased debt burden of the private schools that borrowed from banks, the CBL
paid off the outstanding loan obligations of all concerned institutions, from
kindergarten through high school.
As a result of these policy measures, banks restructured 172 facilities amounting to
US$19.06 million and L$271.95 million. Some of the restructurings involved the
waiver of accrued interest (total of US$0.6 million) and default charges (amount of
L$2.27 million) by the banks. Additionally, the banks granted grace periods
between six to seven months and reduced interest rates especially for facilities
under the CBL stimulus programs.
5. New Regulations and Regulatory Policies
During the year, the CBL reviewed, amended and issued several additional
regulations and regulatory policies, as follows:
i. Regulations for the Licensing and Operations of Credit Unions in Liberia. As
part of the CBL’s efforts to reform the financial sector and to bring other
financial services providers under the regulation of the Central Bank of
Liberia as prescribed by section 4 (6) of the CBL Act, the Regulation &
Supervision Department along with the Microfinance & Financial Inclusion
Unit developed a Regulation for the licensing and operations of Credit
Unions in Liberia. These regulations were developed in collaboration with
Liberia Credit Union National Association (LCUNA) and the World Council
of Credit Union (WOCCU). The Credit Unions of Liberia had previously
been regulated under the Cooperative Development Agency (CDA) Act of
1938. These regulations are intended to strengthen the credit union regimes
and enhance governance and risk management system with the main
objective of transforming them into viable financial intermediaries and to
increase their outreach especially in rural communities.
~~
7
These regulations set the minimum standards for the licensing of credit
unions in Liberia.
ii. Licensing requirements for Insurance Brokers and Agents
In order to be recognized and certified as a person or entity engaged in
insurance intermediation, a well set criteria as well as standards are required
of every insurance intermediary (broker and agent) to be in full compliance
with and be licensed. These requirements include but not limited to
experience, financial commitment, education, competence, comportment,
etc.
6. Automation/Enhancement of the Supervisory Processes
As part of its efforts to reform and strengthen the financial sector, the Board
approved the procurement of robust banking software, for use by the CBL. The
software is being deployed by member Central Banks of the West African
Monetary Zone (WAMZ). The project commenced this year and is in an advanced
stage. When completed, the infrastructure will significantly enhance the
supervisory oversight of the CBL and policy response to issues evolving in the
banking sector on a real-time basis.
1.4 Internal Committees
The CBL, during the course of 2015 maintained 3 internal committees, namely: the Financial
Stability Committee (FSC), the Money Management and Policy Review Committee
(MMPRC), and the Payments System Project Steering Committee (PSPSC). The FSC
deliberated on several strategic issues with a view to safeguarding the stability of the financial
system from the perspective of banks and non-bank financial institutions and to ensure
efficiency in service delivery and greater degree of financial inclusion for both households
and businesses. The MMPRC considered various policy matters aimed at ensuring the
realization of the Bank’s primary goal of price stability and fostering balanced economic
growth; thus, contributing towards the broader national objective of sustained economic
development. Also, the development of the infrastructure upgrade for the National Payments
System and other related payments system issues were the main focus of the PSPSC during
the year.
~~
8
CHAPTER II THE GLOBAL ECONOMY
2.1 World Output Growth
In the October 2015 edition of the World Economic Outlook (WEO)1, the International
Monetary Fund (IMF) downgraded global economic growth forecast to 3.1 percent in 2015,
from an earlier projection of 3.3 percent for 2015 and 3.4 percent in 2014, due to the uneven
prospects arising from major world economies. Both short and long term forces such as
declining commodity prices, currencies depreciation in emerging market economies and
market volatility are expected to drive the slowdown in growth prospects. However, activity
is expected to be favorable both in advanced and emerging markets and developing economies
for 2016.
During the year, the US economy continued on its growth momentum path. Though there
were some hitches in the second quarter, underpinned by bad weather, reduced expenditure
in the oil sector, and port closure; the third quarter saw a pick up due to favorable expectations
from reduced energy prices, improvements in the housing market, along with other positive
prospects. Momentum in the US is expected to remain strong and will more than offset the
reduction in exports emanating from the appreciation of the dollar. Although long term risks
of aging population and weaker total factor productivity still remain the main constraints to
growth, medium term growth prospect for the US is favorable, with projected growth for 2015
and 2016 set at 2.6 percent and 2.8 percent, respectively (Table 1).
The euro area continued on the path of gradual recovery since the beginning of the year with
projected growth set at 1.5 percent for the year. The slight pick-up in activity during the year
was triggered by lower oil prices, monetary easing, increased domestic demand and positive
outlook on consumer prices. However, the crisis legacies, weak total factor productivity still
remained the major risk to seeing output reach its potential. In addition, weak investment and
geopolitical risk in some parts of the region could see growth trending downward in the
absence of policies to tackle these bottlenecks. According to the WEO October 2015 edition,
growth is projected to slightly increase to 1.6 percent in 2016.
1 https://www.imf.org/external/pubs/ft/weo/2015/02/pdf/text.pdf

~~
9
From a projected growth rate of 6.6 percent at the beginning of the year, emerging markets
and developing economies growth trend has been declining and is expected to decline further
to 4.0 percent. The decline in growth is mainly as a result of slowdown in investment in China.
Demand from China was weak as policy makers were keen on reducing vulnerabilities arising
from rapid credit and investment growth in previous years. In addition, lower global
commodity prices and tighter external financial conditions in advanced economies also helped
to subdue growth momentum. China is expected to moderate to 6.8 percent for the year and
further reduce to 6.3 percent in 2016. In India, growth prospect remained stable at 7.3 percent
and is expected to strengthen to 7.5 percent next year mainly as a result of policy reforms,
increased investment and lower commodity prices.
Table 1: Growth of Selected Global Output
Year-over-Year
Projections Difference from April 2015 WEO
2014 2015 2016 2015 2016
World Output 3.4 3.1 3.6 -0.2 -0.2
Advanced Economies 1.8 2.0 2.2 -0.1 -0.2
United States 2.4 2.6 2.8 0.1 -0.2
Euro Area 0.9 1.5 1.6 0.0 -0.1
Japan -0.1 0.6 1.0 -0.2 -0.2
United Kingdom 3.0 2.5 2.2 0.1 -0.0
Canada 2.4 1.0 1.7 -0.5 -0.4
Emerging Markets and Developing Economies 4.6 4.0 4.5 -0.2 -0.2
Emerging Developing Asia 6.8 6.5 6.4 -0.1 0.0
China 7.3 6.8 6.3 0.0 0.0
India 7.3 7.3 7.5 -0.2 0.0
Latin America & the Caribbean 1.3 -0.3 0.8 -0.8 -0.9
Middle East, North Africa, Afghanistan & Pakistan 2.7 2.5 3.9 -0.1 0.1
Sub-Sahara Africa 5.0 3.8 4.3 -0.6 -0.8
Consumer Prices
Advanced Economies 1.4 0.3 1.2 0.3 0.0
Emerging Markets and Developing Economies 5.1 5.6 5.1 0.1 0.3 Source: IMF World Economic Outlook October 2015 Edition
Declining commodity prices, geopolitical tension and the Ebola epidemic that affected some
parts of the region kept growth prospect in Sub-Saharan Africa subdued during the year. The
~~
10
downward spiral in growth momentum was also attributed to slower demand from the region’s
largest trading partner (China). According to the October 2015 edition of the WEO, growth is
projected to fall to 3.8 percent for the year. However, in 2016 momentum is expected to pick
up with a projected growth rate of 4.3 percent mainly as a result of projected increase in
external demand, slight recovery in oil prices, and improvement in the outlook for Ebola-
affected countries.
2.2 Global Inflation
Global inflation has generally remained subdued during the year, backed by lower inflation
in major economies. In advanced economies, inflation is expected to decline to 0.3 percent as
a result of lower oil prices, but will increase to 5.6 percent for emerging market and
developing economies, particularly commodity exporters, as a result of exchange rate
depreciation. In emerging markets and developing economies inflation is projected to decline
in 2016 while it is projected to increase in advanced economies but will remain generally
below central bank targets (Table 1).
2.3 Commodity Market
Low demand as a result of weak and uneven global growth prospects, raddled with growing
uncertainties and geopolitical instabilities coupled with strong supply, sustained the declines
in global commodity prices during the year. Crude oil, iron ore, rubber and gold are some of
the major commodities whose prices plummeted during the year.
2.3.1 Crude Oil2
On the back of weak and uneven global growth prospects in the face of resilient crude oil
production and supply, the annual average price of crude oil plummeted by 46.7 percent to
US$51.2 per barrel in 2015 from US$96.2 per barrel in 2014.
Despite growing geopolitical instabilities in key oil producing regions and declining oil
investments, strong crude oil supply by the Saudi-led Organization for Petroleum Exporting
Countries (OPEC), Russia and Iran (after the removal of economic sanctions) in the fight for
maintaining market shares drove excess supply over demand during the year and may
continue into the medium term. In addition, the recent commitments by advanced and
2 Crude Oil is the simple average of three spot prices: Dated Brent, West Texas Intermediate, and the Dubai Fatah.

~~
11
emerging markets & developing economies to reduce their carbon emissions, could have
additional effect on oil demand in the medium to long run and is likely to put further
downward pressure on energy prices.
2.3.2 Iron Ore
On account of strong supply in the face of weakening demand, mainly as a result of the
slowdown in the Chinese real estate sector and steel industry, iron ore price tumbled by 42.2
percent to US$56.0 per metric ton in 2015, from US$96.8 per metric ton in 2014.
Relative to the annual average price of 2013, the price of the commodity plummeted by 58.2
percent, from US$135.4 per metric ton. Underpinned by weaker demand and supply gluts,
iron ore price is expected to come under further downward pressure in the short-to-medium
term.
2.3.3 Rubber
Explained by similar demand-supply imbalances, rubber price fell by 20.4 percent to an
annual average of US$1,556.6 per metric ton in 2015, from US$1,956.7 per metric ton in
2014. The increasing use of synthetic rubber (as a substitute for natural rubber) in the low-
oil-price environment and the slowdown in industrial activity, mainly in China, explained the
decline in the demand for rubber, thus driving the tumbling in the price of the commodity.
2.3.4 Round Logs
The average price of round log fell by 13.1 percent to US$245.0 per cubic meter in 2015, from
US$282.0 per cubic meter in 2014, largely indicative of low demand as supply remained
relatively stable. Round log price declined by 19.8 percent in 2015, compared with the average
price of US$305.4 per cubic meter recorded in 2013.
2.3.5 Rice
Driven largely by relatively weaker demand for the commodity in 2015, particularly from
sub-Saharan Africa, rice price fell by 11.1 percent to US$379.0 per metric ton in 2015, from
US$426.5 per metric ton in 2014. Global rice output is projected to decline in 2016 with an
expected pick up in its price trend on account of unfavorable weather condition and production
environments in key rice-producing economies.
~~
12
2.3.6 Cocoa Beans
World market price of cocoa bean increased over its 2014 average price level. The price of
cocoa increased relative to its 2014 and 2013 annual averages to US$ 3,116.03 per metric ton
for the eleven month period ending November, 2015, from US$3,062.8 per metric ton and
US$2,439.1 per metric ton, respectively. The rise in the price of cocoa bean during the year
was due to strong demand for the commodity amidst slightly weaker supply from cocoa
exporters. Outlook for the commodity remains favorable for 2016, mainly due to strong
demand forecast.
2.4 Implication for the Liberian Economy
The Liberian economy is projected to grow at 0.3 percent in 2015, down from 0.7 percent in
2014 and 8.7 percent in 2013, largely on account of the negative effects of the Ebola crisis
and the persistent fall in global commodity price. Though inflation has been contained in
single digit, exchange rate depreciation pressure could heighten due to the fall in commodity
prices with implication for a worsening current account deficit. With prudent macroeconomic
policies in support of efforts to diversify the economy that will help raise output and
employment could help improve growth prospects in the medium term.

~~
13
CHAPTER III DEVELOPMENTS IN THE LIBERIAN ECONOMY
3.1 Overview
Constrained by the Ebola legacy and falling commodity prices on the world market, Liberia
Real GDP marginally grew to an estimated US$898.9 million in 2015, from US$896.4 million
a year ago. The slight increase in Real GDP was attributed to increases in the services,
manufacturing and forestry sectors.
Annual headline inflation on average was contained in single digit at an estimated 7.8 percent
at end-2015 compared with the 9.9 percent inflation rate in 2014. The decline in inflation was
attributed to favourable global oil prices and the prudent management of liquidity by the CBL;
despite the exchange rate pressure in the third quarter of the year.
Commercial bank’s credit to all sectors of the economy at end-November, 2015 reflected a
growth rate of 23.7 percent. The growth in credit was mainly triggered by the resumption of
activities in the economy with all sectors registering credit growths. Distribution of credits
revealed that the private sector gained momentum and accounted for 96.7 percent while the
public sector share was 3.3 percent.
During the year in review, interest rate developments showcased mixed variations. While the
average lending, personal loan and mortgage rates all registered increases, the average rates
on time deposit and certificate of deposits both declined. Monetary aggregates at end-October,
2015, registered increases compared to their levels recorded in 2014. Both Broad Money (M2)
and Narrow Money (M1) supply grew by 9.5 percent and 6.5 percent, respectively.
From provisional estimates, Liberia’s overall balance of payments (BOP) position recorded a
deficit of US$51.8 million in 2015, from a deficit of US$38.2 million in 2014, largely driven
by 5.3 percent worsening in the current account deficit due to deterioration in trade. The
Liberian dollar on average depreciated by 4.3 percent at end December, 2015, compared with
the rate recorded at end-December, 2014. The depreciation in the exchange rates were largely
driven by deterioration in the terms of trade, high demand for foreign exchange to service
import bills and the increased Liberian dollar expenditure by GoL.
The overall public debt stock of the country recorded at end-September 2015 declined by 6.2
percent to 31.7 percent of GDP compared with the 34.5 percent of GDP recorded at end-

~~
14
September, 2014. The fall in the total public debt stock was attributed to declines in external
and domestic debt stocks, respectively.
3.2 GDP Performance
Real GDP growth in 2015 is estimated at 0.3 percent, 0.4 percentage points lower than the 0.7
percent reported for 2014. The slowdown in growth was mainly led by declines in the forestry
sector to 2.0 percent (from 2.2 percent) and the mining & panning sector through iron ore
production to negative 17.0 percent (from 3.3 percent); even though the other major sectors
are expected to expand; the agriculture and fisheries sector is expected to registered slight
improvement in its growth, to negative 1.1 percent (from negative 3.7 percent), while the
manufacturing and services sectors are expected to grow to 6.1 percent and 5.0 percent, from
negative 0.7 percent and negative 2.3 percent, respectively.
Growth in 2016 is projected at 3.9 percent and is expected to be driven by all the major sectors
except forestry which is projected to remain stable. However, the expected protracted
weaknesses in global iron ore and rubber prices is likely to contribute to a further declines in
the mining and agriculture sectors which could dent 2016 growth prospects.
Table 2: Liberia: Sectoral Origin of Gross Domestic Product (GDP)
(At 1992 Constant Prices: 2013-2016) (In Millions of US$)
Sector 2013 2014 2015 2016** Agriculture & Fisheries 225.1 216.7 214.4 217.5 Forestry 90.9 92.9 94.7 96.6 Mining & Panning 119.1 131.1 102.2 101.2 Manufacturing 64.9 64.5 68.4 76.1 Services 390.3 399.2 419.2 442.9 Real Gross Domestic Product 890.3 896.4 898.9 934.3
Source: Liberian Authority and IMF Staff estimates and projections ** Projection
3.3 Real Sector Performance
Real sector performance in 2015 varied across sectors as reflected in the agriculture and
forestry sector which saw rubber output declining by 9.2 percent, to an estimated 54,406
metric tons, down from 59,892 metric tons produced in the previous year. The fall in
production was partly due to the decline in the average price of the commodity on the global
market (Table 2).

~~
15
Cocoa production during the year expanded by an estimated 56.9 percent to 10,358 metric
tons, up from 6,602metric tons reported in 2014. The surge in output was mainly due to
increased supply of the commodity as a result of increased access to abandon farms after the
cessation of the EVD coupled with an increase in the international price of the commodity.
Round logs produced at end-2015 rose by an estimated 3.0 percent to 179,739 cubic meters,
from 174,436 cubic meters recorded in the previous year. The slight rise in production was
largely explained by the annulment of the government moratorium on the production of the
commodity (Table 3).
Table 3 Key Agricultural & Forestry Production (2013-2015)
Commodity Unit 2013+ 2014 2015** Rubber Mt. 56,431 59,892 54,406 Cocoa Beans Mt. 9,084 6,602 10,358 Coffee Mt. 203 - 57 Round Logs M3 84,556 174,436 179,739 Sawn Timber Pcs. 501,602 763,987 832,946
Source: Ministry of Commerce & Industry (MOCI); Liberia Produce & Marketing Corporation (LPMC); Forestry Development Authority (FDA) + Revised/Actual ** Projection
Cement output in the year was estimated at 298,437 metric tons, 1.0 percent or 3,084 metric
tons higher than the production level of 2014. The rise in production was attributed to
increased construction activities.
Table 4: Key Industrial Output (2013-2015)
Commodity Unit 2013+ 2014 2015** Cement Mt. 193,993 295,353 298,437Beverages Liter 29,565,501 21,282,032 22,610,265Paints Gallon 283,987 209,741 265,934Candle Kg 172,075 195,196 164,153Clorox Liter 766,209 1,128,740 1,102,626Rubbing Alcohol Liter 260,557 254,760 298,011Mattresses Pcs. 100,346 116,087 111,787Gold Ounce 18,868 19,938 15,494Diamond Carat 47,819 74,882 73,729Iron ore Mt 4,948,095 5,189,723 3,202,402Finished Water Gal 1,809,781,772 1,464,866,002 1,629,838,695
Source: Ministry of Commerce & Industry (MOCI); Ministry of Lands, Mines & Energy; Liberia Water and Sewer Corporation + Revised /Actual ** Projection
Beverages production at end-2015 expanded by an estimated 6.2 percent, to 22.6 million
liters, up from 21.3 million liters recorded in the previous year. The rise in output was on

~~
16
account of increased demand for the commodity in response to the cessation of the health
crisis.
Total paint (water and oil) produced in the year was estimated at 265,934 gallons, up from
209,741 gallons in 2014. The 26.8 percent or 56,193 gallons rise in output was a result of
increased demand for paint on the local market in response to the upsurge in construction
activities in the country.
Candle output in 2015 was estimated at 164,153 kilograms, 15.9 percent lower than the
195,196 kilograms produced in 2014. The fall in production was a result of increased usage
of fluorescent lamps which are used as safer substitutes for candles and the gradual expansion
of electricity. Production of clorox during the year was estimated at 1,102,626 liters, 2.3
percent lower than the 1,128,740 liters produced in the preceding year. The fall in clorox
production was largely explained by decline in demand due to the cessation of the Ebola
epidemic.
Total estimated production of rubbing alcohol at end-2015 was 298,011 liters, 17.0 percent
higher than the output’s level of 2014. Output of mattresses in 2015 was estimated at 111,787
pieces, recording a decline of 3.7 percent or 4,300 pieces compared with the previous year.
Total iron ore produced at end -2015 was estimated at 3,202,402 metric tons. Matched against
the 5,189,723 metric tons produced in the previous year, output declined by 38.3 percent. The
slump in iron ore output was mainly explained by the unfavorable global price of the
commodity which is serving as disincentive for higher production and the slowdown in
demand for the commodity, mainly emanating from China. Similarly, gold and diamond,
respectively, declined to an estimated 15,494 ounces and 73,729 carats (from 19,938 ounces
and 74,882 carats in 2014).The contraction in production was attributed to their declining
prices on the global market. Total supply of finished water in 2015 was estimated at 1.6 billion
gallons, up from 1.5 billion gallons supplied in the previous year. The rise in supply was a
result of repair works on the main supply line from the water processing plant (Table 4).
3.4 Price Developments
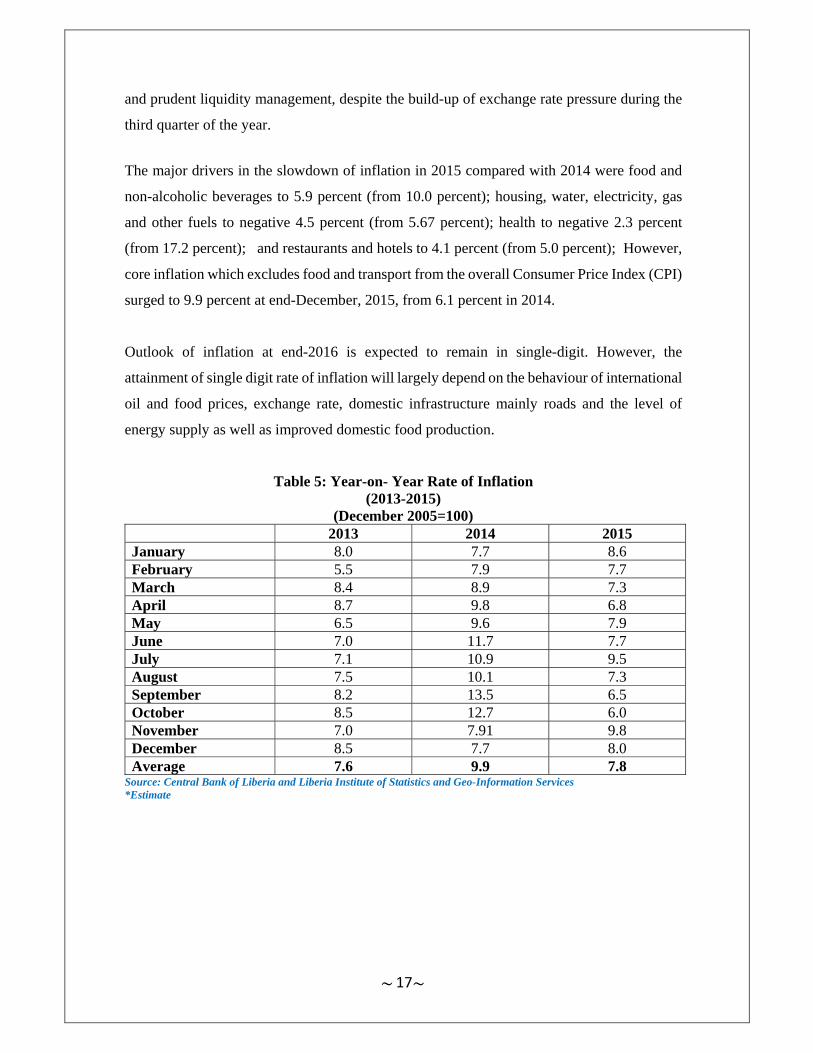
Average annual headline inflation in 2015 was contained at an estimated 7.8 percent, down
from an average of 9.9 percent a year ago, mainly on account of favourable global oil prices
~~
17
and prudent liquidity management, despite the build-up of exchange rate pressure during the
third quarter of the year.
The major drivers in the slowdown of inflation in 2015 compared with 2014 were food and
non-alcoholic beverages to 5.9 percent (from 10.0 percent); housing, water, electricity, gas
and other fuels to negative 4.5 percent (from 5.67 percent); health to negative 2.3 percent
(from 17.2 percent); and restaurants and hotels to 4.1 percent (from 5.0 percent); However,
core inflation which excludes food and transport from the overall Consumer Price Index (CPI)
surged to 9.9 percent at end-December, 2015, from 6.1 percent in 2014.
Outlook of inflation at end-2016 is expected to remain in single-digit. However, the
attainment of single digit rate of inflation will largely depend on the behaviour of international
oil and food prices, exchange rate, domestic infrastructure mainly roads and the level of
energy supply as well as improved domestic food production.
Table 5: Year-on- Year Rate of Inflation (2013-2015)
(December 2005=100) 2013 2014 2015 January 8.0 7.7 8.6 February 5.5 7.9 7.7 March 8.4 8.9 7.3 April 8.7 9.8 6.8 May 6.5 9.6 7.9 June 7.0 11.7 7.7 July 7.1 10.9 9.5 August 7.5 10.1 7.3 September 8.2 13.5 6.5 October 8.5 12.7 6.0 November 7.0 7.91 9.8 December 8.5 7.7 8.0 Average 7.6 9.9 7.8
Source: Central Bank of Liberia and Liberia Institute of Statistics and Geo-Information Services *Estimate
~~
18
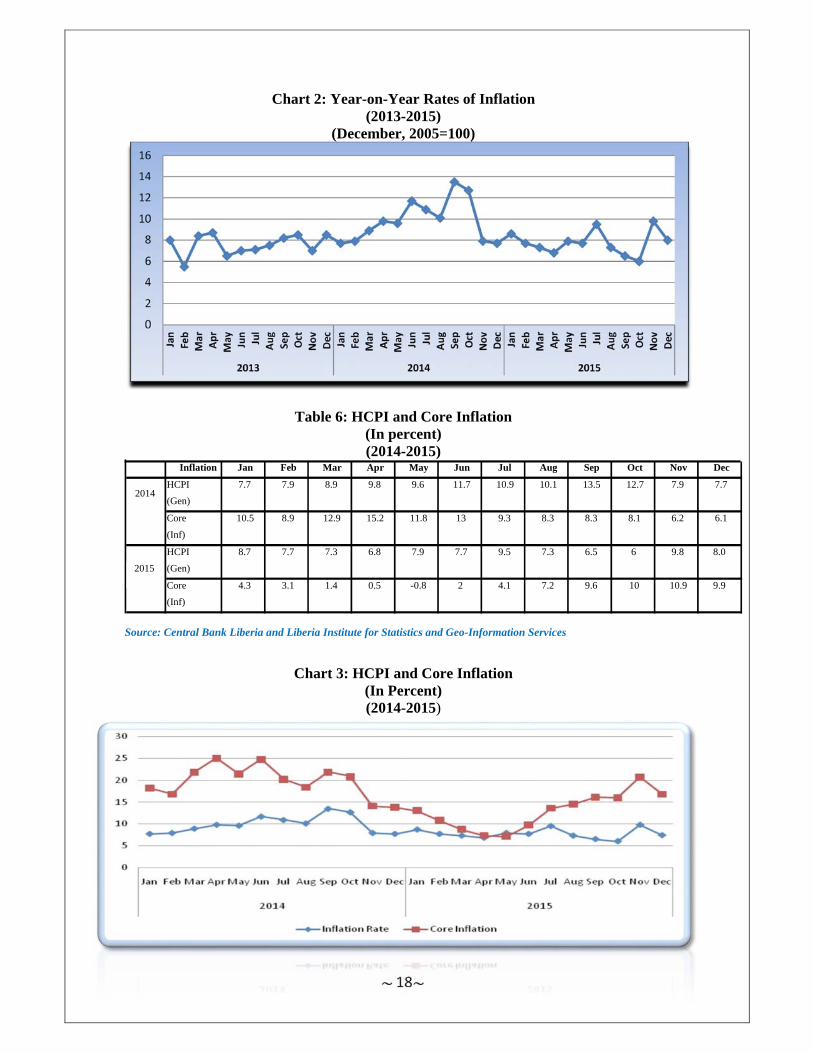
Chart 2: Year-on-Year Rates of Inflation (2013-2015)
(December, 2005=100)
Table 6: HCPI and Core Inflation (In percent) (2014-2015)
Source: Central Bank Liberia and Liberia Institute for Statistics and Geo-Information Services
Chart 3: HCPI and Core Inflation (In Percent) (2014-2015)
0
2
4
6
8
10
12
14
16Jan
Feb
Mar
Apr
May Jun
Jul
Aug
Sep
Oct
Nov
Dec
Jan
Feb
Mar
Apr
May Jun
Jul
Aug
Sep
Oct
Nov
Dec
Jan
Feb
Mar
Apr
May Jun
Jul
Aug
Sep
Oct
Nov
Dec
2013 2014 2015
Inflation Jan Feb Mar Apr May Jun Jul Aug Sep Oct Nov Dec
HCPI (Gen)
Core (Inf)
HCPI (Gen)
Core (Inf)
4.1 7.2 9.6 10 10.9 9.9
6 9.8 8.0
4.3 3.1 1.4 0.5 -0.8 2
6.8 7.9 7.7 9.5 7.3 6.5
8.3 8.3 8.1 6.2 6.1
8.7 7.7 7.3
7.9 7.7
10.5 8.9 12.9 15.2 11.8 13 9.3
9.6 11.7 10.9 10.1 13.5 12.72014
7.7 7.9 8.9 9.8
2015
~19~
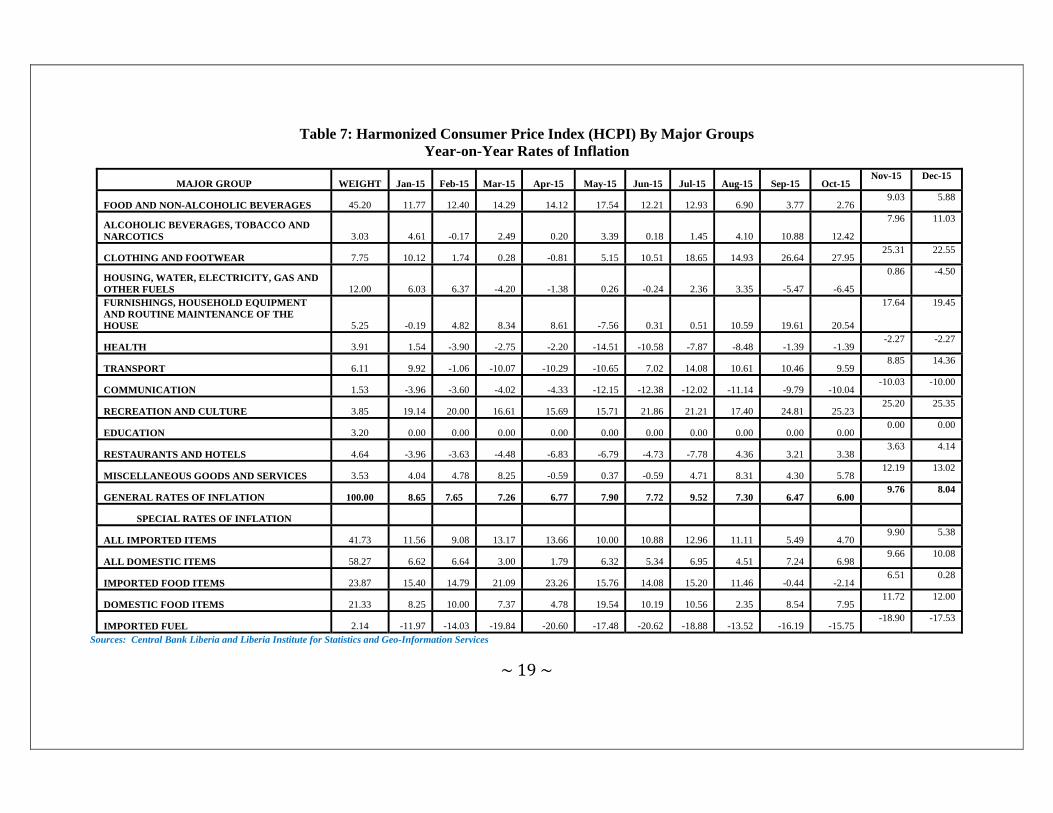
Table 7: Harmonized Consumer Price Index (HCPI) By Major Groups Year-on-Year Rates of Inflation
MAJOR GROUP WEIGHT Jan-15 Feb-15 Mar-15 Apr-15 May-15 Jun-15 Jul-15 Aug-15 Sep-15 Oct-15 Nov-15 Dec-15
FOOD AND NON-ALCOHOLIC BEVERAGES 45.20 11.77 12.40 14.29 14.12 17.54 12.21 12.93 6.90 3.77 2.76 9.03 5.88
ALCOHOLIC BEVERAGES, TOBACCO AND NARCOTICS 3.03 4.61 -0.17 2.49 0.20 3.39 0.18 1.45 4.10 10.88 12.42
7.96 11.03
CLOTHING AND FOOTWEAR 7.75 10.12 1.74 0.28 -0.81 5.15 10.51 18.65 14.93 26.64 27.95 25.31 22.55
HOUSING, WATER, ELECTRICITY, GAS AND OTHER FUELS 12.00 6.03 6.37 -4.20 -1.38 0.26 -0.24 2.36 3.35 -5.47 -6.45
0.86 -4.50
FURNISHINGS, HOUSEHOLD EQUIPMENT AND ROUTINE MAINTENANCE OF THE HOUSE 5.25 -0.19 4.82 8.34 8.61 -7.56 0.31 0.51 10.59 19.61 20.54
17.64 19.45
HEALTH 3.91 1.54 -3.90 -2.75 -2.20 -14.51 -10.58 -7.87 -8.48 -1.39 -1.39 -2.27 -2.27
TRANSPORT 6.11 9.92 -1.06 -10.07 -10.29 -10.65 7.02 14.08 10.61 10.46 9.59 8.85 14.36
COMMUNICATION 1.53 -3.96 -3.60 -4.02 -4.33 -12.15 -12.38 -12.02 -11.14 -9.79 -10.04 -10.03 -10.00
RECREATION AND CULTURE 3.85 19.14 20.00 16.61 15.69 15.71 21.86 21.21 17.40 24.81 25.23 25.20 25.35
EDUCATION 3.20 0.00 0.00 0.00 0.00 0.00 0.00 0.00 0.00 0.00 0.00 0.00 0.00
RESTAURANTS AND HOTELS 4.64 -3.96 -3.63 -4.48 -6.83 -6.79 -4.73 -7.78 4.36 3.21 3.38 3.63 4.14
MISCELLANEOUS GOODS AND SERVICES 3.53 4.04 4.78 8.25 -0.59 0.37 -0.59 4.71 8.31 4.30 5.78 12.19 13.02
GENERAL RATES OF INFLATION 100.00 8.65 7.65 7.26 6.77 7.90 7.72 9.52 7.30 6.47 6.00 9.76 8.04
SPECIAL RATES OF INFLATION
ALL IMPORTED ITEMS 41.73 11.56 9.08 13.17 13.66 10.00 10.88 12.96 11.11 5.49 4.70 9.90 5.38
ALL DOMESTIC ITEMS 58.27 6.62 6.64 3.00 1.79 6.32 5.34 6.95 4.51 7.24 6.98 9.66 10.08
IMPORTED FOOD ITEMS 23.87 15.40 14.79 21.09 23.26 15.76 14.08 15.20 11.46 -0.44 -2.14 6.51 0.28
DOMESTIC FOOD ITEMS 21.33 8.25 10.00 7.37 4.78 19.54 10.19 10.56 2.35 8.54 7.95 11.72 12.00
IMPORTED FUEL 2.14 -11.97 -14.03 -19.84 -20.60 -17.48 -20.62 -18.88 -13.52 -16.19 -15.75 -18.90 -17.53
Sources: Central Bank Liberia and Liberia Institute for Statistics and Geo-Information Services
~20~
3.5 Monetary Developments
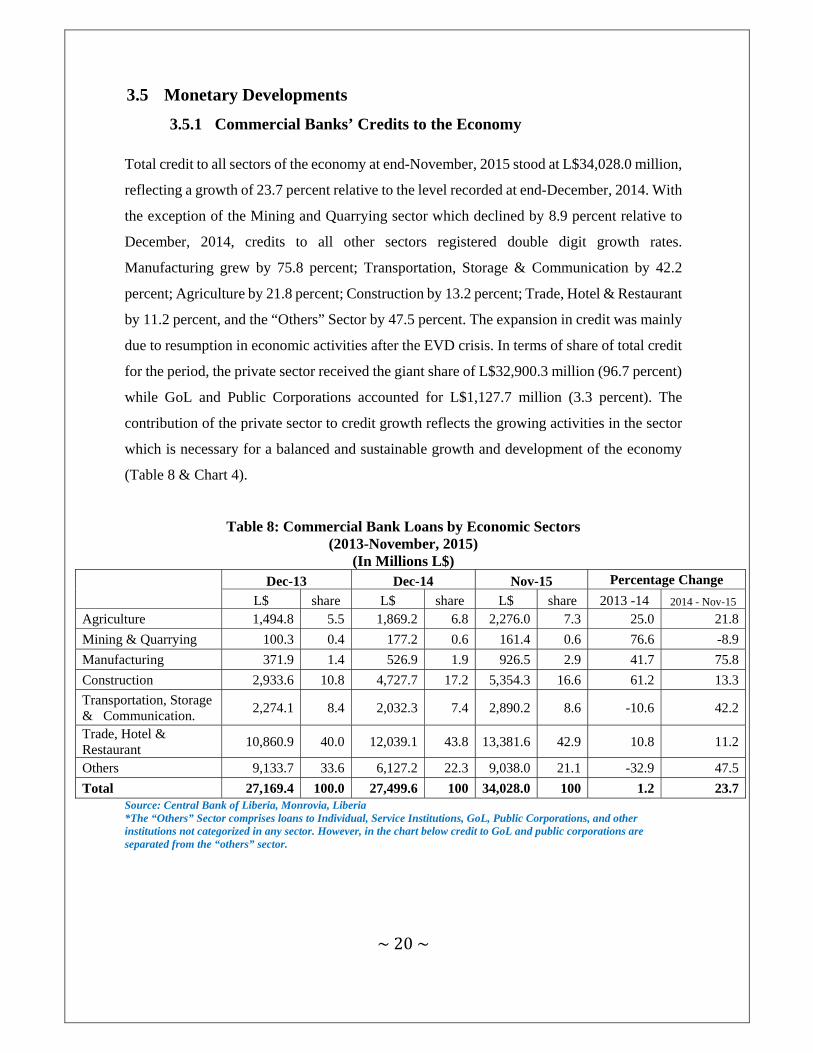
3.5.1 Commercial Banks’ Credits to the Economy
Total credit to all sectors of the economy at end-November, 2015 stood at L$34,028.0 million,
reflecting a growth of 23.7 percent relative to the level recorded at end-December, 2014. With
the exception of the Mining and Quarrying sector which declined by 8.9 percent relative to
December, 2014, credits to all other sectors registered double digit growth rates.
Manufacturing grew by 75.8 percent; Transportation, Storage & Communication by 42.2
percent; Agriculture by 21.8 percent; Construction by 13.2 percent; Trade, Hotel & Restaurant
by 11.2 percent, and the “Others” Sector by 47.5 percent. The expansion in credit was mainly
due to resumption in economic activities after the EVD crisis. In terms of share of total credit
for the period, the private sector received the giant share of L$32,900.3 million (96.7 percent)
while GoL and Public Corporations accounted for L$1,127.7 million (3.3 percent). The
contribution of the private sector to credit growth reflects the growing activities in the sector
which is necessary for a balanced and sustainable growth and development of the economy
(Table 8 & Chart 4).
Table 8: Commercial Bank Loans by Economic Sectors (2013-November, 2015)
(In Millions L$)
Dec-13 Dec-14 Nov-15 Percentage Change
L$ share L$ share L$ share 2013 -14 2014 - Nov-15
Agriculture 1,494.8 5.5 1,869.2 6.8 2,276.0 7.3 25.0 21.8
Mining & Quarrying 100.3 0.4 177.2 0.6 161.4 0.6 76.6 -8.9
Manufacturing 371.9 1.4 526.9 1.9 926.5 2.9 41.7 75.8
Construction 2,933.6 10.8 4,727.7 17.2 5,354.3 16.6 61.2 13.3
Transportation, Storage & Communication.
2,274.1 8.4 2,032.3 7.4 2,890.2 8.6 -10.6 42.2
Trade, Hotel & Restaurant
10,860.9 40.0 12,039.1 43.8 13,381.6 42.9 10.8 11.2
Others 9,133.7 33.6 6,127.2 22.3 9,038.0 21.1 -32.9 47.5
Total 27,169.4 100.0 27,499.6 100 34,028.0 100 1.2 23.7 Source: Central Bank of Liberia, Monrovia, Liberia *The “Others” Sector comprises loans to Individual, Service Institutions, GoL, Public Corporations, and other institutions not categorized in any sector. However, in the chart below credit to GoL and public corporations are separated from the “others” sector.
~21~
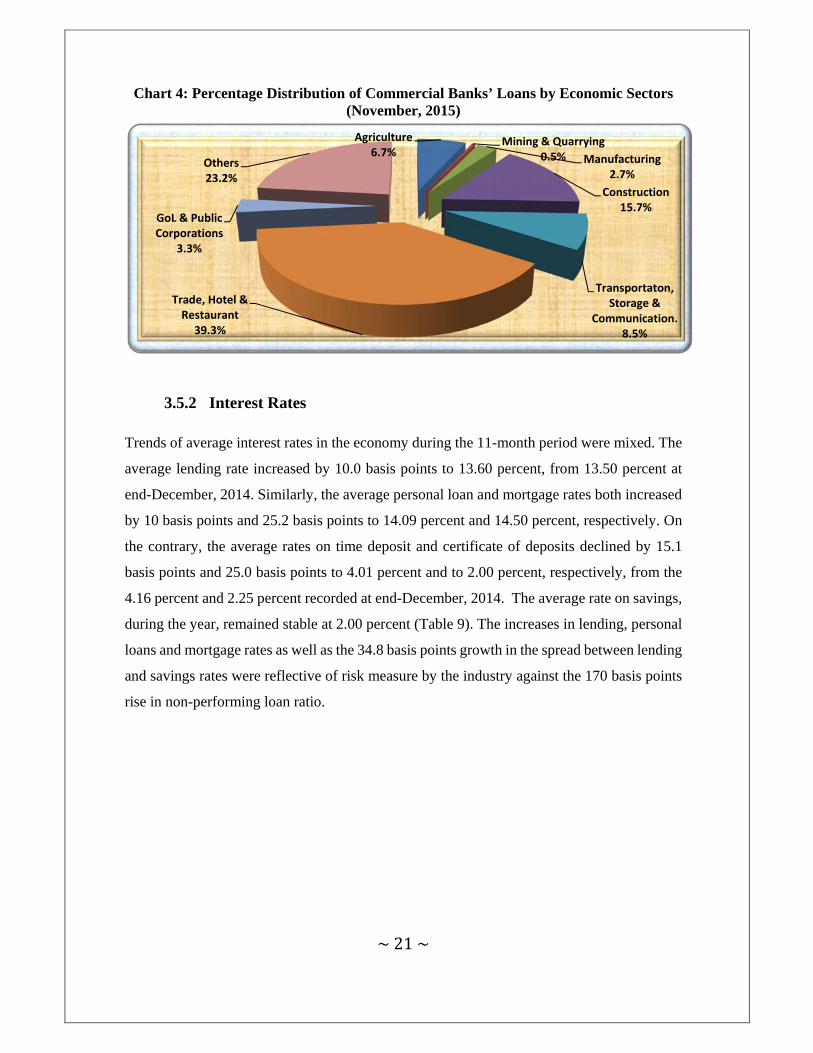
Chart 4: Percentage Distribution of Commercial Banks’ Loans by Economic Sectors (November, 2015)
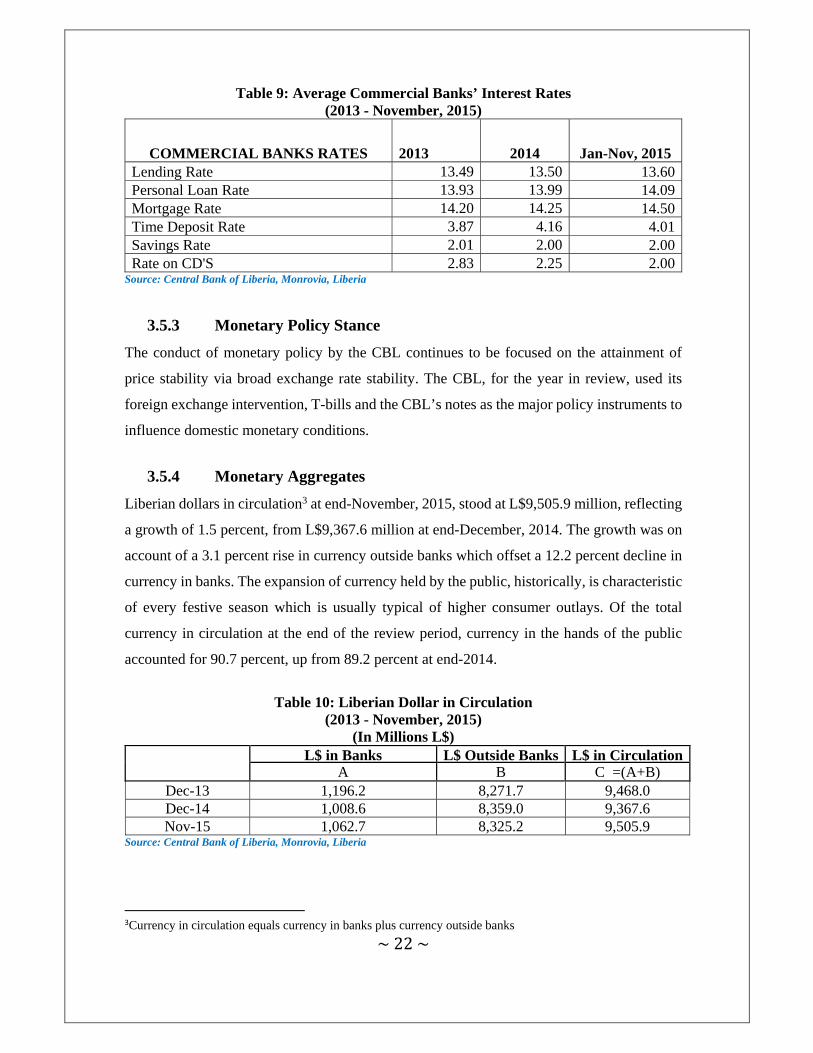
3.5.2 Interest Rates
Trends of average interest rates in the economy during the 11-month period were mixed. The
average lending rate increased by 10.0 basis points to 13.60 percent, from 13.50 percent at
end-December, 2014. Similarly, the average personal loan and mortgage rates both increased
by 10 basis points and 25.2 basis points to 14.09 percent and 14.50 percent, respectively. On
the contrary, the average rates on time deposit and certificate of deposits declined by 15.1
basis points and 25.0 basis points to 4.01 percent and to 2.00 percent, respectively, from the
4.16 percent and 2.25 percent recorded at end-December, 2014. The average rate on savings,
during the year, remained stable at 2.00 percent (Table 9). The increases in lending, personal
loans and mortgage rates as well as the 34.8 basis points growth in the spread between lending
and savings rates were reflective of risk measure by the industry against the 170 basis points
rise in non-performing loan ratio.
Agriculture 6.7%
Mining & Quarrying 0.5% Manufacturing
2.7%
Construction 15.7%
Transportaton, Storage &
Communication. 8.5%
Trade, Hotel & Restaurant
39.3%
GoL & Public Corporations
3.3%
Others23.2%
~22~
Table 9: Average Commercial Banks’ Interest Rates (2013 - November, 2015)
COMMERCIAL BANKS RATES 2013 2014 Jan-Nov, 2015 Lending Rate 13.49 13.50 13.60Personal Loan Rate 13.93 13.99 14.09Mortgage Rate 14.20 14.25 14.50Time Deposit Rate 3.87 4.16 4.01Savings Rate 2.01 2.00 2.00Rate on CD'S 2.83 2.25 2.00
Source: Central Bank of Liberia, Monrovia, Liberia
3.5.3 Monetary Policy Stance
The conduct of monetary policy by the CBL continues to be focused on the attainment of
price stability via broad exchange rate stability. The CBL, for the year in review, used its
foreign exchange intervention, T-bills and the CBL’s notes as the major policy instruments to
influence domestic monetary conditions.
3.5.4 Monetary Aggregates
Liberian dollars in circulation3 at end-November, 2015, stood at L$9,505.9 million, reflecting
a growth of 1.5 percent, from L$9,367.6 million at end-December, 2014. The growth was on
account of a 3.1 percent rise in currency outside banks which offset a 12.2 percent decline in
currency in banks. The expansion of currency held by the public, historically, is characteristic
of every festive season which is usually typical of higher consumer outlays. Of the total
currency in circulation at the end of the review period, currency in the hands of the public
accounted for 90.7 percent, up from 89.2 percent at end-2014.
Table 10: Liberian Dollar in Circulation
(2013 - November, 2015) (In Millions L$)
L$ in Banks L$ Outside Banks L$ in Circulation
A B C =(A+B) Dec-13 1,196.2 8,271.7 9,468.0 Dec-14 1,008.6 8,359.0 9,367.6 Nov-15 1,062.7 8,325.2 9,505.9
Source: Central Bank of Liberia, Monrovia, Liberia
3Currency in circulation equals currency in banks plus currency outside banks

~23~
Chart 5: Liberian Dollars in Circulation (2013-November, 2015)
(In Millions L$)
Narrow money supply (M1)4 as at 30th November, 2015, totaled L$39,038.4 million,
expanding by 6.6 percent compared with L$36,634.5 million reported at end-December, 2014.
The growth in narrow money stock was driven largely by a 7.6 percent increase in demand
deposits. Quasi money5 rose by 18.1 percent, to L$20,152.0 million largely on account of a
17.9 percent increase in time and savings deposits.
4 M1 is the narrowest definition of money supply. It is made up of currency outside banks plus demand deposits
5 Quasi Money is defined as savings and time deposits in both currencies
0.0
2,000.0
4,000.0
6,000.0
8,000.0
10,000.0
Dec‐13 Dec‐14 Nov‐15
L$ in Banks L$ Outside Banks L$ in Circulation

~24~
Table 11: Money Supply and its Sources (2013 – November, 2015)
(In Million L$)
Monetary Aggregates Dec-13 Dec-14 Nov-15 Percent Change
2013-14 2014-Nov, 2015
1.0 Money Supply M2 (1.1 + 1.2) 54,956.40 53,696.90 59,190.5 -2.3 10.2
1.1 Money Supply M1 38,666.50 36,634.50 39,038.4 -5.3 6.6
1.1.1 Currency outside banks 8,271.70 8,359.00 8,620.2 1.1 3.1
1.1.2 Demand deposit 1/ 30,394.80 28,275.50 30,418.3 -7.0 7.6
1.2 Quasi Money 16,289.90 17,062.40 20,152.0 4.7 18.1
1.2.1 Time & Savings deposits 16,252.30 17,011.40 20,048.3 4.7 17.9
1.2.2 Other deposits 2/ 37.6 51 103.8 35.8 103.4
2.0 Net Foreign Assets 28,359.40 34,864.90 32,501.8 22.9 -6.8
2.1 Central Bank 18,010.20 20,611.30 24,274.5 14.4 17.8
2.2 Banking Institutions 10,349.20 14,253.60 8,227.3 37.7 -42.3
3.0 Net Domestic Assets (1 - 2) 26,597.10 18,832.00 26,688.6 -29.2 41.7
3.1 Domestic Credit 48,833.80 48,584.70 50,367.8 -0.5 3.7
3.1.1 Government (net) 17,308.60 15,381.50 11,251.5 -11.1 -26.9
3.1.2 Pvt. Sector & Other Pvt. Sector 31,525.20 33,203.20 39,116.3 5.3 17.8
3.2 Other assets Net (3 - 3.1) 22,236.80 29,752.80 23,679.2 33.8 -20.4
Memorandum Items
1. Overall Liquidity 54,956.40 53,696.90 59,190.5 -2.3 10.2
2. Reserve Money 30,941.50 32,014.80 23,716.4 3.5 -25.9
Currency outside banks 8,271.70 8,359.00 8,620.2 1.1 3.1
Banks Reserves 22,669.80 23,655.80 14,187.6 4.3 -40.0Source: Central Bank of Liberia, Monrovia, Liberia 1/ Excludes Manager’s checks from commercial banks 2/Includes official and managers Checks issued by the Central Bank
Chart 6: Money Supply (M1)
(2013–November, 2015) (In Millions L$)
0.0
5,000.0
10,000.0
15,000.0
20,000.0
25,000.0
30,000.0
35,000.0
40,000.0
45,000.0
Dec‐13 Dec‐14 Nov‐15
Currency outside Banks DemandDeposits Money Supply(M1)
~25~
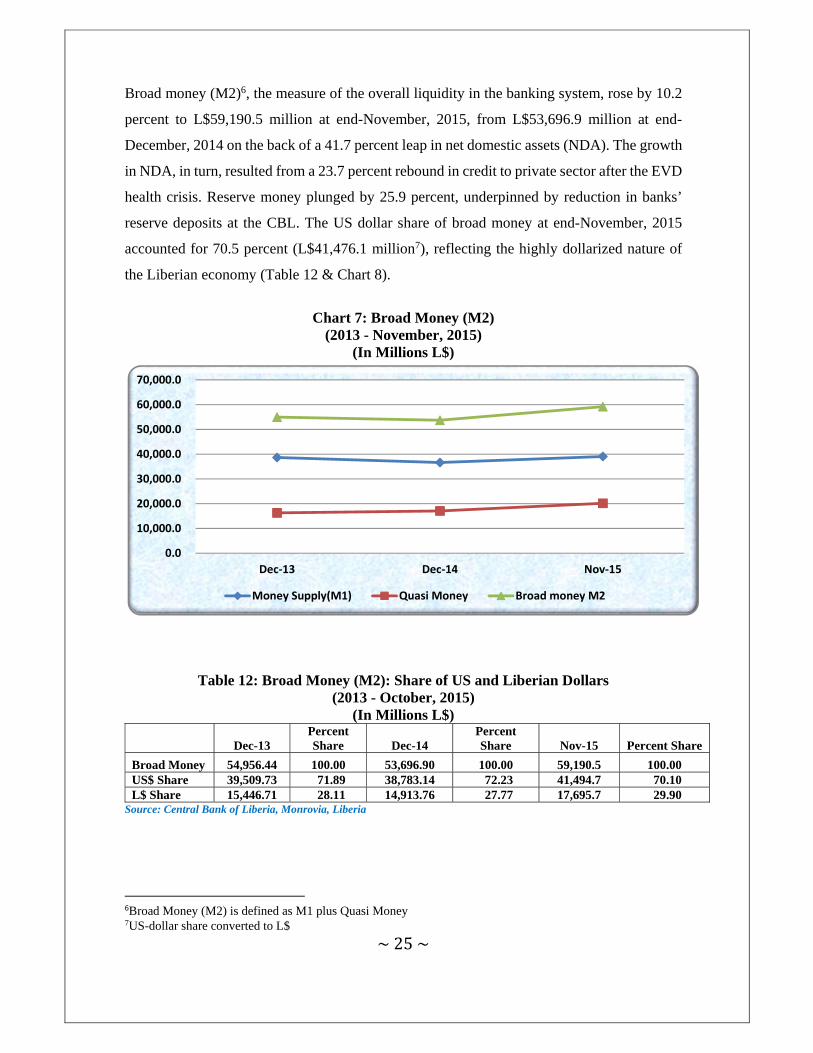
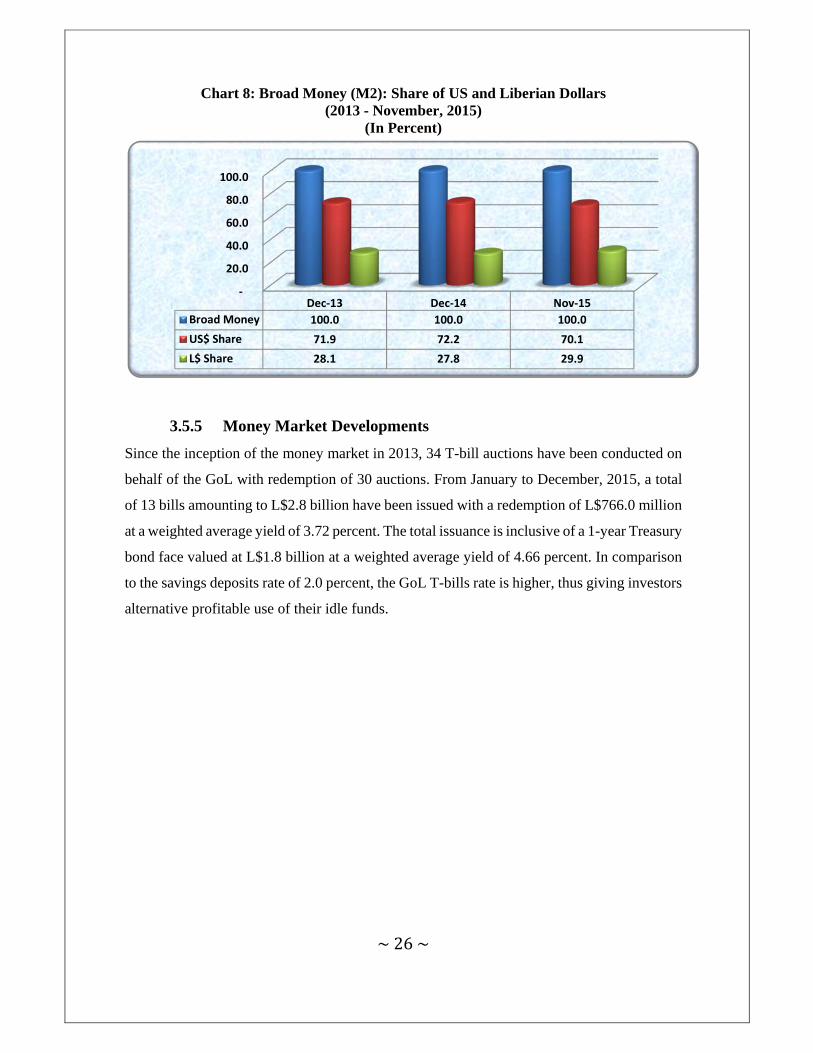
Broad money (M2)6, the measure of the overall liquidity in the banking system, rose by 10.2
percent to L$59,190.5 million at end-November, 2015, from L$53,696.9 million at end-
December, 2014 on the back of a 41.7 percent leap in net domestic assets (NDA). The growth
in NDA, in turn, resulted from a 23.7 percent rebound in credit to private sector after the EVD
health crisis. Reserve money plunged by 25.9 percent, underpinned by reduction in banks’
reserve deposits at the CBL. The US dollar share of broad money at end-November, 2015
accounted for 70.5 percent (L$41,476.1 million7), reflecting the highly dollarized nature of
the Liberian economy (Table 12 & Chart 8).
Chart 7: Broad Money (M2)
(2013 - November, 2015) (In Millions L$)
Table 12: Broad Money (M2): Share of US and Liberian Dollars (2013 - October, 2015)
(In Millions L$)
Dec-13 Percent Share Dec-14
Percent Share Nov-15 Percent Share
Broad Money 54,956.44 100.00 53,696.90 100.00 59,190.5 100.00 US$ Share 39,509.73 71.89 38,783.14 72.23 41,494.7 70.10 L$ Share 15,446.71 28.11 14,913.76 27.77 17,695.7 29.90
Source: Central Bank of Liberia, Monrovia, Liberia
6Broad Money (M2) is defined as M1 plus Quasi Money 7US-dollar share converted to L$
0.0
10,000.0
20,000.0
30,000.0
40,000.0
50,000.0
60,000.0
70,000.0
Dec‐13 Dec‐14 Nov‐15
Money Supply(M1) Quasi Money Broad money M2
~26~
Chart 8: Broad Money (M2): Share of US and Liberian Dollars (2013 - November, 2015)
(In Percent)
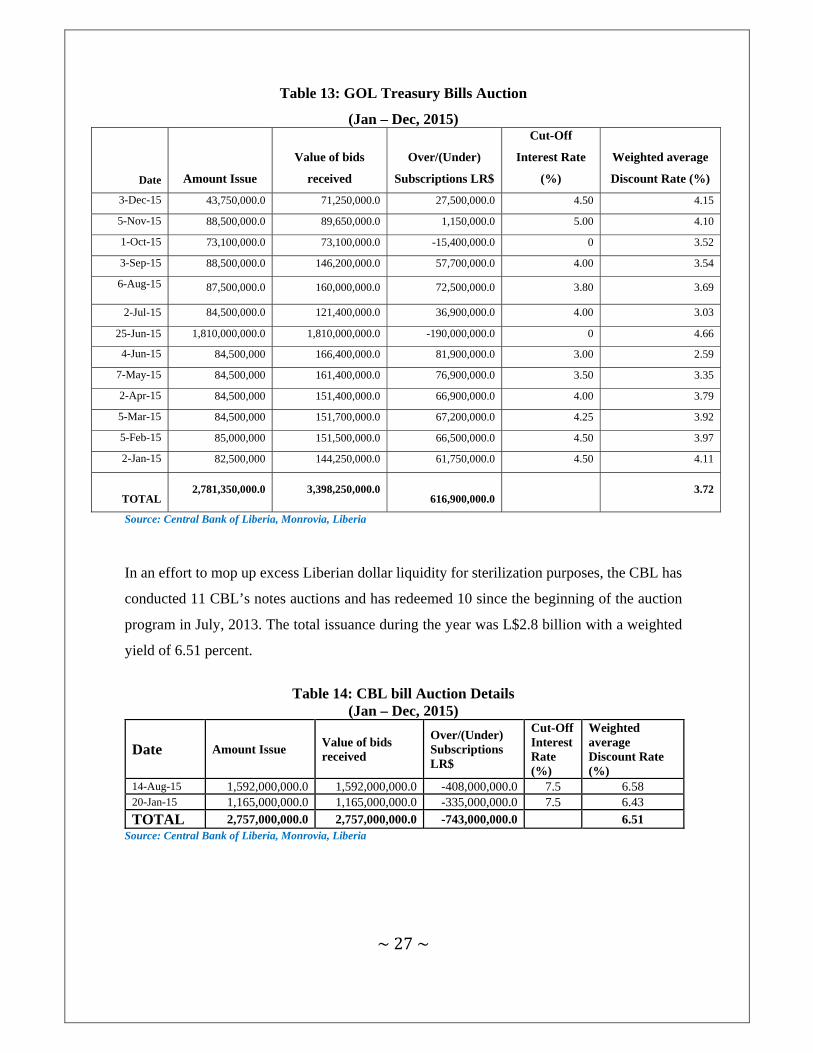
3.5.5 Money Market Developments
Since the inception of the money market in 2013, 34 T-bill auctions have been conducted on
behalf of the GoL with redemption of 30 auctions. From January to December, 2015, a total
of 13 bills amounting to L$2.8 billion have been issued with a redemption of L$766.0 million
at a weighted average yield of 3.72 percent. The total issuance is inclusive of a 1-year Treasury
bond face valued at L$1.8 billion at a weighted average yield of 4.66 percent. In comparison
to the savings deposits rate of 2.0 percent, the GoL T-bills rate is higher, thus giving investors
alternative profitable use of their idle funds.
‐
20.0
40.0
60.0
80.0
100.0
Dec‐13 Dec‐14 Nov‐15
Broad Money 100.0 100.0 100.0
US$ Share 71.9 72.2 70.1
L$ Share 28.1 27.8 29.9
~27~
Table 13: GOL Treasury Bills Auction
(Jan – Dec, 2015)
Date Amount Issue
Value of bids
received
Over/(Under)
Subscriptions LR$
Cut-Off
Interest Rate
(%)
Weighted average
Discount Rate (%)
3-Dec-15 43,750,000.0 71,250,000.0 27,500,000.0 4.50 4.15
5-Nov-15 88,500,000.0 89,650,000.0 1,150,000.0 5.00 4.10
1-Oct-15 73,100,000.0 73,100,000.0 -15,400,000.0 0 3.52
3-Sep-15 88,500,000.0 146,200,000.0 57,700,000.0 4.00 3.54
6-Aug-15 87,500,000.0 160,000,000.0 72,500,000.0 3.80 3.69
2-Jul-15 84,500,000.0 121,400,000.0 36,900,000.0 4.00 3.03
25-Jun-15 1,810,000,000.0 1,810,000,000.0 -190,000,000.0 0 4.66
4-Jun-15 84,500,000 166,400,000.0 81,900,000.0 3.00 2.59
7-May-15 84,500,000 161,400,000.0 76,900,000.0 3.50 3.35
2-Apr-15 84,500,000 151,400,000.0 66,900,000.0 4.00 3.79
5-Mar-15 84,500,000 151,700,000.0 67,200,000.0 4.25 3.92
5-Feb-15 85,000,000 151,500,000.0 66,500,000.0 4.50 3.97
2-Jan-15 82,500,000 144,250,000.0 61,750,000.0 4.50 4.11
TOTAL 2,781,350,000.0 3,398,250,000.0
616,900,000.0 3.72
Source: Central Bank of Liberia, Monrovia, Liberia
In an effort to mop up excess Liberian dollar liquidity for sterilization purposes, the CBL has
conducted 11 CBL’s notes auctions and has redeemed 10 since the beginning of the auction
program in July, 2013. The total issuance during the year was L$2.8 billion with a weighted
yield of 6.51 percent.
Table 14: CBL bill Auction Details
(Jan – Dec, 2015)
Date Amount Issue Value of bids received
Over/(Under) Subscriptions LR$
Cut-Off Interest Rate (%)
Weighted average Discount Rate (%)
14-Aug-15 1,592,000,000.0 1,592,000,000.0 -408,000,000.0 7.5 6.58 20-Jan-15 1,165,000,000.0 1,165,000,000.0 -335,000,000.0 7.5 6.43
TOTAL 2,757,000,000.0 2,757,000,000.0 -743,000,000.0 6.51 Source: Central Bank of Liberia, Monrovia, Liberia

~28~
3.5.6 CBL’s Foreign Exchange Auction
The total amount of US dollar sold during 2015 amounted to US$41.9 million, down by 29.0
percent compared with 2014 Foreign exchange (FX) sale of US$$59.0 million. This level of
intervention propped up by the steady increase in net inward personal remittances helped in
stabilizing the exchange rate between the Liberian dollar and the US dollar.
Table 15: CBL’s Foreign Exchange Auction (2013- 2015)
(In Million US$) 2013 2014 2015
FXSold 72.0 59.0 41.9
Source: Central Bank of Liberia, Monrovia, Liberia
Chart 9: Foreign Exchange Auction
(2013- 2015) (In Million US$)
3.6 External Sector Developments
3.6.1 Balance of Payments 8
From provisional estimates, Liberia’s overall balance of payments (BOP) position
deteriorated to a deficit of US$51.8 million in 2015, from a deficit of US$38.2 million in
2014, largely driven by 5.3 percent worsening in the current account deficit. Gross foreign
reserves (including SDR holdings) in months of import cover inched upward to 2.7 months in
8 Provisional Balances measured on IMF Balance of Payments Manual 5 (BPM5) Standards
2013 2014 2015
CBL FX Auction 72 59 41.9
0
10
20
30
40
50
60
70
80

~29~
2015, from 2.4 months in 2014, though still remaining below the minimum requirement of
3.0 months set by the West African Monetary Zone (WAMZ) (Table 16 & Chart 10).
Chart 10: Gross Foreign Reserves in Months of Import Cover: 2013-2015 (Millions of US dollars, unless otherwise indicated)
3.6.1.1 Current Account
The current account deficit widened by 5.3 percent to US$1,974.6 million in 2015, from
US$1,874.8 million during the preceding year, on the back of 30.7 percent deterioration in
the trade deficit that offset the 26.8 percent year-on-year rise in current transfers. As a percent
of GDP, the current account deficit averaged 96.2 percent in 2015, from 93.1 percent in 2014
(Table 16 & Chart 11).
Chart 11: Trend of Current Account Deficit as Percent of GDP: 2013-2015
2.2
2.4
2.6
2.8
3
480
490
500
510
520
530
540
550
2013 2014 2015
Months of Im
port Cover
Gross FX Reserves (Incl.
SDRs)
Gross FX Reserves (Inc. SDRs) Months of Import Cover
‐94
‐92
‐90
‐88
‐86
‐84
‐82
‐80
‐2500
‐2000
‐1500
‐1000
‐500
0
2013 2014 2015Current Account Deficit % GDP
Current Account Deficit
Current Account Deficit Current Account Deficit % GDP

~30~
3.6.1.2 Trade Balance
Preliminary statistics show that the trade deficit widened by 30.7 percent to US$1,977.7
million in 2015, from US$1,513.1 million during the preceding year, led by 55.8 percent
decline in export receipts coupled with 6.5 percent rise in import payments. The sharp declines
in iron ore and rubber prices on the global market during the year, coupled with the post-EVD
domestic production constraints, explained the sharp decline in export receipts. On the
imports front, year-on-year improvements in economic activities led to increased importation
during the year, particularly consumables and petroleum products. Despite the falling price of
the commodity, Liberia’s petroleum import bill rose by 24.0 percent in 2015 compared with
the amount recorded in 2014, largely on account of increased import volume (Table 16 &
Chart 11) in 2014.

~31~
Table 16: Balance of Payments: 2014-2015 (Millions of US dollars, unless otherwise indicated)
Year 2014* 2015** Y-on-Y % Growth Rate
2014-2015
Current Account Balance -1874.8 -1974.6 5.3
Current Account Balance, excluding grants -2887.7 -3043.4 1.0
Trade Balance -1513.1 -1977.7 30.7
Merchandise Exports 587.1 259.5 -55.8
Iron ore 373.8 133.3 -64.3
Rubber 106.3 51.2 -51.8
Non-Iron Ore & Non-Rubber Exports 107.0 74.9 -30.0
Merchandise Imports (FOB) -2100.3 -2237.2 6.5
Oil (Petroleum) -333.7 -413.8 24.0
Rice -155.6 -124.7 -19.8
Machinery & Transport Equipment -667.7 -425.3 -36.3
Others -943.2 -1273.4 35.0
Services (Net) -1081.6 -1039.1 -3.9
Receipts 230.6 237.9 3.2
Payments -1312.3 -1277.0 -2.7
Income (Net) -496.6 -499.8 0.7
Compensation of Employees (net) 19.8 19.4 -2.0
Investment income (net) -516.4 -519.2 0.6
Current transfers (Net) 1216.5 1668.2 37.1
Public transfers (net) 1019.6 1124.4 10.3
Grants (net) 1012.9 1068.8 5.5
Others 6.7 55.6 729.5
Private transfers (net) 196.9 543.8 176.2
Workers' Remittances (net) 158.9 368.4 131.8
Others 38.0 175.4 362.0
Capital & Financial Account 662.2 878.1 32.6
Capital Transfers (Net) 116.7 361.7 210.0
Financial Account 545.5 516.4 -5.3
Direct investment in reporting economy 276.7 284.6 2.9
Portfolio Investment (Net) 0.0 0.0 0.0
Other Investment (Net) 239.7 262.1 9.4
Currency & Deposits (net) 46.7 -10.8 -123.2
Trade Credit & Advances (net) -22.7 22.3 -198.6
Reserve Assets 29.1 -30.4 -204.4
Net Errors and Omissions 1174.5 918.5 -21.8
OVERALL BALANCE/1 -38.2 -51.8 35.6
Financing 38.2 51.8 35.6 Change in gross official reserves (increase -) -29.1 -5.3 -81.9
Net use of Fund credit and Loans 62.0 9.6 -84.5
Disbursements 58.8 9.6 -83.7
Repayments 3.2 0.0 -100.0
Exceptional Financing 5.3 47.5 796.4
Debt forgiveness 0.0 38.3 -
Change in arrears 0.0 0.0 -
Others-Intergovernmental Grants 5.3 9.2 73.0
Financing Gap 0.0 0.0 0.0
Current Account Balance
Including Grants -93.1 -90.0
Excluding Grants -143.5 -142.1
Overall Balance -1.9 -2.5
Trade Balance -75.2 -96.3
Imports of Goods (CIF) & Services (Millions US$) 2609.3 2489.5
Gross Foreign Reserves (Millions US$) 532.2 560.6 Gross Foreign Reserves (Months of Import Cover) 2.4 2.7
Source: Central Bank of Liberia, Monrovia, Liberia
~32~
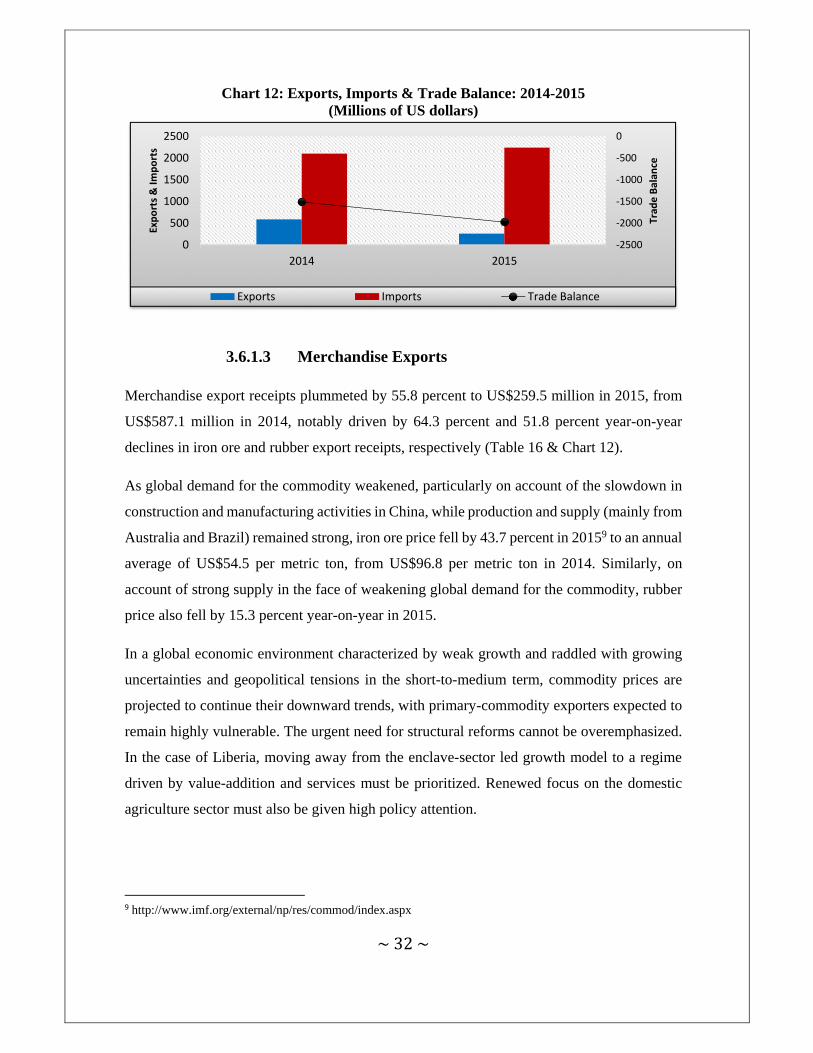
Chart 12: Exports, Imports & Trade Balance: 2014-2015 (Millions of US dollars)
3.6.1.3 Merchandise Exports
Merchandise export receipts plummeted by 55.8 percent to US$259.5 million in 2015, from
US$587.1 million in 2014, notably driven by 64.3 percent and 51.8 percent year-on-year
declines in iron ore and rubber export receipts, respectively (Table 16 & Chart 12).
As global demand for the commodity weakened, particularly on account of the slowdown in
construction and manufacturing activities in China, while production and supply (mainly from
Australia and Brazil) remained strong, iron ore price fell by 43.7 percent in 20159 to an annual
average of US$54.5 per metric ton, from US$96.8 per metric ton in 2014. Similarly, on
account of strong supply in the face of weakening global demand for the commodity, rubber
price also fell by 15.3 percent year-on-year in 2015.
In a global economic environment characterized by weak growth and raddled with growing
uncertainties and geopolitical tensions in the short-to-medium term, commodity prices are
projected to continue their downward trends, with primary-commodity exporters expected to
remain highly vulnerable. The urgent need for structural reforms cannot be overemphasized.
In the case of Liberia, moving away from the enclave-sector led growth model to a regime
driven by value-addition and services must be prioritized. Renewed focus on the domestic
agriculture sector must also be given high policy attention.
9 http://www.imf.org/external/np/res/commod/index.aspx
‐2500
‐2000
‐1500
‐1000
‐500
0
0
500
1000
1500
2000
2500
2014 2015
Trad
e Balan
ce
Exports & Im
ports
Exports Imports Trade Balance
~33~
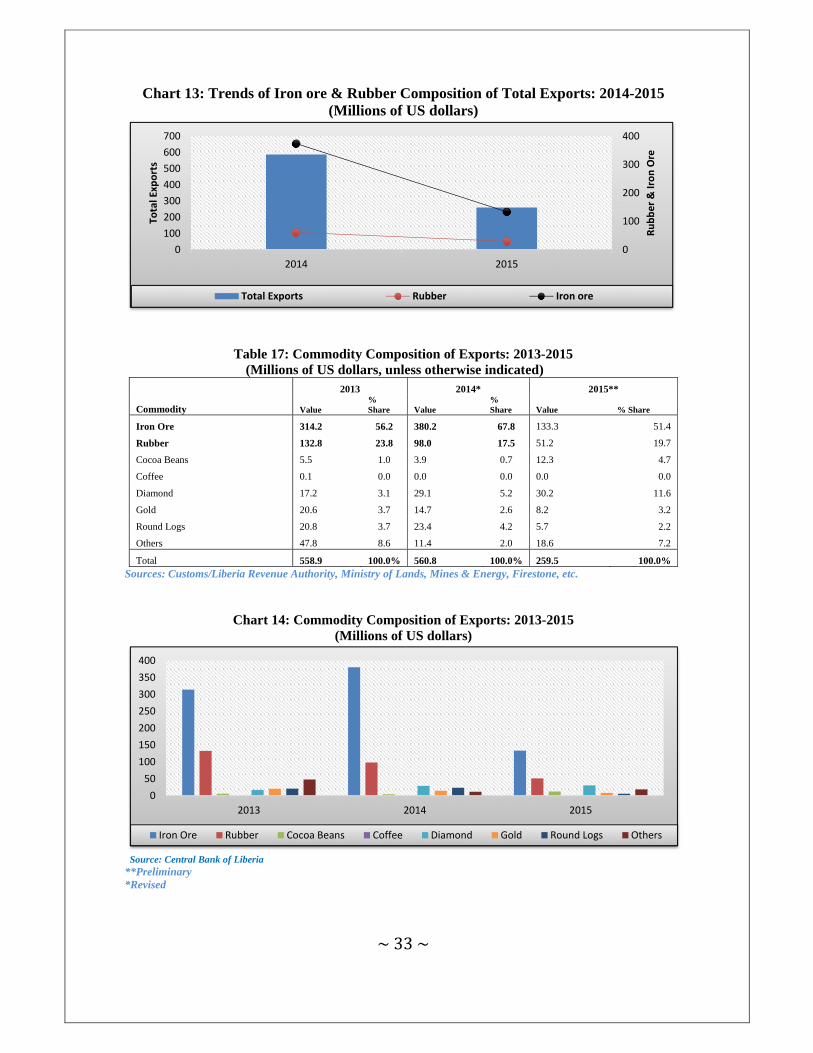
Chart 13: Trends of Iron ore & Rubber Composition of Total Exports: 2014-2015 (Millions of US dollars)
Table 17: Commodity Composition of Exports: 2013-2015 (Millions of US dollars, unless otherwise indicated)
Commodity
2013 2014* 2015**
Value % Share Value
% Share Value % Share
Iron Ore 314.2 56.2 380.2 67.8 133.3 51.4
Rubber 132.8 23.8 98.0 17.5 51.2 19.7
Cocoa Beans 5.5 1.0 3.9 0.7 12.3 4.7
Coffee 0.1 0.0 0.0 0.0 0.0 0.0
Diamond 17.2 3.1 29.1 5.2 30.2 11.6
Gold 20.6 3.7 14.7 2.6 8.2 3.2
Round Logs 20.8 3.7 23.4 4.2 5.7 2.2
Others 47.8 8.6 11.4 2.0 18.6 7.2
Total 558.9 100.0% 560.8 100.0% 259.5 100.0% Sources: Customs/Liberia Revenue Authority, Ministry of Lands, Mines & Energy, Firestone, etc.
Chart 14: Commodity Composition of Exports: 2013-2015 (Millions of US dollars)
Source: Central Bank of Liberia **Preliminary *Revised
0
100
200
300
400
0
100
200
300
400
500
600
700
2014 2015
Rubber & Iron Ore
Total Exports
Total Exports Rubber Iron ore
0
50
100
150
200
250
300
350
400
2013 2014 2015
Iron Ore Rubber Cocoa Beans Coffee Diamond Gold Round Logs Others
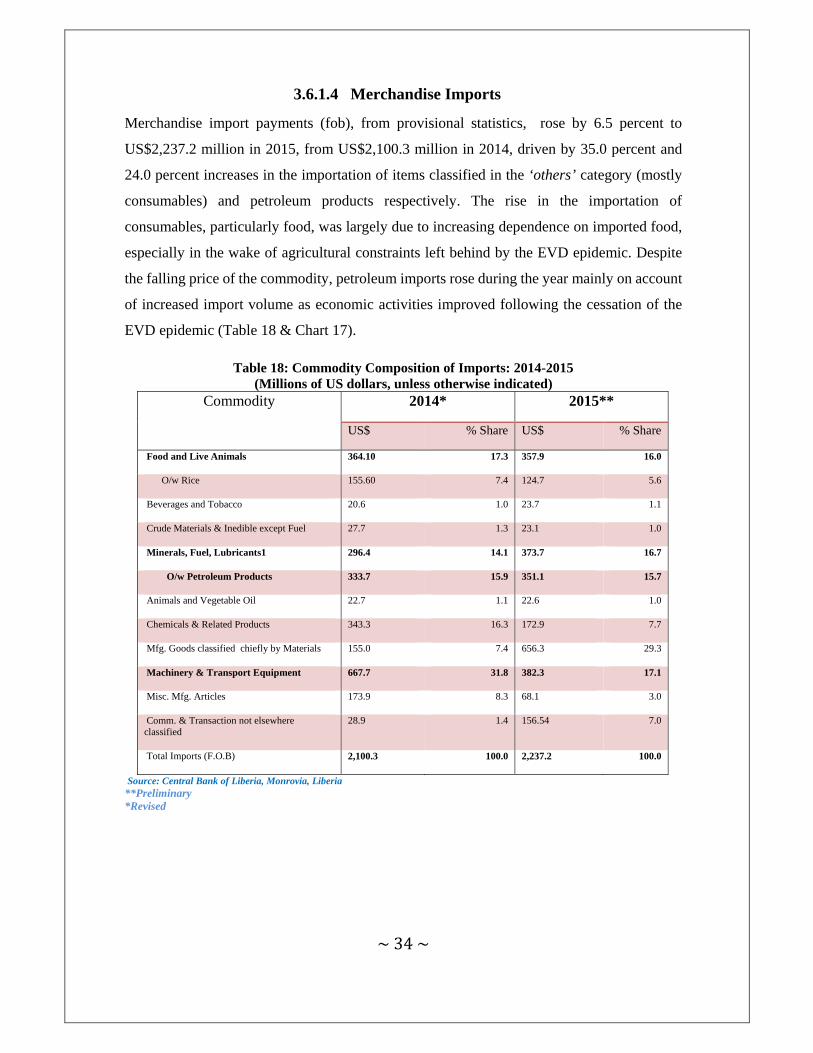
~34~
3.6.1.4 Merchandise Imports
Merchandise import payments (fob), from provisional statistics, rose by 6.5 percent to
US$2,237.2 million in 2015, from US$2,100.3 million in 2014, driven by 35.0 percent and
24.0 percent increases in the importation of items classified in the ‘others’ category (mostly
consumables) and petroleum products respectively. The rise in the importation of
consumables, particularly food, was largely due to increasing dependence on imported food,
especially in the wake of agricultural constraints left behind by the EVD epidemic. Despite
the falling price of the commodity, petroleum imports rose during the year mainly on account
of increased import volume as economic activities improved following the cessation of the
EVD epidemic (Table 18 & Chart 17).
Table 18: Commodity Composition of Imports: 2014-2015 (Millions of US dollars, unless otherwise indicated)
Commodity 2014* 2015**
US$ % Share US$ % Share
Food and Live Animals 364.10 17.3 357.9 16.0
O/w Rice 155.60 7.4 124.7 5.6
Beverages and Tobacco 20.6 1.0 23.7 1.1
Crude Materials & Inedible except Fuel 27.7 1.3 23.1 1.0
Minerals, Fuel, Lubricants1 296.4 14.1 373.7 16.7
O/w Petroleum Products 333.7 15.9 351.1 15.7
Animals and Vegetable Oil 22.7 1.1 22.6 1.0
Chemicals & Related Products 343.3 16.3 172.9 7.7
Mfg. Goods classified chiefly by Materials 155.0 7.4 656.3 29.3
Machinery & Transport Equipment 667.7 31.8 382.3 17.1
Misc. Mfg. Articles 173.9 8.3 68.1 3.0
Comm. & Transaction not elsewhere classified
28.9 1.4 156.54 7.0
Total Imports (F.O.B) 2,100.3 100.0 2,237.2 100.0
Source: Central Bank of Liberia, Monrovia, Liberia **Preliminary *Revised
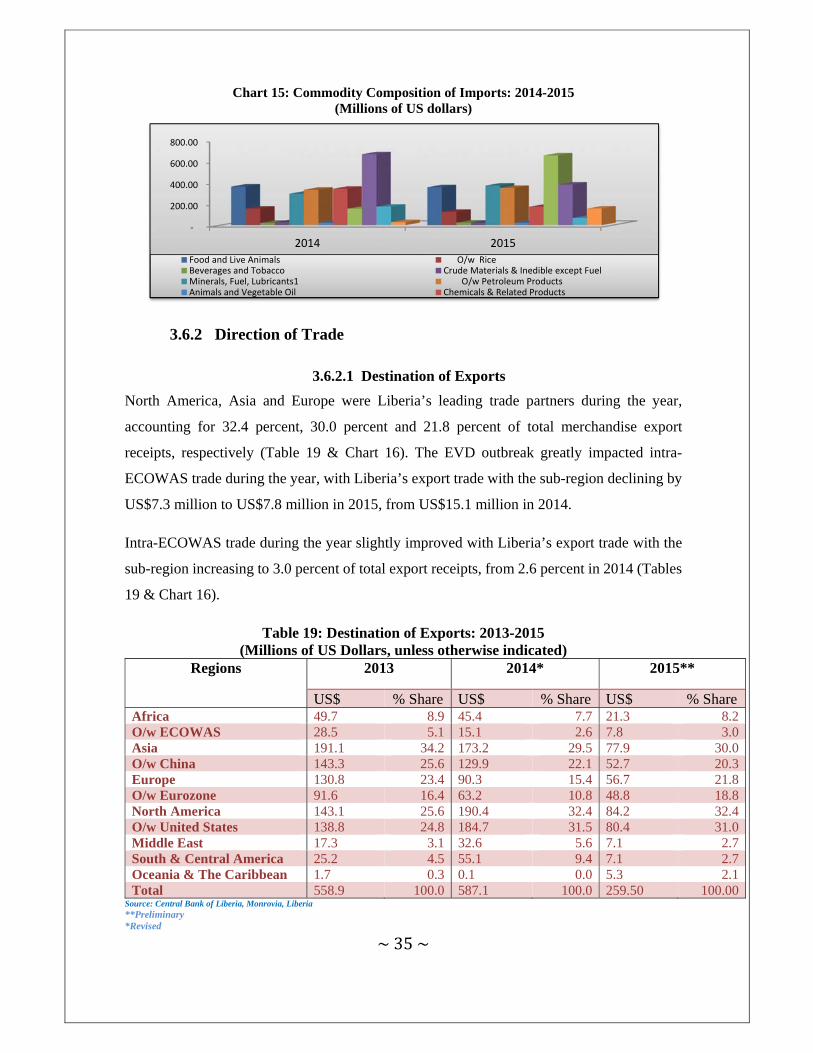
~35~
Chart 15: Commodity Composition of Imports: 2014-2015 (Millions of US dollars)
3.6.2 Direction of Trade
3.6.2.1 Destination of Exports
North America, Asia and Europe were Liberia’s leading trade partners during the year,
accounting for 32.4 percent, 30.0 percent and 21.8 percent of total merchandise export
receipts, respectively (Table 19 & Chart 16). The EVD outbreak greatly impacted intra-
ECOWAS trade during the year, with Liberia’s export trade with the sub-region declining by
US$7.3 million to US$7.8 million in 2015, from US$15.1 million in 2014.
Intra-ECOWAS trade during the year slightly improved with Liberia’s export trade with the
sub-region increasing to 3.0 percent of total export receipts, from 2.6 percent in 2014 (Tables
19 & Chart 16).
Table 19: Destination of Exports: 2013-2015 (Millions of US Dollars, unless otherwise indicated)
Regions 2013 2014* 2015**
US$ % Share US$ % Share US$ % Share Africa 49.7 8.9 45.4 7.7 21.3 8.2O/w ECOWAS 28.5 5.1 15.1 2.6 7.8 3.0Asia 191.1 34.2 173.2 29.5 77.9 30.0O/w China 143.3 25.6 129.9 22.1 52.7 20.3Europe 130.8 23.4 90.3 15.4 56.7 21.8O/w Eurozone 91.6 16.4 63.2 10.8 48.8 18.8North America 143.1 25.6 190.4 32.4 84.2 32.4O/w United States 138.8 24.8 184.7 31.5 80.4 31.0Middle East 17.3 3.1 32.6 5.6 7.1 2.7South & Central America 25.2 4.5 55.1 9.4 7.1 2.7Oceania & The Caribbean 1.7 0.3 0.1 0.0 5.3 2.1Total 558.9 100.0 587.1 100.0 259.50 100.00
Source: Central Bank of Liberia, Monrovia, Liberia **Preliminary *Revised
‐
200.00
400.00
600.00
800.00
2014 2015
Food and Live Animals O/w RiceBeverages and Tobacco Crude Materials & Inedible except FuelMinerals, Fuel, Lubricants1 O/w Petroleum ProductsAnimals and Vegetable Oil Chemicals & Related Products

~36~
Chart 16: Destination of Exports: 2013-2015 (Millions of US Dollars)
3.6.2.2 Sources of Imports
On the import front, Asia, North America and Europe were the leading sources of imports.
Asia accounted for 30.6 percent, Europe 23.1 percent and North America 20.0 percent,
respectively. Liberia’s position relative to intra-ECOWAS trade improved by more than
doubling the share recorded in 2014. Liberia intra ECOWAS import accounted for 15.1
percent at end 2015, from 7.4 percent in 2014 (Table 20 & Chart 17).
Table 20: Sources of Imports: 2014-2015 (Millions of US Dollars, unless otherwise indicated)
Regions 2014* 2015**
US$ % Share US$ % ShareAfrica 224.7 10.7 405.2 18.1 O/w ECOWAS 155.4 7.4 338.0 15.1 Asia 470.5 22.4 684.3 30.6 O/w China 352.9 16.8 479.0 21.4 Europe 350.8 16.7 516.0 23.1 O/w Eurozone 245.5 11.7 335.4 15.0 North America 850.6 40.5 446.6 20.0 O/w United States 833.6 39.7 437.7 19.6 Middle East 46.2 2.2 156.7 7.0 South & Central America 84.0 4.0 25.3 1.1 Oceania & The Caribbean 73.5 3.5 3.1 0.1 Total Imports (F.O.B) 2100.3 100.0 2,237.2 100.0
Source: Central Bank of Liberia, Monrovia, Liberia **Preliminary *Revised
0.0
50.0
100.0
150.0
200.0
2013 2014 2015
Africa O/w ECOWAS Asia
O/w China Europe O/w Eurozone
North America O/w United States Middle East
South & Central America Oceania & The Caribbean
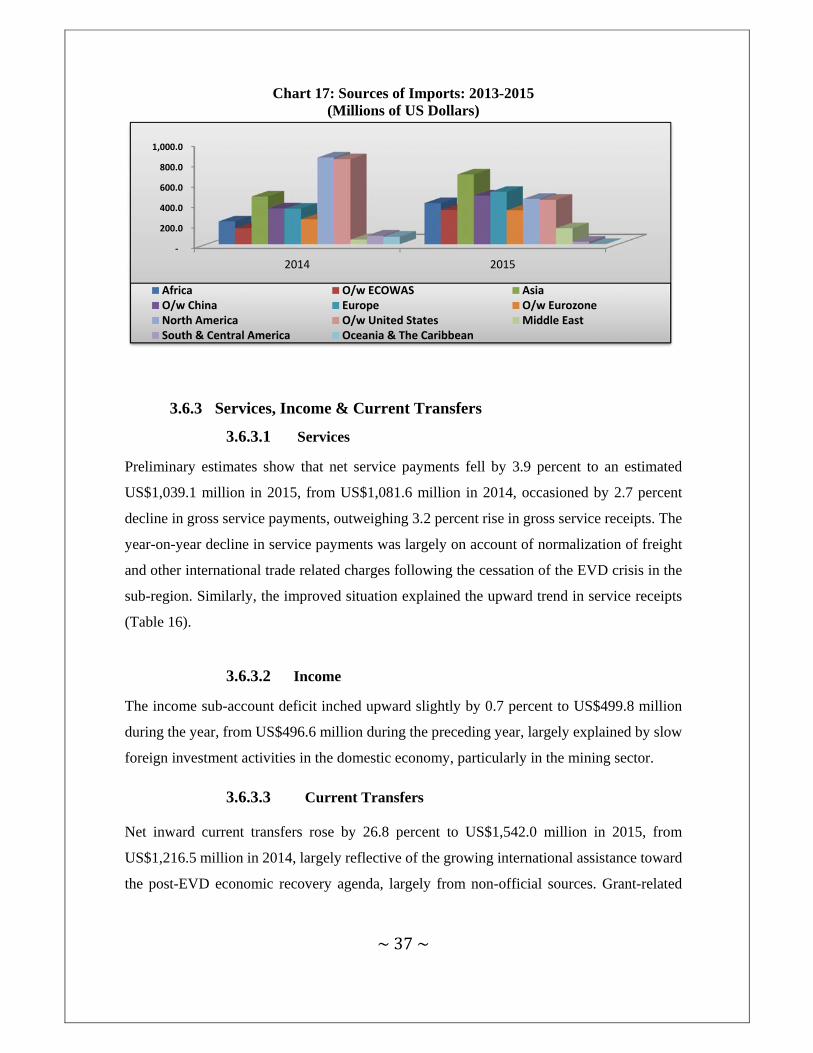
~37~
Chart 17: Sources of Imports: 2013-2015 (Millions of US Dollars)
3.6.3 Services, Income & Current Transfers
3.6.3.1 Services
Preliminary estimates show that net service payments fell by 3.9 percent to an estimated
US$1,039.1 million in 2015, from US$1,081.6 million in 2014, occasioned by 2.7 percent
decline in gross service payments, outweighing 3.2 percent rise in gross service receipts. The
year-on-year decline in service payments was largely on account of normalization of freight
and other international trade related charges following the cessation of the EVD crisis in the
sub-region. Similarly, the improved situation explained the upward trend in service receipts
(Table 16).
3.6.3.2 Income
The income sub-account deficit inched upward slightly by 0.7 percent to US$499.8 million
during the year, from US$496.6 million during the preceding year, largely explained by slow
foreign investment activities in the domestic economy, particularly in the mining sector.
3.6.3.3 Current Transfers
Net inward current transfers rose by 26.8 percent to US$1,542.0 million in 2015, from
US$1,216.5 million in 2014, largely reflective of the growing international assistance toward
the post-EVD economic recovery agenda, largely from non-official sources. Grant-related
‐
200.0
400.0
600.0
800.0
1,000.0
2014 2015
Africa O/w ECOWAS AsiaO/w China Europe O/w EurozoneNorth America O/w United States Middle EastSouth & Central America Oceania & The Caribbean

~38~
transfers rose by 5.5 percent while personal remittances rose by US$268.0 million in 2015
compared with 2014 (Tables 16).
3.6.3.4 Personal Remittances
Net inward personal remittances rose by US$194.6 million to US$368.4 million in 2015, from
US$173.8 million in 2014, driven largely by increased support toward households from
abroad in the wake of post-Ebola economic recovery. The ongoing downward trend in
unemployment in the United States (the biggest source of personal remittances), growing
prospects of economic recovery in the Eurozone and lower household expenditures on fuel in
the wake of falling oil prices are some of the factors that explain the surge in personal
remittances toward Liberia during the year (Table 21 & Chart 18).
As remittances continue to constitute a major source of foreign currency inflows into the
domestic economy, the need to formulate appropriate policies aimed at reducing transaction
costs and making diaspora citizens more involved in the economic recovery process cannot
be overemphasized.
Table 21: Personal Remittances: 2013-2015 (Millions of US Dollars, unless otherwise indicated)
Personal Remittances 2013 2014* 2015**
Y-on-Y % Change 2014-15 2013-15
Inward 374.8 473.0 658.0 39.1 75.5 Outward 324.1 299.2 289.6 -3.2 -10.6 Net Inward 50.8 173.8 368.4 111.9 625.5
Source: Central Bank of Liberia, Monrovia, Liberia **Preliminary *Revised
Chart 18: Trends of Personal Remittances: 2013-2015 (Millions of US Dollars)

~39~
3.6.4 Capital & Financial Account
From preliminary statistics, the Capital & Financial Account balance grew by 32.6 percent to
US$878.1 million in 2015, from US$662.2 million in 2014, largely explained by a surge in
the capital account balance that outweighed the 5.3 percent declined recorded in the financial
account balance. The capital account balance grew by US$245.0 million in 2015 compared
with the level recorded in 2014, occasioned by the capital-related grant from the Millennium
Challenge Corporation when Liberia achieved grant-eligibility status during the year. From
preliminary statistics, direct investments in the domestic economy grew by 2.9 percent year-
on-year (Table 16).
3.7 Exchange Rate Developments
The average exchange rate between the Liberian and the US dollars depreciated by 4.3 percent
to L$88.50/US$1.00 in December, 2015 compared with L$84.84/US$1.00 for December,
2014 (Tables 22 & Chart 19) largely as a result of deteriorating terms of trade (ToT), high
demand for imports, reflected by the high demand for foreign exchange through the CBL’s
foreign exchange auction and increased Liberian dollar expenditure by GoL, especially during
the second and third quarters of the year.
Table 22: Market Exchange Rates: Liberian Dollars per US Dollar (2013 – 2015)
Market Rate Dec-13 Dec-14 Dec-15
End-of-Period 82.50 82.50 88.50 Period Average 81.88 84.84 88.50
Source: Central Bank of Liberia, Monrovia, Liberia *Projected
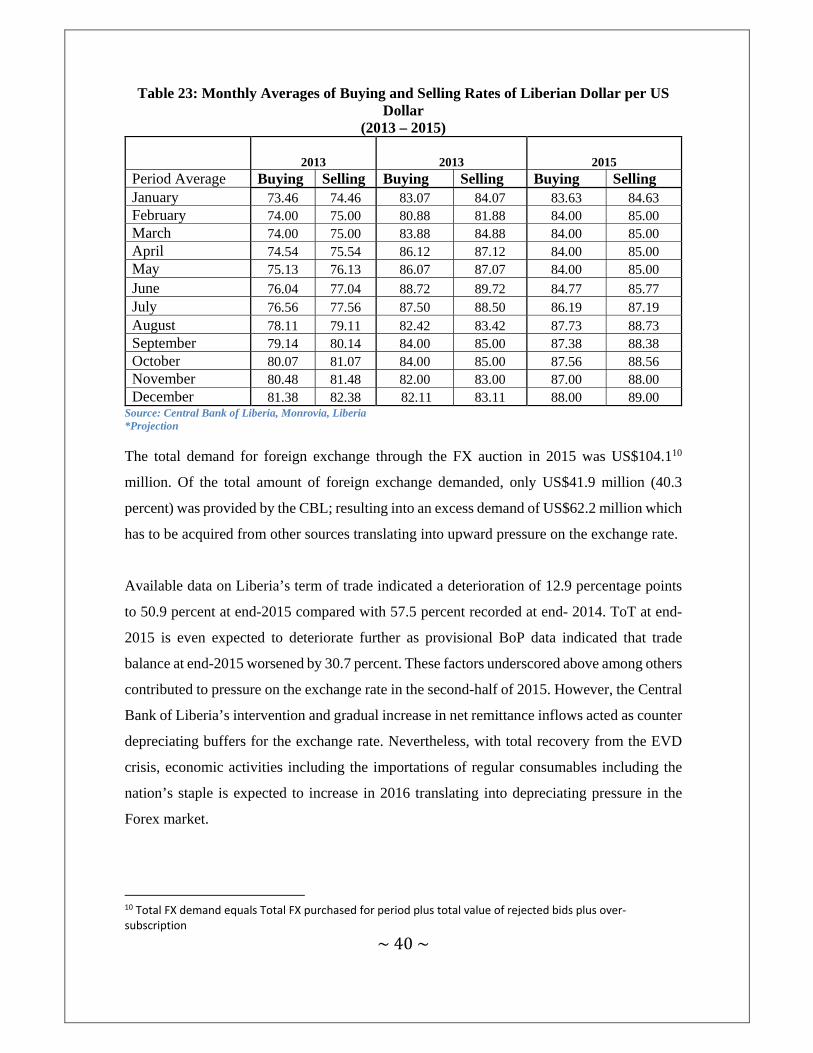
~40~
Table 23: Monthly Averages of Buying and Selling Rates of Liberian Dollar per US Dollar
(2013 – 2015)
2013 2013 2015 Period Average Buying Selling Buying Selling Buying Selling January 73.46 74.46 83.07 84.07 83.63 84.63 February 74.00 75.00 80.88 81.88 84.00 85.00 March 74.00 75.00 83.88 84.88 84.00 85.00 April 74.54 75.54 86.12 87.12 84.00 85.00 May 75.13 76.13 86.07 87.07 84.00 85.00
June 76.04 77.04 88.72 89.72 84.77 85.77 July 76.56 77.56 87.50 88.50 86.19 87.19 August 78.11 79.11 82.42 83.42 87.73 88.73 September 79.14 80.14 84.00 85.00 87.38 88.38 October 80.07 81.07 84.00 85.00 87.56 88.56 November 80.48 81.48 82.00 83.00 87.00 88.00 December 81.38 82.38 82.11 83.11 88.00 89.00
Source: Central Bank of Liberia, Monrovia, Liberia *Projection
The total demand for foreign exchange through the FX auction in 2015 was US$104.110
million. Of the total amount of foreign exchange demanded, only US$41.9 million (40.3
percent) was provided by the CBL; resulting into an excess demand of US$62.2 million which
has to be acquired from other sources translating into upward pressure on the exchange rate.
Available data on Liberia’s term of trade indicated a deterioration of 12.9 percentage points
to 50.9 percent at end-2015 compared with 57.5 percent recorded at end- 2014. ToT at end-
2015 is even expected to deteriorate further as provisional BoP data indicated that trade
balance at end-2015 worsened by 30.7 percent. These factors underscored above among others
contributed to pressure on the exchange rate in the second-half of 2015. However, the Central
Bank of Liberia’s intervention and gradual increase in net remittance inflows acted as counter
depreciating buffers for the exchange rate. Nevertheless, with total recovery from the EVD
crisis, economic activities including the importations of regular consumables including the
nation’s staple is expected to increase in 2016 translating into depreciating pressure in the
Forex market.
10 Total FX demand equals Total FX purchased for period plus total value of rejected bids plus over‐subscription
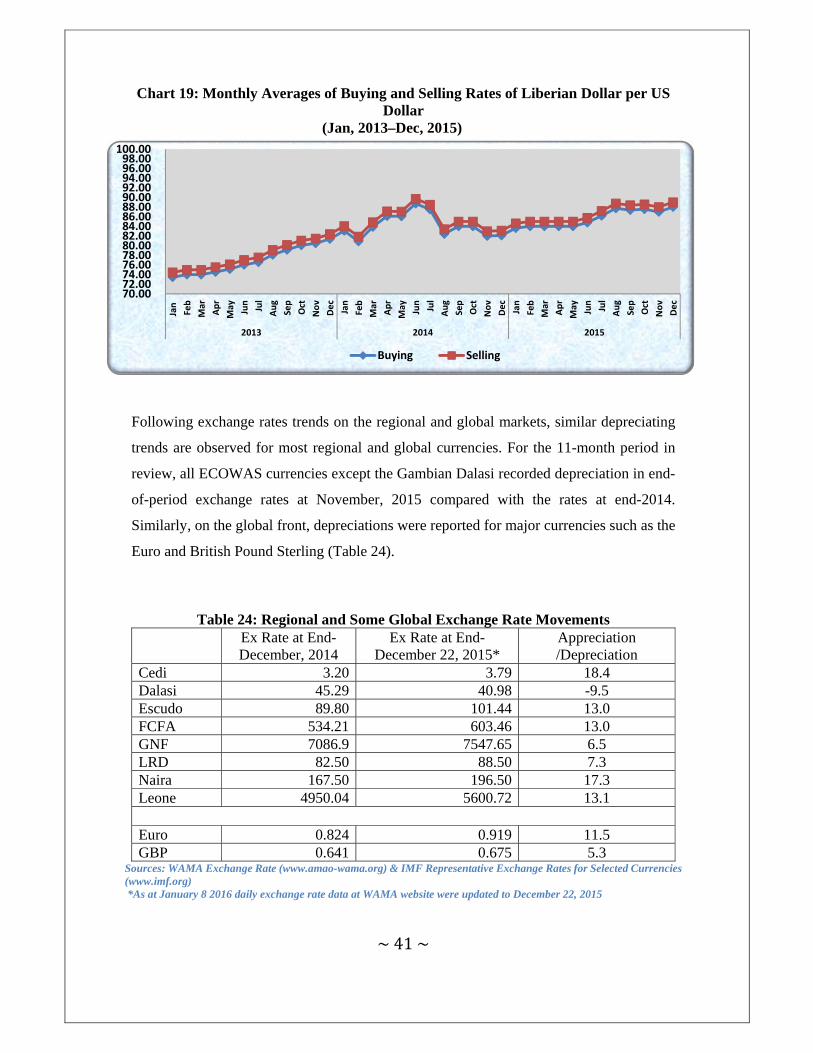
~41~
Chart 19: Monthly Averages of Buying and Selling Rates of Liberian Dollar per US Dollar
(Jan, 2013–Dec, 2015)
Following exchange rates trends on the regional and global markets, similar depreciating
trends are observed for most regional and global currencies. For the 11-month period in
review, all ECOWAS currencies except the Gambian Dalasi recorded depreciation in end-
of-period exchange rates at November, 2015 compared with the rates at end-2014.
Similarly, on the global front, depreciations were reported for major currencies such as the
Euro and British Pound Sterling (Table 24).
Table 24: Regional and Some Global Exchange Rate Movements
Ex Rate at End-December, 2014
Ex Rate at End-December 22, 2015*
Appreciation /Depreciation
Cedi 3.20 3.79 18.4 Dalasi 45.29 40.98 -9.5 Escudo 89.80 101.44 13.0 FCFA 534.21 603.46 13.0 GNF 7086.9 7547.65 6.5 LRD 82.50 88.50 7.3 Naira 167.50 196.50 17.3 Leone 4950.04 5600.72 13.1 Euro 0.824 0.919 11.5 GBP 0.641 0.675 5.3
Sources: WAMA Exchange Rate (www.amao-wama.org) & IMF Representative Exchange Rates for Selected Currencies (www.imf.org) *As at January 8 2016 daily exchange rate data at WAMA website were updated to December 22, 2015
70.00 72.00 74.00 76.00 78.00 80.00 82.00 84.00 86.00 88.00 90.00 92.00 94.00 96.00 98.00
100.00
Jan
Feb
Mar
Apr
May Jun
Jul
Aug
Sep
Oct
Nov
Dec
Jan
Feb
Mar
Apr
May Jun
Jul
Aug
Sep
Oct
Nov
Dec
Jan
Feb
Mar
Apr
May Jun
Jul
Aug
Sep
Oct
Nov
Dec
2013 2014 2015
Buying Selling
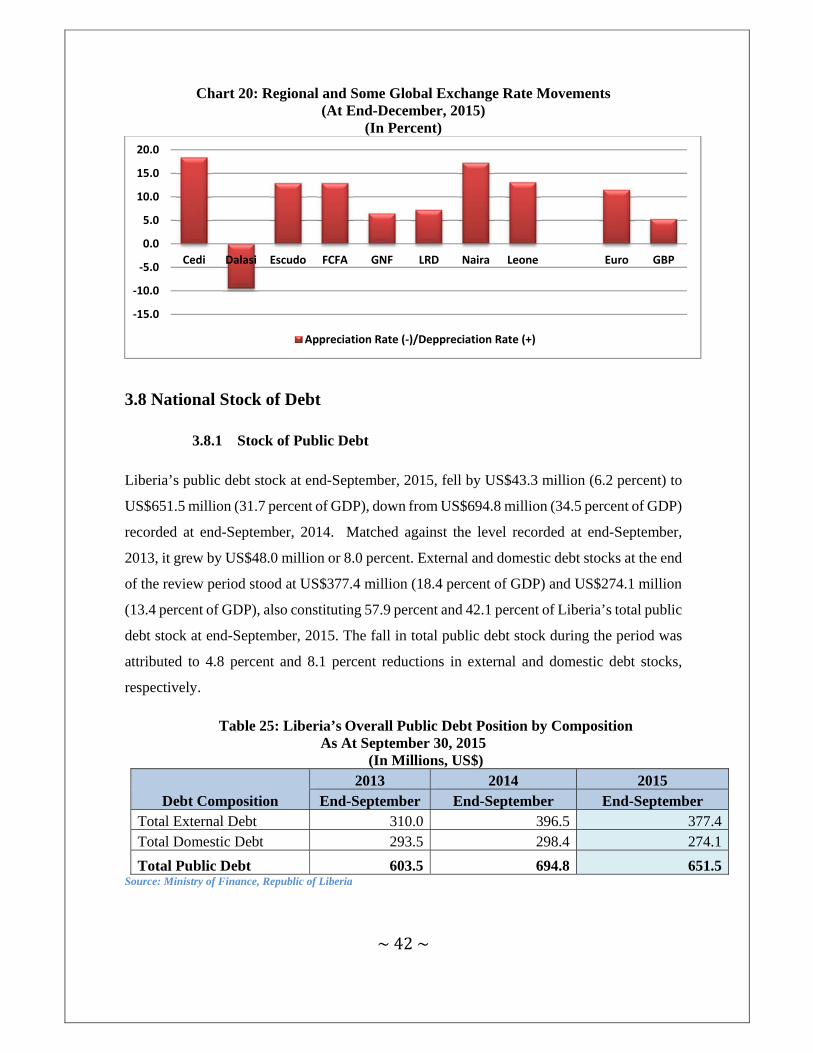
~42~
Chart 20: Regional and Some Global Exchange Rate Movements (At End-December, 2015)
(In Percent)
3.8 National Stock of Debt
3.8.1 Stock of Public Debt
Liberia’s public debt stock at end-September, 2015, fell by US$43.3 million (6.2 percent) to
US$651.5 million (31.7 percent of GDP), down from US$694.8 million (34.5 percent of GDP)
recorded at end-September, 2014. Matched against the level recorded at end-September,
2013, it grew by US$48.0 million or 8.0 percent. External and domestic debt stocks at the end
of the review period stood at US$377.4 million (18.4 percent of GDP) and US$274.1 million
(13.4 percent of GDP), also constituting 57.9 percent and 42.1 percent of Liberia’s total public
debt stock at end-September, 2015. The fall in total public debt stock during the period was
attributed to 4.8 percent and 8.1 percent reductions in external and domestic debt stocks,
respectively.
Table 25: Liberia’s Overall Public Debt Position by Composition As At September 30, 2015
(In Millions, US$)
Debt Composition 2013 2014 2015
End-September End-September End-September Total External Debt 310.0 396.5 377.4 Total Domestic Debt 293.5 298.4 274.1
Total Public Debt 603.5 694.8 651.5 Source: Ministry of Finance, Republic of Liberia
‐15.0
‐10.0
‐5.0
0.0
5.0
10.0
15.0
20.0
Cedi Dalasi Escudo FCFA GNF LRD Naira Leone Euro GBP
Appreciation Rate (‐)/Deppreciation Rate (+)

~43~
Chart 21: Liberia’s Overall Public Debt Position by Composition As At September 30, 2015
(In Millions US$)
3.8.1.1 External Debt
External debt stock at end-September, 2015, stood at US$377.4 million (18.4 percent of
GDP), decreasing by US$19.1 million (4.8 percent) against the stock of US$396.5 million
recorded in the corresponding period. Contrary to the corresponding period, it rose by 21.7
percent compared with the level of US$310.0 million registered at end-September, 2013.
Multilateral and bilateral debt stocks stood at US$343.2 million (90.9 percent) and US$34.2
million (9.1 percent) of the country’s public debt stock at the end of the year. The drop in
Liberia’s external debt stock at end-September, 2015, was attributed to a 71.8 percent
reduction in bilateral debt that offset a 24.7 percent rise in multilateral debt.
3.8.1.2 Domestic Debt
At end-September, 2015, domestic debt stock stood at US$274.1 million (13.4 percent of
GDP), reducing by US$24.3 million (8.1 percent) and US$19.4 million (6.6 percent)
compared with the amounts accumulated at ends-December, 2014 and 2013, respectively. The
reduction in Liberia’s domestic debt stock at end-September, 2015, against the stockpiles at
end-September, 2014 and 2013, was mainly explained by 5.9 percent and 4.3 percent falls in
debt to financial institutions, respectively. Domestic debt stock to financial institutions at end-
September, 2015, fell by US$17.3 million (5.9 percent) and US$19.4 million (4.3 percent)
against the levels recorded at end-September, 2014 and 2013, respectively.
Externat Debt Stock
57.9 %
Domestic Debt Stock
42.1 %
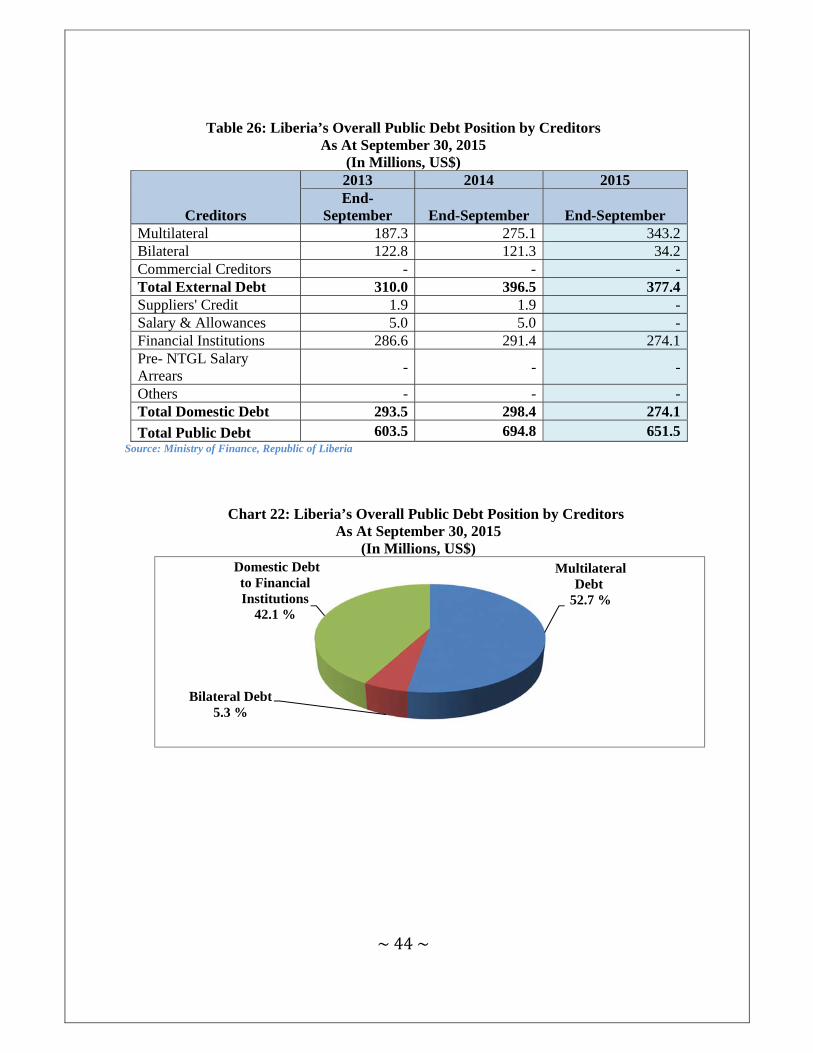
~44~
Table 26: Liberia’s Overall Public Debt Position by Creditors As At September 30, 2015
(In Millions, US$)
Creditors
2013 2014 2015 End-
September End-September End-September Multilateral 187.3 275.1 343.2 Bilateral 122.8 121.3 34.2 Commercial Creditors - - - Total External Debt 310.0 396.5 377.4 Suppliers' Credit 1.9 1.9 - Salary & Allowances 5.0 5.0 - Financial Institutions 286.6 291.4 274.1 Pre- NTGL Salary Arrears
- - -
Others - - - Total Domestic Debt 293.5 298.4 274.1
Total Public Debt 603.5 694.8 651.5 Source: Ministry of Finance, Republic of Liberia
Chart 22: Liberia’s Overall Public Debt Position by Creditors As At September 30, 2015
(In Millions, US$)
Multilateral Debt
52.7 %
Bilateral Debt5.3 %
Domestic Debt to Financial Institutions
42.1 %
~45~
CHAPTER IV Financial System Development
4.1 Overview
The number of licensed and operating banks in the Liberian banking sector in 2015 remained
at 9 as was the case in 2014. However, commercial banks’ branch network around the country
rose by 2, from 85 in 2014 to 87 in 2015.
At end-December 2015, the non-bank financial institutions comprised: 1 development finance
company - the Liberian Enterprise Development Finance Company (LEDFC), 1 microfinance
deposit–taking institution - Diaconia MDI, 20 licensed insurance companies with 30 branches.
The number of registered licensed foreign exchange bureaux increased from 111 in 2014 to
122 in 2015, all operating in Monrovia and its environs. There are 20 registered microfinance
institutions (MFIs), and 9 licensed rural community finance institutions (RCFIs). Although
the Credit Unions (CU) and Village Savings & Loan Association (VSLA) are yet to be
licensed and /or registered with the CBL, there are presently 400 credit unions, and 1450
village savings and loans associations established across the country.
The banking sector continued to experience a wider use of mobile money services and
automated teller machines (ATMS), Point of Sale (POS) Terminals in addition to several new
proprietary financial products. To date, the number of banks issuing debit cards has increased
from 3 to 4 with a total number of 61 Automated Tellers Machines, and 117 Point of Sales.
There is 1 licensed mobile money company: Lonestar Cell Mobile Money Company
Incorporated (LCMMCI).
In spite of the negative impact of the Ebola epidemic in 2014 on all sectors of the Liberian
economy, including the real sector and the financial sector, the financial sector remained
resilient, safe, sound and liquid.

~46~
4.2 The Banking and Non-bank Financial Institutions
4.2.1 The Banking Sector
The number of licensed banks operating in the Liberian banking sector remained 9: the
Liberian Bank for Development and Investment (LBDI), International Bank Liberia Limited
(IBLL), Ecobank Liberia Limited (EBLL), First International Bank (FIBank), Global Bank
Liberia Limited (GBLL), United Bank for Africa Liberia Limited (UBALL), Guaranty Trust
Bank Liberia Limited (GTBLL), Access Bank Liberia Limited (ABLL) and Afriland First
Bank Liberia Limited (AFBLL).
Distribution of banks’ branches by county shows that eleven of the 15 counties now have at
least 1 commercial bank branch while 7 of the counties now have at least 1 rural community
finance institution (RCFI) in operation, including counties that did not have any banking
services (Table 27).
Table 27: Expansion of Bank Branches by County (2014and 2015)
County Number of Branches
Banks’ presence 2014 2015
Montserrado 9 50 51
Margibi 4 9 10
Grand Cape Mount 1 1 1
Grand Bassa 6 6 6
Sinoe 1 1 1
Maryland 2 4 4
Bong 3 3 3
Nimba 5 7 7
Lofa 1 2 2
Grand Gedeh 1 1 1
Bomi 1 1 1
Total 85 87 Source: Central Bank of Liberia, Monrovia, Liberia
4.2.1.1 Balance Sheet of the Banking Sector
The performance of the banking sector shows growth in key balance sheet indicators. At end-
October, 2015, total assets grew by 9.0 percent to L$79,927 million, from L$73,470 million
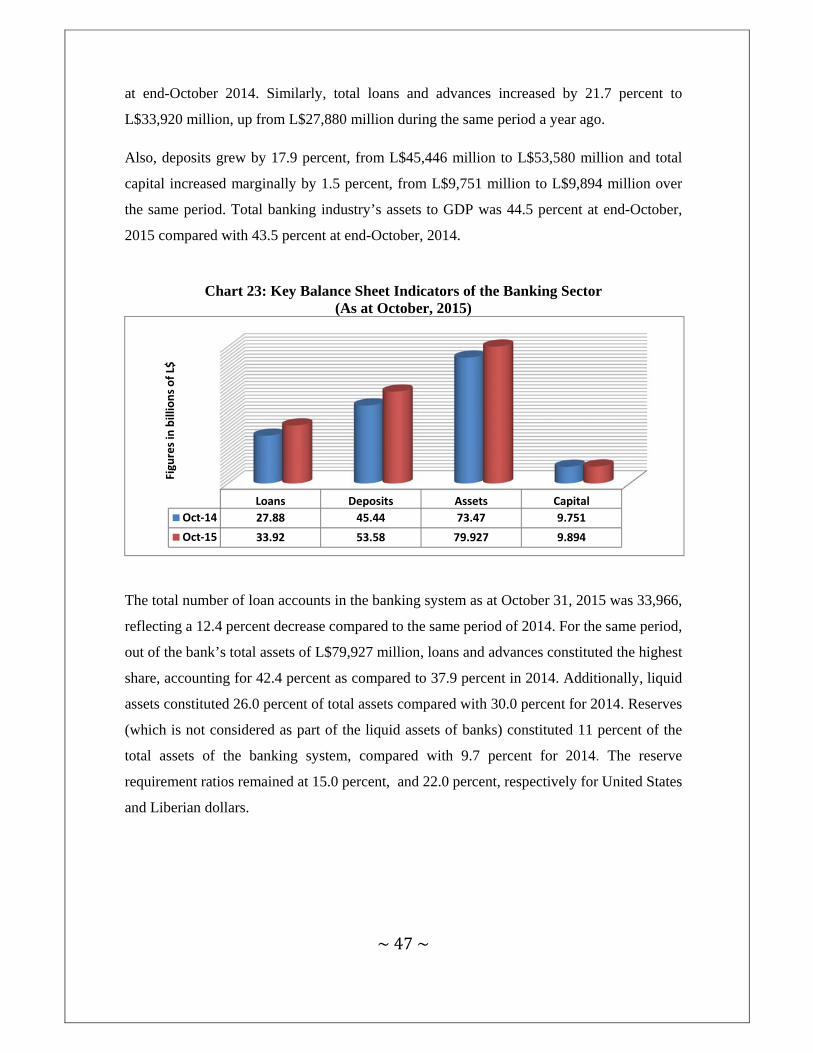
~47~
at end-October 2014. Similarly, total loans and advances increased by 21.7 percent to
L$33,920 million, up from L$27,880 million during the same period a year ago.
Also, deposits grew by 17.9 percent, from L$45,446 million to L$53,580 million and total
capital increased marginally by 1.5 percent, from L$9,751 million to L$9,894 million over
the same period. Total banking industry’s assets to GDP was 44.5 percent at end-October,
2015 compared with 43.5 percent at end-October, 2014.
Chart 23: Key Balance Sheet Indicators of the Banking Sector
(As at October, 2015)
The total number of loan accounts in the banking system as at October 31, 2015 was 33,966,
reflecting a 12.4 percent decrease compared to the same period of 2014. For the same period,
out of the bank’s total assets of L$79,927 million, loans and advances constituted the highest
share, accounting for 42.4 percent as compared to 37.9 percent in 2014. Additionally, liquid
assets constituted 26.0 percent of total assets compared with 30.0 percent for 2014. Reserves
(which is not considered as part of the liquid assets of banks) constituted 11 percent of the
total assets of the banking system, compared with 9.7 percent for 2014. The reserve
requirement ratios remained at 15.0 percent, and 22.0 percent, respectively for United States
and Liberian dollars.
Loans Deposits Assets Capital
Oct‐14 27.88 45.44 73.47 9.751
Oct‐15 33.92 53.58 79.927 9.894
Figures in billions of L$

~48~
Table 28: Composition of the Banking Industry’s Assets
Items Year Oct. 2015 Oct. 2014 Cash 5.0% 5.4% Balances with the Central Bank (C/A) 5.0% 3.3% Net Balances at Commercial Banks 12.0% 17.3% Short Term Securities 5.0% 3.9% LIQUID ASSETS 26.0% 29.8% Reserve Requirement 11.0% 9.7% Checks for Clearing 1.0% 2.0% Accounts Receivable 4.0% 6.0% Bonds & Long Term Securities 1.0% 0.9% Gross loans, Overdrafts and other advances 42.0% 37.9% Accrued Interest 1.0% 0.9% Shares & Other Long Term Investments 1.0% 1.2% Other Assets 9.0% 7.5% Fixed Assets 4.0% 4.0% TOTAL ASSETS 100.0% 100.0% Source: Central Bank of Liberia, Monrovia, Liberia
As at end October 2015, demand deposits constituted 61.7 percent of total deposits compared
with 60.7 percent the same period in 2014; and saving deposits constituted 33.4 percent of
total deposits compared with 34.0 percent during the same period in 2014. The total number
of deposit accounts in the banking system increased by 6.0 percent from 741,142 accounts as
at end-December 2014 to 783,318 accounts as at end-September 2015 (Table 28 & Chart 24).
Chart 24: Deposit Account Trend (2013-Sep, 2015)
‐
200,000
400,000
600,000
800,000
1,000,000
Dec. 2013 Dec. 2014 Sept. 2015
US$ LRD$ TOTAL
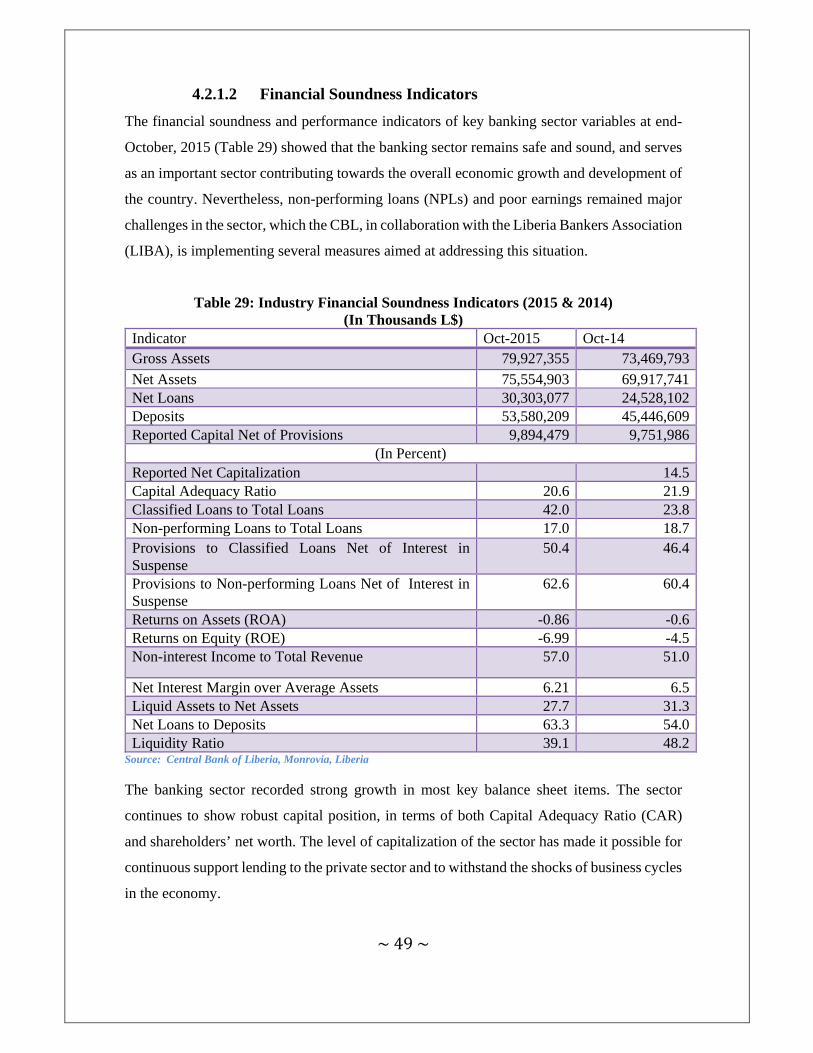
~49~
4.2.1.2 Financial Soundness Indicators
The financial soundness and performance indicators of key banking sector variables at end-
October, 2015 (Table 29) showed that the banking sector remains safe and sound, and serves
as an important sector contributing towards the overall economic growth and development of
the country. Nevertheless, non-performing loans (NPLs) and poor earnings remained major
challenges in the sector, which the CBL, in collaboration with the Liberia Bankers Association
(LIBA), is implementing several measures aimed at addressing this situation.
Table 29: Industry Financial Soundness Indicators (2015 & 2014) (In Thousands L$)
Indicator Oct-2015 Oct-14 Gross Assets 79,927,355 73,469,793
Net Assets 75,554,903 69,917,741 Net Loans 30,303,077 24,528,102 Deposits 53,580,209 45,446,609 Reported Capital Net of Provisions 9,894,479 9,751,986
(In Percent) Reported Net Capitalization 14.5Capital Adequacy Ratio 20.6 21.9Classified Loans to Total Loans 42.0 23.8Non-performing Loans to Total Loans 17.0 18.7Provisions to Classified Loans Net of Interest in Suspense
50.4 46.4
Provisions to Non-performing Loans Net of Interest in Suspense
62.6 60.4
Returns on Assets (ROA) -0.86 -0.6Returns on Equity (ROE) -6.99 -4.5Non-interest Income to Total Revenue 57.0 51.0
Net Interest Margin over Average Assets 6.21 6.5Liquid Assets to Net Assets 27.7 31.3Net Loans to Deposits 63.3 54.0Liquidity Ratio 39.1 48.2
Source: Central Bank of Liberia, Monrovia, Liberia
The banking sector recorded strong growth in most key balance sheet items. The sector
continues to show robust capital position, in terms of both Capital Adequacy Ratio (CAR)
and shareholders’ net worth. The level of capitalization of the sector has made it possible for
continuous support lending to the private sector and to withstand the shocks of business cycles
in the economy.
~50~
Asset quality, measured by the ratio of non-performing loans to total loans, witnessed a 1.7
percentage points improvement from 18.7 percent in 2014 to 17.0 percent in 2015. It is
however important to recognize that the ratio of non-performing loans remains high. The
marginal improvement in NPLs can be in large part attributed to a slowdown in economic
activities, precipitated by the legacy of the outbreak of the Ebola Virus Disease, which has
made it difficult for some borrowers to make repayments on their loan obligations to banks.
Gross earnings for the period ended October, 2015 stood at L$6,692.0 million and net loss for
the same period was L$691.3 million. Compared with a net loss position for the same period
in 2014, net loss increased by 53.0 percent or L$451.9 million. Return on Equity (ROE) and
Return on Asset (ROA) at end-October 2015 were negative 6.99 percent and 0.86 percent,
respectively, compared with negative 4.5 percent and 0.6 percent for ROE and ROA during
the same period a year ago. However, these losses are attributed to a few banks, while a
number of banks have been performing well. Non-interest income, mainly fees and
commissions, constitute the largest portion (about 56.7 percent) of the total income of the
sector, while interest income constituted 51.7 percent. One of the factors responsible for the
lower share of interest income is the problem of NPLs; banks are required to suspend interest
on NPLs thereby shrinking the interest income component of the commercial banks’ income.
Liquidity remained on strong path in 2015. Liquidity ratio for the sector was 39.1 percent at
end-October 2015, reflecting 9.1 percentage points below the liquidity ratio recorded for the
same period in 2014, and 24.1 percentage points above the minimum requirement of 15.0
percent.
4.2.1.3 Implementation of the International Financial Reporting
Standards
Having adopted the International Financial Reporting Standards (IFRS) in 2013, the annual
audited statements of all of the banks have been IFRS compliant. As a further step towards
enhancing the accounting environment in the sector, the CBL is currently developing an IFRS
Accounting Manual for commercial banks with technical assistance from the International
Monetary Fund (IMF). The manual is intended to provide guidance on disclosure requirement
relative to corporate governance and risk management, as well as promote market discipline
and promote confidence of users of financial information.

~51~
4.2.1.4 Rural Community Finance Institutions
During the course of the year, the Central Bank of Liberia, in collaboration with Afriland First
Bank Liberia Limited (AFBLL) as the technical support partner, supported the establishment
of 5 additional RCFIs, bringing the total number of RCFIs to 9 (Table 30). The establishment
of these additional RCFIs has made it possible for each of the fifteen counties to have at least
one financial institution.
Table 30: Expansion of RCFI by County at end-December, 2015
Name of RCFI Location County Number Year of Establishment
Gbeh-ley Geh RCFI Karnplay Nimba 1 2013 Grand Kru RCFI Barclayville Barclayville 1 2014 Rivergee RCFI Fishtown Rivergee 1 2014 Nimba RCFI Sanniquellie Nimba 1 2014 Gbarpolu RCFI Bopulu Gbarpolu 1 2015 Rivercess RCFI Cestos Rivercess 1 2015 Sinoe RCFI Greenville Sinoe 1 2015 Zorleyea Zorzor Lofa 1 2015 Kolahun RCFI Kolahun Lofa 1 2015 Total 9
Source: Central Bank of Liberia, Monrovia, Liberia
The RCFIs, which are owned and managed by members of the community, are licensed to
provide all banking services in the rural area, including taking deposits, extending credits,
paying civil servant salaries as well as Western Union and MoneyGram services.
During 2015, most of the RCFIs facilitated the payment of civil servants salaries with the
support of AFBLL; and discussions are on-going with the Ministry of Finance &
Development Planning to extend the services to all other new RCFIs.
The promotion and establishment of RCFIs throughout the country, particularly in places
without formal financial institutions, remains a cardinal objective of the CBL’s financial
inclusion agenda.
During the year, the CBL sponsored 2 capacity building programs for the RCFIs: (1) resident
training program where CBL staff visited each RCFI to provide hands-on training, and (2) a
workshop on the Regulatory and Supervisory Framework for RCFIs. The Bank also received
a three-month capacity-building support from ACDI/VOCA for providing on-the-field
~52~
consultancy and training for the RCFIs. The full scope onsite examination of RCFIs began
in December, 2015 starting with 4 RCFIs and will continue into 2016.
4.2.2 Developments in the Non-bank Financial Sector
The formal non-bank financial institutions, licensed, regulated and supervised by the Central
Bank currently comprises insurance companies, Insurance intermediaries and agents, deposit–
taking microfinance institutions, development finance institution, rural community finance
institutions, and foreign exchange bureaus.
4.2.2.1 Insurance Sector
The CBL, working in collaboration with development partners as well as other local
stakeholders, continued to strengthen the legal, institutional, and regulatory framework of the
sector. In view of this, the new Insurance Law of 2013 was passed into law, replacing the
1973 Act. Several regulations, aimed at further strengthening the sector, including the new
capital requirements, were issued and published.
At end-2015, the number of licensed insurance companies in the industry remained at 20 and
include Atlantic Life & General Insurance Company (AGLIC), ACTIVA International
Insurance Company (AIIC), Accident & Casualty Insurance Company (ACICO), American
Underwriter Group (AUG), Capital Express Assurance Company (CEAC), International
Insurance Corporation of Liberia (IICL), Medicare Insurance Company (MIC), Palm
Insurance Company (PIC), SAAR Insurance Company (SIC), Secure Risk Insurance
Company (SRIC), Sky International Insurance Company (SIIC), OMEGA Insurance
Company (OIC), African Insurance Corporation of Liberia (AICOL), Blue Cross Insurance
Company (BCIC), Global Trust Assurance Company (GTAC), Continental General & Life
Insurance Company (CGLIC), Mutual Benefit Assurance (MBA), Insurance Company of
Africa (ICA), Family Dollar Insurance Company (FDIC), and Equity Insurance Company
Liberia Limited (EICLL). The insurance sector’s branch network increased from 30 in 2014
to 31 in 2015 (Table 31).
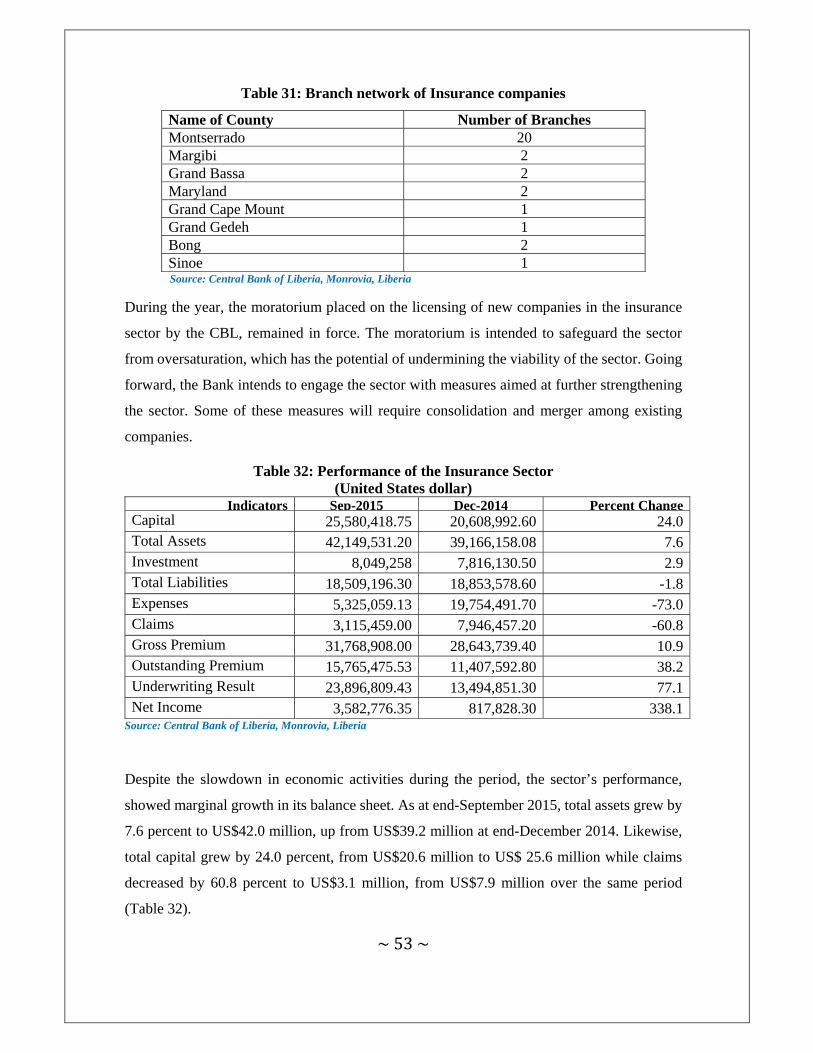
~53~
Table 31: Branch network of Insurance companies
Name of County Number of Branches Montserrado 20 Margibi 2 Grand Bassa 2 Maryland 2 Grand Cape Mount 1 Grand Gedeh 1 Bong 2Sinoe 1 Source: Central Bank of Liberia, Monrovia, Liberia
During the year, the moratorium placed on the licensing of new companies in the insurance
sector by the CBL, remained in force. The moratorium is intended to safeguard the sector
from oversaturation, which has the potential of undermining the viability of the sector. Going
forward, the Bank intends to engage the sector with measures aimed at further strengthening
the sector. Some of these measures will require consolidation and merger among existing
companies.
Table 32: Performance of the Insurance Sector (United States dollar)
Indicators Sep-2015 Dec-2014 Percent ChangeCapital 25,580,418.75 20,608,992.60 24.0Total Assets 42,149,531.20 39,166,158.08 7.6Investment 8,049,258 7,816,130.50 2.9Total Liabilities 18,509,196.30 18,853,578.60 -1.8Expenses 5,325,059.13 19,754,491.70 -73.0Claims 3,115,459.00 7,946,457.20 -60.8Gross Premium 31,768,908.00 28,643,739.40 10.9Outstanding Premium 15,765,475.53 11,407,592.80 38.2Underwriting Result 23,896,809.43 13,494,851.30 77.1Net Income 3,582,776.35 817,828.30 338.1
Source: Central Bank of Liberia, Monrovia, Liberia
Despite the slowdown in economic activities during the period, the sector’s performance,
showed marginal growth in its balance sheet. As at end-September 2015, total assets grew by
7.6 percent to US$42.0 million, up from US$39.2 million at end-December 2014. Likewise,
total capital grew by 24.0 percent, from US$20.6 million to US$ 25.6 million while claims
decreased by 60.8 percent to US$3.1 million, from US$7.9 million over the same period
(Table 32).

~54~
A comprehensive onsite examination of insurance companies commenced during the period
under review with the examinations of four companies concluded. The examination exercise
will continue into 2016. Similarly, the licensing process of insurance intermediaries
(brokerage firms and agents) also commenced during the year under review with 2 brokerage
firms and 46 agents issued licenses.
4.2.2.2 Sub-Regional Insurance Supervisory College
In a meeting of the African Insurance Organization (AIO) held in Tunis, Tunisia in early June,
2015, the heads of insurance regulatory authorities in English speaking West Africa including
Liberia, Nigeria, Ghana, Sierra Leone, and the Gambia, proposed the formation of a West
African Insurance Supervisors Association (WAISA) as a regional supervisory college.
In order to foster this agenda, a forum was proposed to develop a framework for the
establishment of a Supervisory College of Insurance Supervisors in West Africa to enhance
cooperation, information sharing and regulatory coordination amongst insurance supervisors
in the sub-region. This forum was held in Accra, Ghana on June 19, 2015 which gave birth to
the formation of WAISA as the regional supervisory college.
4.2.2.3 Microfinance Deposit-Taking Institutions (MDI)
Licensed in 2014 as the first microfinance deposit-taking institution, Diaconia Microfinance
Deposit-Taking Institution (Diaconia MDI), has been providing access to credit to micro,
small, and medium enterprises, the unserved businesses, and the low income population in
the country, including marketers, “yanny boys”, petty traders and “pen-pen boys”
(commercial motor cyclists). The total assets, loans & advances, and capital as at end-October,
2015, were US$1.1 million, US$0.6 million, and US$1.0 million, respectively. Diaconia has
disbursed loans to a total of 516 clients since it was licensed.
4.2.2.4 Liberian Enterprise Development Finance Company
Licensed as a non-bank financial institution in 2007, the Liberian Enterprise Development
Finance Company (LEDFC) has been engaged in development and trade financing with
extension of access to credit to Liberian-owned Small and Medium Enterprises (SMEs).
LEDFC also provided technical assistance and business capital to small and medium-sized
private enterprises in Liberia.
~55~
Under a new management team in 2013, LEDFC rebranded its services to include construction
financing, agro-processing, real estates, manufacturing, etc. The total assets, loans and
advances, and capital as at end-October 2015 were US$22.2 million, US$ 9.1 million and
US$4.7 million, respectively. LEDFC has disbursed a total of 51 Loans during the year.
4.2.2.5 Foreign Exchange Bureaux Operations
The reform of foreign exchange business, which commenced in 2011, remained on course
during the year. In 2011, the CBL issued licenses to a total of 25 foreign exchange bureau.
At end-November, 2015, the total number of licensed bureaux was 122, reflecting an increase
of 9.9 percent over 2014. Seventy-two (72) of the 122 bureaux are in Category A (i.e. bureaux
with higher capital requirement) and 50 in Category B (i.e. those with lower capital
requirement). Aside from the licensed bureaux’ participation in the CBL foreign exchange
auction, as major players in the foreign exchange market, a couple of the bureaux are also
engaged in providing mobile money services as sub-agents of the commercial banks.
Also, during the year, the CBL, in collaboration with the Association of Foreign Exchange
Bureau and the Liberia National Police (LNP), conducted several enforcement exercises to
remove illegal foreign exchange operators from the streets of Monrovia and its environs. As
a result, a number of illegal operators have consolidated their businesses and obtained licenses
from the CBL.
4.2.2.6 Non-Bank Financial Institution Services
In order to regulate, supervise, and monitor the operations of Mobile Money services in
Liberia, the CBL issued a regulation on Mobile Money in 2011 for bank-financial institutions
to seek approval to engage in mobile money services. A study conducted by United Nations
Capital Development Fund (UNCDF) and United Nations Development Program (UNDP) in
collaboration with the CBL showed that there was a need for the CBL to amend the exclusive
existing bank-only Mobile Money regulation with non-exclusivity rights that will incorporate
other institutions including service providers to drive the financial inclusion aspect of the
mobile money services.
The CBL has issued a license to Lonestar Cell MTM Mobile Money Inc., LCMMMI; a
subsidiary of Lonestar Cell Communication (LCC). Currently, the CBL has approved three
~56~
banks (Ecobank Liberia Limited (EBLL), International Bank Liberia Limited (IBLL) and
Guaranty Trust Bank Liberia Limited (GTBL) with authorization as agents to provide mobile
money services, in partnership with LCMMMI. At end-December, 2015, mobile money
services were provided in all 15 counties. Total deposit and total withdrawals at end-October,
2015, were L$ 227.1 million and L$258.7 million, respectively.
4.3 Microfinance Activities
4.3.1 Overview
During 2015, CBL continued the approach of advancing financial inclusion in Liberia through
the engagement of microfinance institutions, credit unions, village savings and loan
associations, rural community finance institutions. CBL also continued the process of building
the capacity of the apex organizations to deliver services to their primary institutions.
The CBL continued the active engagement of credit unions through the Liberia Credit Union
National Association (LCUNA). Its support has improved the operations of credit unions
around the country by providing some level of financial services to rural Liberians. The credit
unions are now providing mobile money services, enhancing the outreach of financial
services. The UN Capital Development Fund (UNCDF) Micro Lead Project continued during
the year with the completion and dedication of the last regional credit unions office, bringing
the total to 4. This project was implemented by the World Council of Credit Union
(WOCCU).
The National Apex of VSLAs (NAPEX) remains the principal organization serving both rural
and urban women. The significant economic improvement in the lives of women, particularly
in rural Liberia, has been made possible due to financial gains experienced through
membership in VSLA groups. CBL supported NAPEX in building an effective internal
training department. This has resulted in NAPEX’s capability to deliver its VSLA operational
methodology training to over 400 new VSLA groups throughout Liberia at a time when donor
funds for VSLA training operations have been on the decline. Counting on the CBL’s support
through the microfinance program, these VSLA groups have been able to use their capital to
increase their economic returns through various means including value-addition by investing
in agro-processing machines as agricultural VSLAs are doing, moving away from retail to
wholesale businesses; thus, enabling them to purchase more goods and reducing expenses

~57~
associated with travel, etc. The CBL also encouraged and continued to work with these
groups to formalize their operations; an effort which has resulted in increased business
registry, and gradual integration of the informal economy into the mainstream economy.
4.3.2 Improving the Regulatory Environment
During the year, CBL completed and adopted the new Credit Union Regulations aimed at
enhancing effective regulation, monitoring and supervision of all credit unions in the country.
These regulations provide minimum operational guidelines and prudential standards required
of financial credit unions which seek to offer savings deposit and loan services to their
members.
4.3.3 Creating opportunities for Access to Finance:
During the course of the year, the CBL provided supporting initiatives intended to enhance
job creation and improve general access to finance, particularly in rural Liberia. These
initiatives were also geared toward combating the challenges posed by the EVD and to
enhance the revitalization of the rural economy in which large population of Liberians operate.
To this end, under the Loan Extension and Availability Facility (LEAF), the CBL provided a
6-month grace period to its current loan beneficiaries to allow them to rebuild their financial
capacity in the post-Ebola environment. Significant challenges were faced in this sector
including market closures that prevented traders from bringing goods to market; border
closures and travel restrictions, which prevented cross-border traders from traveling; and
failure to harvest, resulting in significant loses to agricultural VSLA groups and farming
cooperatives. As a result, these non-banked groups’ financial capacity deteriorated to the
extent that recovery of loans were also at risk and a variety of steps needed to be taken to
address the situation. The Network for Community Development conducted an impact
assessment and concluded that “the program has helped toward sustaining a stable
macroeconomy and has resulted in strengthening local people’s purchasing power as well as
supporting local investment”. The group concluded that steps were needed to be taken to
support the rural communities’ efforts to rebound in the post Ebola environment. To this end,
the CBL reviewed its microfinance loan portfolio and in addition to the extension of grace
period, it was necessary to consider loan refinancing options for some non-bank groups that
were on track with their repayment prior to the onset of the Ebola virus disease. This allowed
these non-bank groups to benefit from remedial measures which were similarly being

~58~
implemented in the formal banking sector. At end-2015, a total of L$600.0 million had been
allocated to the program. Following the applicable grace period, loan repayment commenced
and at end-2015, a total of L$94,367,366.0 had already been repaid including 6 institutions
that completed early payments of their loans.
4.4 CBL’s Credit Stimulus Initiatives
4.4.1 Background
In the face of limited access to affordable and longer-term credit in the domestic economy as
emphasized in the Poverty Reduction Strategy (PRS) as a major binding constraint to growth,
and being mindful of the need to grow and diversify the economy through empowering
Liberian entrepreneurs to play a more active role in the drive towards broad-based economic
growth, the CBL launched the Economic Stimulus Initiatives Program in 2010. The program
was aligned with the Poverty Reduction Strategy (PRS) and subsequently the Agenda for
Transformation (AfT). The initiatives mainly focused on critical sectors of the economy such
as agriculture, housing and private sector development, particularly SMEs. The overall goal
has been the promotion of job creation and poverty reduction by means of inclusive finance
for development.
The amounts approved for the various initiatives were placed with domestic banks for onward
lending to Liberian-owned SMEs, farmers and low income earners desiring to own their own
homes at affordable interest rates and longer repayment tenures. The participating banks bear
the responsibility and associated risks for lending to borrowers, using their existing due
diligence and risk assessment frameworks. Selection of banks to manage these funds was
based on their experiences in lending to those critical sectors of the economy.
4.4.2 LIBA Credit Stimulus Initiative
In January, 2013, the CBL, in an effort to make finance accessible to Liberian-owned
businesses at convenient terms and affordable interest rates, launched a 5-year LIBA Credit
Stimulus Initiative in the amount of US$4.0 million and L$72.5 million at an interest rate
capped at 7 percent. Four commercial banks were selected to manage these funds. Since its
inception, over 151 businesses in 14 of the 15 counties in the country have benefited from the
scheme. Distribution by gender shows that of the 151 businesses, 107 (71 percent) were

~59~
owned and operated by males while 43 (29 percent) were owned and operated by females.
The total number of Liberians employed as a result of the initiative was 802. As at end-
December, 2015, the total amount disbursed were US$3.6 million and L$63.1 million while
US$0.4 million and L$9.4 million were available for placement.
4.4.3 Mortgage Credit Stimulus Initiative
The Mortgage Stimulus Initiative launched in November, 2013 was geared towards helping
Liberians, especially those in low income block, to own their own homes at affordable cost.
A total of US$10.0 million, capped at 8.0 percent, was placed at a commercial bank in the
country to ensure that working Liberians benefited from the initiative. Of the US$10.0 million,
US$7.0 million was denominated in US dollars while the remaining US$3.0 million was
denominated in Liberian dollars (L$217.5 million). A total of 234 borrowers have subscribed
to the initiative, from 2 of the 15 counties in the country. The scheme has benefited 106 males,
84 females, and 12 males & females joint subscribers. There were also 12 companies that
subscribed. As at end-December, 2015, US$7.7 million and L$135.9 million have been
disbursed while US$0.7 million and L$81.6 million are available for placement.
4.4.4 Agricultural Stimulus Initiative
The average commercial bank lending rate and loan tenure were 14 percent and 24 months,
respectively, and agriculture’s share of total credit to private sector averaged just 4.2 percent
during 2010-2012, largely explained by the relatively longer gestation period required for
major agricultural investments. Realizing the need to boost the country’s productive sector
aimed at particularly reducing the over-reliance on imported food and creating sustainable
livelihood for ordinary Liberians, the Board of Governors of the CBL approved a credit
facility of US$5.0 million and L$181.25 million. These amounts were placed at the Afriland
First Bank on December 13, 2012 at a maximum lending rate of 7.0 percent, of which 2.5
percent was the CBL’s share. The program was focused on the rehabilitation of preexisting
farms with preference for investments requiring minimal gestation periods. The facility
provided structured loans that considered the gestation period and was intended to impact
rural Liberia. The total of US$5.0 million have been disbursed as at end-December, 2015 and
L$113.6 million have also been disbursed for sectors such as rubber, cocoa, coffee, oil palm
among others with a remaining L$67.7 million available for placement. Eleven of the 15
counties have benefitted under the program.

~60~
The Agriculture Stimulus Initiative which was geared towards empowering Liberian farmers
to improve their farming and increase productivity as well as alleviate other constraints has
directly benefited about 51 farmers who are engaged in various agricultural production
activities throughout the country; thus, creating sustainable jobs and economic livelihoods for
a number of ordinary Liberians. In addition, a breakdown of subscribers to the facility shows
that 28 male farmers, 9 female farmers and 14 joint-farmers benefited from the scheme. As a
result of the initiative, agriculture’s share of total private sector credit increased from an
average of 4.2 percent between 2010 and 2012 to an average of 6.6 percent for the period
2013 to November 2015.
~61~
CHAPTER V INTERNAL DEVELOPMENTS OF THE CBL
5.1 Overview
The internal developments of the CBL during 2015 continued to center around strengthening
the capacity of staff with a view to enhance efficiency and productivity of the Bank. Other
areas of emphasis were infrastructure migration to the new CBL’s headquarter,
implementation of supervision application, deployment of SWIFT connectivity and
integration of all major and subcomponents of the National Payments System.
During the year, the CBL adhered to best international accounting and audit standards and
strengthened communication with stakeholders through its regular publications. Also the
Bank worked towards improving the quality of its management information system in order
to reduce the inherent risks to data management and dissemination. Finally, the CBL
continued with its regular community outreach program, with several communities and
institutions benefitting.
5.2 Human Resources Management
The CBL and the Liberia Bankers Association (LBA) conducted 2 middle-level workshops
for staff of the banking sector as a way of upgrading the technical skills of employees,
enhancing the quality of reporting pattern, and raising the level of professional standards in
the sector. The courses offered included Asset-Liability Management and Fraud Prevention
& Detection.
The key objective of the Asset-Liability workshop, inter alias, was to apprise participants on
contemporary issues that involve risk management technique designed to earn an adequate
return while maintaining a comfortable level of assets. The course on Fraud Detection &
Prevention was to ensure that participants are knowledgeable on the variety of skills to detect
and /or prevent fraud by insiders and /or outsiders at the same time protecting earnings and
preventing loss of profit. The workshops were facilitated by senior staff of the CBL and the
commercial banks. A total of 45 participants from the 9 commercial banks attended the
courses; 22 participants for the Asset-Liability Management and 23 for the Fraud Prevention
and Detection.

~62~
Furthermore, staff of the Bank also benefitted from a number of professional training
programs in the sub-region and beyond during the year. The West African Institute for
Financial & Economic Management (WAIFEM) provided training for 15 staff members in
various disciplines including stochastic general equilibrium modeling, fundamentals of
macroeconomic analysis, basic statistics, econometrics and research methods, monetary
policy and macro prudential analysis, and balance of payments statistics. Other courses were
external sector statistics and financial programming and policy organized by the IMF.
Also, other areas of training that benefitted other staff members included computer auditing,
operational risk management & internal audit, risk-based auditing, and Interactive Data
Extraction & Analysis (IDEA).
In response to the installation of a state-of-the-art IT infrastructure in the new CBL’s
Headquarter, and the demand for enterprise solutions for effective management on all fronts,
the Bank intensified vigorous capacity building exercises of staff in areas of VRegCoss, Cyber
Security, CISCO Call Manager, Windows 2012 Server Enterprise, T-24 Temenos, Sun
Solaris/UNIX and Sun Solaris & SWIFT, among others. This was intended to develop the IT
capacity of staff to appreciable levels.
Currently, seven of the Bank’s staff are undergoing post-graduate degree programs outside of
the country; namely, Uganda, Kenya, Ghana and the United Kingdom.
5.3 Management Information System (MIS)
During the year, MIS projects comprised IT infrastructure migration to the CBL new
Headquarter; the implementation of VRegCoss, a supervision IT application used in the
region; the deployment of the AEG SmartConnect for SWIFT connectivity and deployment
and integration of all major and subcomponents of the National Payments System. The
portfolio also included the implementation of the infrastructure of the National Electronic
Payment Switch (NEPS), and the continuous support of the Collateral Registry System.
A key project within the portfolio, the National Payments System, which comprised 3 lots:
Infrastructure Upgrade, Metropolitan Area Network and IT Rooms & Energy Upgrade were
completed at end-December 2015 and are expected to go live in early 2016. The IT data
infrastructure and the Disaster Recovery (DR) site have become a paradigm and a major
~63~
achievement in the modernization of the national payments system. The AfDB which is the
major financier of the project expressed satisfaction with the level of work done thus far.
The DR site manned the CBL business continuity operations and provides backup site of all
IT systems. It provides for high availability of all systems and presents a platform that can be
leveraged with the deployment of any new technology. It also provides expansion capabilities
for almost any IT related project.
The introduction of these new technological platforms for use by end-users including the GOL
and its subsidiaries, commercial banks and the general public has brought about efficiency in
conducting transactions. There is increased use of the Collateral Registry system, GOL, and
Commercial Banks are seamlessly obtaining their automated statements daily online, all
commercial banks are now directly or indirectly connected to the CBL via the MAN
infrastructure. Clearing House is being automated and went live at the end-of the year as
information is being provided in real time.
5.4 Banking Operations
5.4.1 CBL Facilitates Enhancement of Revenue Collection
The CBL continues to facilitate the enhancement of the collection of GoL revenues by
creation of additional collection windows. During the year, the CBL posted additional staff at
the Headquarters of the Liberia Revenue Authority (LRA), which has reduced the hassle of
tax payers standing in long queues and waiting long hours at commercial banks in order to
settle tax obligations to government.
5.4.2 Developments in Currency Management
Currency management which relates to the issuance of notes and coins and the retrieval of
soiled (mutes) notes from circulation including the subsequent destruction of mutilated notes
continued during the year. Toward this end, the CBL on a daily basis collected unfit notes
from the economy through its tellers’ windows. A modernized disintegration system for mutes
handling was established during the year, a major milestone in the development of currency
management at the CBL
The CBL addressed the operational issues in line with policy on currency, such as forecasting
demand for notes, ensuring smooth distribution of banknotes throughout the economy via
~64~
commercial banks and ensuring the integrity of banknotes through sensitization program to
the public.
5.5 The National Payments System
In furtherance of the Payments System reform efforts, the CBL made significant progress in
the implementation of the National Payments Systems Project during the year. The upgrading
of the CBL payment infrastructure which implementation was delayed due to the outbreak of
EVD has been substantially completed. The payments infrastructure is the backbone of the
country's financial nerve center which contains a main data center and a disaster recovery
(DR) site. Upon the completion of the infrastructure component, the software solution's
components which include Real-time Gross Settlement System (RTGS), Automated Check
Processing and Clearing House System (ACP/ACH) system, Scriptless Securities Settlement
System (SSSS), and the National Electronic Payments Switch (NEPS) were fully deployed,
integrated and operationalized.
In terms of work accomplished on the software solution's component, the CBL also started
work on the ACP/ACH system. The system was configured and deployed at each commercial
bank in 2014 and pilot testing was successfully conducted. Go-live was scheduled to coincide
with the completion of the Core Banking Application, T24, the new banking application
replacing the existing banking application, the Bankmaster system. Work is far advanced on
the implementation of the Real-time Gross Settlement System, the National Electronic
Payment Switch, and Scriptless Securities Settlement System (SSSS), and the Core Banking
Application. The system is expected to go-live in early 2016, again upon the completion of
the new Core Banking Application, T24.
The ACP/ACH is intended to enhance efficiency in the processing of checks and other paper-
based payment instruments. With the implementation of the ACP/ACH, check will be cleared
and settled in one day or two instead of the three days under the current semi-automated
system. The RTGS is meant to facilitate interbank funds transfer in real-time and on a
continuous basis throughout a business day, while the SSSS will facilitate the electronic
processing of all securities issued by the government and the CBL.

~65~
5.5.1 National Switch
In order to address the lack of interoperability of existing ATMs and POSs in the country, the
CBL initiated the implementation of the National Electronic Payments Switch project in 2013.
The project implementation comprises a National Shared Switching platform, which is
intended to facilitate interbank transactions switching, Multi-bank Hosting Switch to enable
customers of banks without a switch to have electronic access to the money via another ATM
or POS, and the Visa, MasterCard Gateway Service. The implementation of the national
switch will enable customers of one bank to carry on electronic transactions at other banks'
ATMs or POS at a reduced fee.
5.6 Supervisory and Regulatory Activities
5.6.1 Operations of Collateral Registry of Liberia
The Collateral Registry is a public web-based database system that contains information on
existing security interests (credits secured with movable assets). The establishment of the
Collateral Registry System (CRS) was in keeping with Section 5.51(3) of Title 7 of the Liberia
Commercial Code.
The Registry’s system allows lenders to perfect their security interests in movable assets
(personal properties) presented by the borrowers as collateral and establish priority over the
movable assets based on the date and time of registration of a security interests. The System
supports CBL’s Financial Inclusion Agenda and seeks to bring transparency in the credit
granting process and provides more options of the kind of assets taking as collateral instead
of the traditional immovable assets (land and building). The Collateral Registry System
encourages the use of movable assets to be accepted as collateral to secure a loan.
As at end-November, 2015, the System shows 13 registered clients /creditors, which
comprised 6 legal entity clients and 7 individual clients and 62 loans collateralized with
movable assets registered in the System. The values of the loans constituted US$3.5 million
and L$915.00 thousand. These amounts were extended to 62 debtors in the following
categories: 42 individuals, 3 small firms, 12 medium firms and 5 large firms.
The CBL’s Collateral Registry has 2 Public Access site in Montserrado County: the CBL‘s
Training Center on Carey & Warren Streets and the Liberia Business Association Head Office
~66~
in Paynesville. This initiative taken by the CBL is intended to assist potential users who do
not have access to internet to use these sites to register their security interests in movable
collateral and conduct searches free of charge.
As part of its decentralization strategy on the CRS, the CBL commenced the expansion of the
Registry’s services outside of Monrovia. A feasibility study was conducted by the Bank and
2 counties (Bong and Nimba) were identified for the establishment of additional public access
sites. The additional 2 public access sites are expected to commence services by early January,
2016, while consideration is being given to extending the services to other places in 2016.
Based on the success story of the Liberia Collateral Registry, the CBL was invited to 4
international events to share its experiences with the Collateral Registry program: a study tour
to Savannah, Georgia, USA in May, 2015; the International Financial Infrastructural Week in
Istanbul, Turkey in May, 2015; IFC’s 5th Financial Infrastructure and Risk Management
Training in Rabat, Morocco; and the Movable Collateral Reform /Experiences from Liberia,
in Nairobi, Kenya in 2015.
The Registry also conducted several training programs for various stakeholders, including
Diaconia Microfinance Deposit Taking Institution (DMFI), Bangladesh Rehabilitation
Assistance Committee (BRAC), and Liberia Enterprise Development Finance Company
(LEDFC) on the operations of the Registry’s services.
5.7 Research and Publication
The Research, Policy and Planning Department (RPPD), as the technical arm of the CBL
continued with its regular publications in order to keep the general public abreast about the
Bank’s strategic monetary policy frameworks. To this end, it provided management with
analytical reports aimed at informing policy decision-making for monetary policy
management during the year, 2015. The Department provided regular updates to senior
management on macroeconomic performance including monetary aggregates, exchange rate
and price developments, GDP growth and the external sector conditions.
The CBL also collaborated with institutions and partners at the national, regional and global
levels to ensure effective policy harmonization and coordination aimed at enhancing

~67~
efficiency in monetary operations. The CBL, jointly with the Ministry of Finance and
Development Planning (MFDP), Liberia Revenue Authority (LRA) organized the Liquidity
Working Group (LWG) and continued with the daily liquidity forecasting of banks’ balances
in the industry geared toward informing the Bank’s liquidity management strategies.
The CBL along with the Liberia Institute of Statistics and Geo-information Services (LISGIS)
jointly conducted the weekly market price survey covering goods and services in the
consumer basket, from which information on price developments in the economy are obtained
and published on monthly basis for use by the public and private sectors. During the year, the
Bank continued with the publication of these pieces of information in its Monthly Economics
Review, the bi-monthly Financial Statistics, the quarterly Financial & Economic Bulletin and
other macroeconomic reports.
The Bank also collaborated with the IMF and the UK Department for International
Development (DFID) to develop a work plan that will guide the CBL’s transition from the
use of balance of payment manual 5 (BPM5) to balance of payment manual 6 (BPM6) in the
compilation of the country’s BoP and the compilation of the country’s first ever International
Investment Position (IIP) statement.
5.8 CBL Accounting and Finance
The CBL’s financial statements for the 8th year are being prepared in accordance with
International Financial Reporting Standards (IFRS). These financial statements were audited
by PricewaterhouseCoopers-Ghana, the Bank’s external auditor. The 2015 statutory audit is
expected to be conducted on scheduled, consistent with the provisions of Section 50 of the
CBL Act.
Income and Expenditure
The CBL’s un-audited Income Statement for the year ended 2015 reveals gross
income of L$1,026.23 million, compared with L$2,168.48 million for 2014. The gross
income includes interest income, fees and commission and other income. The decrease
in gross income in 2015 was mainly due to the decline in other income. Increase in
income in 2014 was mainly due to the recognition of income under accrual basis of
accounting resulting from the settlement of the TRADEVCO Loan case. The main

~68~
revenue drivers were interest income of L$ 774.98 million and Fees & commission
amounting to L$214.82 million.
Total expenditure for the year amounted to L$2,856.10 million, compared with
L$2,423.27 million in 2014. This increase is attributed to increase in capital
expenditures and operating expenses resulting from the expanding activities of the
Bank.
Financial Position
The CBL’s un-audited Statement of Financial Position excluding IMF related balances
recorded total assets of L$95,420.93 million for the year ended 2015 compared with
L$95,097.71 million in 2014. This 0.34 percent increase was mainly due to increase
in cash and balances with central banks, increased property, machinery and equipment
and other assets. Excluding the IMF, approximately 41.95 percent of total assets are
represented by claims on the Government of Liberia. The loans are currently
performing based on a memorandum of understanding (MOU) signed in 2007 between
the CBL and the Government of Liberia.
The CBL’s un-audited total liabilities excluding IMF related liabilities at year-end
2015 amounted to L$42,808.07 million, compared with L$36,000.01 million in 2014.
The increase in liabilities of L$6,808.06 million was mainly attributed to increase in
deposit from Government of Liberia and its agencies, deposits from banks as well as
increase in retirement & benefit obligations.
The CBL’s un-audited total owners’ equity at year-end 2015 was L$9,905.45 million,
compared with L$11,230.58 million in 2014, on account of decreased in General
Reserve in 2015.
The Budget
The CBL implemented the 2015 budget as approved by the Board of Governors. The
budget was based on interest income on loans and advances to GOL, interest on
placements abroad as well as service fees and commission, which were used as sources
of income inflows in addition to the Bank’s own reserves to cover operating expenses
and other non-recurrent and capital expenditures.
~69~
The Bank’s net Foreign Reserves for the year ended December 31, 2015 was
US$163.94 million down from US$227.87 million in 2014. The net foreign reserves
comprises CBL net foreign reserves and net SDR Holdings (SDR Holdings less ECF
and RCF Loans). The decrease was mainly due to increase in capital expenditure
occasioned by the completion of the new CBL building and some recurrent
expenditures associated with the expanding activities of the Bank.
5.9 Enterprise Risk Management
The CBL recently embarked on the implementation of an Enterprise Risk Management
(ERM) framework, which is intended to help the CBL effectively manage risk and enhance
its ability to attain the bank’s strategic objectives. To this end, the CBL has taken series of
steps aimed at establishing and implementing an ERM function, namely:
1. The development of the CBL risk statement
This statement defines the general intention of the CBL relative to enterprise risk
management and clarifies the general direction that the bank intends to take.
Additionally, it describes the philosophy and principles upon which the CBL will
enable a culture of proactive risk management. The development of a risk
management policy statement as a fundamental element of the CBL’s risk
management strategic framework will ensure that key principles of best practice are
embedded across the bank. The policy statement confirms the commitment of the
bank to good corporate governance through risk management and defines the broad
accountabilities and structures the CBL will maintain in order to manage risk. Thus,
the basic intent of the CBL risk statement is to affirm the bank’s commitment to
risk management; integrate risk management practices across the CBL; and foster
an environment where staff assume responsibility for managing risks;
2. The development of the Risk Management Framework for active
implementation
The ERM Framework specifically addresses the structures, processes and standards
implemented to manage risks on an enterprise-wide basis in a consistent manner
and it intends to advance the development and implementation of modern
management practices and to support innovation throughout the CBL; contribute to
~70~
building a risk-smart workforce and environment that allows for innovation and
responsible risk-taking while ensuring that legitimate precautions are taken to
protect the bank; and provide guidance for Management and staff when overseeing
or implementing the development of processes, systems and techniques for
managing risks.
3. The development of a full set of governance charter for the Board and its
subcommittees
Though the governance framework for the CBL is set out by the Act of Legislature
which created the Bank, there are many aspects of modern governance that are
important for the Board to consider and agree on. Documenting these governance
arrangements is the role of the board charter. Given that the Board has primary
responsibility to provide and evaluate the strategic direction of the Bank, having
such a key document in an institution such as the CBL has major strategic and
operational risk implications. The purpose of the Board and the sub-committees’
charter, among other things, is to demarcate the roles, functions, responsibilities
and powers of the Board and various sub-committees; matters reserved for final
decision-making or pre-approval by the Board; and the policies and practices of the
Board. It further clarifies both Board’s and Management’s rights, duties, and
responsibilities for the benefit of the Bank and its stakeholders.
4. Defining the overall risk tolerance levels for the main categories of risks the
CBL faces
Risk appetite is a core consideration in an enterprise risk management approach.
By defining its risk appetite, the CBL can arrive at an appropriate balance between
uncontrolled innovation and excessive caution and can provide guidance on the
level of risk permitted to encourage consistency of approach across the Bank. A
defined acceptable level of risk also means that resources are not spent on further
reducing risks that are already at an acceptable level. The risk appetite of the CBL,
therefore, is the level of risk the Board has chosen to take in pursuit of the Bank’s
strategic objectives and is a function of the Bank’s capacity to bear, not exceed,
risk.
~71~
Currently, the ERMS, in collaboration with the Heads and Functional Risk Officers of all
Departments/Sections/Units, is conducting a bank-wide risk assessment process, the end
product of which will be the Bank’s risk register that will serve as the basis of the risk
management activities. Said register will serve as a central repository for the bank’s risk
information and its key function will be to provide management, the board, and key
stakeholders with significant information on the main risks faced by the Bank. Essentially,
the risk register will help management to: understand the nature of the risks the Bank faces;
become aware of the extent of those risks; identify both the level of risk that the CBL is willing
to accept; report the risk status at any point in time; have in place early warning factors and
reporting thresholds; and have risk priority, based on its effect on the bank.
5.10 Internal Audit
The CBL’s Act of 1999 mandates the Internal Audit Section to conduct audit of the
operational activities and accounts of the Bank on a continuous basis. To this end, risk-based
audits of the CBL’s operational activities and accounts were conducted on quarterly, monthly
and daily bases in various departments, sections and units during the year. The Section also
provided independent, objective assurance and advisory services to enhance the Bank’s
operational efficiency.
The CBL is increasing its assertiveness in the Liberian economy. This speaks of the need for
a governance system to be supported by an active and visible internal audit function which
requires improved skills of staff. In pursuant of this, the Bank through its staff development
program sponsored several staff of the Internal Audit Section for training in related disciplines
at various levels.
5.11 Legal Services
Pursuant to its role and responsibilities, the Legal Section provided legal advice and support
to the CBL’s Management, towards the implementation of the Bank’s monetary policy
objectives, and the strengthening of the legal and regulatory frameworks in the institution. In
collaboration with two private law firms, the Legal section represented the Bank’s interest in
the adjudication of several cases. As part of its responsibilities, the Section also supported the
development, drafting, finalization and implementation of agreements, contracts, policies and
laws in collaboration with internal and external stakeholders geared towards ensuring that the

~72~
CBL meets its prescribed statutory mandates that are supportive to economic growth and
development in Liberia.
The Legal Section also worked in concert with other departments of the CBL, other
stakeholders in Government and international partners towards the enactment of the Insurance
Act and the Payments System Act by the National Legislature of Liberia. These two Acts are
serve as the legal and regulatory frameworks for the Insurance Industry of Liberia and the
National Payments System.
The CBL, in collaboration with other stakeholders, is progressing with the drafting and vetting
of the Central Depository Act (CDA) and the establishment of the Capital Market Act (CMA),
both of which are at their final stages of completion for their submission to the National
Legislature for their deliberation and promulgation.
5.12 Communication with Stakeholders
The CBL remained highly committed to stronger communication with the public and private
sectors on macroeconomic developments and activities of the Bank. During the year, the CBL
consulted with major stakeholders including the Executive arm of Government, the Banking
and Currency Committees of the National Legislature, the Bankers’ Association, the Liberia
Business Association, the Foreign Exchange Bureau Association and the Liberia Marketing
Association on consensus building and understanding of policy decisions and various
initiatives of the CBL.
These consultations were largely aimed at enhancing private sector development and
empowerment of Liberian businesses by means of increased access to financial services and
sustainable job creation through inclusive growth. Furthermore, in ensuring the timely
provision of adequate information on developments in the economy, the CBL continued to
make available to the public regularly its various publications on financial and economic
developments.
5.13 Treasury Operations
In an effort to develop the inter-bank market, the Treasury Operations Unit submitted to the
commercial banks a concept note and a draft guideline for the development and operation of
the inter-bank market. The Unit is also working on a concept note on the development of the

~73~
Repo market. In addition, the Draft Securities Market Act and Central Securities Depository
Act have been finalized, including the Rule Book that governs the operations of the proposed
Liberian Stock Exchange.
5.14 Central Bank of Liberia Community Outreach Initiatives in 2015
The CBL continued its support to communities, institutions and students across the country
in 2015. The CBL, during the year, donated US$1,500.00 along with assorted items including
buckets, Clorox and other disinfectants to some Ebola survivors in Nimba County as a means
of identifying with the victims. Of the amount, US$500.00 was for the renovation of hand
pumps in Busie Town, an intervention that made it possible for the provision of safe-drinking
water for over 1,300 inhabitants of the Town.
In its drive to enhance capacity building throughout the country, the CBL made a number of
contributions to needy students during the year. The Bank donated L$6.0 million to the
University of Liberia Student Union (ULSU) in support of its Scholarship Fund Drive. Also,
the Bank contributed a total of L$1.2 million to the St. Francis Community Scholarship
Program aimed at easing the financial burden, left behind by the EVD, on students and
parents.
Finally, the CBL Staff Association (CEBSA), during the year, identified with residents of
various communities including Leprosy Village in Massatain Town, Grand Cape Mount
county; Vonjaima Trade Fare Ground, Lofa County; Ganta and Sanniquillie, Nimba County;
and Mother Comfort Orphanage on the Police Academic Road, Paynesville Monotserrado
County, respectively. CEBSA distributed assorted items including food, clothing, school
supplies, sporting materials and household utensils, among others, valued at US$8,875.00.

~74~
CHAPTER VI EXTERNAL RELATIONS
6.1 Overview
As was the case in 2014, the CBL maintained a cordial working relationship with its
multilateral partners including the International Monetary Fund (IMF), the World Bank and
the African Development Bank (AfDB) during the year. It held a number of regular meetings,
consultations on policy matters relative to financial and macroeconomic developments in the
domestic economy, benefited from trainings and technical assistance as well as exchanged
data with these institutions. The CBL also maintained a good working relationship with sub-
regional and regional institutions including the West African Monetary Institute (WAMI),
West African Monetary Agency (WAMA), West African Institute for Financial and
Economic Management (WAIFEM) and the Association of African Central Banks (AACB).
6.2 International Monetary Fund and the World Bank
6.2.1 International Monetary Fund
The CBL continued its engagement with the IMF at the level of policy consultation, technical
assistance, memorandum of understanding and the request for waiver and modification of
non-observance of performance criterion under the Extended and Rapid Credit Facilities
Arrangements (ECF and RCF). The IMF also continued its technical assistance to the CBL in
areas of capacity development, helping with the improvement of the quality of research,
compilation of monetary and liquidity forecasting, price, and balance of payments statistics
as well as financial soundness indicators, capital market development and the insurance
sector.
6.2.2 The World Bank
During the year, the CBL continued its engagement with the World Bank Group’s institutions,
the International Finance Company (IFC) and the FIRST Initiative in areas of financial system
reform including support to the establishment of a collateral registry and development of the
capital market. The Bank also remains a key development partner of the Government in the
provision of financial support to ongoing infrastructure projects, especially electricity and
road.
~75~
6.3 Regional and Sub-Regional Organizations
During the year, the CBL participated in a series of meetings of regional institutions in Africa
which included those of the West African Monetary Zone (WAMZ), the ECOWAS
Commission (EC) and the Association of African Central Banks (AACB). The WAMZ is an
association of 6 West African countries including Liberia, Nigeria, Ghana, Sierra Leone,
Guinea and The Gambia.
Under the roadmap of the single currency Program of the WAMZ, macroeconomic
performances of the member countries are assessed on a bi-annual basis to determine their
levels of preparedness for the creation of the single currency. There were no statutory
meetings of the WAMZ during the year under review principally as a result of the Ebola Virus
Disease (EVD) epidemic that affected three of the member states of the WAMZ—Liberia,
Guinea and Sierra Leone. However, the Committee of Governors of Member States held an
Extraordinary Meeting in Abuja, Nigeria, to discuss and make decisions on a number of
administrative and developmental issues relative to the Single Currency Program as well as
the role of central banks in their respective economies.
Also participating in this meeting were representatives of the ECOWAS Commission and
WAMI. Those attending as observers included representatives of the West African Monetary
Agency, the West African Institute for Financial and Economic Management, Union
Economique et Monetaire Quest African (UEMOA), Bank Centrale des Etats de l’Afrique de
l’ouest (BCEAO), ECOWAS Bank for Investment and Development (EBID), Association of
African Central Banks (AACB), and African Development Bank (AfDB).
Despite the adverse impact of the EVD on the Liberian economy during the year under review,
the CBL, in concert with other stakeholders, exerted tremendous efforts at ensuring that
Liberia meets all of the convergence criteria as required under the roadmap of the Single
Currency Program of the WAMZ. At the end of the 3rd quarter of the year under review, the
Joint Multilateral Surveillance Mission including ECOWAS Commission, WAMA and
WAMI visited Liberia and conducted an assessment of the performance of the economy and
the status of convergence in the context of the rationalized criteria for the creation of the single
currency.
~76~
According to the Mission’s report, Liberia’s performance on the macroeconomic convergence
thresholds improved significantly during 2015 as compared to 2014. It satisfied 3 of the 4
primary criteria including a single digit inflation, budget deficit/GDP ratio and central bank
financing of government’s budget deficit relative to previous year’s tax revenue, and slipped
on the gross external reserves criterion. Regarding the secondary criteria, the country
sustained its performance by satisfying all of the 2 criteria—the exchange rate variation and
public debt/GDP ratio.
Regarding the role of central banks in the macroeconomy, a communiqué was issued at the
end of the African Caucus Meeting in Abuja in which the Governors:
(i) unanimously agreed that inadequate infrastructure continues to be a serious
constraint to Africa’s development and that the need for industrialization of the
continent is urgent and requires central banks’ long term commitment in
developing timely strategies to tackle the issue of inclusive growth and the
equitable allocation of resources and benefits of development;
(ii) observed that the narrow mandate of central banks that focuses on price and
financial stability is not sufficient for direct financing of Africa’s industrialization,
and that despite increasing growth of diaspora remittances to accompany capital
inflows, these have not been fully harnessed to finance industrialization, especially
SMEs;
(iii) recommended that the role of central banks as economic advisors to government
should be exploited in the context of promoting domestic and continental
industrialization agenda, and that their mandate should not only be limited to
promoting price stability, but to be extended to include critical developmental
roles with effective support to the fiscal authorities, within a macroeconomic
policy framework;
(iv) recommended that with widespread poverty and unemployment, central banks can
use monetary policy, through credit and exchange rate policies, to support
economic growth and development as is done in some countries such as India,
Cambodia and China. Central banks could also promote development through
support for specialized development finance institutions; and
~77~
(v) recommended that central banks should establish appropriate mechanisms to tap
into various sources of capital such as diaspora remittances, pension funds,
sovereign wealth funds and excess foreign exchange reserves, to finance SMEs
and industrialization.
6.3.1 Strengthening of Supervisory Cooperation
During the course of the year, the CBL actively participated in the activities of the College of
Supervisors of the West African Monetary Zone (CSWAMZ) and the Association of African
Central Banks (AACBs). The College brings together the Directors of the Bank Supervision
Department of the WAMZ to discuss pertinent cross-border regulatory and supervisory issues
as well as financial matters affecting the global economy including national crisis resolutions,
amongst others. The AACB is involved in the strengthening and building the capacity of bank
supervisors relative to banking regulations & supervision through the conduct of seminars
across the continent. The CBL attended the AACB’s seminar on Macro-Prudential
Surveillance: Multiple views, One Objective held in Algiers, Algeria, in September 2015. The
CBL is also an active member of the Committee of Banking Supervisors of West and Central
Africa (CBSWCA), the College of Supervisors of Ecobank Group and UBA Group.