Embed Size (px)
Citation preview

TBC links
Cover option A
Electric InsightsQuarterly
January to March 2021
Dr Iain Staffell Professor Richard Green Professor Tim Green and Dr Malte Jansen Imperial College London
Dr Nina Skorupska CBE REA
Drax Electric Insights Quarterly ndash Q1 2021
2
Contents
1 Headlines 3
2 Cold weather and tight margins 4
3 Britainrsquos transition from coal to biomass to BECCS 6
4 IFA2 goes online 9
5 When the wind goes gas fills in the gap 10
6 Capacity and production statistics 12
7 Power system records 13
Electric Insights was established by Drax to help inform and enlighten the debate on Britainrsquos electricity Since 2016 it has been delivered independently by a team of academics at Imperial College London using data courtesy of Elexon National Grid and Sheffield Solar
Drax Electric Insights Quarterly ndash Q1 2021
3
Summary of Britainrsquos electricity generation mix over the first quarter of 2021
1 Headlines
The start of 2021 saw unusually cold weather coupled with plant outages which created very tight supply margins throughout January Despite Britain still being under lockdown insufficient capacity was expected to be available to meet demand leading to some of the highest power prices in two decades We compare Britainrsquos situation to the blackouts which swept through Texas at the start of the year due to extreme weather
A new interconnector to France came online in January increasing Britainrsquos capacity for trading power with neighbours by 20 Imports hit an all-time record high even though the Dutch interconnector was unavailable for much of the quarter due to prolonged outages
Commercial power generation ended one of Britainrsquos remaining coal power stations leaving only two stations now in regular operation At the same time biomass output hit a record high peaking at over 38 GW for the first time as plants ran flat out when capacity was scarce We look at the history of Britainrsquos transition from coal to biomass and the future of moving towards negative-emissions biomass with carbon capture and storage
Wind power contributed heavily to Scotland achieving 97 renewable electricity generation in 2020 and Britainrsquos wind farms produced record power output this quarter reaching over 18 GW for the first time However March saw the longest lsquocold calm spellrsquo in over a decade for 11 days straight wind farms operated at just 11 of their rated capacity Dealing with extended wind lulls could be biggest challenge we face in fully decarbonising Britainrsquos electricity system
Gas power stations picked up the slack which contributed to gas generation being up 20 on this quarter last year This highlights the need for flexible backup in the power system While burning gas without capturing the CO2 is a viable solution for now it will not be possible to rely on unabated fossil fuels for balancing in future if the UK is to hit its net zero targets We explore the options Britain has for balancing wind variability in future
January February March0
10
20
30
40
GW Wind Everything elseFossil
Drax Electric Insights Quarterly ndash Q1 2021
4
Jan 13th
Jan 8th
February March
poundMWh
0
200
400
600
800
1000
January
Jan 6th
Peak
Daily average
Electricity Market Notice (EMN)
Daily average and maximum electricity prices on the British day-ahead market in Q1 2021
2 Cold weather and tight margins
The Texas blackout dominated the newspaper headlines in February An lsquoarctic outbreakrsquo plunged south from Canada sending temperatures down to as low as ndash22degC more than forty degrees below typical February temperatures Electricity demand surged as people tried to stay warm but at the same time as gas and wind power stations shut down because of the extreme conditions Blackouts affected 43 million Texans with some lasting for 3 days and at least 31 lives were lost Power prices spiked to $8800 per MWh on February 17th in Dallas and Fort Worth ndash almost 200 times their normal level Some households on variable rate tariffs were hit with bills over ten thousand dollars and three utility companies have already declared bankruptcy
Closer to home Europe was hit by its own polar vortex creatively dubbed lsquoThe Beast from the East 2rsquo After seeing the coldest January since 2010 temperatures in February fell to a low of ndash23degC in Braemar (Aberdeenshire) This pushed electricity demand up by 15 compared to the surrounding weeks due to increased heating load Demand pushed above 48 GW for the first time since 2019 despite the country still being under full lockdown
This increased demand came at an inconvenient time as nuclear outages were prolonged through winter and the Dutch interconnector (which normally supplies a steady 1 GW to Britain) was also offline This left the market lsquotightrsquo meaning short of capacity National Grid ESO (electricity system operator) issued three Electricity Margin Notices (EMN) in January alone making six in total for this winter The last such notice was issued back in 2016 highlighting the extended stress the system was under
These EMNs communicate to the market that electricity is in short supply and the grid running into its security buffers On the 6th January there was a predicted shortfall of 06 GW capacity rising to 12 GW on both the 8th and 13th of January This is the largest ever shortfall in supply ndash equivalent to one of Britainrsquos largest power stations going missing The ESO also issued an Electricity Capacity Market Notice (ECMN) on the 8th for only the third time in its history In the end these notices achieved their aim of bringing more capacity online or persuading flexible consumers (such as industry) to reduce their demand
Drax Electric Insights Quarterly ndash Q1 2021
5
The shortfalls did not lead to any blackouts but did cause the highest power prices of this century Day-ahead market prices rose to pound1063 per MWh on January 13th their highest since 1995 (when they were driven up by capacity payments that were abolished in 2001) While this is 25 times higher than the average price over the past year extreme prices are not passed on to households directly as they are in Texas
Britainrsquos power system did not suffer the same catastrophic failure as in Texas for many reasons While they share some similarities (high shares of wind power limited connection to neighbouring power systems) the UK suffered much less severe weather and is more accustomed to winter storms and so is better prepared for them
Wind turbines are weatherised so they can continue operation when temperatures fall below freezing and gas supplies come from the North Sea pipelines and via ships which are unaffected by cold weather compared to on-land gas rigs in Texas which froze over
However the Texan experience helps to remind us about the interdependency of energy services Going forward with our decarbonisation we must ensure that the resilience of the energy system to extreme weather events is designed into the transition to net zero This might provide an argument for decarbonising household heating systems with a mix of hydrogen and electric heat pumps as the lsquoall electricrsquo future provides a single point of failure
The highest wholesale power price seen in each month since the British electricity market began
0
200
400
600
800
1000
pound1063MWhJan 2021
pound1108MWhDec 1995
poundMWh
1990 1995 2000 2005 2010 2015 2020
Drax Electric Insights Quarterly ndash Q1 2021
6
Britain moved one step closer to its 202425 target of phasing out coal power completely while biomass generation hit new record highs On the 5th of March Drax announced that it had ceased commercial power generation from coal1 after 47 years at the UKrsquos largest power station This leaves just two coal power stations operating in Britain as 85 of the countryrsquos coal fleet have retired over the last ten years
Meanwhile biomass power stations reached new records generating 381 GW on the 27th of March Biomass output is likely to grow further as a new biomass-powered combined heat and power unit at Teesside is expected to come online later this year
Global leadershipCurrently biomass supplies 2 of the worldrsquos electricity though this share is higher in Europe having grown five-fold since 2000 to hit 6 in 20202 One explanation for this comes from countries such as Denmark and Sweden which have extensive municipal electricity and combined heat and power production
Another reason is the UK Our share of electricity generation from biomass has tripled over the past decade hitting an all-time high of 11 in 20202 This means the UK has the highest share of electricity production from biomass of any large country (ones with over 100 TWhyear electricity demand)
The UK pioneered large-scale use of biomass for electricity generation contributing to its world-leading success in decarbonising electricity over the last decade This position means the UK has also played a major part in developing the science-led sustainability criteria that govern the use of biomass
The transition from coal to biomass to BECCS (bioenergy with carbon capture and storage) outlines the versatility of biomass for electricity generation to contribute at each stage of the decarbonisation journey In a high-coal system (the UKrsquos past) biomass conversions allow for rapid carbon reductions whilst utilising existing infrastructure and preserving the reliable functionality of firm dispatchable power In a high-renewables system (increasingly the UKrsquos present) biomass offers flexibility services including inertia and grid balancing This helps the overall system to integrate variable renewables and lowers grid management costs Finally looking to the future BECCS offers the possibility of negative emissions which the Climate Change Committee describe as ldquoa necessityrdquo for net zero and beyond
Share of electricity generated from biomass in 2020 across all countries worldwide which consume more than 100 TWh of electricity per year 2
3 Britainrsquos transition from coal to biomass to BECCS
1 These units will still operate in the capacity market until they are fully decommissioned in 2022 meaning they could be called upon to provide peak capacity at times of system stress2 Data from Emberrsquos Global Electricity Review
0 2 4 6 8 10
Not shown Iran Iraq Saudi Arabia UAE Venezuela Vietnam mdash all 0
UK
Thailand
Germany
Brazil
Sweden
Netherlands
Italy
Japan
Poland
Spain
Pakistan
Canada
China
France
Turkey
Taiwan
Australia
US
Argentina
India
Mexico
Malaysia
Norway
South Korea
Russia
Indonesia
Ukraine
South Africa
Egypt
UK
Drax Electric Insights Quarterly ndash Q1 2021
7
Looking to the past Coal dominated Britainrsquos electricity generation until just a decade ago However since 2018 Britain has produced more electricity from biomass than it has from coal There are three main reasons why Britainrsquos coal plants closed down
Clean air legislation forced older plants to close if they did not fit equipment to capture harmful sulphur and nitrous oxide emissions Secondly many plants closed on economic grounds either because they were reaching the end of their design life and the cost of maintaining them outweighed the revenue they could bring in or they could simply no longer compete in the market A key factor in this was government policy raising the cost of emitting carbon so coal plants became more expensive than gas With demand falling and renewables taking a larger share there was simply no room left for them to make a profit
When these units retired they needed to be replaced by a clean electricity source that could provide baseload generation producing electricity when it is needed However research shows that in addition these coal retirements also led to a 30 increase in output from natural gas plants (37 TWh extra in 2019)3
The third source of coal plant closures was conversion to biomass Although they represent the smallest share of capacity (with 32 GW converted) they have delivered greater carbon savings because not only did they reduce the amount of coal burnt they replaced it with a low-carbon source of electricity Coal to biomass conversions therefore limited ndash rather than increased ndash gas generation Comparing 2012 to 2019 they reduced carbon emissions by 10 MtCO2 per year slightly more than achieved by the 8 GW of onshore wind farms installed in that time3
3 R Green and I Staffell 2021 The contribution of taxes subsidies and regulations to British electricity decarbonisation EPRG 2105
The change in coal power station capacity over the last decade and main categories of coal plant closures
0
5
10
15
20
25
30
2010
280
85
minus32
minus61
minus101
Biomassconversions
2020
GW
Air qualitylegislation
Economicclosures
Drax Electric Insights Quarterly ndash Q1 2021
8
Annual electricity generation from solid fuels in Britain and the average carbon intensity of electricity shown over the past three
decades and the next three decades according to National Gridrsquos ldquoLeading the Wayrdquo future energy scenario
Looking to the futureNational Grid ESOrsquos Future Energy Scenarios see biomass playing an increased role in coming decades Current unabated biomass (where emissions from generating electricity are offset by regrowing it) plays a key step towards the deployment of BECCS (bioenergy with carbon capture and storage) from the late 2020s
Bioenergy (the lsquoBErsquo in lsquoBECCSrsquo) operates by growing and continuously regrowing plants that are then used for energy The carbon emitted during energy generation is reabsorbed by the regrowth of the plants meaning net-zero emissions Supply chain emissions are then counted on top of this in accordance with a strict sustainability governance regime hence Electric Insights considers biomass as producing 121 grams of CO2 per kWh of electricity
If emissions from the power station are instead captured and locked away underground (the lsquoCCSrsquo in lsquoBECCSrsquo) the plants being grown and regrown actually remove carbon from the atmosphere over and above simply offsetting the bioenergy emissions Therefore BECCS as a whole can deliver negative emissions as part of a major energy source
The deployment of BECCS means annual carbon emissions from electricity generation could fall negative as early as 2030 in National Gridrsquos scenarios My the mid-2030s BECCS could be removing 40 MtCO2 per year from the atmosphere comparable to total annual emissions in 2020
The IEA remarked in 2018 that ldquomodern bioenergy is the overlooked giant of the renewable energy fieldrdquo With the potential for sustainable expansion and the use of carbon capture to deliver negative emissions this could take a more visible role in the UKrsquos future
TWh
1990 2000 2010 2020 2030 2040 2050
0
40
80
120
160
20
60
100
140
0
minus200
400
200
600
800
Electricity generation begins to remove more CO2 than it emits
gkWhCarbon Intensity
Biomass BECCSCoal
Drax Electric Insights Quarterly ndash Q1 2021
9
4 IFA2 goes online
A new power link between the UK and France went online in January meaning Britainrsquos interconnector capacity has doubled over the last decade to 6 GW IFA2 is one of Britainrsquos two undersea connection to France coming some 60 years after the first link was built and 35 years after that was replaced by IFA (which still operates today) The pound700m IFA2 project jointly owned by National Grid and RTE (their French equivalent) spans 130 miles under the English Channel to connect Portsmouth with Caen in Normandy
After some early teething troubles the new link has imported 20 times more power than it exported since it went into operation on January 22nd Imports of electricity to Britain rose to new record levels although they could have been higher still
Despite very good historical reliability the BritNed cable between Britain and the Netherlands was out of action for most of the quarter from mid-December through to mid-February and again since mid-March As a result Dutch imports were down 60 and exports down 90 compared to the first quarter last year Cable faults are responsible for both outages being found on December 8th last year (and taking three months to repair) and again on March 9th this year (with an estimated two months to repair)
There were initial reports that the end of the Brexit transition period led to reduced trade over the interconnectors to Ireland at the start of this year sending power prices rocketing The UK left Europersquos Internal Energy Market on the 31st December 2020 which increased friction for trading However it appears this was only a short-term blip mdash trade fell by 40 between December 2020 and January 2021 but then recovered completely in February Over the first quarter of this year trade with the Irish power market was 1 higher than the average during 2019-20
Work on a third interconnector to France will begin later this year and links to Norway and Denmark are currently under construction These will begin to be shown on the Electric Insights webpage in the coming months With these and the return of the Dutch interconnector to service Britain is set to source an increasing share of its power from abroad in the coming years
Installed capacity of interconnectors in Great Britain over the last two decades
Daily trade over the BritNed interconnector during the past six months
0
1
2
3
4
5
6
GW
IFA (France)
Moyle (Northern Ireland)
BritNed (Netherlands)
East West (Republic of Ireland)
Nemo Link (Belgium)
IFA2 (France)
2000 2005 2010 2015 2020
minus04
minus02
02
0
04
06
08
1
Imports from the Netherlands
Exports to the Netherlands
Oct Nov Dec Jan Feb Mar
GW
Drax Electric Insights Quarterly ndash Q1 2021
10
At the start of March Britain experienced its longest spell of low wind output in more than a decade For more than a week calm weather covered the country Wind farm output fell to as low as 06 GW on the 3rd of March in sharp contrast to the 181 GW delivered later on that month Power prices were typical for the time of year suggesting that the system wasnrsquot particularly stressed though
A prolonged period of low wind and low solar power output has been coined in German as a lsquoDunkelflautersquo (dunk-el-flout-eh) mdash a dark wind lull The event at the start of March was the longest Dunkelflaute that Britain has experienced in the last decade Between the 26th of February and the 8th of March the capacity factor1 of the national wind fleet did not go above 20 Its average over these 11 days was just 11 less than a quarter of their average in the month either side
Both the frequency and duration of these events matters Looking back over the Electric Insights archives this was the longest cold-calm spell that Britain has experienced in over a decade February 2010 also saw 11 days with wind capacity factors never going above 20 However back in 2010 most of Britainrsquos wind farms were onshore and so average capacity factors were lower Also the impact of low wind speeds was barely noticeable back in 2010 as Britainrsquos wind capacity then was one-sixth of current levels
Based on longer records of historical wind speed data from Renewablesninja the March Dunkelflaute could be expected roughly once every 20 years statistically speaking Prolonged low-wind periods should be accounted for when designing Britainrsquos energy system security and they should not be seen as a lsquoblack swan eventrsquo which cannot be anticipated
The power system coped in March because the shortfall in wind was made up by fossil fuels particularly the 28 GW of gas power stations Fossil fuels peaked at a 73 share of all electricity generation on the 6th of March While coal and biomass stations ran at close to full output to help Britainrsquos nuclear output actually fell to its lowest this year during the low-wind period Nuclear output dropped to just 36 GW 30 below its average for the quarter as maintenance outages continued to affect the fleet
5 When the wind goes gas fills in the gap
Britainrsquos wind farm capacity factor over the past six months highlighting times when it fell below 20 for more than a day
1 Power output as a fraction of total installed capacity
0
60
40
2011 days
Oct Nov Dec Jan Feb Mar
Drax Electric Insights Quarterly ndash Q1 2021
11
The UKrsquos ambition to reach net zero would prohibit the use of (unabated) gas power plants for such long periods While a variety of clean flexibility options could replace gas the scale and duration of wind droughts may rule many of them out
The lull in March saw a deficit of over 10 GW of wind capacity compared to the surrounding weeks and some 2300 GWh of energy In comparison the UKrsquos largest storage facility ndash the Dinorwig pumped hydro plant in North Wales ndash stores just 9 GWh Battery storage systems are ideal for providing peak power but their duration (and total energy storage) is limited Over 10000 of the worldrsquos largest battery storage systems would be needed to cover the shortfall occupying a space the size of Liverpool city2
Interconnectors can help but these weather patterns tend to affect the entire north-west of Europe meaning our neighbouring countries would also be short of capacity Flexible demand may be insufficient for a different reason ndash households and industries may be willing to turn down their consumption for a few hours at a time but doing so for over a week straight is another matter This restricts the options for dealing with large-scale weather variability to longer-duration storage or low- and zero-carbon fuels such as biomass and potentially hydrogen in the future The four biomass domes at Drax Power Station hold enough fuel to generate 600 GWh of electricity showing the scale that storable fuels can attain
Weather variability will play an important part in the planning and operation of Britainrsquos future energy system The recent power outage in Texas highlights the cost of overlooking extreme weather risks (noting that it was gas generation rather than wind which drove this crisis) Securely managing wind variability will likely require policy and market innovations not just technical fixes
The output from Britainrsquos wind farms is almost exclusively balanced by gas power stations Throughout the quarter their outputs were the mirror image of one another performing an elaborate dance to keep the system balanced For every GW that wind output falls gas output rises by 084 GW When all other generation sources are combined their output only varies by 10 around their average of 13 GW across the quarter
Daily average output from wind farms and gas power stations during Quarter 1 of 2021
2 Based on a 6500 msup2 footprint estimated for the South Australia battery farm
0
5
10
15
20
GW GasWind
January February March
753 TWhsupplied
376
256
144
86
75
27
22
13
Gas
Wind
Nuclear
Imports
Biomass
Coal
Solar
Hydro
Share of the mix
Drax Electric Insights Quarterly ndash Q1 2021
12
Installed Capacity (GW) Energy Output (TWh) Utilisation Capacity Factor
2021 Q1 Annual change 2021 Q1 Annual change Average Maximum
Nuclear 95 ~ 108 ndash15 (ndash12) 53 65
Biomass 38 +01 (+4) 56 +05 (+10) 68 100
Hydro 12 ~ 10 ndash05 (ndash35) 40 96
Wind
ndash of which Onshore
ndash of which Offshore
244
137
107
+09 (+4)
~
+09 (+9)
193
87
106
ndash40 (ndash17)
ndash 22 (ndash20)
ndash 18 (ndash14)
37
30
46
74
73
88
Solar 132 +01 (+1) 17 ndash03 (ndash14) 6 63
Gas 276 ndash05 (ndash2) 283 +49 (+21) 48 86
Coal 38 ndash14 (ndash27) 20 ndash09 (ndash31) 20 100
Imports60 +10 (+20)
72 +05 (+7) 58 97
Exports 07 ndash01 (ndash14) 6 61
Storage discharge31 ~
05 +01 (+12) 7 61
Storage recharge 05 ndash00 (ndash5) 7 76
6 Capacity and production statistics
Electricity production from gas rose 20 from this time last year driven by lower wind output and continued nuclear outages It was by no means a bad quarter for wind farms ndash their productivity was typical for winter at 37 ndash but this was much lower than during the unusually stormy start to 2020
Britainrsquos nuclear reactors on the other hand ran at just 53 capacity factor during the quarter when ideally they should be running 247 Their utilisation was only slightly higher than that of gas power stations
Demand was almost the same as Q1 last year as the demand reductions from the country being under lockdown were offset by it being on average 1 degree colder
Both biomass and coal power stations hit a peak of 100 capacity factor during the quarter meaning every station was running at full power at the same time This is highly unusual for coal which was called on extensively during periods of tight margins in January
Britainrsquos remaining coal capacity fell by one quarter as Drax announced the end of commercial operation for its two remaining coal units in Yorkshire This leaves two coal power stations remaining ndash West Burton A and Ratcliffe on Soar both in Nottinghamshire due to close in 2022 and 2024
Britainrsquos electricity supply mix in the first quarter of 2021
Installed capacity and electricity produced by each technology 1 2
1 Other sources give different values because of the types of plant they consider For example BEIS Energy Trends records an additional 07 GW of hydro 06 GW of biomass and 3 GW of waste-to-energy plants These plants and their output are not visible to the electricity transmission system and so cannot be reported on here
2 We include an estimate of the installed capacity of smaller storage devices which are not monitored by the electricity market operator Britainrsquos storage capacity is made up of 29 GW of pumped hydro storage 06 GW of lithium-ion batteries 04 GW of flywheels and 03 GW of compressed air
Drax Electric Insights Quarterly ndash Q1 2021
13
7 Power system records
March the 28th was a record-breaking day for Britainrsquos power system Wind farms produced more than 18 GW for the first time Over the whole day renewables produced two-thirds of the countryrsquos electricity demand pushing fossil fuels to their lowest ever share of electricity generation under one-eighth of the dayrsquos electricity
January also saw the highest power prices in over a decade averaging pound71MWh for the month On the 8th real-time prices hit a record pound4000MWh and on the 13th day-ahead prices (which are normally much smoother) peaked at over pound1000MWh for the first time in over two decades
The tables below look over the past decade (2009 to 2021) and report the record output and share of electricity generation plus sustained averages over a day a month and a calendar year1 Cells highlighted in blue are records that were broken in the first quarter of 2021 Each number links to the date it occurred on the Electric Insights website allowing these records to be explored visually
All Renewables ndash Maximum
Output (MW) Share ()
Instantaneous 25790 695
Daily average 20786 663
Month average 16030 443
Year average 11896 379
Biomass ndash Maximum
Output (MW) Share ()
Instantaneous 3831 168
Daily average 3316 129
Month average 2849 88
Year average 2216 71
Wind ndash Maximum
Output (MW) Share ()
Instantaneous 18120 609
Daily average 16844 534
Month average 12346 341
Year average 7817 249
Solar ndash Maximum
Output (MW) Share ()
Instantaneous 9680 331
Daily average 3386 136
Month average 2651 100
Year average 1372 44
1 The annual records relate to calendar years covering the period of 2009 to 2020
Gross demand
Maximum (MW) Minimum (MW)
Instantaneous 60070 16934
Daily average 49203 23297
Month average 45003 26081
Year average 37736 30709
Demand (net of wind and solar)
Maximum (MW) Minimum (MW)
Instantaneous 59563 6605
Daily average 48823 9454
Month average 43767 18017
Year average 36579 21520
Drax Electric Insights Quarterly ndash Q1 2021
14
Day ahead wholesale price
Maximum (poundMWh) Minimum (poundMWh)
Instantaneous 106327 ndash7284
Daily average 19745 ndash1135
Month average 7112 2203
Year average 5682 3388
Carbon intensity
Maximum (gkWh) Minimum (gkWh)
Instantaneous 704 18
Daily average 633 61
Month average 591 141
Year average 508 172
pound CO2
All fossil fuels ndash Maximum
Output (MW) Share ()
Instantaneous 49307 880
Daily average 43085 864
Month average 36466 812
Year average 29709 763
All fossil fuels ndash Minimum
Output (MW) Share ()
Instantaneous 2369 88
Daily average 3789 121
Month average 7382 278
Year average 11336 361
All low carbon ndash Maximum
Output (MW) Share ()
Instantaneous 32688 897
Daily average 27282 825
Month average 23276 654
Year average 17930 583
All low carbon ndash Minimum
Output (MW) Share ()
Instantaneous 3395 83
Daily average 5007 108
Month average 6885 167
Year average 8412 216
CO2 CO2
Nuclear ndash Maximum
Output (MW) Share ()
Instantaneous 9342 428
Daily average 9320 320
Month average 8649 265
Year average 7604 220
Nuclear ndash Minimum
Output (MW) Share ()
Instantaneous 2488 81
Daily average 2665 103
Month average 4232 129
Year average 5397 172
Coal ndash Maximum
Output (MW) Share ()
Instantaneous 26044 614
Daily average 24589 520
Month average 20746 480
Year average 15628 420
Coal ndash Minimum
Output (MW) Share ()
Instantaneous 0 00
Daily average 0 00
Month average 0 00
Year average 499 16
Drax Electric Insights Quarterly ndash Q1 2021
15
Gas ndash Maximum
Output (MW) Share ()
Instantaneous 27131 726
Daily average 24210 613
Month average 20828 548
Year average 17930 460
Gas ndash Minimum
Output (MW) Share ()
Instantaneous 1556 49
Daily average 3071 95
Month average 6775 199
Year average 9159 246
Imports ndash Maximum
Output (MW) Share ()
Instantaneous 5827 191
Daily average 4985 155
Month average 3796 106
Year average 2850 86
Pumped storage ndash Maximum 2
Output (MW) Share ()
Instantaneous 2660 79
Daily average 409 12
Pumped storage ndash Minimum 2
Output (MW) Share ()
Instantaneous ndash2782 ndash108
Daily average ndash622 ndash17
Exports ndash Maximum
Output (MW) Share ()
Instantaneous minus3870 minus143
Daily average ndash2748 ndash79
Month average ndash1690 ndash39
Year average ndash731 ndash19
2 Note that Britain has no inter-seasonal electricity storage so we only report on half-hourly and daily records Elexon and National Grid only report the output of large pumped hydro storage plants The operation of battery flywheel and other storage sites is not publicly available
Drax Group plcDrax Power Station Selby North Yorkshire YO8 8PH
Imperial Consultants58 Princersquos Gate Exhibition Road London SW7 2PGwwwimperial-consultantscoukwwwdraxcomConsultImperialDraxGroup

Drax Electric Insights Quarterly ndash Q1 2021
2
Contents
1 Headlines 3
2 Cold weather and tight margins 4
3 Britainrsquos transition from coal to biomass to BECCS 6
4 IFA2 goes online 9
5 When the wind goes gas fills in the gap 10
6 Capacity and production statistics 12
7 Power system records 13
Electric Insights was established by Drax to help inform and enlighten the debate on Britainrsquos electricity Since 2016 it has been delivered independently by a team of academics at Imperial College London using data courtesy of Elexon National Grid and Sheffield Solar
Drax Electric Insights Quarterly ndash Q1 2021
3
Summary of Britainrsquos electricity generation mix over the first quarter of 2021
1 Headlines
The start of 2021 saw unusually cold weather coupled with plant outages which created very tight supply margins throughout January Despite Britain still being under lockdown insufficient capacity was expected to be available to meet demand leading to some of the highest power prices in two decades We compare Britainrsquos situation to the blackouts which swept through Texas at the start of the year due to extreme weather
A new interconnector to France came online in January increasing Britainrsquos capacity for trading power with neighbours by 20 Imports hit an all-time record high even though the Dutch interconnector was unavailable for much of the quarter due to prolonged outages
Commercial power generation ended one of Britainrsquos remaining coal power stations leaving only two stations now in regular operation At the same time biomass output hit a record high peaking at over 38 GW for the first time as plants ran flat out when capacity was scarce We look at the history of Britainrsquos transition from coal to biomass and the future of moving towards negative-emissions biomass with carbon capture and storage
Wind power contributed heavily to Scotland achieving 97 renewable electricity generation in 2020 and Britainrsquos wind farms produced record power output this quarter reaching over 18 GW for the first time However March saw the longest lsquocold calm spellrsquo in over a decade for 11 days straight wind farms operated at just 11 of their rated capacity Dealing with extended wind lulls could be biggest challenge we face in fully decarbonising Britainrsquos electricity system
Gas power stations picked up the slack which contributed to gas generation being up 20 on this quarter last year This highlights the need for flexible backup in the power system While burning gas without capturing the CO2 is a viable solution for now it will not be possible to rely on unabated fossil fuels for balancing in future if the UK is to hit its net zero targets We explore the options Britain has for balancing wind variability in future
January February March0
10
20
30
40
GW Wind Everything elseFossil
Drax Electric Insights Quarterly ndash Q1 2021
4
Jan 13th
Jan 8th
February March
poundMWh
0
200
400
600
800
1000
January
Jan 6th
Peak
Daily average
Electricity Market Notice (EMN)
Daily average and maximum electricity prices on the British day-ahead market in Q1 2021
2 Cold weather and tight margins
The Texas blackout dominated the newspaper headlines in February An lsquoarctic outbreakrsquo plunged south from Canada sending temperatures down to as low as ndash22degC more than forty degrees below typical February temperatures Electricity demand surged as people tried to stay warm but at the same time as gas and wind power stations shut down because of the extreme conditions Blackouts affected 43 million Texans with some lasting for 3 days and at least 31 lives were lost Power prices spiked to $8800 per MWh on February 17th in Dallas and Fort Worth ndash almost 200 times their normal level Some households on variable rate tariffs were hit with bills over ten thousand dollars and three utility companies have already declared bankruptcy
Closer to home Europe was hit by its own polar vortex creatively dubbed lsquoThe Beast from the East 2rsquo After seeing the coldest January since 2010 temperatures in February fell to a low of ndash23degC in Braemar (Aberdeenshire) This pushed electricity demand up by 15 compared to the surrounding weeks due to increased heating load Demand pushed above 48 GW for the first time since 2019 despite the country still being under full lockdown
This increased demand came at an inconvenient time as nuclear outages were prolonged through winter and the Dutch interconnector (which normally supplies a steady 1 GW to Britain) was also offline This left the market lsquotightrsquo meaning short of capacity National Grid ESO (electricity system operator) issued three Electricity Margin Notices (EMN) in January alone making six in total for this winter The last such notice was issued back in 2016 highlighting the extended stress the system was under
These EMNs communicate to the market that electricity is in short supply and the grid running into its security buffers On the 6th January there was a predicted shortfall of 06 GW capacity rising to 12 GW on both the 8th and 13th of January This is the largest ever shortfall in supply ndash equivalent to one of Britainrsquos largest power stations going missing The ESO also issued an Electricity Capacity Market Notice (ECMN) on the 8th for only the third time in its history In the end these notices achieved their aim of bringing more capacity online or persuading flexible consumers (such as industry) to reduce their demand
Drax Electric Insights Quarterly ndash Q1 2021
5
The shortfalls did not lead to any blackouts but did cause the highest power prices of this century Day-ahead market prices rose to pound1063 per MWh on January 13th their highest since 1995 (when they were driven up by capacity payments that were abolished in 2001) While this is 25 times higher than the average price over the past year extreme prices are not passed on to households directly as they are in Texas
Britainrsquos power system did not suffer the same catastrophic failure as in Texas for many reasons While they share some similarities (high shares of wind power limited connection to neighbouring power systems) the UK suffered much less severe weather and is more accustomed to winter storms and so is better prepared for them
Wind turbines are weatherised so they can continue operation when temperatures fall below freezing and gas supplies come from the North Sea pipelines and via ships which are unaffected by cold weather compared to on-land gas rigs in Texas which froze over
However the Texan experience helps to remind us about the interdependency of energy services Going forward with our decarbonisation we must ensure that the resilience of the energy system to extreme weather events is designed into the transition to net zero This might provide an argument for decarbonising household heating systems with a mix of hydrogen and electric heat pumps as the lsquoall electricrsquo future provides a single point of failure
The highest wholesale power price seen in each month since the British electricity market began
0
200
400
600
800
1000
pound1063MWhJan 2021
pound1108MWhDec 1995
poundMWh
1990 1995 2000 2005 2010 2015 2020
Drax Electric Insights Quarterly ndash Q1 2021
6
Britain moved one step closer to its 202425 target of phasing out coal power completely while biomass generation hit new record highs On the 5th of March Drax announced that it had ceased commercial power generation from coal1 after 47 years at the UKrsquos largest power station This leaves just two coal power stations operating in Britain as 85 of the countryrsquos coal fleet have retired over the last ten years
Meanwhile biomass power stations reached new records generating 381 GW on the 27th of March Biomass output is likely to grow further as a new biomass-powered combined heat and power unit at Teesside is expected to come online later this year
Global leadershipCurrently biomass supplies 2 of the worldrsquos electricity though this share is higher in Europe having grown five-fold since 2000 to hit 6 in 20202 One explanation for this comes from countries such as Denmark and Sweden which have extensive municipal electricity and combined heat and power production
Another reason is the UK Our share of electricity generation from biomass has tripled over the past decade hitting an all-time high of 11 in 20202 This means the UK has the highest share of electricity production from biomass of any large country (ones with over 100 TWhyear electricity demand)
The UK pioneered large-scale use of biomass for electricity generation contributing to its world-leading success in decarbonising electricity over the last decade This position means the UK has also played a major part in developing the science-led sustainability criteria that govern the use of biomass
The transition from coal to biomass to BECCS (bioenergy with carbon capture and storage) outlines the versatility of biomass for electricity generation to contribute at each stage of the decarbonisation journey In a high-coal system (the UKrsquos past) biomass conversions allow for rapid carbon reductions whilst utilising existing infrastructure and preserving the reliable functionality of firm dispatchable power In a high-renewables system (increasingly the UKrsquos present) biomass offers flexibility services including inertia and grid balancing This helps the overall system to integrate variable renewables and lowers grid management costs Finally looking to the future BECCS offers the possibility of negative emissions which the Climate Change Committee describe as ldquoa necessityrdquo for net zero and beyond
Share of electricity generated from biomass in 2020 across all countries worldwide which consume more than 100 TWh of electricity per year 2
3 Britainrsquos transition from coal to biomass to BECCS
1 These units will still operate in the capacity market until they are fully decommissioned in 2022 meaning they could be called upon to provide peak capacity at times of system stress2 Data from Emberrsquos Global Electricity Review
0 2 4 6 8 10
Not shown Iran Iraq Saudi Arabia UAE Venezuela Vietnam mdash all 0
UK
Thailand
Germany
Brazil
Sweden
Netherlands
Italy
Japan
Poland
Spain
Pakistan
Canada
China
France
Turkey
Taiwan
Australia
US
Argentina
India
Mexico
Malaysia
Norway
South Korea
Russia
Indonesia
Ukraine
South Africa
Egypt
UK
Drax Electric Insights Quarterly ndash Q1 2021
7
Looking to the past Coal dominated Britainrsquos electricity generation until just a decade ago However since 2018 Britain has produced more electricity from biomass than it has from coal There are three main reasons why Britainrsquos coal plants closed down
Clean air legislation forced older plants to close if they did not fit equipment to capture harmful sulphur and nitrous oxide emissions Secondly many plants closed on economic grounds either because they were reaching the end of their design life and the cost of maintaining them outweighed the revenue they could bring in or they could simply no longer compete in the market A key factor in this was government policy raising the cost of emitting carbon so coal plants became more expensive than gas With demand falling and renewables taking a larger share there was simply no room left for them to make a profit
When these units retired they needed to be replaced by a clean electricity source that could provide baseload generation producing electricity when it is needed However research shows that in addition these coal retirements also led to a 30 increase in output from natural gas plants (37 TWh extra in 2019)3
The third source of coal plant closures was conversion to biomass Although they represent the smallest share of capacity (with 32 GW converted) they have delivered greater carbon savings because not only did they reduce the amount of coal burnt they replaced it with a low-carbon source of electricity Coal to biomass conversions therefore limited ndash rather than increased ndash gas generation Comparing 2012 to 2019 they reduced carbon emissions by 10 MtCO2 per year slightly more than achieved by the 8 GW of onshore wind farms installed in that time3
3 R Green and I Staffell 2021 The contribution of taxes subsidies and regulations to British electricity decarbonisation EPRG 2105
The change in coal power station capacity over the last decade and main categories of coal plant closures
0
5
10
15
20
25
30
2010
280
85
minus32
minus61
minus101
Biomassconversions
2020
GW
Air qualitylegislation
Economicclosures
Drax Electric Insights Quarterly ndash Q1 2021
8
Annual electricity generation from solid fuels in Britain and the average carbon intensity of electricity shown over the past three
decades and the next three decades according to National Gridrsquos ldquoLeading the Wayrdquo future energy scenario
Looking to the futureNational Grid ESOrsquos Future Energy Scenarios see biomass playing an increased role in coming decades Current unabated biomass (where emissions from generating electricity are offset by regrowing it) plays a key step towards the deployment of BECCS (bioenergy with carbon capture and storage) from the late 2020s
Bioenergy (the lsquoBErsquo in lsquoBECCSrsquo) operates by growing and continuously regrowing plants that are then used for energy The carbon emitted during energy generation is reabsorbed by the regrowth of the plants meaning net-zero emissions Supply chain emissions are then counted on top of this in accordance with a strict sustainability governance regime hence Electric Insights considers biomass as producing 121 grams of CO2 per kWh of electricity
If emissions from the power station are instead captured and locked away underground (the lsquoCCSrsquo in lsquoBECCSrsquo) the plants being grown and regrown actually remove carbon from the atmosphere over and above simply offsetting the bioenergy emissions Therefore BECCS as a whole can deliver negative emissions as part of a major energy source
The deployment of BECCS means annual carbon emissions from electricity generation could fall negative as early as 2030 in National Gridrsquos scenarios My the mid-2030s BECCS could be removing 40 MtCO2 per year from the atmosphere comparable to total annual emissions in 2020
The IEA remarked in 2018 that ldquomodern bioenergy is the overlooked giant of the renewable energy fieldrdquo With the potential for sustainable expansion and the use of carbon capture to deliver negative emissions this could take a more visible role in the UKrsquos future
TWh
1990 2000 2010 2020 2030 2040 2050
0
40
80
120
160
20
60
100
140
0
minus200
400
200
600
800
Electricity generation begins to remove more CO2 than it emits
gkWhCarbon Intensity
Biomass BECCSCoal
Drax Electric Insights Quarterly ndash Q1 2021
9
4 IFA2 goes online
A new power link between the UK and France went online in January meaning Britainrsquos interconnector capacity has doubled over the last decade to 6 GW IFA2 is one of Britainrsquos two undersea connection to France coming some 60 years after the first link was built and 35 years after that was replaced by IFA (which still operates today) The pound700m IFA2 project jointly owned by National Grid and RTE (their French equivalent) spans 130 miles under the English Channel to connect Portsmouth with Caen in Normandy
After some early teething troubles the new link has imported 20 times more power than it exported since it went into operation on January 22nd Imports of electricity to Britain rose to new record levels although they could have been higher still
Despite very good historical reliability the BritNed cable between Britain and the Netherlands was out of action for most of the quarter from mid-December through to mid-February and again since mid-March As a result Dutch imports were down 60 and exports down 90 compared to the first quarter last year Cable faults are responsible for both outages being found on December 8th last year (and taking three months to repair) and again on March 9th this year (with an estimated two months to repair)
There were initial reports that the end of the Brexit transition period led to reduced trade over the interconnectors to Ireland at the start of this year sending power prices rocketing The UK left Europersquos Internal Energy Market on the 31st December 2020 which increased friction for trading However it appears this was only a short-term blip mdash trade fell by 40 between December 2020 and January 2021 but then recovered completely in February Over the first quarter of this year trade with the Irish power market was 1 higher than the average during 2019-20
Work on a third interconnector to France will begin later this year and links to Norway and Denmark are currently under construction These will begin to be shown on the Electric Insights webpage in the coming months With these and the return of the Dutch interconnector to service Britain is set to source an increasing share of its power from abroad in the coming years
Installed capacity of interconnectors in Great Britain over the last two decades
Daily trade over the BritNed interconnector during the past six months
0
1
2
3
4
5
6
GW
IFA (France)
Moyle (Northern Ireland)
BritNed (Netherlands)
East West (Republic of Ireland)
Nemo Link (Belgium)
IFA2 (France)
2000 2005 2010 2015 2020
minus04
minus02
02
0
04
06
08
1
Imports from the Netherlands
Exports to the Netherlands
Oct Nov Dec Jan Feb Mar
GW
Drax Electric Insights Quarterly ndash Q1 2021
10
At the start of March Britain experienced its longest spell of low wind output in more than a decade For more than a week calm weather covered the country Wind farm output fell to as low as 06 GW on the 3rd of March in sharp contrast to the 181 GW delivered later on that month Power prices were typical for the time of year suggesting that the system wasnrsquot particularly stressed though
A prolonged period of low wind and low solar power output has been coined in German as a lsquoDunkelflautersquo (dunk-el-flout-eh) mdash a dark wind lull The event at the start of March was the longest Dunkelflaute that Britain has experienced in the last decade Between the 26th of February and the 8th of March the capacity factor1 of the national wind fleet did not go above 20 Its average over these 11 days was just 11 less than a quarter of their average in the month either side
Both the frequency and duration of these events matters Looking back over the Electric Insights archives this was the longest cold-calm spell that Britain has experienced in over a decade February 2010 also saw 11 days with wind capacity factors never going above 20 However back in 2010 most of Britainrsquos wind farms were onshore and so average capacity factors were lower Also the impact of low wind speeds was barely noticeable back in 2010 as Britainrsquos wind capacity then was one-sixth of current levels
Based on longer records of historical wind speed data from Renewablesninja the March Dunkelflaute could be expected roughly once every 20 years statistically speaking Prolonged low-wind periods should be accounted for when designing Britainrsquos energy system security and they should not be seen as a lsquoblack swan eventrsquo which cannot be anticipated
The power system coped in March because the shortfall in wind was made up by fossil fuels particularly the 28 GW of gas power stations Fossil fuels peaked at a 73 share of all electricity generation on the 6th of March While coal and biomass stations ran at close to full output to help Britainrsquos nuclear output actually fell to its lowest this year during the low-wind period Nuclear output dropped to just 36 GW 30 below its average for the quarter as maintenance outages continued to affect the fleet
5 When the wind goes gas fills in the gap
Britainrsquos wind farm capacity factor over the past six months highlighting times when it fell below 20 for more than a day
1 Power output as a fraction of total installed capacity
0
60
40
2011 days
Oct Nov Dec Jan Feb Mar
Drax Electric Insights Quarterly ndash Q1 2021
11
The UKrsquos ambition to reach net zero would prohibit the use of (unabated) gas power plants for such long periods While a variety of clean flexibility options could replace gas the scale and duration of wind droughts may rule many of them out
The lull in March saw a deficit of over 10 GW of wind capacity compared to the surrounding weeks and some 2300 GWh of energy In comparison the UKrsquos largest storage facility ndash the Dinorwig pumped hydro plant in North Wales ndash stores just 9 GWh Battery storage systems are ideal for providing peak power but their duration (and total energy storage) is limited Over 10000 of the worldrsquos largest battery storage systems would be needed to cover the shortfall occupying a space the size of Liverpool city2
Interconnectors can help but these weather patterns tend to affect the entire north-west of Europe meaning our neighbouring countries would also be short of capacity Flexible demand may be insufficient for a different reason ndash households and industries may be willing to turn down their consumption for a few hours at a time but doing so for over a week straight is another matter This restricts the options for dealing with large-scale weather variability to longer-duration storage or low- and zero-carbon fuels such as biomass and potentially hydrogen in the future The four biomass domes at Drax Power Station hold enough fuel to generate 600 GWh of electricity showing the scale that storable fuels can attain
Weather variability will play an important part in the planning and operation of Britainrsquos future energy system The recent power outage in Texas highlights the cost of overlooking extreme weather risks (noting that it was gas generation rather than wind which drove this crisis) Securely managing wind variability will likely require policy and market innovations not just technical fixes
The output from Britainrsquos wind farms is almost exclusively balanced by gas power stations Throughout the quarter their outputs were the mirror image of one another performing an elaborate dance to keep the system balanced For every GW that wind output falls gas output rises by 084 GW When all other generation sources are combined their output only varies by 10 around their average of 13 GW across the quarter
Daily average output from wind farms and gas power stations during Quarter 1 of 2021
2 Based on a 6500 msup2 footprint estimated for the South Australia battery farm
0
5
10
15
20
GW GasWind
January February March
753 TWhsupplied
376
256
144
86
75
27
22
13
Gas
Wind
Nuclear
Imports
Biomass
Coal
Solar
Hydro
Share of the mix
Drax Electric Insights Quarterly ndash Q1 2021
12
Installed Capacity (GW) Energy Output (TWh) Utilisation Capacity Factor
2021 Q1 Annual change 2021 Q1 Annual change Average Maximum
Nuclear 95 ~ 108 ndash15 (ndash12) 53 65
Biomass 38 +01 (+4) 56 +05 (+10) 68 100
Hydro 12 ~ 10 ndash05 (ndash35) 40 96
Wind
ndash of which Onshore
ndash of which Offshore
244
137
107
+09 (+4)
~
+09 (+9)
193
87
106
ndash40 (ndash17)
ndash 22 (ndash20)
ndash 18 (ndash14)
37
30
46
74
73
88
Solar 132 +01 (+1) 17 ndash03 (ndash14) 6 63
Gas 276 ndash05 (ndash2) 283 +49 (+21) 48 86
Coal 38 ndash14 (ndash27) 20 ndash09 (ndash31) 20 100
Imports60 +10 (+20)
72 +05 (+7) 58 97
Exports 07 ndash01 (ndash14) 6 61
Storage discharge31 ~
05 +01 (+12) 7 61
Storage recharge 05 ndash00 (ndash5) 7 76
6 Capacity and production statistics
Electricity production from gas rose 20 from this time last year driven by lower wind output and continued nuclear outages It was by no means a bad quarter for wind farms ndash their productivity was typical for winter at 37 ndash but this was much lower than during the unusually stormy start to 2020
Britainrsquos nuclear reactors on the other hand ran at just 53 capacity factor during the quarter when ideally they should be running 247 Their utilisation was only slightly higher than that of gas power stations
Demand was almost the same as Q1 last year as the demand reductions from the country being under lockdown were offset by it being on average 1 degree colder
Both biomass and coal power stations hit a peak of 100 capacity factor during the quarter meaning every station was running at full power at the same time This is highly unusual for coal which was called on extensively during periods of tight margins in January
Britainrsquos remaining coal capacity fell by one quarter as Drax announced the end of commercial operation for its two remaining coal units in Yorkshire This leaves two coal power stations remaining ndash West Burton A and Ratcliffe on Soar both in Nottinghamshire due to close in 2022 and 2024
Britainrsquos electricity supply mix in the first quarter of 2021
Installed capacity and electricity produced by each technology 1 2
1 Other sources give different values because of the types of plant they consider For example BEIS Energy Trends records an additional 07 GW of hydro 06 GW of biomass and 3 GW of waste-to-energy plants These plants and their output are not visible to the electricity transmission system and so cannot be reported on here
2 We include an estimate of the installed capacity of smaller storage devices which are not monitored by the electricity market operator Britainrsquos storage capacity is made up of 29 GW of pumped hydro storage 06 GW of lithium-ion batteries 04 GW of flywheels and 03 GW of compressed air
Drax Electric Insights Quarterly ndash Q1 2021
13
7 Power system records
March the 28th was a record-breaking day for Britainrsquos power system Wind farms produced more than 18 GW for the first time Over the whole day renewables produced two-thirds of the countryrsquos electricity demand pushing fossil fuels to their lowest ever share of electricity generation under one-eighth of the dayrsquos electricity
January also saw the highest power prices in over a decade averaging pound71MWh for the month On the 8th real-time prices hit a record pound4000MWh and on the 13th day-ahead prices (which are normally much smoother) peaked at over pound1000MWh for the first time in over two decades
The tables below look over the past decade (2009 to 2021) and report the record output and share of electricity generation plus sustained averages over a day a month and a calendar year1 Cells highlighted in blue are records that were broken in the first quarter of 2021 Each number links to the date it occurred on the Electric Insights website allowing these records to be explored visually
All Renewables ndash Maximum
Output (MW) Share ()
Instantaneous 25790 695
Daily average 20786 663
Month average 16030 443
Year average 11896 379
Biomass ndash Maximum
Output (MW) Share ()
Instantaneous 3831 168
Daily average 3316 129
Month average 2849 88
Year average 2216 71
Wind ndash Maximum
Output (MW) Share ()
Instantaneous 18120 609
Daily average 16844 534
Month average 12346 341
Year average 7817 249
Solar ndash Maximum
Output (MW) Share ()
Instantaneous 9680 331
Daily average 3386 136
Month average 2651 100
Year average 1372 44
1 The annual records relate to calendar years covering the period of 2009 to 2020
Gross demand
Maximum (MW) Minimum (MW)
Instantaneous 60070 16934
Daily average 49203 23297
Month average 45003 26081
Year average 37736 30709
Demand (net of wind and solar)
Maximum (MW) Minimum (MW)
Instantaneous 59563 6605
Daily average 48823 9454
Month average 43767 18017
Year average 36579 21520
Drax Electric Insights Quarterly ndash Q1 2021
14
Day ahead wholesale price
Maximum (poundMWh) Minimum (poundMWh)
Instantaneous 106327 ndash7284
Daily average 19745 ndash1135
Month average 7112 2203
Year average 5682 3388
Carbon intensity
Maximum (gkWh) Minimum (gkWh)
Instantaneous 704 18
Daily average 633 61
Month average 591 141
Year average 508 172
pound CO2
All fossil fuels ndash Maximum
Output (MW) Share ()
Instantaneous 49307 880
Daily average 43085 864
Month average 36466 812
Year average 29709 763
All fossil fuels ndash Minimum
Output (MW) Share ()
Instantaneous 2369 88
Daily average 3789 121
Month average 7382 278
Year average 11336 361
All low carbon ndash Maximum
Output (MW) Share ()
Instantaneous 32688 897
Daily average 27282 825
Month average 23276 654
Year average 17930 583
All low carbon ndash Minimum
Output (MW) Share ()
Instantaneous 3395 83
Daily average 5007 108
Month average 6885 167
Year average 8412 216
CO2 CO2
Nuclear ndash Maximum
Output (MW) Share ()
Instantaneous 9342 428
Daily average 9320 320
Month average 8649 265
Year average 7604 220
Nuclear ndash Minimum
Output (MW) Share ()
Instantaneous 2488 81
Daily average 2665 103
Month average 4232 129
Year average 5397 172
Coal ndash Maximum
Output (MW) Share ()
Instantaneous 26044 614
Daily average 24589 520
Month average 20746 480
Year average 15628 420
Coal ndash Minimum
Output (MW) Share ()
Instantaneous 0 00
Daily average 0 00
Month average 0 00
Year average 499 16
Drax Electric Insights Quarterly ndash Q1 2021
15
Gas ndash Maximum
Output (MW) Share ()
Instantaneous 27131 726
Daily average 24210 613
Month average 20828 548
Year average 17930 460
Gas ndash Minimum
Output (MW) Share ()
Instantaneous 1556 49
Daily average 3071 95
Month average 6775 199
Year average 9159 246
Imports ndash Maximum
Output (MW) Share ()
Instantaneous 5827 191
Daily average 4985 155
Month average 3796 106
Year average 2850 86
Pumped storage ndash Maximum 2
Output (MW) Share ()
Instantaneous 2660 79
Daily average 409 12
Pumped storage ndash Minimum 2
Output (MW) Share ()
Instantaneous ndash2782 ndash108
Daily average ndash622 ndash17
Exports ndash Maximum
Output (MW) Share ()
Instantaneous minus3870 minus143
Daily average ndash2748 ndash79
Month average ndash1690 ndash39
Year average ndash731 ndash19
2 Note that Britain has no inter-seasonal electricity storage so we only report on half-hourly and daily records Elexon and National Grid only report the output of large pumped hydro storage plants The operation of battery flywheel and other storage sites is not publicly available
Drax Group plcDrax Power Station Selby North Yorkshire YO8 8PH
Imperial Consultants58 Princersquos Gate Exhibition Road London SW7 2PGwwwimperial-consultantscoukwwwdraxcomConsultImperialDraxGroup

Drax Electric Insights Quarterly ndash Q1 2021
3
Summary of Britainrsquos electricity generation mix over the first quarter of 2021
1 Headlines
The start of 2021 saw unusually cold weather coupled with plant outages which created very tight supply margins throughout January Despite Britain still being under lockdown insufficient capacity was expected to be available to meet demand leading to some of the highest power prices in two decades We compare Britainrsquos situation to the blackouts which swept through Texas at the start of the year due to extreme weather
A new interconnector to France came online in January increasing Britainrsquos capacity for trading power with neighbours by 20 Imports hit an all-time record high even though the Dutch interconnector was unavailable for much of the quarter due to prolonged outages
Commercial power generation ended one of Britainrsquos remaining coal power stations leaving only two stations now in regular operation At the same time biomass output hit a record high peaking at over 38 GW for the first time as plants ran flat out when capacity was scarce We look at the history of Britainrsquos transition from coal to biomass and the future of moving towards negative-emissions biomass with carbon capture and storage
Wind power contributed heavily to Scotland achieving 97 renewable electricity generation in 2020 and Britainrsquos wind farms produced record power output this quarter reaching over 18 GW for the first time However March saw the longest lsquocold calm spellrsquo in over a decade for 11 days straight wind farms operated at just 11 of their rated capacity Dealing with extended wind lulls could be biggest challenge we face in fully decarbonising Britainrsquos electricity system
Gas power stations picked up the slack which contributed to gas generation being up 20 on this quarter last year This highlights the need for flexible backup in the power system While burning gas without capturing the CO2 is a viable solution for now it will not be possible to rely on unabated fossil fuels for balancing in future if the UK is to hit its net zero targets We explore the options Britain has for balancing wind variability in future
January February March0
10
20
30
40
GW Wind Everything elseFossil
Drax Electric Insights Quarterly ndash Q1 2021
4
Jan 13th
Jan 8th
February March
poundMWh
0
200
400
600
800
1000
January
Jan 6th
Peak
Daily average
Electricity Market Notice (EMN)
Daily average and maximum electricity prices on the British day-ahead market in Q1 2021
2 Cold weather and tight margins
The Texas blackout dominated the newspaper headlines in February An lsquoarctic outbreakrsquo plunged south from Canada sending temperatures down to as low as ndash22degC more than forty degrees below typical February temperatures Electricity demand surged as people tried to stay warm but at the same time as gas and wind power stations shut down because of the extreme conditions Blackouts affected 43 million Texans with some lasting for 3 days and at least 31 lives were lost Power prices spiked to $8800 per MWh on February 17th in Dallas and Fort Worth ndash almost 200 times their normal level Some households on variable rate tariffs were hit with bills over ten thousand dollars and three utility companies have already declared bankruptcy
Closer to home Europe was hit by its own polar vortex creatively dubbed lsquoThe Beast from the East 2rsquo After seeing the coldest January since 2010 temperatures in February fell to a low of ndash23degC in Braemar (Aberdeenshire) This pushed electricity demand up by 15 compared to the surrounding weeks due to increased heating load Demand pushed above 48 GW for the first time since 2019 despite the country still being under full lockdown
This increased demand came at an inconvenient time as nuclear outages were prolonged through winter and the Dutch interconnector (which normally supplies a steady 1 GW to Britain) was also offline This left the market lsquotightrsquo meaning short of capacity National Grid ESO (electricity system operator) issued three Electricity Margin Notices (EMN) in January alone making six in total for this winter The last such notice was issued back in 2016 highlighting the extended stress the system was under
These EMNs communicate to the market that electricity is in short supply and the grid running into its security buffers On the 6th January there was a predicted shortfall of 06 GW capacity rising to 12 GW on both the 8th and 13th of January This is the largest ever shortfall in supply ndash equivalent to one of Britainrsquos largest power stations going missing The ESO also issued an Electricity Capacity Market Notice (ECMN) on the 8th for only the third time in its history In the end these notices achieved their aim of bringing more capacity online or persuading flexible consumers (such as industry) to reduce their demand
Drax Electric Insights Quarterly ndash Q1 2021
5
The shortfalls did not lead to any blackouts but did cause the highest power prices of this century Day-ahead market prices rose to pound1063 per MWh on January 13th their highest since 1995 (when they were driven up by capacity payments that were abolished in 2001) While this is 25 times higher than the average price over the past year extreme prices are not passed on to households directly as they are in Texas
Britainrsquos power system did not suffer the same catastrophic failure as in Texas for many reasons While they share some similarities (high shares of wind power limited connection to neighbouring power systems) the UK suffered much less severe weather and is more accustomed to winter storms and so is better prepared for them
Wind turbines are weatherised so they can continue operation when temperatures fall below freezing and gas supplies come from the North Sea pipelines and via ships which are unaffected by cold weather compared to on-land gas rigs in Texas which froze over
However the Texan experience helps to remind us about the interdependency of energy services Going forward with our decarbonisation we must ensure that the resilience of the energy system to extreme weather events is designed into the transition to net zero This might provide an argument for decarbonising household heating systems with a mix of hydrogen and electric heat pumps as the lsquoall electricrsquo future provides a single point of failure
The highest wholesale power price seen in each month since the British electricity market began
0
200
400
600
800
1000
pound1063MWhJan 2021
pound1108MWhDec 1995
poundMWh
1990 1995 2000 2005 2010 2015 2020
Drax Electric Insights Quarterly ndash Q1 2021
6
Britain moved one step closer to its 202425 target of phasing out coal power completely while biomass generation hit new record highs On the 5th of March Drax announced that it had ceased commercial power generation from coal1 after 47 years at the UKrsquos largest power station This leaves just two coal power stations operating in Britain as 85 of the countryrsquos coal fleet have retired over the last ten years
Meanwhile biomass power stations reached new records generating 381 GW on the 27th of March Biomass output is likely to grow further as a new biomass-powered combined heat and power unit at Teesside is expected to come online later this year
Global leadershipCurrently biomass supplies 2 of the worldrsquos electricity though this share is higher in Europe having grown five-fold since 2000 to hit 6 in 20202 One explanation for this comes from countries such as Denmark and Sweden which have extensive municipal electricity and combined heat and power production
Another reason is the UK Our share of electricity generation from biomass has tripled over the past decade hitting an all-time high of 11 in 20202 This means the UK has the highest share of electricity production from biomass of any large country (ones with over 100 TWhyear electricity demand)
The UK pioneered large-scale use of biomass for electricity generation contributing to its world-leading success in decarbonising electricity over the last decade This position means the UK has also played a major part in developing the science-led sustainability criteria that govern the use of biomass
The transition from coal to biomass to BECCS (bioenergy with carbon capture and storage) outlines the versatility of biomass for electricity generation to contribute at each stage of the decarbonisation journey In a high-coal system (the UKrsquos past) biomass conversions allow for rapid carbon reductions whilst utilising existing infrastructure and preserving the reliable functionality of firm dispatchable power In a high-renewables system (increasingly the UKrsquos present) biomass offers flexibility services including inertia and grid balancing This helps the overall system to integrate variable renewables and lowers grid management costs Finally looking to the future BECCS offers the possibility of negative emissions which the Climate Change Committee describe as ldquoa necessityrdquo for net zero and beyond
Share of electricity generated from biomass in 2020 across all countries worldwide which consume more than 100 TWh of electricity per year 2
3 Britainrsquos transition from coal to biomass to BECCS
1 These units will still operate in the capacity market until they are fully decommissioned in 2022 meaning they could be called upon to provide peak capacity at times of system stress2 Data from Emberrsquos Global Electricity Review
0 2 4 6 8 10
Not shown Iran Iraq Saudi Arabia UAE Venezuela Vietnam mdash all 0
UK
Thailand
Germany
Brazil
Sweden
Netherlands
Italy
Japan
Poland
Spain
Pakistan
Canada
China
France
Turkey
Taiwan
Australia
US
Argentina
India
Mexico
Malaysia
Norway
South Korea
Russia
Indonesia
Ukraine
South Africa
Egypt
UK
Drax Electric Insights Quarterly ndash Q1 2021
7
Looking to the past Coal dominated Britainrsquos electricity generation until just a decade ago However since 2018 Britain has produced more electricity from biomass than it has from coal There are three main reasons why Britainrsquos coal plants closed down
Clean air legislation forced older plants to close if they did not fit equipment to capture harmful sulphur and nitrous oxide emissions Secondly many plants closed on economic grounds either because they were reaching the end of their design life and the cost of maintaining them outweighed the revenue they could bring in or they could simply no longer compete in the market A key factor in this was government policy raising the cost of emitting carbon so coal plants became more expensive than gas With demand falling and renewables taking a larger share there was simply no room left for them to make a profit
When these units retired they needed to be replaced by a clean electricity source that could provide baseload generation producing electricity when it is needed However research shows that in addition these coal retirements also led to a 30 increase in output from natural gas plants (37 TWh extra in 2019)3
The third source of coal plant closures was conversion to biomass Although they represent the smallest share of capacity (with 32 GW converted) they have delivered greater carbon savings because not only did they reduce the amount of coal burnt they replaced it with a low-carbon source of electricity Coal to biomass conversions therefore limited ndash rather than increased ndash gas generation Comparing 2012 to 2019 they reduced carbon emissions by 10 MtCO2 per year slightly more than achieved by the 8 GW of onshore wind farms installed in that time3
3 R Green and I Staffell 2021 The contribution of taxes subsidies and regulations to British electricity decarbonisation EPRG 2105
The change in coal power station capacity over the last decade and main categories of coal plant closures
0
5
10
15
20
25
30
2010
280
85
minus32
minus61
minus101
Biomassconversions
2020
GW
Air qualitylegislation
Economicclosures
Drax Electric Insights Quarterly ndash Q1 2021
8
Annual electricity generation from solid fuels in Britain and the average carbon intensity of electricity shown over the past three
decades and the next three decades according to National Gridrsquos ldquoLeading the Wayrdquo future energy scenario
Looking to the futureNational Grid ESOrsquos Future Energy Scenarios see biomass playing an increased role in coming decades Current unabated biomass (where emissions from generating electricity are offset by regrowing it) plays a key step towards the deployment of BECCS (bioenergy with carbon capture and storage) from the late 2020s
Bioenergy (the lsquoBErsquo in lsquoBECCSrsquo) operates by growing and continuously regrowing plants that are then used for energy The carbon emitted during energy generation is reabsorbed by the regrowth of the plants meaning net-zero emissions Supply chain emissions are then counted on top of this in accordance with a strict sustainability governance regime hence Electric Insights considers biomass as producing 121 grams of CO2 per kWh of electricity
If emissions from the power station are instead captured and locked away underground (the lsquoCCSrsquo in lsquoBECCSrsquo) the plants being grown and regrown actually remove carbon from the atmosphere over and above simply offsetting the bioenergy emissions Therefore BECCS as a whole can deliver negative emissions as part of a major energy source
The deployment of BECCS means annual carbon emissions from electricity generation could fall negative as early as 2030 in National Gridrsquos scenarios My the mid-2030s BECCS could be removing 40 MtCO2 per year from the atmosphere comparable to total annual emissions in 2020
The IEA remarked in 2018 that ldquomodern bioenergy is the overlooked giant of the renewable energy fieldrdquo With the potential for sustainable expansion and the use of carbon capture to deliver negative emissions this could take a more visible role in the UKrsquos future
TWh
1990 2000 2010 2020 2030 2040 2050
0
40
80
120
160
20
60
100
140
0
minus200
400
200
600
800
Electricity generation begins to remove more CO2 than it emits
gkWhCarbon Intensity
Biomass BECCSCoal
Drax Electric Insights Quarterly ndash Q1 2021
9
4 IFA2 goes online
A new power link between the UK and France went online in January meaning Britainrsquos interconnector capacity has doubled over the last decade to 6 GW IFA2 is one of Britainrsquos two undersea connection to France coming some 60 years after the first link was built and 35 years after that was replaced by IFA (which still operates today) The pound700m IFA2 project jointly owned by National Grid and RTE (their French equivalent) spans 130 miles under the English Channel to connect Portsmouth with Caen in Normandy
After some early teething troubles the new link has imported 20 times more power than it exported since it went into operation on January 22nd Imports of electricity to Britain rose to new record levels although they could have been higher still
Despite very good historical reliability the BritNed cable between Britain and the Netherlands was out of action for most of the quarter from mid-December through to mid-February and again since mid-March As a result Dutch imports were down 60 and exports down 90 compared to the first quarter last year Cable faults are responsible for both outages being found on December 8th last year (and taking three months to repair) and again on March 9th this year (with an estimated two months to repair)
There were initial reports that the end of the Brexit transition period led to reduced trade over the interconnectors to Ireland at the start of this year sending power prices rocketing The UK left Europersquos Internal Energy Market on the 31st December 2020 which increased friction for trading However it appears this was only a short-term blip mdash trade fell by 40 between December 2020 and January 2021 but then recovered completely in February Over the first quarter of this year trade with the Irish power market was 1 higher than the average during 2019-20
Work on a third interconnector to France will begin later this year and links to Norway and Denmark are currently under construction These will begin to be shown on the Electric Insights webpage in the coming months With these and the return of the Dutch interconnector to service Britain is set to source an increasing share of its power from abroad in the coming years
Installed capacity of interconnectors in Great Britain over the last two decades
Daily trade over the BritNed interconnector during the past six months
0
1
2
3
4
5
6
GW
IFA (France)
Moyle (Northern Ireland)
BritNed (Netherlands)
East West (Republic of Ireland)
Nemo Link (Belgium)
IFA2 (France)
2000 2005 2010 2015 2020
minus04
minus02
02
0
04
06
08
1
Imports from the Netherlands
Exports to the Netherlands
Oct Nov Dec Jan Feb Mar
GW
Drax Electric Insights Quarterly ndash Q1 2021
10
At the start of March Britain experienced its longest spell of low wind output in more than a decade For more than a week calm weather covered the country Wind farm output fell to as low as 06 GW on the 3rd of March in sharp contrast to the 181 GW delivered later on that month Power prices were typical for the time of year suggesting that the system wasnrsquot particularly stressed though
A prolonged period of low wind and low solar power output has been coined in German as a lsquoDunkelflautersquo (dunk-el-flout-eh) mdash a dark wind lull The event at the start of March was the longest Dunkelflaute that Britain has experienced in the last decade Between the 26th of February and the 8th of March the capacity factor1 of the national wind fleet did not go above 20 Its average over these 11 days was just 11 less than a quarter of their average in the month either side
Both the frequency and duration of these events matters Looking back over the Electric Insights archives this was the longest cold-calm spell that Britain has experienced in over a decade February 2010 also saw 11 days with wind capacity factors never going above 20 However back in 2010 most of Britainrsquos wind farms were onshore and so average capacity factors were lower Also the impact of low wind speeds was barely noticeable back in 2010 as Britainrsquos wind capacity then was one-sixth of current levels
Based on longer records of historical wind speed data from Renewablesninja the March Dunkelflaute could be expected roughly once every 20 years statistically speaking Prolonged low-wind periods should be accounted for when designing Britainrsquos energy system security and they should not be seen as a lsquoblack swan eventrsquo which cannot be anticipated
The power system coped in March because the shortfall in wind was made up by fossil fuels particularly the 28 GW of gas power stations Fossil fuels peaked at a 73 share of all electricity generation on the 6th of March While coal and biomass stations ran at close to full output to help Britainrsquos nuclear output actually fell to its lowest this year during the low-wind period Nuclear output dropped to just 36 GW 30 below its average for the quarter as maintenance outages continued to affect the fleet
5 When the wind goes gas fills in the gap
Britainrsquos wind farm capacity factor over the past six months highlighting times when it fell below 20 for more than a day
1 Power output as a fraction of total installed capacity
0
60
40
2011 days
Oct Nov Dec Jan Feb Mar
Drax Electric Insights Quarterly ndash Q1 2021
11
The UKrsquos ambition to reach net zero would prohibit the use of (unabated) gas power plants for such long periods While a variety of clean flexibility options could replace gas the scale and duration of wind droughts may rule many of them out
The lull in March saw a deficit of over 10 GW of wind capacity compared to the surrounding weeks and some 2300 GWh of energy In comparison the UKrsquos largest storage facility ndash the Dinorwig pumped hydro plant in North Wales ndash stores just 9 GWh Battery storage systems are ideal for providing peak power but their duration (and total energy storage) is limited Over 10000 of the worldrsquos largest battery storage systems would be needed to cover the shortfall occupying a space the size of Liverpool city2
Interconnectors can help but these weather patterns tend to affect the entire north-west of Europe meaning our neighbouring countries would also be short of capacity Flexible demand may be insufficient for a different reason ndash households and industries may be willing to turn down their consumption for a few hours at a time but doing so for over a week straight is another matter This restricts the options for dealing with large-scale weather variability to longer-duration storage or low- and zero-carbon fuels such as biomass and potentially hydrogen in the future The four biomass domes at Drax Power Station hold enough fuel to generate 600 GWh of electricity showing the scale that storable fuels can attain
Weather variability will play an important part in the planning and operation of Britainrsquos future energy system The recent power outage in Texas highlights the cost of overlooking extreme weather risks (noting that it was gas generation rather than wind which drove this crisis) Securely managing wind variability will likely require policy and market innovations not just technical fixes
The output from Britainrsquos wind farms is almost exclusively balanced by gas power stations Throughout the quarter their outputs were the mirror image of one another performing an elaborate dance to keep the system balanced For every GW that wind output falls gas output rises by 084 GW When all other generation sources are combined their output only varies by 10 around their average of 13 GW across the quarter
Daily average output from wind farms and gas power stations during Quarter 1 of 2021
2 Based on a 6500 msup2 footprint estimated for the South Australia battery farm
0
5
10
15
20
GW GasWind
January February March
753 TWhsupplied
376
256
144
86
75
27
22
13
Gas
Wind
Nuclear
Imports
Biomass
Coal
Solar
Hydro
Share of the mix
Drax Electric Insights Quarterly ndash Q1 2021
12
Installed Capacity (GW) Energy Output (TWh) Utilisation Capacity Factor
2021 Q1 Annual change 2021 Q1 Annual change Average Maximum
Nuclear 95 ~ 108 ndash15 (ndash12) 53 65
Biomass 38 +01 (+4) 56 +05 (+10) 68 100
Hydro 12 ~ 10 ndash05 (ndash35) 40 96
Wind
ndash of which Onshore
ndash of which Offshore
244
137
107
+09 (+4)
~
+09 (+9)
193
87
106
ndash40 (ndash17)
ndash 22 (ndash20)
ndash 18 (ndash14)
37
30
46
74
73
88
Solar 132 +01 (+1) 17 ndash03 (ndash14) 6 63
Gas 276 ndash05 (ndash2) 283 +49 (+21) 48 86
Coal 38 ndash14 (ndash27) 20 ndash09 (ndash31) 20 100
Imports60 +10 (+20)
72 +05 (+7) 58 97
Exports 07 ndash01 (ndash14) 6 61
Storage discharge31 ~
05 +01 (+12) 7 61
Storage recharge 05 ndash00 (ndash5) 7 76
6 Capacity and production statistics
Electricity production from gas rose 20 from this time last year driven by lower wind output and continued nuclear outages It was by no means a bad quarter for wind farms ndash their productivity was typical for winter at 37 ndash but this was much lower than during the unusually stormy start to 2020
Britainrsquos nuclear reactors on the other hand ran at just 53 capacity factor during the quarter when ideally they should be running 247 Their utilisation was only slightly higher than that of gas power stations
Demand was almost the same as Q1 last year as the demand reductions from the country being under lockdown were offset by it being on average 1 degree colder
Both biomass and coal power stations hit a peak of 100 capacity factor during the quarter meaning every station was running at full power at the same time This is highly unusual for coal which was called on extensively during periods of tight margins in January
Britainrsquos remaining coal capacity fell by one quarter as Drax announced the end of commercial operation for its two remaining coal units in Yorkshire This leaves two coal power stations remaining ndash West Burton A and Ratcliffe on Soar both in Nottinghamshire due to close in 2022 and 2024
Britainrsquos electricity supply mix in the first quarter of 2021
Installed capacity and electricity produced by each technology 1 2
1 Other sources give different values because of the types of plant they consider For example BEIS Energy Trends records an additional 07 GW of hydro 06 GW of biomass and 3 GW of waste-to-energy plants These plants and their output are not visible to the electricity transmission system and so cannot be reported on here
2 We include an estimate of the installed capacity of smaller storage devices which are not monitored by the electricity market operator Britainrsquos storage capacity is made up of 29 GW of pumped hydro storage 06 GW of lithium-ion batteries 04 GW of flywheels and 03 GW of compressed air
Drax Electric Insights Quarterly ndash Q1 2021
13
7 Power system records
March the 28th was a record-breaking day for Britainrsquos power system Wind farms produced more than 18 GW for the first time Over the whole day renewables produced two-thirds of the countryrsquos electricity demand pushing fossil fuels to their lowest ever share of electricity generation under one-eighth of the dayrsquos electricity
January also saw the highest power prices in over a decade averaging pound71MWh for the month On the 8th real-time prices hit a record pound4000MWh and on the 13th day-ahead prices (which are normally much smoother) peaked at over pound1000MWh for the first time in over two decades
The tables below look over the past decade (2009 to 2021) and report the record output and share of electricity generation plus sustained averages over a day a month and a calendar year1 Cells highlighted in blue are records that were broken in the first quarter of 2021 Each number links to the date it occurred on the Electric Insights website allowing these records to be explored visually
All Renewables ndash Maximum
Output (MW) Share ()
Instantaneous 25790 695
Daily average 20786 663
Month average 16030 443
Year average 11896 379
Biomass ndash Maximum
Output (MW) Share ()
Instantaneous 3831 168
Daily average 3316 129
Month average 2849 88
Year average 2216 71
Wind ndash Maximum
Output (MW) Share ()
Instantaneous 18120 609
Daily average 16844 534
Month average 12346 341
Year average 7817 249
Solar ndash Maximum
Output (MW) Share ()
Instantaneous 9680 331
Daily average 3386 136
Month average 2651 100
Year average 1372 44
1 The annual records relate to calendar years covering the period of 2009 to 2020
Gross demand
Maximum (MW) Minimum (MW)
Instantaneous 60070 16934
Daily average 49203 23297
Month average 45003 26081
Year average 37736 30709
Demand (net of wind and solar)
Maximum (MW) Minimum (MW)
Instantaneous 59563 6605
Daily average 48823 9454
Month average 43767 18017
Year average 36579 21520
Drax Electric Insights Quarterly ndash Q1 2021
14
Day ahead wholesale price
Maximum (poundMWh) Minimum (poundMWh)
Instantaneous 106327 ndash7284
Daily average 19745 ndash1135
Month average 7112 2203
Year average 5682 3388
Carbon intensity
Maximum (gkWh) Minimum (gkWh)
Instantaneous 704 18
Daily average 633 61
Month average 591 141
Year average 508 172
pound CO2
All fossil fuels ndash Maximum
Output (MW) Share ()
Instantaneous 49307 880
Daily average 43085 864
Month average 36466 812
Year average 29709 763
All fossil fuels ndash Minimum
Output (MW) Share ()
Instantaneous 2369 88
Daily average 3789 121
Month average 7382 278
Year average 11336 361
All low carbon ndash Maximum
Output (MW) Share ()
Instantaneous 32688 897
Daily average 27282 825
Month average 23276 654
Year average 17930 583
All low carbon ndash Minimum
Output (MW) Share ()
Instantaneous 3395 83
Daily average 5007 108
Month average 6885 167
Year average 8412 216
CO2 CO2
Nuclear ndash Maximum
Output (MW) Share ()
Instantaneous 9342 428
Daily average 9320 320
Month average 8649 265
Year average 7604 220
Nuclear ndash Minimum
Output (MW) Share ()
Instantaneous 2488 81
Daily average 2665 103
Month average 4232 129
Year average 5397 172
Coal ndash Maximum
Output (MW) Share ()
Instantaneous 26044 614
Daily average 24589 520
Month average 20746 480
Year average 15628 420
Coal ndash Minimum
Output (MW) Share ()
Instantaneous 0 00
Daily average 0 00
Month average 0 00
Year average 499 16
Drax Electric Insights Quarterly ndash Q1 2021
15
Gas ndash Maximum
Output (MW) Share ()
Instantaneous 27131 726
Daily average 24210 613
Month average 20828 548
Year average 17930 460
Gas ndash Minimum
Output (MW) Share ()
Instantaneous 1556 49
Daily average 3071 95
Month average 6775 199
Year average 9159 246
Imports ndash Maximum
Output (MW) Share ()
Instantaneous 5827 191
Daily average 4985 155
Month average 3796 106
Year average 2850 86
Pumped storage ndash Maximum 2
Output (MW) Share ()
Instantaneous 2660 79
Daily average 409 12
Pumped storage ndash Minimum 2
Output (MW) Share ()
Instantaneous ndash2782 ndash108
Daily average ndash622 ndash17
Exports ndash Maximum
Output (MW) Share ()
Instantaneous minus3870 minus143
Daily average ndash2748 ndash79
Month average ndash1690 ndash39
Year average ndash731 ndash19
2 Note that Britain has no inter-seasonal electricity storage so we only report on half-hourly and daily records Elexon and National Grid only report the output of large pumped hydro storage plants The operation of battery flywheel and other storage sites is not publicly available
Drax Group plcDrax Power Station Selby North Yorkshire YO8 8PH
Imperial Consultants58 Princersquos Gate Exhibition Road London SW7 2PGwwwimperial-consultantscoukwwwdraxcomConsultImperialDraxGroup

Drax Electric Insights Quarterly ndash Q1 2021
4
Jan 13th
Jan 8th
February March
poundMWh
0
200
400
600
800
1000
January
Jan 6th
Peak
Daily average
Electricity Market Notice (EMN)
Daily average and maximum electricity prices on the British day-ahead market in Q1 2021
2 Cold weather and tight margins
The Texas blackout dominated the newspaper headlines in February An lsquoarctic outbreakrsquo plunged south from Canada sending temperatures down to as low as ndash22degC more than forty degrees below typical February temperatures Electricity demand surged as people tried to stay warm but at the same time as gas and wind power stations shut down because of the extreme conditions Blackouts affected 43 million Texans with some lasting for 3 days and at least 31 lives were lost Power prices spiked to $8800 per MWh on February 17th in Dallas and Fort Worth ndash almost 200 times their normal level Some households on variable rate tariffs were hit with bills over ten thousand dollars and three utility companies have already declared bankruptcy
Closer to home Europe was hit by its own polar vortex creatively dubbed lsquoThe Beast from the East 2rsquo After seeing the coldest January since 2010 temperatures in February fell to a low of ndash23degC in Braemar (Aberdeenshire) This pushed electricity demand up by 15 compared to the surrounding weeks due to increased heating load Demand pushed above 48 GW for the first time since 2019 despite the country still being under full lockdown
This increased demand came at an inconvenient time as nuclear outages were prolonged through winter and the Dutch interconnector (which normally supplies a steady 1 GW to Britain) was also offline This left the market lsquotightrsquo meaning short of capacity National Grid ESO (electricity system operator) issued three Electricity Margin Notices (EMN) in January alone making six in total for this winter The last such notice was issued back in 2016 highlighting the extended stress the system was under
These EMNs communicate to the market that electricity is in short supply and the grid running into its security buffers On the 6th January there was a predicted shortfall of 06 GW capacity rising to 12 GW on both the 8th and 13th of January This is the largest ever shortfall in supply ndash equivalent to one of Britainrsquos largest power stations going missing The ESO also issued an Electricity Capacity Market Notice (ECMN) on the 8th for only the third time in its history In the end these notices achieved their aim of bringing more capacity online or persuading flexible consumers (such as industry) to reduce their demand
Drax Electric Insights Quarterly ndash Q1 2021
5
The shortfalls did not lead to any blackouts but did cause the highest power prices of this century Day-ahead market prices rose to pound1063 per MWh on January 13th their highest since 1995 (when they were driven up by capacity payments that were abolished in 2001) While this is 25 times higher than the average price over the past year extreme prices are not passed on to households directly as they are in Texas
Britainrsquos power system did not suffer the same catastrophic failure as in Texas for many reasons While they share some similarities (high shares of wind power limited connection to neighbouring power systems) the UK suffered much less severe weather and is more accustomed to winter storms and so is better prepared for them
Wind turbines are weatherised so they can continue operation when temperatures fall below freezing and gas supplies come from the North Sea pipelines and via ships which are unaffected by cold weather compared to on-land gas rigs in Texas which froze over
However the Texan experience helps to remind us about the interdependency of energy services Going forward with our decarbonisation we must ensure that the resilience of the energy system to extreme weather events is designed into the transition to net zero This might provide an argument for decarbonising household heating systems with a mix of hydrogen and electric heat pumps as the lsquoall electricrsquo future provides a single point of failure
The highest wholesale power price seen in each month since the British electricity market began
0
200
400
600
800
1000
pound1063MWhJan 2021
pound1108MWhDec 1995
poundMWh
1990 1995 2000 2005 2010 2015 2020
Drax Electric Insights Quarterly ndash Q1 2021
6
Britain moved one step closer to its 202425 target of phasing out coal power completely while biomass generation hit new record highs On the 5th of March Drax announced that it had ceased commercial power generation from coal1 after 47 years at the UKrsquos largest power station This leaves just two coal power stations operating in Britain as 85 of the countryrsquos coal fleet have retired over the last ten years
Meanwhile biomass power stations reached new records generating 381 GW on the 27th of March Biomass output is likely to grow further as a new biomass-powered combined heat and power unit at Teesside is expected to come online later this year
Global leadershipCurrently biomass supplies 2 of the worldrsquos electricity though this share is higher in Europe having grown five-fold since 2000 to hit 6 in 20202 One explanation for this comes from countries such as Denmark and Sweden which have extensive municipal electricity and combined heat and power production
Another reason is the UK Our share of electricity generation from biomass has tripled over the past decade hitting an all-time high of 11 in 20202 This means the UK has the highest share of electricity production from biomass of any large country (ones with over 100 TWhyear electricity demand)
The UK pioneered large-scale use of biomass for electricity generation contributing to its world-leading success in decarbonising electricity over the last decade This position means the UK has also played a major part in developing the science-led sustainability criteria that govern the use of biomass
The transition from coal to biomass to BECCS (bioenergy with carbon capture and storage) outlines the versatility of biomass for electricity generation to contribute at each stage of the decarbonisation journey In a high-coal system (the UKrsquos past) biomass conversions allow for rapid carbon reductions whilst utilising existing infrastructure and preserving the reliable functionality of firm dispatchable power In a high-renewables system (increasingly the UKrsquos present) biomass offers flexibility services including inertia and grid balancing This helps the overall system to integrate variable renewables and lowers grid management costs Finally looking to the future BECCS offers the possibility of negative emissions which the Climate Change Committee describe as ldquoa necessityrdquo for net zero and beyond
Share of electricity generated from biomass in 2020 across all countries worldwide which consume more than 100 TWh of electricity per year 2
3 Britainrsquos transition from coal to biomass to BECCS
1 These units will still operate in the capacity market until they are fully decommissioned in 2022 meaning they could be called upon to provide peak capacity at times of system stress2 Data from Emberrsquos Global Electricity Review
0 2 4 6 8 10
Not shown Iran Iraq Saudi Arabia UAE Venezuela Vietnam mdash all 0
UK
Thailand
Germany
Brazil
Sweden
Netherlands
Italy
Japan
Poland
Spain
Pakistan
Canada
China
France
Turkey
Taiwan
Australia
US
Argentina
India
Mexico
Malaysia
Norway
South Korea
Russia
Indonesia
Ukraine
South Africa
Egypt
UK
Drax Electric Insights Quarterly ndash Q1 2021
7
Looking to the past Coal dominated Britainrsquos electricity generation until just a decade ago However since 2018 Britain has produced more electricity from biomass than it has from coal There are three main reasons why Britainrsquos coal plants closed down
Clean air legislation forced older plants to close if they did not fit equipment to capture harmful sulphur and nitrous oxide emissions Secondly many plants closed on economic grounds either because they were reaching the end of their design life and the cost of maintaining them outweighed the revenue they could bring in or they could simply no longer compete in the market A key factor in this was government policy raising the cost of emitting carbon so coal plants became more expensive than gas With demand falling and renewables taking a larger share there was simply no room left for them to make a profit
When these units retired they needed to be replaced by a clean electricity source that could provide baseload generation producing electricity when it is needed However research shows that in addition these coal retirements also led to a 30 increase in output from natural gas plants (37 TWh extra in 2019)3
The third source of coal plant closures was conversion to biomass Although they represent the smallest share of capacity (with 32 GW converted) they have delivered greater carbon savings because not only did they reduce the amount of coal burnt they replaced it with a low-carbon source of electricity Coal to biomass conversions therefore limited ndash rather than increased ndash gas generation Comparing 2012 to 2019 they reduced carbon emissions by 10 MtCO2 per year slightly more than achieved by the 8 GW of onshore wind farms installed in that time3
3 R Green and I Staffell 2021 The contribution of taxes subsidies and regulations to British electricity decarbonisation EPRG 2105
The change in coal power station capacity over the last decade and main categories of coal plant closures
0
5
10
15
20
25
30
2010
280
85
minus32
minus61
minus101
Biomassconversions
2020
GW
Air qualitylegislation
Economicclosures
Drax Electric Insights Quarterly ndash Q1 2021
8
Annual electricity generation from solid fuels in Britain and the average carbon intensity of electricity shown over the past three
decades and the next three decades according to National Gridrsquos ldquoLeading the Wayrdquo future energy scenario
Looking to the futureNational Grid ESOrsquos Future Energy Scenarios see biomass playing an increased role in coming decades Current unabated biomass (where emissions from generating electricity are offset by regrowing it) plays a key step towards the deployment of BECCS (bioenergy with carbon capture and storage) from the late 2020s
Bioenergy (the lsquoBErsquo in lsquoBECCSrsquo) operates by growing and continuously regrowing plants that are then used for energy The carbon emitted during energy generation is reabsorbed by the regrowth of the plants meaning net-zero emissions Supply chain emissions are then counted on top of this in accordance with a strict sustainability governance regime hence Electric Insights considers biomass as producing 121 grams of CO2 per kWh of electricity
If emissions from the power station are instead captured and locked away underground (the lsquoCCSrsquo in lsquoBECCSrsquo) the plants being grown and regrown actually remove carbon from the atmosphere over and above simply offsetting the bioenergy emissions Therefore BECCS as a whole can deliver negative emissions as part of a major energy source
The deployment of BECCS means annual carbon emissions from electricity generation could fall negative as early as 2030 in National Gridrsquos scenarios My the mid-2030s BECCS could be removing 40 MtCO2 per year from the atmosphere comparable to total annual emissions in 2020
The IEA remarked in 2018 that ldquomodern bioenergy is the overlooked giant of the renewable energy fieldrdquo With the potential for sustainable expansion and the use of carbon capture to deliver negative emissions this could take a more visible role in the UKrsquos future
TWh
1990 2000 2010 2020 2030 2040 2050
0
40
80
120
160
20
60
100
140
0
minus200
400
200
600
800
Electricity generation begins to remove more CO2 than it emits
gkWhCarbon Intensity
Biomass BECCSCoal
Drax Electric Insights Quarterly ndash Q1 2021
9
4 IFA2 goes online
A new power link between the UK and France went online in January meaning Britainrsquos interconnector capacity has doubled over the last decade to 6 GW IFA2 is one of Britainrsquos two undersea connection to France coming some 60 years after the first link was built and 35 years after that was replaced by IFA (which still operates today) The pound700m IFA2 project jointly owned by National Grid and RTE (their French equivalent) spans 130 miles under the English Channel to connect Portsmouth with Caen in Normandy
After some early teething troubles the new link has imported 20 times more power than it exported since it went into operation on January 22nd Imports of electricity to Britain rose to new record levels although they could have been higher still
Despite very good historical reliability the BritNed cable between Britain and the Netherlands was out of action for most of the quarter from mid-December through to mid-February and again since mid-March As a result Dutch imports were down 60 and exports down 90 compared to the first quarter last year Cable faults are responsible for both outages being found on December 8th last year (and taking three months to repair) and again on March 9th this year (with an estimated two months to repair)
There were initial reports that the end of the Brexit transition period led to reduced trade over the interconnectors to Ireland at the start of this year sending power prices rocketing The UK left Europersquos Internal Energy Market on the 31st December 2020 which increased friction for trading However it appears this was only a short-term blip mdash trade fell by 40 between December 2020 and January 2021 but then recovered completely in February Over the first quarter of this year trade with the Irish power market was 1 higher than the average during 2019-20
Work on a third interconnector to France will begin later this year and links to Norway and Denmark are currently under construction These will begin to be shown on the Electric Insights webpage in the coming months With these and the return of the Dutch interconnector to service Britain is set to source an increasing share of its power from abroad in the coming years
Installed capacity of interconnectors in Great Britain over the last two decades
Daily trade over the BritNed interconnector during the past six months
0
1
2
3
4
5
6
GW
IFA (France)
Moyle (Northern Ireland)
BritNed (Netherlands)
East West (Republic of Ireland)
Nemo Link (Belgium)
IFA2 (France)
2000 2005 2010 2015 2020
minus04
minus02
02
0
04
06
08
1
Imports from the Netherlands
Exports to the Netherlands
Oct Nov Dec Jan Feb Mar
GW
Drax Electric Insights Quarterly ndash Q1 2021
10
At the start of March Britain experienced its longest spell of low wind output in more than a decade For more than a week calm weather covered the country Wind farm output fell to as low as 06 GW on the 3rd of March in sharp contrast to the 181 GW delivered later on that month Power prices were typical for the time of year suggesting that the system wasnrsquot particularly stressed though
A prolonged period of low wind and low solar power output has been coined in German as a lsquoDunkelflautersquo (dunk-el-flout-eh) mdash a dark wind lull The event at the start of March was the longest Dunkelflaute that Britain has experienced in the last decade Between the 26th of February and the 8th of March the capacity factor1 of the national wind fleet did not go above 20 Its average over these 11 days was just 11 less than a quarter of their average in the month either side
Both the frequency and duration of these events matters Looking back over the Electric Insights archives this was the longest cold-calm spell that Britain has experienced in over a decade February 2010 also saw 11 days with wind capacity factors never going above 20 However back in 2010 most of Britainrsquos wind farms were onshore and so average capacity factors were lower Also the impact of low wind speeds was barely noticeable back in 2010 as Britainrsquos wind capacity then was one-sixth of current levels
Based on longer records of historical wind speed data from Renewablesninja the March Dunkelflaute could be expected roughly once every 20 years statistically speaking Prolonged low-wind periods should be accounted for when designing Britainrsquos energy system security and they should not be seen as a lsquoblack swan eventrsquo which cannot be anticipated
The power system coped in March because the shortfall in wind was made up by fossil fuels particularly the 28 GW of gas power stations Fossil fuels peaked at a 73 share of all electricity generation on the 6th of March While coal and biomass stations ran at close to full output to help Britainrsquos nuclear output actually fell to its lowest this year during the low-wind period Nuclear output dropped to just 36 GW 30 below its average for the quarter as maintenance outages continued to affect the fleet
5 When the wind goes gas fills in the gap
Britainrsquos wind farm capacity factor over the past six months highlighting times when it fell below 20 for more than a day
1 Power output as a fraction of total installed capacity
0
60
40
2011 days
Oct Nov Dec Jan Feb Mar
Drax Electric Insights Quarterly ndash Q1 2021
11
The UKrsquos ambition to reach net zero would prohibit the use of (unabated) gas power plants for such long periods While a variety of clean flexibility options could replace gas the scale and duration of wind droughts may rule many of them out
The lull in March saw a deficit of over 10 GW of wind capacity compared to the surrounding weeks and some 2300 GWh of energy In comparison the UKrsquos largest storage facility ndash the Dinorwig pumped hydro plant in North Wales ndash stores just 9 GWh Battery storage systems are ideal for providing peak power but their duration (and total energy storage) is limited Over 10000 of the worldrsquos largest battery storage systems would be needed to cover the shortfall occupying a space the size of Liverpool city2
Interconnectors can help but these weather patterns tend to affect the entire north-west of Europe meaning our neighbouring countries would also be short of capacity Flexible demand may be insufficient for a different reason ndash households and industries may be willing to turn down their consumption for a few hours at a time but doing so for over a week straight is another matter This restricts the options for dealing with large-scale weather variability to longer-duration storage or low- and zero-carbon fuels such as biomass and potentially hydrogen in the future The four biomass domes at Drax Power Station hold enough fuel to generate 600 GWh of electricity showing the scale that storable fuels can attain
Weather variability will play an important part in the planning and operation of Britainrsquos future energy system The recent power outage in Texas highlights the cost of overlooking extreme weather risks (noting that it was gas generation rather than wind which drove this crisis) Securely managing wind variability will likely require policy and market innovations not just technical fixes
The output from Britainrsquos wind farms is almost exclusively balanced by gas power stations Throughout the quarter their outputs were the mirror image of one another performing an elaborate dance to keep the system balanced For every GW that wind output falls gas output rises by 084 GW When all other generation sources are combined their output only varies by 10 around their average of 13 GW across the quarter
Daily average output from wind farms and gas power stations during Quarter 1 of 2021
2 Based on a 6500 msup2 footprint estimated for the South Australia battery farm
0
5
10
15
20
GW GasWind
January February March
753 TWhsupplied
376
256
144
86
75
27
22
13
Gas
Wind
Nuclear
Imports
Biomass
Coal
Solar
Hydro
Share of the mix
Drax Electric Insights Quarterly ndash Q1 2021
12
Installed Capacity (GW) Energy Output (TWh) Utilisation Capacity Factor
2021 Q1 Annual change 2021 Q1 Annual change Average Maximum
Nuclear 95 ~ 108 ndash15 (ndash12) 53 65
Biomass 38 +01 (+4) 56 +05 (+10) 68 100
Hydro 12 ~ 10 ndash05 (ndash35) 40 96
Wind
ndash of which Onshore
ndash of which Offshore
244
137
107
+09 (+4)
~
+09 (+9)
193
87
106
ndash40 (ndash17)
ndash 22 (ndash20)
ndash 18 (ndash14)
37
30
46
74
73
88
Solar 132 +01 (+1) 17 ndash03 (ndash14) 6 63
Gas 276 ndash05 (ndash2) 283 +49 (+21) 48 86
Coal 38 ndash14 (ndash27) 20 ndash09 (ndash31) 20 100
Imports60 +10 (+20)
72 +05 (+7) 58 97
Exports 07 ndash01 (ndash14) 6 61
Storage discharge31 ~
05 +01 (+12) 7 61
Storage recharge 05 ndash00 (ndash5) 7 76
6 Capacity and production statistics
Electricity production from gas rose 20 from this time last year driven by lower wind output and continued nuclear outages It was by no means a bad quarter for wind farms ndash their productivity was typical for winter at 37 ndash but this was much lower than during the unusually stormy start to 2020
Britainrsquos nuclear reactors on the other hand ran at just 53 capacity factor during the quarter when ideally they should be running 247 Their utilisation was only slightly higher than that of gas power stations
Demand was almost the same as Q1 last year as the demand reductions from the country being under lockdown were offset by it being on average 1 degree colder
Both biomass and coal power stations hit a peak of 100 capacity factor during the quarter meaning every station was running at full power at the same time This is highly unusual for coal which was called on extensively during periods of tight margins in January
Britainrsquos remaining coal capacity fell by one quarter as Drax announced the end of commercial operation for its two remaining coal units in Yorkshire This leaves two coal power stations remaining ndash West Burton A and Ratcliffe on Soar both in Nottinghamshire due to close in 2022 and 2024
Britainrsquos electricity supply mix in the first quarter of 2021
Installed capacity and electricity produced by each technology 1 2
1 Other sources give different values because of the types of plant they consider For example BEIS Energy Trends records an additional 07 GW of hydro 06 GW of biomass and 3 GW of waste-to-energy plants These plants and their output are not visible to the electricity transmission system and so cannot be reported on here
2 We include an estimate of the installed capacity of smaller storage devices which are not monitored by the electricity market operator Britainrsquos storage capacity is made up of 29 GW of pumped hydro storage 06 GW of lithium-ion batteries 04 GW of flywheels and 03 GW of compressed air
Drax Electric Insights Quarterly ndash Q1 2021
13
7 Power system records
March the 28th was a record-breaking day for Britainrsquos power system Wind farms produced more than 18 GW for the first time Over the whole day renewables produced two-thirds of the countryrsquos electricity demand pushing fossil fuels to their lowest ever share of electricity generation under one-eighth of the dayrsquos electricity
January also saw the highest power prices in over a decade averaging pound71MWh for the month On the 8th real-time prices hit a record pound4000MWh and on the 13th day-ahead prices (which are normally much smoother) peaked at over pound1000MWh for the first time in over two decades
The tables below look over the past decade (2009 to 2021) and report the record output and share of electricity generation plus sustained averages over a day a month and a calendar year1 Cells highlighted in blue are records that were broken in the first quarter of 2021 Each number links to the date it occurred on the Electric Insights website allowing these records to be explored visually
All Renewables ndash Maximum
Output (MW) Share ()
Instantaneous 25790 695
Daily average 20786 663
Month average 16030 443
Year average 11896 379
Biomass ndash Maximum
Output (MW) Share ()
Instantaneous 3831 168
Daily average 3316 129
Month average 2849 88
Year average 2216 71
Wind ndash Maximum
Output (MW) Share ()
Instantaneous 18120 609
Daily average 16844 534
Month average 12346 341
Year average 7817 249
Solar ndash Maximum
Output (MW) Share ()
Instantaneous 9680 331
Daily average 3386 136
Month average 2651 100
Year average 1372 44
1 The annual records relate to calendar years covering the period of 2009 to 2020
Gross demand
Maximum (MW) Minimum (MW)
Instantaneous 60070 16934
Daily average 49203 23297
Month average 45003 26081
Year average 37736 30709
Demand (net of wind and solar)
Maximum (MW) Minimum (MW)
Instantaneous 59563 6605
Daily average 48823 9454
Month average 43767 18017
Year average 36579 21520
Drax Electric Insights Quarterly ndash Q1 2021
14
Day ahead wholesale price
Maximum (poundMWh) Minimum (poundMWh)
Instantaneous 106327 ndash7284
Daily average 19745 ndash1135
Month average 7112 2203
Year average 5682 3388
Carbon intensity
Maximum (gkWh) Minimum (gkWh)
Instantaneous 704 18
Daily average 633 61
Month average 591 141
Year average 508 172
pound CO2
All fossil fuels ndash Maximum
Output (MW) Share ()
Instantaneous 49307 880
Daily average 43085 864
Month average 36466 812
Year average 29709 763
All fossil fuels ndash Minimum
Output (MW) Share ()
Instantaneous 2369 88
Daily average 3789 121
Month average 7382 278
Year average 11336 361
All low carbon ndash Maximum
Output (MW) Share ()
Instantaneous 32688 897
Daily average 27282 825
Month average 23276 654
Year average 17930 583
All low carbon ndash Minimum
Output (MW) Share ()
Instantaneous 3395 83
Daily average 5007 108
Month average 6885 167
Year average 8412 216
CO2 CO2
Nuclear ndash Maximum
Output (MW) Share ()
Instantaneous 9342 428
Daily average 9320 320
Month average 8649 265
Year average 7604 220
Nuclear ndash Minimum
Output (MW) Share ()
Instantaneous 2488 81
Daily average 2665 103
Month average 4232 129
Year average 5397 172
Coal ndash Maximum
Output (MW) Share ()
Instantaneous 26044 614
Daily average 24589 520
Month average 20746 480
Year average 15628 420
Coal ndash Minimum
Output (MW) Share ()
Instantaneous 0 00
Daily average 0 00
Month average 0 00
Year average 499 16
Drax Electric Insights Quarterly ndash Q1 2021
15
Gas ndash Maximum
Output (MW) Share ()
Instantaneous 27131 726
Daily average 24210 613
Month average 20828 548
Year average 17930 460
Gas ndash Minimum
Output (MW) Share ()
Instantaneous 1556 49
Daily average 3071 95
Month average 6775 199
Year average 9159 246
Imports ndash Maximum
Output (MW) Share ()
Instantaneous 5827 191
Daily average 4985 155
Month average 3796 106
Year average 2850 86
Pumped storage ndash Maximum 2
Output (MW) Share ()
Instantaneous 2660 79
Daily average 409 12
Pumped storage ndash Minimum 2
Output (MW) Share ()
Instantaneous ndash2782 ndash108
Daily average ndash622 ndash17
Exports ndash Maximum
Output (MW) Share ()
Instantaneous minus3870 minus143
Daily average ndash2748 ndash79
Month average ndash1690 ndash39
Year average ndash731 ndash19
2 Note that Britain has no inter-seasonal electricity storage so we only report on half-hourly and daily records Elexon and National Grid only report the output of large pumped hydro storage plants The operation of battery flywheel and other storage sites is not publicly available
Drax Group plcDrax Power Station Selby North Yorkshire YO8 8PH
Imperial Consultants58 Princersquos Gate Exhibition Road London SW7 2PGwwwimperial-consultantscoukwwwdraxcomConsultImperialDraxGroup

Drax Electric Insights Quarterly ndash Q1 2021
5
The shortfalls did not lead to any blackouts but did cause the highest power prices of this century Day-ahead market prices rose to pound1063 per MWh on January 13th their highest since 1995 (when they were driven up by capacity payments that were abolished in 2001) While this is 25 times higher than the average price over the past year extreme prices are not passed on to households directly as they are in Texas
Britainrsquos power system did not suffer the same catastrophic failure as in Texas for many reasons While they share some similarities (high shares of wind power limited connection to neighbouring power systems) the UK suffered much less severe weather and is more accustomed to winter storms and so is better prepared for them
Wind turbines are weatherised so they can continue operation when temperatures fall below freezing and gas supplies come from the North Sea pipelines and via ships which are unaffected by cold weather compared to on-land gas rigs in Texas which froze over
However the Texan experience helps to remind us about the interdependency of energy services Going forward with our decarbonisation we must ensure that the resilience of the energy system to extreme weather events is designed into the transition to net zero This might provide an argument for decarbonising household heating systems with a mix of hydrogen and electric heat pumps as the lsquoall electricrsquo future provides a single point of failure
The highest wholesale power price seen in each month since the British electricity market began
0
200
400
600
800
1000
pound1063MWhJan 2021
pound1108MWhDec 1995
poundMWh
1990 1995 2000 2005 2010 2015 2020
Drax Electric Insights Quarterly ndash Q1 2021
6
Britain moved one step closer to its 202425 target of phasing out coal power completely while biomass generation hit new record highs On the 5th of March Drax announced that it had ceased commercial power generation from coal1 after 47 years at the UKrsquos largest power station This leaves just two coal power stations operating in Britain as 85 of the countryrsquos coal fleet have retired over the last ten years
Meanwhile biomass power stations reached new records generating 381 GW on the 27th of March Biomass output is likely to grow further as a new biomass-powered combined heat and power unit at Teesside is expected to come online later this year
Global leadershipCurrently biomass supplies 2 of the worldrsquos electricity though this share is higher in Europe having grown five-fold since 2000 to hit 6 in 20202 One explanation for this comes from countries such as Denmark and Sweden which have extensive municipal electricity and combined heat and power production
Another reason is the UK Our share of electricity generation from biomass has tripled over the past decade hitting an all-time high of 11 in 20202 This means the UK has the highest share of electricity production from biomass of any large country (ones with over 100 TWhyear electricity demand)
The UK pioneered large-scale use of biomass for electricity generation contributing to its world-leading success in decarbonising electricity over the last decade This position means the UK has also played a major part in developing the science-led sustainability criteria that govern the use of biomass
The transition from coal to biomass to BECCS (bioenergy with carbon capture and storage) outlines the versatility of biomass for electricity generation to contribute at each stage of the decarbonisation journey In a high-coal system (the UKrsquos past) biomass conversions allow for rapid carbon reductions whilst utilising existing infrastructure and preserving the reliable functionality of firm dispatchable power In a high-renewables system (increasingly the UKrsquos present) biomass offers flexibility services including inertia and grid balancing This helps the overall system to integrate variable renewables and lowers grid management costs Finally looking to the future BECCS offers the possibility of negative emissions which the Climate Change Committee describe as ldquoa necessityrdquo for net zero and beyond
Share of electricity generated from biomass in 2020 across all countries worldwide which consume more than 100 TWh of electricity per year 2
3 Britainrsquos transition from coal to biomass to BECCS
1 These units will still operate in the capacity market until they are fully decommissioned in 2022 meaning they could be called upon to provide peak capacity at times of system stress2 Data from Emberrsquos Global Electricity Review
0 2 4 6 8 10
Not shown Iran Iraq Saudi Arabia UAE Venezuela Vietnam mdash all 0
UK
Thailand
Germany
Brazil
Sweden
Netherlands
Italy
Japan
Poland
Spain
Pakistan
Canada
China
France
Turkey
Taiwan
Australia
US
Argentina
India
Mexico
Malaysia
Norway
South Korea
Russia
Indonesia
Ukraine
South Africa
Egypt
UK
Drax Electric Insights Quarterly ndash Q1 2021
7
Looking to the past Coal dominated Britainrsquos electricity generation until just a decade ago However since 2018 Britain has produced more electricity from biomass than it has from coal There are three main reasons why Britainrsquos coal plants closed down
Clean air legislation forced older plants to close if they did not fit equipment to capture harmful sulphur and nitrous oxide emissions Secondly many plants closed on economic grounds either because they were reaching the end of their design life and the cost of maintaining them outweighed the revenue they could bring in or they could simply no longer compete in the market A key factor in this was government policy raising the cost of emitting carbon so coal plants became more expensive than gas With demand falling and renewables taking a larger share there was simply no room left for them to make a profit
When these units retired they needed to be replaced by a clean electricity source that could provide baseload generation producing electricity when it is needed However research shows that in addition these coal retirements also led to a 30 increase in output from natural gas plants (37 TWh extra in 2019)3
The third source of coal plant closures was conversion to biomass Although they represent the smallest share of capacity (with 32 GW converted) they have delivered greater carbon savings because not only did they reduce the amount of coal burnt they replaced it with a low-carbon source of electricity Coal to biomass conversions therefore limited ndash rather than increased ndash gas generation Comparing 2012 to 2019 they reduced carbon emissions by 10 MtCO2 per year slightly more than achieved by the 8 GW of onshore wind farms installed in that time3
3 R Green and I Staffell 2021 The contribution of taxes subsidies and regulations to British electricity decarbonisation EPRG 2105
The change in coal power station capacity over the last decade and main categories of coal plant closures
0
5
10
15
20
25
30
2010
280
85
minus32
minus61
minus101
Biomassconversions
2020
GW
Air qualitylegislation
Economicclosures
Drax Electric Insights Quarterly ndash Q1 2021
8
Annual electricity generation from solid fuels in Britain and the average carbon intensity of electricity shown over the past three
decades and the next three decades according to National Gridrsquos ldquoLeading the Wayrdquo future energy scenario
Looking to the futureNational Grid ESOrsquos Future Energy Scenarios see biomass playing an increased role in coming decades Current unabated biomass (where emissions from generating electricity are offset by regrowing it) plays a key step towards the deployment of BECCS (bioenergy with carbon capture and storage) from the late 2020s
Bioenergy (the lsquoBErsquo in lsquoBECCSrsquo) operates by growing and continuously regrowing plants that are then used for energy The carbon emitted during energy generation is reabsorbed by the regrowth of the plants meaning net-zero emissions Supply chain emissions are then counted on top of this in accordance with a strict sustainability governance regime hence Electric Insights considers biomass as producing 121 grams of CO2 per kWh of electricity
If emissions from the power station are instead captured and locked away underground (the lsquoCCSrsquo in lsquoBECCSrsquo) the plants being grown and regrown actually remove carbon from the atmosphere over and above simply offsetting the bioenergy emissions Therefore BECCS as a whole can deliver negative emissions as part of a major energy source
The deployment of BECCS means annual carbon emissions from electricity generation could fall negative as early as 2030 in National Gridrsquos scenarios My the mid-2030s BECCS could be removing 40 MtCO2 per year from the atmosphere comparable to total annual emissions in 2020
The IEA remarked in 2018 that ldquomodern bioenergy is the overlooked giant of the renewable energy fieldrdquo With the potential for sustainable expansion and the use of carbon capture to deliver negative emissions this could take a more visible role in the UKrsquos future
TWh
1990 2000 2010 2020 2030 2040 2050
0
40
80
120
160
20
60
100
140
0
minus200
400
200
600
800
Electricity generation begins to remove more CO2 than it emits
gkWhCarbon Intensity
Biomass BECCSCoal
Drax Electric Insights Quarterly ndash Q1 2021
9
4 IFA2 goes online
A new power link between the UK and France went online in January meaning Britainrsquos interconnector capacity has doubled over the last decade to 6 GW IFA2 is one of Britainrsquos two undersea connection to France coming some 60 years after the first link was built and 35 years after that was replaced by IFA (which still operates today) The pound700m IFA2 project jointly owned by National Grid and RTE (their French equivalent) spans 130 miles under the English Channel to connect Portsmouth with Caen in Normandy
After some early teething troubles the new link has imported 20 times more power than it exported since it went into operation on January 22nd Imports of electricity to Britain rose to new record levels although they could have been higher still
Despite very good historical reliability the BritNed cable between Britain and the Netherlands was out of action for most of the quarter from mid-December through to mid-February and again since mid-March As a result Dutch imports were down 60 and exports down 90 compared to the first quarter last year Cable faults are responsible for both outages being found on December 8th last year (and taking three months to repair) and again on March 9th this year (with an estimated two months to repair)
There were initial reports that the end of the Brexit transition period led to reduced trade over the interconnectors to Ireland at the start of this year sending power prices rocketing The UK left Europersquos Internal Energy Market on the 31st December 2020 which increased friction for trading However it appears this was only a short-term blip mdash trade fell by 40 between December 2020 and January 2021 but then recovered completely in February Over the first quarter of this year trade with the Irish power market was 1 higher than the average during 2019-20
Work on a third interconnector to France will begin later this year and links to Norway and Denmark are currently under construction These will begin to be shown on the Electric Insights webpage in the coming months With these and the return of the Dutch interconnector to service Britain is set to source an increasing share of its power from abroad in the coming years
Installed capacity of interconnectors in Great Britain over the last two decades
Daily trade over the BritNed interconnector during the past six months
0
1
2
3
4
5
6
GW
IFA (France)
Moyle (Northern Ireland)
BritNed (Netherlands)
East West (Republic of Ireland)
Nemo Link (Belgium)
IFA2 (France)
2000 2005 2010 2015 2020
minus04
minus02
02
0
04
06
08
1
Imports from the Netherlands
Exports to the Netherlands
Oct Nov Dec Jan Feb Mar
GW
Drax Electric Insights Quarterly ndash Q1 2021
10
At the start of March Britain experienced its longest spell of low wind output in more than a decade For more than a week calm weather covered the country Wind farm output fell to as low as 06 GW on the 3rd of March in sharp contrast to the 181 GW delivered later on that month Power prices were typical for the time of year suggesting that the system wasnrsquot particularly stressed though
A prolonged period of low wind and low solar power output has been coined in German as a lsquoDunkelflautersquo (dunk-el-flout-eh) mdash a dark wind lull The event at the start of March was the longest Dunkelflaute that Britain has experienced in the last decade Between the 26th of February and the 8th of March the capacity factor1 of the national wind fleet did not go above 20 Its average over these 11 days was just 11 less than a quarter of their average in the month either side
Both the frequency and duration of these events matters Looking back over the Electric Insights archives this was the longest cold-calm spell that Britain has experienced in over a decade February 2010 also saw 11 days with wind capacity factors never going above 20 However back in 2010 most of Britainrsquos wind farms were onshore and so average capacity factors were lower Also the impact of low wind speeds was barely noticeable back in 2010 as Britainrsquos wind capacity then was one-sixth of current levels
Based on longer records of historical wind speed data from Renewablesninja the March Dunkelflaute could be expected roughly once every 20 years statistically speaking Prolonged low-wind periods should be accounted for when designing Britainrsquos energy system security and they should not be seen as a lsquoblack swan eventrsquo which cannot be anticipated
The power system coped in March because the shortfall in wind was made up by fossil fuels particularly the 28 GW of gas power stations Fossil fuels peaked at a 73 share of all electricity generation on the 6th of March While coal and biomass stations ran at close to full output to help Britainrsquos nuclear output actually fell to its lowest this year during the low-wind period Nuclear output dropped to just 36 GW 30 below its average for the quarter as maintenance outages continued to affect the fleet
5 When the wind goes gas fills in the gap
Britainrsquos wind farm capacity factor over the past six months highlighting times when it fell below 20 for more than a day
1 Power output as a fraction of total installed capacity
0
60
40
2011 days
Oct Nov Dec Jan Feb Mar
Drax Electric Insights Quarterly ndash Q1 2021
11
The UKrsquos ambition to reach net zero would prohibit the use of (unabated) gas power plants for such long periods While a variety of clean flexibility options could replace gas the scale and duration of wind droughts may rule many of them out
The lull in March saw a deficit of over 10 GW of wind capacity compared to the surrounding weeks and some 2300 GWh of energy In comparison the UKrsquos largest storage facility ndash the Dinorwig pumped hydro plant in North Wales ndash stores just 9 GWh Battery storage systems are ideal for providing peak power but their duration (and total energy storage) is limited Over 10000 of the worldrsquos largest battery storage systems would be needed to cover the shortfall occupying a space the size of Liverpool city2
Interconnectors can help but these weather patterns tend to affect the entire north-west of Europe meaning our neighbouring countries would also be short of capacity Flexible demand may be insufficient for a different reason ndash households and industries may be willing to turn down their consumption for a few hours at a time but doing so for over a week straight is another matter This restricts the options for dealing with large-scale weather variability to longer-duration storage or low- and zero-carbon fuels such as biomass and potentially hydrogen in the future The four biomass domes at Drax Power Station hold enough fuel to generate 600 GWh of electricity showing the scale that storable fuels can attain
Weather variability will play an important part in the planning and operation of Britainrsquos future energy system The recent power outage in Texas highlights the cost of overlooking extreme weather risks (noting that it was gas generation rather than wind which drove this crisis) Securely managing wind variability will likely require policy and market innovations not just technical fixes
The output from Britainrsquos wind farms is almost exclusively balanced by gas power stations Throughout the quarter their outputs were the mirror image of one another performing an elaborate dance to keep the system balanced For every GW that wind output falls gas output rises by 084 GW When all other generation sources are combined their output only varies by 10 around their average of 13 GW across the quarter
Daily average output from wind farms and gas power stations during Quarter 1 of 2021
2 Based on a 6500 msup2 footprint estimated for the South Australia battery farm
0
5
10
15
20
GW GasWind
January February March
753 TWhsupplied
376
256
144
86
75
27
22
13
Gas
Wind
Nuclear
Imports
Biomass
Coal
Solar
Hydro
Share of the mix
Drax Electric Insights Quarterly ndash Q1 2021
12
Installed Capacity (GW) Energy Output (TWh) Utilisation Capacity Factor
2021 Q1 Annual change 2021 Q1 Annual change Average Maximum
Nuclear 95 ~ 108 ndash15 (ndash12) 53 65
Biomass 38 +01 (+4) 56 +05 (+10) 68 100
Hydro 12 ~ 10 ndash05 (ndash35) 40 96
Wind
ndash of which Onshore
ndash of which Offshore
244
137
107
+09 (+4)
~
+09 (+9)
193
87
106
ndash40 (ndash17)
ndash 22 (ndash20)
ndash 18 (ndash14)
37
30
46
74
73
88
Solar 132 +01 (+1) 17 ndash03 (ndash14) 6 63
Gas 276 ndash05 (ndash2) 283 +49 (+21) 48 86
Coal 38 ndash14 (ndash27) 20 ndash09 (ndash31) 20 100
Imports60 +10 (+20)
72 +05 (+7) 58 97
Exports 07 ndash01 (ndash14) 6 61
Storage discharge31 ~
05 +01 (+12) 7 61
Storage recharge 05 ndash00 (ndash5) 7 76
6 Capacity and production statistics
Electricity production from gas rose 20 from this time last year driven by lower wind output and continued nuclear outages It was by no means a bad quarter for wind farms ndash their productivity was typical for winter at 37 ndash but this was much lower than during the unusually stormy start to 2020
Britainrsquos nuclear reactors on the other hand ran at just 53 capacity factor during the quarter when ideally they should be running 247 Their utilisation was only slightly higher than that of gas power stations
Demand was almost the same as Q1 last year as the demand reductions from the country being under lockdown were offset by it being on average 1 degree colder
Both biomass and coal power stations hit a peak of 100 capacity factor during the quarter meaning every station was running at full power at the same time This is highly unusual for coal which was called on extensively during periods of tight margins in January
Britainrsquos remaining coal capacity fell by one quarter as Drax announced the end of commercial operation for its two remaining coal units in Yorkshire This leaves two coal power stations remaining ndash West Burton A and Ratcliffe on Soar both in Nottinghamshire due to close in 2022 and 2024
Britainrsquos electricity supply mix in the first quarter of 2021
Installed capacity and electricity produced by each technology 1 2
1 Other sources give different values because of the types of plant they consider For example BEIS Energy Trends records an additional 07 GW of hydro 06 GW of biomass and 3 GW of waste-to-energy plants These plants and their output are not visible to the electricity transmission system and so cannot be reported on here
2 We include an estimate of the installed capacity of smaller storage devices which are not monitored by the electricity market operator Britainrsquos storage capacity is made up of 29 GW of pumped hydro storage 06 GW of lithium-ion batteries 04 GW of flywheels and 03 GW of compressed air
Drax Electric Insights Quarterly ndash Q1 2021
13
7 Power system records
March the 28th was a record-breaking day for Britainrsquos power system Wind farms produced more than 18 GW for the first time Over the whole day renewables produced two-thirds of the countryrsquos electricity demand pushing fossil fuels to their lowest ever share of electricity generation under one-eighth of the dayrsquos electricity
January also saw the highest power prices in over a decade averaging pound71MWh for the month On the 8th real-time prices hit a record pound4000MWh and on the 13th day-ahead prices (which are normally much smoother) peaked at over pound1000MWh for the first time in over two decades
The tables below look over the past decade (2009 to 2021) and report the record output and share of electricity generation plus sustained averages over a day a month and a calendar year1 Cells highlighted in blue are records that were broken in the first quarter of 2021 Each number links to the date it occurred on the Electric Insights website allowing these records to be explored visually
All Renewables ndash Maximum
Output (MW) Share ()
Instantaneous 25790 695
Daily average 20786 663
Month average 16030 443
Year average 11896 379
Biomass ndash Maximum
Output (MW) Share ()
Instantaneous 3831 168
Daily average 3316 129
Month average 2849 88
Year average 2216 71
Wind ndash Maximum
Output (MW) Share ()
Instantaneous 18120 609
Daily average 16844 534
Month average 12346 341
Year average 7817 249
Solar ndash Maximum
Output (MW) Share ()
Instantaneous 9680 331
Daily average 3386 136
Month average 2651 100
Year average 1372 44
1 The annual records relate to calendar years covering the period of 2009 to 2020
Gross demand
Maximum (MW) Minimum (MW)
Instantaneous 60070 16934
Daily average 49203 23297
Month average 45003 26081
Year average 37736 30709
Demand (net of wind and solar)
Maximum (MW) Minimum (MW)
Instantaneous 59563 6605
Daily average 48823 9454
Month average 43767 18017
Year average 36579 21520
Drax Electric Insights Quarterly ndash Q1 2021
14
Day ahead wholesale price
Maximum (poundMWh) Minimum (poundMWh)
Instantaneous 106327 ndash7284
Daily average 19745 ndash1135
Month average 7112 2203
Year average 5682 3388
Carbon intensity
Maximum (gkWh) Minimum (gkWh)
Instantaneous 704 18
Daily average 633 61
Month average 591 141
Year average 508 172
pound CO2
All fossil fuels ndash Maximum
Output (MW) Share ()
Instantaneous 49307 880
Daily average 43085 864
Month average 36466 812
Year average 29709 763
All fossil fuels ndash Minimum
Output (MW) Share ()
Instantaneous 2369 88
Daily average 3789 121
Month average 7382 278
Year average 11336 361
All low carbon ndash Maximum
Output (MW) Share ()
Instantaneous 32688 897
Daily average 27282 825
Month average 23276 654
Year average 17930 583
All low carbon ndash Minimum
Output (MW) Share ()
Instantaneous 3395 83
Daily average 5007 108
Month average 6885 167
Year average 8412 216
CO2 CO2
Nuclear ndash Maximum
Output (MW) Share ()
Instantaneous 9342 428
Daily average 9320 320
Month average 8649 265
Year average 7604 220
Nuclear ndash Minimum
Output (MW) Share ()
Instantaneous 2488 81
Daily average 2665 103
Month average 4232 129
Year average 5397 172
Coal ndash Maximum
Output (MW) Share ()
Instantaneous 26044 614
Daily average 24589 520
Month average 20746 480
Year average 15628 420
Coal ndash Minimum
Output (MW) Share ()
Instantaneous 0 00
Daily average 0 00
Month average 0 00
Year average 499 16
Drax Electric Insights Quarterly ndash Q1 2021
15
Gas ndash Maximum
Output (MW) Share ()
Instantaneous 27131 726
Daily average 24210 613
Month average 20828 548
Year average 17930 460
Gas ndash Minimum
Output (MW) Share ()
Instantaneous 1556 49
Daily average 3071 95
Month average 6775 199
Year average 9159 246
Imports ndash Maximum
Output (MW) Share ()
Instantaneous 5827 191
Daily average 4985 155
Month average 3796 106
Year average 2850 86
Pumped storage ndash Maximum 2
Output (MW) Share ()
Instantaneous 2660 79
Daily average 409 12
Pumped storage ndash Minimum 2
Output (MW) Share ()
Instantaneous ndash2782 ndash108
Daily average ndash622 ndash17
Exports ndash Maximum
Output (MW) Share ()
Instantaneous minus3870 minus143
Daily average ndash2748 ndash79
Month average ndash1690 ndash39
Year average ndash731 ndash19
2 Note that Britain has no inter-seasonal electricity storage so we only report on half-hourly and daily records Elexon and National Grid only report the output of large pumped hydro storage plants The operation of battery flywheel and other storage sites is not publicly available
Drax Group plcDrax Power Station Selby North Yorkshire YO8 8PH
Imperial Consultants58 Princersquos Gate Exhibition Road London SW7 2PGwwwimperial-consultantscoukwwwdraxcomConsultImperialDraxGroup

Drax Electric Insights Quarterly ndash Q1 2021
6
Britain moved one step closer to its 202425 target of phasing out coal power completely while biomass generation hit new record highs On the 5th of March Drax announced that it had ceased commercial power generation from coal1 after 47 years at the UKrsquos largest power station This leaves just two coal power stations operating in Britain as 85 of the countryrsquos coal fleet have retired over the last ten years
Meanwhile biomass power stations reached new records generating 381 GW on the 27th of March Biomass output is likely to grow further as a new biomass-powered combined heat and power unit at Teesside is expected to come online later this year
Global leadershipCurrently biomass supplies 2 of the worldrsquos electricity though this share is higher in Europe having grown five-fold since 2000 to hit 6 in 20202 One explanation for this comes from countries such as Denmark and Sweden which have extensive municipal electricity and combined heat and power production
Another reason is the UK Our share of electricity generation from biomass has tripled over the past decade hitting an all-time high of 11 in 20202 This means the UK has the highest share of electricity production from biomass of any large country (ones with over 100 TWhyear electricity demand)
The UK pioneered large-scale use of biomass for electricity generation contributing to its world-leading success in decarbonising electricity over the last decade This position means the UK has also played a major part in developing the science-led sustainability criteria that govern the use of biomass
The transition from coal to biomass to BECCS (bioenergy with carbon capture and storage) outlines the versatility of biomass for electricity generation to contribute at each stage of the decarbonisation journey In a high-coal system (the UKrsquos past) biomass conversions allow for rapid carbon reductions whilst utilising existing infrastructure and preserving the reliable functionality of firm dispatchable power In a high-renewables system (increasingly the UKrsquos present) biomass offers flexibility services including inertia and grid balancing This helps the overall system to integrate variable renewables and lowers grid management costs Finally looking to the future BECCS offers the possibility of negative emissions which the Climate Change Committee describe as ldquoa necessityrdquo for net zero and beyond
Share of electricity generated from biomass in 2020 across all countries worldwide which consume more than 100 TWh of electricity per year 2
3 Britainrsquos transition from coal to biomass to BECCS
1 These units will still operate in the capacity market until they are fully decommissioned in 2022 meaning they could be called upon to provide peak capacity at times of system stress2 Data from Emberrsquos Global Electricity Review
0 2 4 6 8 10
Not shown Iran Iraq Saudi Arabia UAE Venezuela Vietnam mdash all 0
UK
Thailand
Germany
Brazil
Sweden
Netherlands
Italy
Japan
Poland
Spain
Pakistan
Canada
China
France
Turkey
Taiwan
Australia
US
Argentina
India
Mexico
Malaysia
Norway
South Korea
Russia
Indonesia
Ukraine
South Africa
Egypt
UK
Drax Electric Insights Quarterly ndash Q1 2021
7
Looking to the past Coal dominated Britainrsquos electricity generation until just a decade ago However since 2018 Britain has produced more electricity from biomass than it has from coal There are three main reasons why Britainrsquos coal plants closed down
Clean air legislation forced older plants to close if they did not fit equipment to capture harmful sulphur and nitrous oxide emissions Secondly many plants closed on economic grounds either because they were reaching the end of their design life and the cost of maintaining them outweighed the revenue they could bring in or they could simply no longer compete in the market A key factor in this was government policy raising the cost of emitting carbon so coal plants became more expensive than gas With demand falling and renewables taking a larger share there was simply no room left for them to make a profit
When these units retired they needed to be replaced by a clean electricity source that could provide baseload generation producing electricity when it is needed However research shows that in addition these coal retirements also led to a 30 increase in output from natural gas plants (37 TWh extra in 2019)3
The third source of coal plant closures was conversion to biomass Although they represent the smallest share of capacity (with 32 GW converted) they have delivered greater carbon savings because not only did they reduce the amount of coal burnt they replaced it with a low-carbon source of electricity Coal to biomass conversions therefore limited ndash rather than increased ndash gas generation Comparing 2012 to 2019 they reduced carbon emissions by 10 MtCO2 per year slightly more than achieved by the 8 GW of onshore wind farms installed in that time3
3 R Green and I Staffell 2021 The contribution of taxes subsidies and regulations to British electricity decarbonisation EPRG 2105
The change in coal power station capacity over the last decade and main categories of coal plant closures
0
5
10
15
20
25
30
2010
280
85
minus32
minus61
minus101
Biomassconversions
2020
GW
Air qualitylegislation
Economicclosures
Drax Electric Insights Quarterly ndash Q1 2021
8
Annual electricity generation from solid fuels in Britain and the average carbon intensity of electricity shown over the past three
decades and the next three decades according to National Gridrsquos ldquoLeading the Wayrdquo future energy scenario
Looking to the futureNational Grid ESOrsquos Future Energy Scenarios see biomass playing an increased role in coming decades Current unabated biomass (where emissions from generating electricity are offset by regrowing it) plays a key step towards the deployment of BECCS (bioenergy with carbon capture and storage) from the late 2020s
Bioenergy (the lsquoBErsquo in lsquoBECCSrsquo) operates by growing and continuously regrowing plants that are then used for energy The carbon emitted during energy generation is reabsorbed by the regrowth of the plants meaning net-zero emissions Supply chain emissions are then counted on top of this in accordance with a strict sustainability governance regime hence Electric Insights considers biomass as producing 121 grams of CO2 per kWh of electricity
If emissions from the power station are instead captured and locked away underground (the lsquoCCSrsquo in lsquoBECCSrsquo) the plants being grown and regrown actually remove carbon from the atmosphere over and above simply offsetting the bioenergy emissions Therefore BECCS as a whole can deliver negative emissions as part of a major energy source
The deployment of BECCS means annual carbon emissions from electricity generation could fall negative as early as 2030 in National Gridrsquos scenarios My the mid-2030s BECCS could be removing 40 MtCO2 per year from the atmosphere comparable to total annual emissions in 2020
The IEA remarked in 2018 that ldquomodern bioenergy is the overlooked giant of the renewable energy fieldrdquo With the potential for sustainable expansion and the use of carbon capture to deliver negative emissions this could take a more visible role in the UKrsquos future
TWh
1990 2000 2010 2020 2030 2040 2050
0
40
80
120
160
20
60
100
140
0
minus200
400
200
600
800
Electricity generation begins to remove more CO2 than it emits
gkWhCarbon Intensity
Biomass BECCSCoal
Drax Electric Insights Quarterly ndash Q1 2021
9
4 IFA2 goes online
A new power link between the UK and France went online in January meaning Britainrsquos interconnector capacity has doubled over the last decade to 6 GW IFA2 is one of Britainrsquos two undersea connection to France coming some 60 years after the first link was built and 35 years after that was replaced by IFA (which still operates today) The pound700m IFA2 project jointly owned by National Grid and RTE (their French equivalent) spans 130 miles under the English Channel to connect Portsmouth with Caen in Normandy
After some early teething troubles the new link has imported 20 times more power than it exported since it went into operation on January 22nd Imports of electricity to Britain rose to new record levels although they could have been higher still
Despite very good historical reliability the BritNed cable between Britain and the Netherlands was out of action for most of the quarter from mid-December through to mid-February and again since mid-March As a result Dutch imports were down 60 and exports down 90 compared to the first quarter last year Cable faults are responsible for both outages being found on December 8th last year (and taking three months to repair) and again on March 9th this year (with an estimated two months to repair)
There were initial reports that the end of the Brexit transition period led to reduced trade over the interconnectors to Ireland at the start of this year sending power prices rocketing The UK left Europersquos Internal Energy Market on the 31st December 2020 which increased friction for trading However it appears this was only a short-term blip mdash trade fell by 40 between December 2020 and January 2021 but then recovered completely in February Over the first quarter of this year trade with the Irish power market was 1 higher than the average during 2019-20
Work on a third interconnector to France will begin later this year and links to Norway and Denmark are currently under construction These will begin to be shown on the Electric Insights webpage in the coming months With these and the return of the Dutch interconnector to service Britain is set to source an increasing share of its power from abroad in the coming years
Installed capacity of interconnectors in Great Britain over the last two decades
Daily trade over the BritNed interconnector during the past six months
0
1
2
3
4
5
6
GW
IFA (France)
Moyle (Northern Ireland)
BritNed (Netherlands)
East West (Republic of Ireland)
Nemo Link (Belgium)
IFA2 (France)
2000 2005 2010 2015 2020
minus04
minus02
02
0
04
06
08
1
Imports from the Netherlands
Exports to the Netherlands
Oct Nov Dec Jan Feb Mar
GW
Drax Electric Insights Quarterly ndash Q1 2021
10
At the start of March Britain experienced its longest spell of low wind output in more than a decade For more than a week calm weather covered the country Wind farm output fell to as low as 06 GW on the 3rd of March in sharp contrast to the 181 GW delivered later on that month Power prices were typical for the time of year suggesting that the system wasnrsquot particularly stressed though
A prolonged period of low wind and low solar power output has been coined in German as a lsquoDunkelflautersquo (dunk-el-flout-eh) mdash a dark wind lull The event at the start of March was the longest Dunkelflaute that Britain has experienced in the last decade Between the 26th of February and the 8th of March the capacity factor1 of the national wind fleet did not go above 20 Its average over these 11 days was just 11 less than a quarter of their average in the month either side
Both the frequency and duration of these events matters Looking back over the Electric Insights archives this was the longest cold-calm spell that Britain has experienced in over a decade February 2010 also saw 11 days with wind capacity factors never going above 20 However back in 2010 most of Britainrsquos wind farms were onshore and so average capacity factors were lower Also the impact of low wind speeds was barely noticeable back in 2010 as Britainrsquos wind capacity then was one-sixth of current levels
Based on longer records of historical wind speed data from Renewablesninja the March Dunkelflaute could be expected roughly once every 20 years statistically speaking Prolonged low-wind periods should be accounted for when designing Britainrsquos energy system security and they should not be seen as a lsquoblack swan eventrsquo which cannot be anticipated
The power system coped in March because the shortfall in wind was made up by fossil fuels particularly the 28 GW of gas power stations Fossil fuels peaked at a 73 share of all electricity generation on the 6th of March While coal and biomass stations ran at close to full output to help Britainrsquos nuclear output actually fell to its lowest this year during the low-wind period Nuclear output dropped to just 36 GW 30 below its average for the quarter as maintenance outages continued to affect the fleet
5 When the wind goes gas fills in the gap
Britainrsquos wind farm capacity factor over the past six months highlighting times when it fell below 20 for more than a day
1 Power output as a fraction of total installed capacity
0
60
40
2011 days
Oct Nov Dec Jan Feb Mar
Drax Electric Insights Quarterly ndash Q1 2021
11
The UKrsquos ambition to reach net zero would prohibit the use of (unabated) gas power plants for such long periods While a variety of clean flexibility options could replace gas the scale and duration of wind droughts may rule many of them out
The lull in March saw a deficit of over 10 GW of wind capacity compared to the surrounding weeks and some 2300 GWh of energy In comparison the UKrsquos largest storage facility ndash the Dinorwig pumped hydro plant in North Wales ndash stores just 9 GWh Battery storage systems are ideal for providing peak power but their duration (and total energy storage) is limited Over 10000 of the worldrsquos largest battery storage systems would be needed to cover the shortfall occupying a space the size of Liverpool city2
Interconnectors can help but these weather patterns tend to affect the entire north-west of Europe meaning our neighbouring countries would also be short of capacity Flexible demand may be insufficient for a different reason ndash households and industries may be willing to turn down their consumption for a few hours at a time but doing so for over a week straight is another matter This restricts the options for dealing with large-scale weather variability to longer-duration storage or low- and zero-carbon fuels such as biomass and potentially hydrogen in the future The four biomass domes at Drax Power Station hold enough fuel to generate 600 GWh of electricity showing the scale that storable fuels can attain
Weather variability will play an important part in the planning and operation of Britainrsquos future energy system The recent power outage in Texas highlights the cost of overlooking extreme weather risks (noting that it was gas generation rather than wind which drove this crisis) Securely managing wind variability will likely require policy and market innovations not just technical fixes
The output from Britainrsquos wind farms is almost exclusively balanced by gas power stations Throughout the quarter their outputs were the mirror image of one another performing an elaborate dance to keep the system balanced For every GW that wind output falls gas output rises by 084 GW When all other generation sources are combined their output only varies by 10 around their average of 13 GW across the quarter
Daily average output from wind farms and gas power stations during Quarter 1 of 2021
2 Based on a 6500 msup2 footprint estimated for the South Australia battery farm
0
5
10
15
20
GW GasWind
January February March
753 TWhsupplied
376
256
144
86
75
27
22
13
Gas
Wind
Nuclear
Imports
Biomass
Coal
Solar
Hydro
Share of the mix
Drax Electric Insights Quarterly ndash Q1 2021
12
Installed Capacity (GW) Energy Output (TWh) Utilisation Capacity Factor
2021 Q1 Annual change 2021 Q1 Annual change Average Maximum
Nuclear 95 ~ 108 ndash15 (ndash12) 53 65
Biomass 38 +01 (+4) 56 +05 (+10) 68 100
Hydro 12 ~ 10 ndash05 (ndash35) 40 96
Wind
ndash of which Onshore
ndash of which Offshore
244
137
107
+09 (+4)
~
+09 (+9)
193
87
106
ndash40 (ndash17)
ndash 22 (ndash20)
ndash 18 (ndash14)
37
30
46
74
73
88
Solar 132 +01 (+1) 17 ndash03 (ndash14) 6 63
Gas 276 ndash05 (ndash2) 283 +49 (+21) 48 86
Coal 38 ndash14 (ndash27) 20 ndash09 (ndash31) 20 100
Imports60 +10 (+20)
72 +05 (+7) 58 97
Exports 07 ndash01 (ndash14) 6 61
Storage discharge31 ~
05 +01 (+12) 7 61
Storage recharge 05 ndash00 (ndash5) 7 76
6 Capacity and production statistics
Electricity production from gas rose 20 from this time last year driven by lower wind output and continued nuclear outages It was by no means a bad quarter for wind farms ndash their productivity was typical for winter at 37 ndash but this was much lower than during the unusually stormy start to 2020
Britainrsquos nuclear reactors on the other hand ran at just 53 capacity factor during the quarter when ideally they should be running 247 Their utilisation was only slightly higher than that of gas power stations
Demand was almost the same as Q1 last year as the demand reductions from the country being under lockdown were offset by it being on average 1 degree colder
Both biomass and coal power stations hit a peak of 100 capacity factor during the quarter meaning every station was running at full power at the same time This is highly unusual for coal which was called on extensively during periods of tight margins in January
Britainrsquos remaining coal capacity fell by one quarter as Drax announced the end of commercial operation for its two remaining coal units in Yorkshire This leaves two coal power stations remaining ndash West Burton A and Ratcliffe on Soar both in Nottinghamshire due to close in 2022 and 2024
Britainrsquos electricity supply mix in the first quarter of 2021
Installed capacity and electricity produced by each technology 1 2
1 Other sources give different values because of the types of plant they consider For example BEIS Energy Trends records an additional 07 GW of hydro 06 GW of biomass and 3 GW of waste-to-energy plants These plants and their output are not visible to the electricity transmission system and so cannot be reported on here
2 We include an estimate of the installed capacity of smaller storage devices which are not monitored by the electricity market operator Britainrsquos storage capacity is made up of 29 GW of pumped hydro storage 06 GW of lithium-ion batteries 04 GW of flywheels and 03 GW of compressed air
Drax Electric Insights Quarterly ndash Q1 2021
13
7 Power system records
March the 28th was a record-breaking day for Britainrsquos power system Wind farms produced more than 18 GW for the first time Over the whole day renewables produced two-thirds of the countryrsquos electricity demand pushing fossil fuels to their lowest ever share of electricity generation under one-eighth of the dayrsquos electricity
January also saw the highest power prices in over a decade averaging pound71MWh for the month On the 8th real-time prices hit a record pound4000MWh and on the 13th day-ahead prices (which are normally much smoother) peaked at over pound1000MWh for the first time in over two decades
The tables below look over the past decade (2009 to 2021) and report the record output and share of electricity generation plus sustained averages over a day a month and a calendar year1 Cells highlighted in blue are records that were broken in the first quarter of 2021 Each number links to the date it occurred on the Electric Insights website allowing these records to be explored visually
All Renewables ndash Maximum
Output (MW) Share ()
Instantaneous 25790 695
Daily average 20786 663
Month average 16030 443
Year average 11896 379
Biomass ndash Maximum
Output (MW) Share ()
Instantaneous 3831 168
Daily average 3316 129
Month average 2849 88
Year average 2216 71
Wind ndash Maximum
Output (MW) Share ()
Instantaneous 18120 609
Daily average 16844 534
Month average 12346 341
Year average 7817 249
Solar ndash Maximum
Output (MW) Share ()
Instantaneous 9680 331
Daily average 3386 136
Month average 2651 100
Year average 1372 44
1 The annual records relate to calendar years covering the period of 2009 to 2020
Gross demand
Maximum (MW) Minimum (MW)
Instantaneous 60070 16934
Daily average 49203 23297
Month average 45003 26081
Year average 37736 30709
Demand (net of wind and solar)
Maximum (MW) Minimum (MW)
Instantaneous 59563 6605
Daily average 48823 9454
Month average 43767 18017
Year average 36579 21520
Drax Electric Insights Quarterly ndash Q1 2021
14
Day ahead wholesale price
Maximum (poundMWh) Minimum (poundMWh)
Instantaneous 106327 ndash7284
Daily average 19745 ndash1135
Month average 7112 2203
Year average 5682 3388
Carbon intensity
Maximum (gkWh) Minimum (gkWh)
Instantaneous 704 18
Daily average 633 61
Month average 591 141
Year average 508 172
pound CO2
All fossil fuels ndash Maximum
Output (MW) Share ()
Instantaneous 49307 880
Daily average 43085 864
Month average 36466 812
Year average 29709 763
All fossil fuels ndash Minimum
Output (MW) Share ()
Instantaneous 2369 88
Daily average 3789 121
Month average 7382 278
Year average 11336 361
All low carbon ndash Maximum
Output (MW) Share ()
Instantaneous 32688 897
Daily average 27282 825
Month average 23276 654
Year average 17930 583
All low carbon ndash Minimum
Output (MW) Share ()
Instantaneous 3395 83
Daily average 5007 108
Month average 6885 167
Year average 8412 216
CO2 CO2
Nuclear ndash Maximum
Output (MW) Share ()
Instantaneous 9342 428
Daily average 9320 320
Month average 8649 265
Year average 7604 220
Nuclear ndash Minimum
Output (MW) Share ()
Instantaneous 2488 81
Daily average 2665 103
Month average 4232 129
Year average 5397 172
Coal ndash Maximum
Output (MW) Share ()
Instantaneous 26044 614
Daily average 24589 520
Month average 20746 480
Year average 15628 420
Coal ndash Minimum
Output (MW) Share ()
Instantaneous 0 00
Daily average 0 00
Month average 0 00
Year average 499 16
Drax Electric Insights Quarterly ndash Q1 2021
15
Gas ndash Maximum
Output (MW) Share ()
Instantaneous 27131 726
Daily average 24210 613
Month average 20828 548
Year average 17930 460
Gas ndash Minimum
Output (MW) Share ()
Instantaneous 1556 49
Daily average 3071 95
Month average 6775 199
Year average 9159 246
Imports ndash Maximum
Output (MW) Share ()
Instantaneous 5827 191
Daily average 4985 155
Month average 3796 106
Year average 2850 86
Pumped storage ndash Maximum 2
Output (MW) Share ()
Instantaneous 2660 79
Daily average 409 12
Pumped storage ndash Minimum 2
Output (MW) Share ()
Instantaneous ndash2782 ndash108
Daily average ndash622 ndash17
Exports ndash Maximum
Output (MW) Share ()
Instantaneous minus3870 minus143
Daily average ndash2748 ndash79
Month average ndash1690 ndash39
Year average ndash731 ndash19
2 Note that Britain has no inter-seasonal electricity storage so we only report on half-hourly and daily records Elexon and National Grid only report the output of large pumped hydro storage plants The operation of battery flywheel and other storage sites is not publicly available
Drax Group plcDrax Power Station Selby North Yorkshire YO8 8PH
Imperial Consultants58 Princersquos Gate Exhibition Road London SW7 2PGwwwimperial-consultantscoukwwwdraxcomConsultImperialDraxGroup
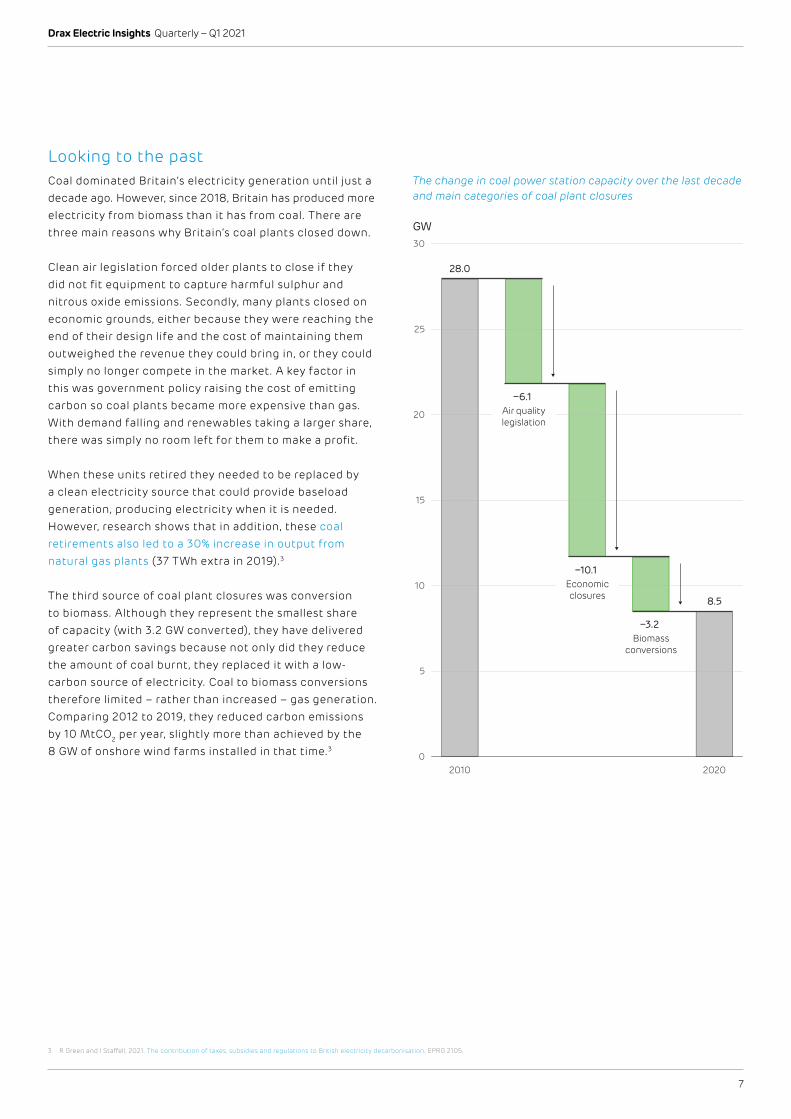
Drax Electric Insights Quarterly ndash Q1 2021
10
At the start of March Britain experienced its longest spell of low wind output in more than a decade For more than a week calm weather covered the country Wind farm output fell to as low as 06 GW on the 3rd of March in sharp contrast to the 181 GW delivered later on that month Power prices were typical for the time of year suggesting that the system wasnrsquot particularly stressed though
A prolonged period of low wind and low solar power output has been coined in German as a lsquoDunkelflautersquo (dunk-el-flout-eh) mdash a dark wind lull The event at the start of March was the longest Dunkelflaute that Britain has experienced in the last decade Between the 26th of February and the 8th of March the capacity factor1 of the national wind fleet did not go above 20 Its average over these 11 days was just 11 less than a quarter of their average in the month either side
Both the frequency and duration of these events matters Looking back over the Electric Insights archives this was the longest cold-calm spell that Britain has experienced in over a decade February 2010 also saw 11 days with wind capacity factors never going above 20 However back in 2010 most of Britainrsquos wind farms were onshore and so average capacity factors were lower Also the impact of low wind speeds was barely noticeable back in 2010 as Britainrsquos wind capacity then was one-sixth of current levels
Based on longer records of historical wind speed data from Renewablesninja the March Dunkelflaute could be expected roughly once every 20 years statistically speaking Prolonged low-wind periods should be accounted for when designing Britainrsquos energy system security and they should not be seen as a lsquoblack swan eventrsquo which cannot be anticipated
The power system coped in March because the shortfall in wind was made up by fossil fuels particularly the 28 GW of gas power stations Fossil fuels peaked at a 73 share of all electricity generation on the 6th of March While coal and biomass stations ran at close to full output to help Britainrsquos nuclear output actually fell to its lowest this year during the low-wind period Nuclear output dropped to just 36 GW 30 below its average for the quarter as maintenance outages continued to affect the fleet
5 When the wind goes gas fills in the gap
Britainrsquos wind farm capacity factor over the past six months highlighting times when it fell below 20 for more than a day
1 Power output as a fraction of total installed capacity
0
60
40
2011 days
Oct Nov Dec Jan Feb Mar
Drax Electric Insights Quarterly ndash Q1 2021
11
The UKrsquos ambition to reach net zero would prohibit the use of (unabated) gas power plants for such long periods While a variety of clean flexibility options could replace gas the scale and duration of wind droughts may rule many of them out
The lull in March saw a deficit of over 10 GW of wind capacity compared to the surrounding weeks and some 2300 GWh of energy In comparison the UKrsquos largest storage facility ndash the Dinorwig pumped hydro plant in North Wales ndash stores just 9 GWh Battery storage systems are ideal for providing peak power but their duration (and total energy storage) is limited Over 10000 of the worldrsquos largest battery storage systems would be needed to cover the shortfall occupying a space the size of Liverpool city2
Interconnectors can help but these weather patterns tend to affect the entire north-west of Europe meaning our neighbouring countries would also be short of capacity Flexible demand may be insufficient for a different reason ndash households and industries may be willing to turn down their consumption for a few hours at a time but doing so for over a week straight is another matter This restricts the options for dealing with large-scale weather variability to longer-duration storage or low- and zero-carbon fuels such as biomass and potentially hydrogen in the future The four biomass domes at Drax Power Station hold enough fuel to generate 600 GWh of electricity showing the scale that storable fuels can attain
Weather variability will play an important part in the planning and operation of Britainrsquos future energy system The recent power outage in Texas highlights the cost of overlooking extreme weather risks (noting that it was gas generation rather than wind which drove this crisis) Securely managing wind variability will likely require policy and market innovations not just technical fixes
The output from Britainrsquos wind farms is almost exclusively balanced by gas power stations Throughout the quarter their outputs were the mirror image of one another performing an elaborate dance to keep the system balanced For every GW that wind output falls gas output rises by 084 GW When all other generation sources are combined their output only varies by 10 around their average of 13 GW across the quarter
Daily average output from wind farms and gas power stations during Quarter 1 of 2021
2 Based on a 6500 msup2 footprint estimated for the South Australia battery farm
0
5
10
15
20
GW GasWind
January February March
753 TWhsupplied
376
256
144
86
75
27
22
13
Gas
Wind
Nuclear
Imports
Biomass
Coal
Solar
Hydro
Share of the mix
Drax Electric Insights Quarterly ndash Q1 2021
12
Installed Capacity (GW) Energy Output (TWh) Utilisation Capacity Factor
2021 Q1 Annual change 2021 Q1 Annual change Average Maximum
Nuclear 95 ~ 108 ndash15 (ndash12) 53 65
Biomass 38 +01 (+4) 56 +05 (+10) 68 100
Hydro 12 ~ 10 ndash05 (ndash35) 40 96
Wind
ndash of which Onshore
ndash of which Offshore
244
137
107
+09 (+4)
~
+09 (+9)
193
87
106
ndash40 (ndash17)
ndash 22 (ndash20)
ndash 18 (ndash14)
37
30
46
74
73
88
Solar 132 +01 (+1) 17 ndash03 (ndash14) 6 63
Gas 276 ndash05 (ndash2) 283 +49 (+21) 48 86
Coal 38 ndash14 (ndash27) 20 ndash09 (ndash31) 20 100
Imports60 +10 (+20)
72 +05 (+7) 58 97
Exports 07 ndash01 (ndash14) 6 61
Storage discharge31 ~
05 +01 (+12) 7 61
Storage recharge 05 ndash00 (ndash5) 7 76
6 Capacity and production statistics
Electricity production from gas rose 20 from this time last year driven by lower wind output and continued nuclear outages It was by no means a bad quarter for wind farms ndash their productivity was typical for winter at 37 ndash but this was much lower than during the unusually stormy start to 2020
Britainrsquos nuclear reactors on the other hand ran at just 53 capacity factor during the quarter when ideally they should be running 247 Their utilisation was only slightly higher than that of gas power stations
Demand was almost the same as Q1 last year as the demand reductions from the country being under lockdown were offset by it being on average 1 degree colder
Both biomass and coal power stations hit a peak of 100 capacity factor during the quarter meaning every station was running at full power at the same time This is highly unusual for coal which was called on extensively during periods of tight margins in January
Britainrsquos remaining coal capacity fell by one quarter as Drax announced the end of commercial operation for its two remaining coal units in Yorkshire This leaves two coal power stations remaining ndash West Burton A and Ratcliffe on Soar both in Nottinghamshire due to close in 2022 and 2024
Britainrsquos electricity supply mix in the first quarter of 2021
Installed capacity and electricity produced by each technology 1 2
1 Other sources give different values because of the types of plant they consider For example BEIS Energy Trends records an additional 07 GW of hydro 06 GW of biomass and 3 GW of waste-to-energy plants These plants and their output are not visible to the electricity transmission system and so cannot be reported on here
2 We include an estimate of the installed capacity of smaller storage devices which are not monitored by the electricity market operator Britainrsquos storage capacity is made up of 29 GW of pumped hydro storage 06 GW of lithium-ion batteries 04 GW of flywheels and 03 GW of compressed air
Drax Electric Insights Quarterly ndash Q1 2021
13
7 Power system records
March the 28th was a record-breaking day for Britainrsquos power system Wind farms produced more than 18 GW for the first time Over the whole day renewables produced two-thirds of the countryrsquos electricity demand pushing fossil fuels to their lowest ever share of electricity generation under one-eighth of the dayrsquos electricity
January also saw the highest power prices in over a decade averaging pound71MWh for the month On the 8th real-time prices hit a record pound4000MWh and on the 13th day-ahead prices (which are normally much smoother) peaked at over pound1000MWh for the first time in over two decades
The tables below look over the past decade (2009 to 2021) and report the record output and share of electricity generation plus sustained averages over a day a month and a calendar year1 Cells highlighted in blue are records that were broken in the first quarter of 2021 Each number links to the date it occurred on the Electric Insights website allowing these records to be explored visually
All Renewables ndash Maximum
Output (MW) Share ()
Instantaneous 25790 695
Daily average 20786 663
Month average 16030 443
Year average 11896 379
Biomass ndash Maximum
Output (MW) Share ()
Instantaneous 3831 168
Daily average 3316 129
Month average 2849 88
Year average 2216 71
Wind ndash Maximum
Output (MW) Share ()
Instantaneous 18120 609
Daily average 16844 534
Month average 12346 341
Year average 7817 249
Solar ndash Maximum
Output (MW) Share ()
Instantaneous 9680 331
Daily average 3386 136
Month average 2651 100
Year average 1372 44
1 The annual records relate to calendar years covering the period of 2009 to 2020
Gross demand
Maximum (MW) Minimum (MW)
Instantaneous 60070 16934
Daily average 49203 23297
Month average 45003 26081
Year average 37736 30709
Demand (net of wind and solar)
Maximum (MW) Minimum (MW)
Instantaneous 59563 6605
Daily average 48823 9454
Month average 43767 18017
Year average 36579 21520
Drax Electric Insights Quarterly ndash Q1 2021
14
Day ahead wholesale price
Maximum (poundMWh) Minimum (poundMWh)
Instantaneous 106327 ndash7284
Daily average 19745 ndash1135
Month average 7112 2203
Year average 5682 3388
Carbon intensity
Maximum (gkWh) Minimum (gkWh)
Instantaneous 704 18
Daily average 633 61
Month average 591 141
Year average 508 172
pound CO2
All fossil fuels ndash Maximum
Output (MW) Share ()
Instantaneous 49307 880
Daily average 43085 864
Month average 36466 812
Year average 29709 763
All fossil fuels ndash Minimum
Output (MW) Share ()
Instantaneous 2369 88
Daily average 3789 121
Month average 7382 278
Year average 11336 361
All low carbon ndash Maximum
Output (MW) Share ()
Instantaneous 32688 897
Daily average 27282 825
Month average 23276 654
Year average 17930 583
All low carbon ndash Minimum
Output (MW) Share ()
Instantaneous 3395 83
Daily average 5007 108
Month average 6885 167
Year average 8412 216
CO2 CO2
Nuclear ndash Maximum
Output (MW) Share ()
Instantaneous 9342 428
Daily average 9320 320
Month average 8649 265
Year average 7604 220
Nuclear ndash Minimum
Output (MW) Share ()
Instantaneous 2488 81
Daily average 2665 103
Month average 4232 129
Year average 5397 172
Coal ndash Maximum
Output (MW) Share ()
Instantaneous 26044 614
Daily average 24589 520
Month average 20746 480
Year average 15628 420
Coal ndash Minimum
Output (MW) Share ()
Instantaneous 0 00
Daily average 0 00
Month average 0 00
Year average 499 16
Drax Electric Insights Quarterly ndash Q1 2021
15
Gas ndash Maximum
Output (MW) Share ()
Instantaneous 27131 726
Daily average 24210 613
Month average 20828 548
Year average 17930 460
Gas ndash Minimum
Output (MW) Share ()
Instantaneous 1556 49
Daily average 3071 95
Month average 6775 199
Year average 9159 246
Imports ndash Maximum
Output (MW) Share ()
Instantaneous 5827 191
Daily average 4985 155
Month average 3796 106
Year average 2850 86
Pumped storage ndash Maximum 2
Output (MW) Share ()
Instantaneous 2660 79
Daily average 409 12
Pumped storage ndash Minimum 2
Output (MW) Share ()
Instantaneous ndash2782 ndash108
Daily average ndash622 ndash17
Exports ndash Maximum
Output (MW) Share ()
Instantaneous minus3870 minus143
Daily average ndash2748 ndash79
Month average ndash1690 ndash39
Year average ndash731 ndash19
2 Note that Britain has no inter-seasonal electricity storage so we only report on half-hourly and daily records Elexon and National Grid only report the output of large pumped hydro storage plants The operation of battery flywheel and other storage sites is not publicly available
Drax Group plcDrax Power Station Selby North Yorkshire YO8 8PH
Imperial Consultants58 Princersquos Gate Exhibition Road London SW7 2PGwwwimperial-consultantscoukwwwdraxcomConsultImperialDraxGroup

Drax Electric Insights Quarterly ndash Q1 2021
11
The UKrsquos ambition to reach net zero would prohibit the use of (unabated) gas power plants for such long periods While a variety of clean flexibility options could replace gas the scale and duration of wind droughts may rule many of them out
The lull in March saw a deficit of over 10 GW of wind capacity compared to the surrounding weeks and some 2300 GWh of energy In comparison the UKrsquos largest storage facility ndash the Dinorwig pumped hydro plant in North Wales ndash stores just 9 GWh Battery storage systems are ideal for providing peak power but their duration (and total energy storage) is limited Over 10000 of the worldrsquos largest battery storage systems would be needed to cover the shortfall occupying a space the size of Liverpool city2
Interconnectors can help but these weather patterns tend to affect the entire north-west of Europe meaning our neighbouring countries would also be short of capacity Flexible demand may be insufficient for a different reason ndash households and industries may be willing to turn down their consumption for a few hours at a time but doing so for over a week straight is another matter This restricts the options for dealing with large-scale weather variability to longer-duration storage or low- and zero-carbon fuels such as biomass and potentially hydrogen in the future The four biomass domes at Drax Power Station hold enough fuel to generate 600 GWh of electricity showing the scale that storable fuels can attain
Weather variability will play an important part in the planning and operation of Britainrsquos future energy system The recent power outage in Texas highlights the cost of overlooking extreme weather risks (noting that it was gas generation rather than wind which drove this crisis) Securely managing wind variability will likely require policy and market innovations not just technical fixes
The output from Britainrsquos wind farms is almost exclusively balanced by gas power stations Throughout the quarter their outputs were the mirror image of one another performing an elaborate dance to keep the system balanced For every GW that wind output falls gas output rises by 084 GW When all other generation sources are combined their output only varies by 10 around their average of 13 GW across the quarter
Daily average output from wind farms and gas power stations during Quarter 1 of 2021
2 Based on a 6500 msup2 footprint estimated for the South Australia battery farm
0
5
10
15
20
GW GasWind
January February March
753 TWhsupplied
376
256
144
86
75
27
22
13
Gas
Wind
Nuclear
Imports
Biomass
Coal
Solar
Hydro
Share of the mix
Drax Electric Insights Quarterly ndash Q1 2021
12
Installed Capacity (GW) Energy Output (TWh) Utilisation Capacity Factor
2021 Q1 Annual change 2021 Q1 Annual change Average Maximum
Nuclear 95 ~ 108 ndash15 (ndash12) 53 65
Biomass 38 +01 (+4) 56 +05 (+10) 68 100
Hydro 12 ~ 10 ndash05 (ndash35) 40 96
Wind
ndash of which Onshore
ndash of which Offshore
244
137
107
+09 (+4)
~
+09 (+9)
193
87
106
ndash40 (ndash17)
ndash 22 (ndash20)
ndash 18 (ndash14)
37
30
46
74
73
88
Solar 132 +01 (+1) 17 ndash03 (ndash14) 6 63
Gas 276 ndash05 (ndash2) 283 +49 (+21) 48 86
Coal 38 ndash14 (ndash27) 20 ndash09 (ndash31) 20 100
Imports60 +10 (+20)
72 +05 (+7) 58 97
Exports 07 ndash01 (ndash14) 6 61
Storage discharge31 ~
05 +01 (+12) 7 61
Storage recharge 05 ndash00 (ndash5) 7 76
6 Capacity and production statistics
Electricity production from gas rose 20 from this time last year driven by lower wind output and continued nuclear outages It was by no means a bad quarter for wind farms ndash their productivity was typical for winter at 37 ndash but this was much lower than during the unusually stormy start to 2020
Britainrsquos nuclear reactors on the other hand ran at just 53 capacity factor during the quarter when ideally they should be running 247 Their utilisation was only slightly higher than that of gas power stations
Demand was almost the same as Q1 last year as the demand reductions from the country being under lockdown were offset by it being on average 1 degree colder
Both biomass and coal power stations hit a peak of 100 capacity factor during the quarter meaning every station was running at full power at the same time This is highly unusual for coal which was called on extensively during periods of tight margins in January
Britainrsquos remaining coal capacity fell by one quarter as Drax announced the end of commercial operation for its two remaining coal units in Yorkshire This leaves two coal power stations remaining ndash West Burton A and Ratcliffe on Soar both in Nottinghamshire due to close in 2022 and 2024
Britainrsquos electricity supply mix in the first quarter of 2021
Installed capacity and electricity produced by each technology 1 2
1 Other sources give different values because of the types of plant they consider For example BEIS Energy Trends records an additional 07 GW of hydro 06 GW of biomass and 3 GW of waste-to-energy plants These plants and their output are not visible to the electricity transmission system and so cannot be reported on here
2 We include an estimate of the installed capacity of smaller storage devices which are not monitored by the electricity market operator Britainrsquos storage capacity is made up of 29 GW of pumped hydro storage 06 GW of lithium-ion batteries 04 GW of flywheels and 03 GW of compressed air
Drax Electric Insights Quarterly ndash Q1 2021
13
7 Power system records
March the 28th was a record-breaking day for Britainrsquos power system Wind farms produced more than 18 GW for the first time Over the whole day renewables produced two-thirds of the countryrsquos electricity demand pushing fossil fuels to their lowest ever share of electricity generation under one-eighth of the dayrsquos electricity
January also saw the highest power prices in over a decade averaging pound71MWh for the month On the 8th real-time prices hit a record pound4000MWh and on the 13th day-ahead prices (which are normally much smoother) peaked at over pound1000MWh for the first time in over two decades
The tables below look over the past decade (2009 to 2021) and report the record output and share of electricity generation plus sustained averages over a day a month and a calendar year1 Cells highlighted in blue are records that were broken in the first quarter of 2021 Each number links to the date it occurred on the Electric Insights website allowing these records to be explored visually
All Renewables ndash Maximum
Output (MW) Share ()
Instantaneous 25790 695
Daily average 20786 663
Month average 16030 443
Year average 11896 379
Biomass ndash Maximum
Output (MW) Share ()
Instantaneous 3831 168
Daily average 3316 129
Month average 2849 88
Year average 2216 71
Wind ndash Maximum
Output (MW) Share ()
Instantaneous 18120 609
Daily average 16844 534
Month average 12346 341
Year average 7817 249
Solar ndash Maximum
Output (MW) Share ()
Instantaneous 9680 331
Daily average 3386 136
Month average 2651 100
Year average 1372 44
1 The annual records relate to calendar years covering the period of 2009 to 2020
Gross demand
Maximum (MW) Minimum (MW)
Instantaneous 60070 16934
Daily average 49203 23297
Month average 45003 26081
Year average 37736 30709
Demand (net of wind and solar)
Maximum (MW) Minimum (MW)
Instantaneous 59563 6605
Daily average 48823 9454
Month average 43767 18017
Year average 36579 21520
Drax Electric Insights Quarterly ndash Q1 2021
14
Day ahead wholesale price
Maximum (poundMWh) Minimum (poundMWh)
Instantaneous 106327 ndash7284
Daily average 19745 ndash1135
Month average 7112 2203
Year average 5682 3388
Carbon intensity
Maximum (gkWh) Minimum (gkWh)
Instantaneous 704 18
Daily average 633 61
Month average 591 141
Year average 508 172
pound CO2
All fossil fuels ndash Maximum
Output (MW) Share ()
Instantaneous 49307 880
Daily average 43085 864
Month average 36466 812
Year average 29709 763
All fossil fuels ndash Minimum
Output (MW) Share ()
Instantaneous 2369 88
Daily average 3789 121
Month average 7382 278
Year average 11336 361
All low carbon ndash Maximum
Output (MW) Share ()
Instantaneous 32688 897
Daily average 27282 825
Month average 23276 654
Year average 17930 583
All low carbon ndash Minimum
Output (MW) Share ()
Instantaneous 3395 83
Daily average 5007 108
Month average 6885 167
Year average 8412 216
CO2 CO2
Nuclear ndash Maximum
Output (MW) Share ()
Instantaneous 9342 428
Daily average 9320 320
Month average 8649 265
Year average 7604 220
Nuclear ndash Minimum
Output (MW) Share ()
Instantaneous 2488 81
Daily average 2665 103
Month average 4232 129
Year average 5397 172
Coal ndash Maximum
Output (MW) Share ()
Instantaneous 26044 614
Daily average 24589 520
Month average 20746 480
Year average 15628 420
Coal ndash Minimum
Output (MW) Share ()
Instantaneous 0 00
Daily average 0 00
Month average 0 00
Year average 499 16
Drax Electric Insights Quarterly ndash Q1 2021
15
Gas ndash Maximum
Output (MW) Share ()
Instantaneous 27131 726
Daily average 24210 613
Month average 20828 548
Year average 17930 460
Gas ndash Minimum
Output (MW) Share ()
Instantaneous 1556 49
Daily average 3071 95
Month average 6775 199
Year average 9159 246
Imports ndash Maximum
Output (MW) Share ()
Instantaneous 5827 191
Daily average 4985 155
Month average 3796 106
Year average 2850 86
Pumped storage ndash Maximum 2
Output (MW) Share ()
Instantaneous 2660 79
Daily average 409 12
Pumped storage ndash Minimum 2
Output (MW) Share ()
Instantaneous ndash2782 ndash108
Daily average ndash622 ndash17
Exports ndash Maximum
Output (MW) Share ()
Instantaneous minus3870 minus143
Daily average ndash2748 ndash79
Month average ndash1690 ndash39
Year average ndash731 ndash19
2 Note that Britain has no inter-seasonal electricity storage so we only report on half-hourly and daily records Elexon and National Grid only report the output of large pumped hydro storage plants The operation of battery flywheel and other storage sites is not publicly available
Drax Group plcDrax Power Station Selby North Yorkshire YO8 8PH
Imperial Consultants58 Princersquos Gate Exhibition Road London SW7 2PGwwwimperial-consultantscoukwwwdraxcomConsultImperialDraxGroup

Drax Electric Insights Quarterly ndash Q1 2021
14
Day ahead wholesale price
Maximum (poundMWh) Minimum (poundMWh)
Instantaneous 106327 ndash7284
Daily average 19745 ndash1135
Month average 7112 2203
Year average 5682 3388
Carbon intensity
Maximum (gkWh) Minimum (gkWh)
Instantaneous 704 18
Daily average 633 61
Month average 591 141
Year average 508 172
pound CO2
All fossil fuels ndash Maximum
Output (MW) Share ()
Instantaneous 49307 880
Daily average 43085 864
Month average 36466 812
Year average 29709 763
All fossil fuels ndash Minimum
Output (MW) Share ()
Instantaneous 2369 88
Daily average 3789 121
Month average 7382 278
Year average 11336 361
All low carbon ndash Maximum
Output (MW) Share ()
Instantaneous 32688 897
Daily average 27282 825
Month average 23276 654
Year average 17930 583
All low carbon ndash Minimum
Output (MW) Share ()
Instantaneous 3395 83
Daily average 5007 108
Month average 6885 167
Year average 8412 216
CO2 CO2
Nuclear ndash Maximum
Output (MW) Share ()
Instantaneous 9342 428
Daily average 9320 320
Month average 8649 265
Year average 7604 220
Nuclear ndash Minimum
Output (MW) Share ()
Instantaneous 2488 81
Daily average 2665 103
Month average 4232 129
Year average 5397 172
Coal ndash Maximum
Output (MW) Share ()
Instantaneous 26044 614
Daily average 24589 520
Month average 20746 480
Year average 15628 420
Coal ndash Minimum
Output (MW) Share ()
Instantaneous 0 00
Daily average 0 00
Month average 0 00
Year average 499 16
Drax Electric Insights Quarterly ndash Q1 2021
15
Gas ndash Maximum
Output (MW) Share ()
Instantaneous 27131 726
Daily average 24210 613
Month average 20828 548
Year average 17930 460
Gas ndash Minimum
Output (MW) Share ()
Instantaneous 1556 49
Daily average 3071 95
Month average 6775 199
Year average 9159 246
Imports ndash Maximum
Output (MW) Share ()
Instantaneous 5827 191
Daily average 4985 155
Month average 3796 106
Year average 2850 86
Pumped storage ndash Maximum 2
Output (MW) Share ()
Instantaneous 2660 79
Daily average 409 12
Pumped storage ndash Minimum 2
Output (MW) Share ()
Instantaneous ndash2782 ndash108
Daily average ndash622 ndash17
Exports ndash Maximum
Output (MW) Share ()
Instantaneous minus3870 minus143
Daily average ndash2748 ndash79
Month average ndash1690 ndash39
Year average ndash731 ndash19
2 Note that Britain has no inter-seasonal electricity storage so we only report on half-hourly and daily records Elexon and National Grid only report the output of large pumped hydro storage plants The operation of battery flywheel and other storage sites is not publicly available
Drax Group plcDrax Power Station Selby North Yorkshire YO8 8PH
Imperial Consultants58 Princersquos Gate Exhibition Road London SW7 2PGwwwimperial-consultantscoukwwwdraxcomConsultImperialDraxGroup
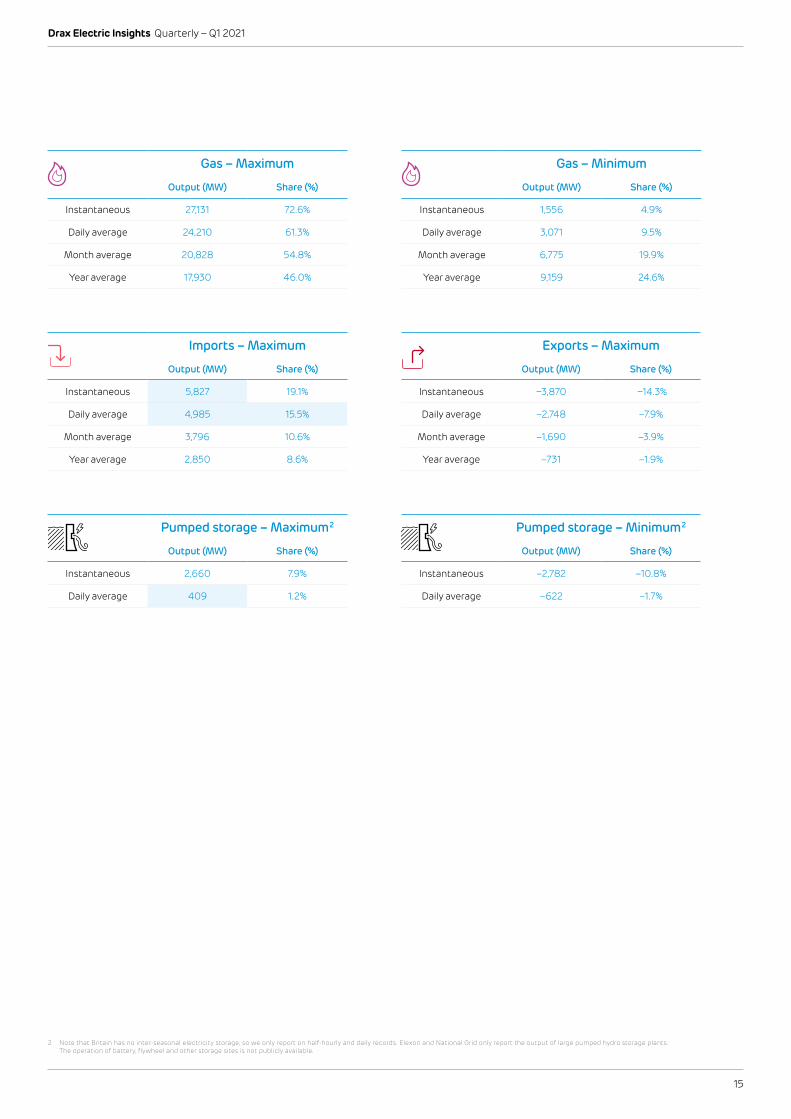
Drax Electric Insights Quarterly ndash Q1 2021
15
Gas ndash Maximum
Output (MW) Share ()
Instantaneous 27131 726
Daily average 24210 613
Month average 20828 548
Year average 17930 460
Gas ndash Minimum
Output (MW) Share ()
Instantaneous 1556 49
Daily average 3071 95
Month average 6775 199
Year average 9159 246
Imports ndash Maximum
Output (MW) Share ()
Instantaneous 5827 191
Daily average 4985 155
Month average 3796 106
Year average 2850 86
Pumped storage ndash Maximum 2
Output (MW) Share ()
Instantaneous 2660 79
Daily average 409 12
Pumped storage ndash Minimum 2
Output (MW) Share ()
Instantaneous ndash2782 ndash108
Daily average ndash622 ndash17
Exports ndash Maximum
Output (MW) Share ()
Instantaneous minus3870 minus143
Daily average ndash2748 ndash79
Month average ndash1690 ndash39
Year average ndash731 ndash19
2 Note that Britain has no inter-seasonal electricity storage so we only report on half-hourly and daily records Elexon and National Grid only report the output of large pumped hydro storage plants The operation of battery flywheel and other storage sites is not publicly available
Drax Group plcDrax Power Station Selby North Yorkshire YO8 8PH
Imperial Consultants58 Princersquos Gate Exhibition Road London SW7 2PGwwwimperial-consultantscoukwwwdraxcomConsultImperialDraxGroup

Drax Group plcDrax Power Station Selby North Yorkshire YO8 8PH
Imperial Consultants58 Princersquos Gate Exhibition Road London SW7 2PGwwwimperial-consultantscoukwwwdraxcomConsultImperialDraxGroup