Embed Size (px)
Citation preview
THIS REPORT CONTAINS ASSESSMENTS OF COMMODITY AND TRADE ISSUES MADE BY
USDA STAFF AND NOT NECESSARILY STATEMENTS OF OFFICIAL U.S. GOVERNMENT
POLICY
Date:
GAIN Report Number:
Approved By:
Prepared By:
Report Highlights:
FAS/Tokyo has revised data from marketing year (MY) 2014/15 to incorporate information for new
varieties of mandarin/tangerine and acidic citrus similar to lemons that are produced in Japan. The
trend of declining citrus acreage in Japan continued in marketing year (MY) 2015/16, decreasing 2
percent to 64,200 hectares. Production decreased 9 percent to approximately 1,100,000 MT in MY
2015/16 - largely due to unfavorable weather conditions during the growing season. Despite
FAS/Tokyo expectations that planted area will fall another two percent in MY 2016/17, improved
growing conditions have led FAS/Tokyo to forecast an increase in total citrus production in MY 2016
(up 5 percent to 1,157,000 MT given).
Dr. Tomohiro Kurai
Jess K. Paulson
2016 Japan Citrus Annual
Citrus Annual
Japan
JA6058
12/15/2016
Required Report - public distribution
Executive Summary:
FAS/Tokyo undertook a survey of varieties of citrus that have been unreported in the annual citrus
report until now. Accordingly, data in the PS&D reports now reflect, for example, new cultivars of
mandarin and tangerine (i.e., tangor and tangelo), cross-breeds, and traditional citrus that resemble
lemons (i.e., Yuzu).
Japan’s planted area and production of Unshu oranges have decreased continuously since their peak in
1975. This reduction is attributed to multiple factors such as Japanese agricultural policy, aging
Japanese farmers, the steady exit of farmers who have no successor, and conversions to more profitable
crops. Japanese agricultural policy has encouraged Unshu orange farmers, which account for
approximately 25 percent of domestic citrus production, to convert to other varieties of
mandarin/tangerine oranges.
The trend of declining acreage continued in MY 2015/16, decreasing 2 percent to 54,000 hectares (ha)
for Unshu oranges, and 2 percent to 64,200ha for citrus as a whole. Unshu production declined 11
percent to approximately 778,000 metric tons (MT) in MY 2015/16. Similarly, total citrus production
in Japan decreased 9 percent to approximately 1,100,000 MT during the same period. These reductions
were largely due to unfavorable weather conditions during the growing season. FAS/Tokyo estimates
that planted area decreased another 2 percent in MY 2016/17, but estimates Unshu orange and total
citrus production to improve 7 and 5 percent to 830,000 and 1,157,000 MT, respectively, due to
improved weather.
Japan remains one of the most important export markets for U.S. citrus. However, U.S. citrus has lost
some market share in recent years due to supply constraints, high prices, and competition from citrus
producers who enjoy beneficial tariff treatment under bilateral economic partnership agreements (EPAs)
(e.g., grapefruit).
Commodities:
Citrus, Other, Fresh
Lemons, Fresh
Orange Juice
Oranges, Fresh
Grapefruit, Fresh
Tangerines/Mandarins, Fresh

Tangerines/Mandarins
PS&D Table
Note: Beginning with this Annual, FAS/Tokyo has incorporated data for mandarin/tangerine-type
varieties (i.e., tangor and tangelo) to the PS&D data. The addition has resulted in significant changes to
some numbers compared to previous PS&Ds. Those changes are outlined in the narrative below.
Tangerines/Mandarins, Fresh 2014/2015 2015/2016 2016/2017 Market Begin Year Oct 2014 Oct 2015 Oct 2016
Japan USDA Official New Post USDA Official New Post USDA Official New Post
Area Planted 60900 0 60100 0 0 0
Area Harvested 58400 54900 57600 54000 0 53000
Bearing Trees 0 0 0 0 0 0
Non-Bearing Trees 0 0 0 0 0 0
Total No. Of Trees 0 0 0 0 0 0
Production 1070 1040 1115 933 0 994
Imports 12 12 15 17 0 25
Total Supply 1082 1052 1130 950 0 1019
Exports 3 3 3 3 0 3
Fresh Dom. Consumption 989 939 1037 860 0 916
For Processing 90 110 90 87 0 100
Total Distribution 1082 1052 1130 950 0 1019
(HECTARES) ,(1000 TREES) ,(1000 MT)
Production
Expanded Mandarin-variety Production
MY 2014/15 MY 2015/16 MY 2016/17
Variety
Planted
Area
(ha)
Production
(MT)
Planted
Area
(ha)
Production
(MT)
Planted
Area
(ha)
Production
(MT)
Unshu 42,900 874,700 42,200 777,800 41,500* 830,000*
Non-Unshu 12,000* 165,200* 11,800* 155,000* 11,500* 164,000*
Total Mandarin 54,900 1,039,900 54,000 932,800 53,000 994,000
Source: MAFF data for Unshu mikan
* FAS/Tokyo estimates for non-Unshu varieties.
Unshu Mikan
Japan’s mandarin/tangerine production has largely been comprised of Satsuma mandarin cultivation,
also known as “Unshu mikan” or “Unshu orange”. Unshu mikan production has been in a state of
general decline since 1975 when production peaked at 3.7 million MT. Despite improvements to yield,
Japan’s planted area for Unshu mikan has declined over the last 40 years. In fact, production today is
just 25 percent of what it was in 1975.

For marketing year (MY) 2015/16 (October to September), planted area for Unshu mikan was 42,200
ha, down 2 percent from the previous MY (please note the PS&D above reflects planted area for all
mandarin/tangerine varieties). Unshu oranges are often harvested on the south side of steep hills, which
provide for ideal growing conditions. However, it is extremely hard for aging Japanese farmers to
harvest in such locations, as mandarins are mostly harvested by hand. In addition, growers seeking
higher returns on their investments are substituting Unshu trees with different citrus varieties, including
non-Unshu mandarins (described further below). The steady exit of older farmers, decreasing
consumption of Unshu mikan, and the increased availability of other fruits (including new imported
varieties) have all contributed to the reduction in Unshu mikan acreage. Given that these factors are
likely to continue in the years to come, Post anticipates the planted area for Unshu mikan in Japan to
continue its steady decline at a rate of 2 percent annually, and estimates a planted area of 41,500 ha in
MY 2016/17.
The Japanese government issues a so-called “appropriate shipment quantity” in June of each year to
manage the annual Unshu orange production in an effort to keep production line with its annual Unshu
demand estimate. Following this guideline, each prefecture and region adjusts its production to meet the
government’s established production target. The Japanese government issues these guidelines to secure
farmers’ income by preventing a drop in market price as a result of overproduction. For MY 2016/17,
the Japanese government announced a production target of 890,000 MT for Unshu oranges. Of this
total, 800,000 MT are for fresh consumption and 90,000 MT are for processing.
However, the government’s production target assumes ideal growing conditions, and does not account
for potential factors that may increase or reduce production (such as climate and disease). In fact,

although the Unshu orange production target for MY 2015/16 was 900,000 MT, high temperatures and
heavy rains in November and December reduced production to only 777,800 MT, down 13 percent from
MY 2013/14, and 11 percent from MY 2014/15. For MY 2016/17, climate conditions were unfavorable
during fruit set in June and July, but improved for ripening in August which contributed to partial
growth recovery. Accordingly, FAS/Tokyo forecasts domestic Unshu orange production at 830,000 MT
– nearly 7 percent below the government production target.
Non-Unshu Varieties
Japanese government production policies until the mid-1970s encouraged Unshu mikan production.
However, by the mid-1970s, overproduction and a drop in the market price prompted the government to
adopt policies to discourage Unshu mikan production, and many farmers shifted production to new
citrus varieties such as tangors and tangelos. Further, with declining Unshu mikan consumption, the
Japanese citrus industry (together with national and prefectural research stations) began breeding
programs to develop new citrus late harvest varieties (between December and May and known as
“Chubankan”), a season when few traditional domestic fruits are available in market. Production of
Chubankan partially restored citrus production that was lost by the decline of Unshu orange production,
and accounted for 23 percent of domestic citrus production in MY 2015/16 (i.e., 260,000 MT).
MY 2015/16 production of mandarin/tangerine varieties was 933,000 MT, of which 17 percent (or
155,000 MT) are Chubankan. Of the numerous mandarin/tangerine Chubankan varieties, two have
stable production volumes - “Shiranui/Dekopon” and “Setoka”. Their volumes in MY 2015/16 were
50,000 MT for Shiranui and 6,000 MT for Setoka, and volumes for both are expected to increase for at
least the next few years. However, other Chubankan varieties are experiencing a steady decline in
production and consumption, similar to that of the Unshu mikan.
Although planted area decreased 2 percent to 53,000 ha, and weather conditions were unfavorable in
MY 2016/17, conditions were still better than they were last year. Consequently, FAS/Tokyo forecasts
improved production of mandarin/tangerine varieties overall in MY 2016/17 to 994,000 MT, a 7 percent
increase from MY 2015/16.
Consumption
Although current Unshu mikan production in Japan is just a quarter of what it was in 1975, Unshu is still
the third most popular fresh fruit with Japanese consumers after bananas and apples (on a volume basis).
Unshu mikan accounted for 15 percent of fresh fruit consumption in Japan in 2015, according to the
Ministry of Internal Affairs and Communications (MIC). Approximately 90 percent of Unshu
production in Japan is consumed fresh, with the remainder going to juice (7 percent) and canned fruit
production (3 percent).
The primary determinant of quality in the Japanese fruit market is sweetness. Sorting facilities for
mandarin oranges are all equipped with brix sensors and retailers display brix values at their points of
purchase. Yet, Japanese consumers are also very sensitive to market prices. The figure below illustrates
that Japan’s annual household consumption (two or more persons per household) of fresh Unshu mikan
was relatively unchanged over 3 years between MY 2011/12 to MY 2013/14. Although production did
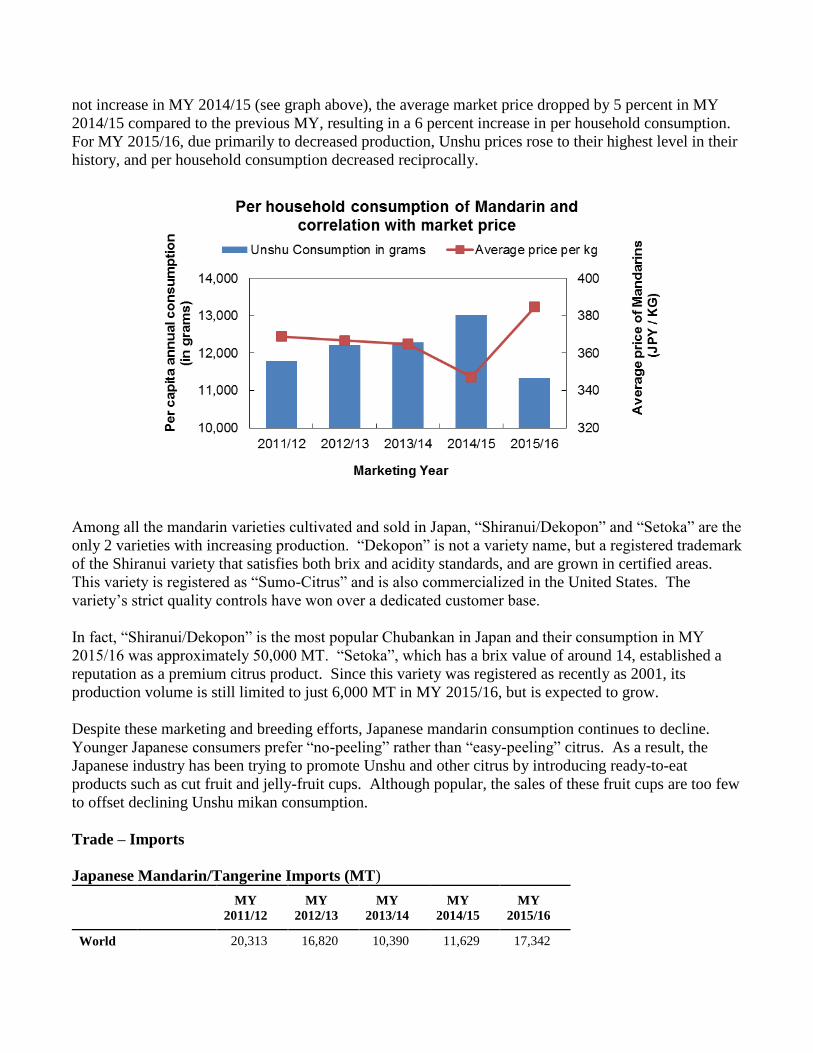
not increase in MY 2014/15 (see graph above), the average market price dropped by 5 percent in MY
2014/15 compared to the previous MY, resulting in a 6 percent increase in per household consumption.
For MY 2015/16, due primarily to decreased production, Unshu prices rose to their highest level in their
history, and per household consumption decreased reciprocally.
Among all the mandarin varieties cultivated and sold in Japan, “Shiranui/Dekopon” and “Setoka” are the
only 2 varieties with increasing production. “Dekopon” is not a variety name, but a registered trademark
of the Shiranui variety that satisfies both brix and acidity standards, and are grown in certified areas.
This variety is registered as “Sumo-Citrus” and is also commercialized in the United States. The
variety’s strict quality controls have won over a dedicated customer base.
In fact, “Shiranui/Dekopon” is the most popular Chubankan in Japan and their consumption in MY
2015/16 was approximately 50,000 MT. “Setoka”, which has a brix value of around 14, established a
reputation as a premium citrus product. Since this variety was registered as recently as 2001, its
production volume is still limited to just 6,000 MT in MY 2015/16, but is expected to grow.
Despite these marketing and breeding efforts, Japanese mandarin consumption continues to decline.
Younger Japanese consumers prefer “no-peeling” rather than “easy-peeling” citrus. As a result, the
Japanese industry has been trying to promote Unshu and other citrus by introducing ready-to-eat
products such as cut fruit and jelly-fruit cups. Although popular, the sales of these fruit cups are too few
to offset declining Unshu mikan consumption.
Trade – Imports
Japanese Mandarin/Tangerine Imports (MT)
MY
2011/12
MY
2012/13
MY
2013/14
MY
2014/15
MY
2015/16
World
20,313 16,820 10,390 11,629 17,342
United States 16,635 12,351 7,550 8,743 13,976
Market
Share: 82% 73% 73% 75% 81%
Australia 2,097 2,389 1,711 1,586 2,636
Others 249 1,318 432 551 420
Source: Global Trade Atlas
Poor domestic production has driven demand for imported citrus, and, in turn, U.S. clementine and
mandarin have developed a following in Japan. Higher yields in California corresponded with reduced
production in Japan, contributing to approximately 14,000 MT of imports from the United States, a 60
percent increase from the previous MY. Supported by competitive prices when compared to Australia,
the United States continued to be the largest supplier of mandarins to Japan, and increased its trade share
to 81 percent in MY2015/16. Although Japanese mandarin production is forecast to partially recover
from the previous MY, production remains lower than average for MY 2016/17. Considering USDA
estimates for higher production of mandarins/tangerines in California in MY 2016/17, FAS/Tokyo
expects imports from the United States to increase 7 percent to 15,000 MT.
CIF Price of Imported Mandarin/Tangerines (US$ / MT)
MY
2011/12
MY
2012/13
MY
2013/14
MY
2014/15
MY
2015/16
United States 1,324 1,563 1,561 1,576 1,528
Australia 1,990 1,574 1,993 1,564 1,673
Others 3,124 2,052 2,828 2,362 2,486
Source: Global Trade Atlas
Trade - Exports
Japanese Mandarin/Tangerine Exports (MT)
MY
2011/12
MY
2012/13
MY
2013/14
MY
2014/15
MY
2015/16
World 2,544 2,481 2,935 3,302 2,533
Canada 2,165 1,984 2,258 2,538 1,756
Hong Kong 127 216 213 300 340

Taiwan 130 118 230 190 237
Others 121 164 233 275 201
Source: Global Trade Atlas
Japanese exports of mandarins are small. Due to lower production of Unshu oranges, Japan exported
2,533 MT in MY2015/16, 23 percent less than in MY2014/15. The major export market remained
Canada (i.e., 1,756 MT), which accounting for 69 percent of Japanese exports, while the remainder were
exported to Asian countries. With robust global demand for mandarins/tangerines, and a concerted
effort by the Government of Japan, Japan continues to work to promote exports of Japanese mandarins
and other agricultural products overseas. However, as described above, Japanese Unshu production
remains lower than expected this MY. Therefore, Post expects Japanese exports of mandarins to
increase marginally to 3,000 MT in MY 2016/17.
Effective November 26, 2014, the United States removed certain restrictions on mandarin imports from
Japan. The major changes were 1) removing requirements for fruit to be grown in specified canker-free
export areas with buffer zones, and 2) removing requirements for joint inspection in groves and
packinghouses by MAFF and the USDA’s Animal and Plant Health Inspection Service. For further
information, please refer to the Federal Register notice.
These changes will make U.S. import regulations for mandarins from Japan consistent with U.S.
domestic regulations for the interstate movement of citrus fruit from areas quarantined due to citrus
canker. Despite these regulatory changes, Japanese export of mandarins to the United States has been
negligible. Therefore, FAS/Tokyo expects Japanese exports to the United States remain relatively
small.
Prices:
Japan: Fresh Unshu Orange Prices – Import, Wholesale, Retail
Import CIF Prices* Wholesale Prices** Retail Prices***
MY 2015/16 US $ / KG
MY 2015/16 JPY / KG
MY 2015/16 JPY / KG
October 2.87
October 198
October 530
November 0
November 245
November 503
December 2.69
December 277
December 536
January 2.57
January 313
January 659
February 1.54
February 336
February 747
March 1.58
March 403
March 877
April 1.51
April -
April -
May 1.72
May -
May -
June 1.83
June -
June -
July 1.51
July -
July -
August 1.66
August -
August -
September 1.99
September 231
September 632
Source: GTA
Source: MAFF
Source: MIC
* Import prices are average import CIF prices. ** Wholesale prices are average wholesale prices at the major wholesale markets. (Seikabutsu Ryutsu Tokei) *** Retail prices are average retail prices in the Metro Tokyo area.
Policy:
The U.S. approves Unshu orange imports from Fukuoka, Saga, Nagasaki, and Kumamoto
To prevent the introduction of the citrus fruit fly (Bactrocera tsuneonis), the U.S. prohibited Unshu
orange imports from Kyushu island of Japan. The government of the United States and Japan reached to
an agreement that Unshu oranges from Fukuoka, Saga, Nagasaki, and Kumamoto can be exported to the
United States on the condition of installing trapping systems as prescribed by USDA and the Japanese
Government’s Ministry of Agriculture, Forestry, and Fisheries.
The Japan-Mexico Economic Partnership Agreement (EPA):
The Japan-Mexico EPA has been in effect since April 1, 2005. Under this EPA, Mexican mandarins
were excluded from tariff reductions. As a result, imports of Mexican mandarins face Japan’s WTO
tariff rate of 17 percent.
The Japan-Australia Economic Partnership Agreement (EPA):
The Japan-Australia Economic Partnership Agreement has been in effect since January 15, 2015. Under
this EPA, the tariff on fresh Australian mandarins was 13.8 percent in Japanese fiscal year (JFY: April –
March) 2016. It will be reduced by equal rate every year until the tariff reaches zero in 2029.
General Import Duty:
Japan: Import Duties 2016
Tariff Code (HS) Description Duty Rate (%)*
0805.20-000 Fresh Mandarins (including tangerines), Clementines,
Wilkings, and similar citrus hybrid 17%
Source: Japan’s Customs Tariff Schedules for 2016
* all duties are charged on a CIF basis
Grapefruit

PS&D Table
Note: Beginning with this Annual, FAS/Tokyo has incorporated data for domestic pomelo varieties
(which share similar functionality to grapefruit) to the PS&D data. The addition has resulted in
significant changes to some numbers compared to previous PS&Ds. Those changes are outlined in the
narrative below.
Grapefruit, Fresh 2014/2015 2015/2016 2016/2017 Market Begin Year Oct 2014 Oct 2015 Oct 2016
Japan USDA Official New Post USDA Official New Post USDA Official New Post
Area Planted 0 0 0 0 0 0
Area Harvested 0 1180 0 1170 0 1160
Bearing Trees 0 0 0 0 0 0
Non-Bearing Trees 0 0 0 0 0 0
Total No. Of Trees 0 0 0 0 0 0
Production 0 26 0 25 0 24
Imports 100 100 90 82 0 78
Total Supply 100 126 90 107 0 102
Exports 0 0 0 0 0 0
Fresh Dom. Consumption 100 125 90 106 0 101
For Processing 0 1 0 1 0 1
Total Distribution 100 126 90 107 0 102
(HECTARES) ,(1000 TREES) ,(1000 MT)
Production
Japan has been producing unique domestic Pomelos for many years. Buntan and Kawachi-bankan are
two major citrus varieties grown in Japan that resemble grapefruit. In MY 2015/16, Japanese pomelo
production totaled 25,000 MT, with 1,170 ha of planted area; a 1 percent reduction of each from MY
2014/15. Similar to other citrus varieties, the planted area and production of these Pomelo varieties are
also steadily declining. Although there is a certain demand for these varieties, particularly from older
consumers, FAS/Tokyo estimates that the planted area and production of Japanese Pomelo varieties will
decline a 1 percent to 1,160 ha and a 4 percent to 24,000 MT, respectively, in MY 2016/17.
Consumption
Japanese consumption of fresh grapefruit was 106,000 MT in MY 2015/16, down 15 percent compared
to 125,000 MT in MY 2014/15. Consumption of grapefruit has been on a continuous decline since
2004, when annual household grapefruit consumption peaked at nearly 4,500 grams. Japanese annual
household consumption of MY 2015/16 was 1,285 grams, comparable to the previous MY of 1,289
grams. Previously observed declines in consumption had been consumer-oriented. For example,
grapefruit consumption is highest among older Japanese consumers, but they have increasingly shied
away from grapefruit due to reports of negative interactions between grapefruit and hypertension drugs.
However, the reduction in the current MY is market-oriented. Reduced production in major supplier
markets has resulted in tighter supplies (discussed further in the trade section). Although this lower
availability did not significantly impact retail prices, since production of grapefruits in Florida is also
expected to decrease in MY 2016/17, FAS/Tokyo estimates further reductions in Japanese grapefruit
consumption to 101,000 MT in MY 2016/17, a 5 percent reduction compared to MY 2015/16.

Japanese pomelo varieties are consumed fresh, similar to grapefruit. Thus, some varieties are referred to
as “Japanese grapefruits”. A particularly distinctive feature of Japanese pomelo varieties is their season.
Most varieties mature very late, with their season beginning in December and concluding in July -
limiting market competition with U.S. grapefruit. The development and production of Japanese pomelo
varieties is driven by demand for sour fruit when temperatures are high. However, as with grapefruit,
these varieties are also popular among Japan’s older consumers, and also reportedly has had some
interactions with certain hypertension drugs. As a result, this consumption is also on the decline.
Trade – Imports
All of Japan’s grapefruit consumption in 2015/16 was from imported fruit (82,000 MT). The United
States was the leading supplier of fresh grapefruit to Japan, accounting for 54 percent of total Japanese
imports. In MY 2015/16, the United States supplied 44,000 MT of grapefruit, a 15 percent reduction
from the previous year. This decline is attributed to reduced production in Florida, which accounts for
roughly 85 percent of U.S. grapefruit shipments to Japan. Multiple factors, including citrus greening
disease, have reduced Florida production, and subsequent exports to Japan. The Florida Department of
Citrus has estimated a further 11 percent reduction in production for MY 2016/17. California and Texas
also supply grapefruit from the United States, accounting for 10 and 5 percent of U.S. grapefruit
shipments to Japan, respectively. Nonetheless, given this decrease in productions in Florida (which has
accounted for the majority of U.S. exports), FAS/Tokyo anticipates that Japanese imports of U.S.
grapefruit will decrease by another 10 percent in MY 2016/17.
Japanese Grapefruit Imports
MY
2011/12
MY
2012/13
MY
2013/14
MY
2014/15
MY
2015/16
World
149,145 133,682 109,491 99,776 81,838
United States 96,438 78,580 60,022 51,899 44,032
Market Share: 65% 59% 55% 52% 54%
South Africa 47,748 50,457 46,488 43,973 30,634
Israel
2,850 3,120 2,646 1,501 2,937
Turkey
1,639 1,520 333 2,185 1,684
Mexico
42 0 0 200 1,783
Australia 386 0 0 9 643
Others 42 5 2 9 125
Source: Global Trade Atlas
South Africa is the second largest exporter of grapefruit to Japan, accounting for 37 percent of Japan’s
total imports. MY 2015/16 grapefruit production in South Africa was also reduced due to drought and
hail in major production regions. MY 2015/16 was also an “off year”, resulting in an additional 30
percent reduction in exports (i.e., 30,000 MT). South Africa is again reportedly experiencing drought,
reducing grapefruit production below MY 2015/16 levels. South Africa is, however, expected to
prioritize exports, maintaining levels similar to the previous year. Post therefore expects imports from
South Africa to remain at 30,000 MT for MY 2016/17.
U.S. and South African grapefruit do not compete much due to northern/southern hemisphere seasons.
However, Israel and Mexico can be potential competitors. Although imports from Israel decreased in
MY 2014/15 due to quality issue, it recovered in MY 2015/16, and may grow in MY 2016/17. Mexico
increased its trade share in MY 2015/16 due to the Japan-Mexico EPA. In MY 2015/16, Mexico
exported 1,700 MT to Japan, an 800 percent increase from the previous year. According to industry
sources, Mexican grapefruit quality and supplies vary year by year.
Given reductions in U.S. grapefruit production, though Japanese grapefruit imports are expected to
increase from Mexico (which benefits from a bilateral trade agreement), FAS/Tokyo forecasts Japanese
grapefruit imports will decrease five percent in MY 2016/17 to 78,000 MT.
Trade – Exports
Japan does not export grapefruit.
Price:
Japan: 2015/16 Fresh Grapefruit Prices – Import, Wholesale, Retail
Import CIF Prices Wholesale Prices Retail Prices
MY 2015/16 US $ / KG
MY 2015/16 JPY / KG
MY 2015/16 JPY / KG
October 0.96
October 124
October 301
November 1.43
November 156
November 328
December 1.35
December 229
December 453
January 1.38
January 229
January 478
February 1.38
February 226
February 473
March 1.35
March 214
March 429
April 1.34
April 212
April 404
May 1.26
May 205
May 439
June 1.03
June 194
June 437
July 1.02
July 181
July 359
August 1.06
August 176
August 351

September 1.15
September 171
September 342
Source: GTA
Source: MAFF
Source: MIC
* Import prices are average import CIF prices. ** Wholesale prices are average wholesale prices at the major wholesale markets. (Seikabutsu Ryutsu Tokei) *** Retail prices are average retail prices in the Metro Tokyo area.
Policy
The Japan-Mexico Economic Partnership Agreement (EPA)
The Japan-Mexico EPA has been in effect since April 1, 2005. On April 1, 2011, Japanese duties on
Mexican grapefruit were fully eliminated. Tariff concessions under the Japan/Mexico EPA agreement
can be found at the following website: http://www.mofa.go.jp/region/latin/mexico/agreement/index.html
The Japan-Australia Economic Partnership Agreement (EPA)
The Japan-Australia EPA has been in effect since January 15, 2015. Under this EPA, the tariff on fresh
Australian grapefruit is 5.0 percent in JFY2016 (i.e., April 1 to March 31).
Import Duties:
Japan: Import Duties 2016
Tariff Code (HS) Description Duty Rate (%)*
0805.40-000 Fresh Grapefruit 10%
Source: Japan’s Customs Tariff Schedules for 2016 as of June 07, 2016 (latest as of Dec 15, 2016)
* all duties are charged on a CIF basis
Orange
PS&D Table
Oranges, Fresh 2014/2015 2015/2016 2016/2017 Market Begin Year Oct 2014 Oct 2015 Oct 2016
Japan USDA Official New Post USDA Official New Post USDA Official New Post
Area Planted 0 0 0 0 0 0
Area Harvested 420 470 400 450 0 440
Bearing Trees 0 0 0 0 0 0
Non-Bearing Trees 0 0 0 0 0 0
Total No. Of Trees 0 0 0 0 0 0
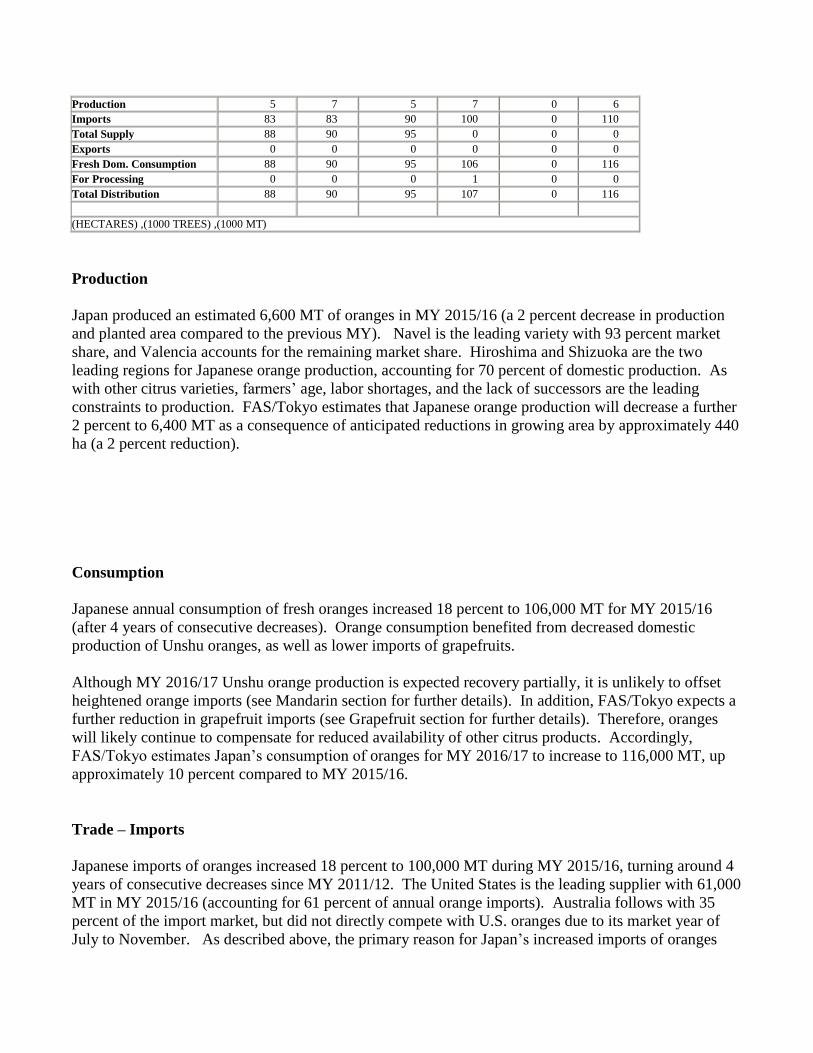
Production 5 7 5 7 0 6
Imports 83 83 90 100 0 110
Total Supply 88 90 95 0 0 0
Exports 0 0 0 0 0 0
Fresh Dom. Consumption 88 90 95 106 0 116
For Processing 0 0 0 1 0 0
Total Distribution 88 90 95 107 0 116
(HECTARES) ,(1000 TREES) ,(1000 MT)
Production
Japan produced an estimated 6,600 MT of oranges in MY 2015/16 (a 2 percent decrease in production
and planted area compared to the previous MY). Navel is the leading variety with 93 percent market
share, and Valencia accounts for the remaining market share. Hiroshima and Shizuoka are the two
leading regions for Japanese orange production, accounting for 70 percent of domestic production. As
with other citrus varieties, farmers’ age, labor shortages, and the lack of successors are the leading
constraints to production. FAS/Tokyo estimates that Japanese orange production will decrease a further
2 percent to 6,400 MT as a consequence of anticipated reductions in growing area by approximately 440
ha (a 2 percent reduction).
Consumption
Japanese annual consumption of fresh oranges increased 18 percent to 106,000 MT for MY 2015/16
(after 4 years of consecutive decreases). Orange consumption benefited from decreased domestic
production of Unshu oranges, as well as lower imports of grapefruits.
Although MY 2016/17 Unshu orange production is expected recovery partially, it is unlikely to offset
heightened orange imports (see Mandarin section for further details). In addition, FAS/Tokyo expects a
further reduction in grapefruit imports (see Grapefruit section for further details). Therefore, oranges
will likely continue to compensate for reduced availability of other citrus products. Accordingly,
FAS/Tokyo estimates Japan’s consumption of oranges for MY 2016/17 to increase to 116,000 MT, up
approximately 10 percent compared to MY 2015/16.
Trade – Imports
Japanese imports of oranges increased 18 percent to 100,000 MT during MY 2015/16, turning around 4
years of consecutive decreases since MY 2011/12. The United States is the leading supplier with 61,000
MT in MY 2015/16 (accounting for 61 percent of annual orange imports). Australia follows with 35
percent of the import market, but did not directly compete with U.S. oranges due to its market year of
July to November. As described above, the primary reason for Japan’s increased imports of oranges

was the reduced availability of Unshu oranges and grapefruit in Japanese markets. Corresponding to the
reduced production of domestic Unshu oranges, retailers started importing oranges earlier (i.e., from late
January). Reduced imports of grapefruit further encouraged heightened imports of U.S. oranges
throughout the MY.
Furthermore, reduced CIF prices in MY 2015/16 compared to the previous MY helped lead to an
increase in U.S. orange exports to Japan. Supported by strong yields in California, from which Japan
imports 100 percent of U.S. oranges, CIF prices for U.S. oranges fell slightly in MY 2015/16, whereas
CIF prices of other major suppliers increased. This reduced price gap, coupled with a well-established
reputation for U.S. oranges, attracted Japanese retailers.
Given declining domestic Unshu production, coupled with anticipated reductions in grapefruit imports,
FAS/Tokyo forecasts Japan’s total imports of oranges for MY 2016/17 to further increase to 110,000
MT, up 10 percent compared to MY 2015/16.
Prices:
Japan: Fresh Orange Prices – Import, Wholesale, Retail
Import CIF Prices* Wholesale Prices** Retail Prices***
MY 2015/16 US $ / KG
MY 2015/16 JPY / KG
MY 2015/16 JPY / KG
October 1.08
October 178
October 449
November 0.99
November 177
November 449
December 1.33
December 197
December 451
January 1.41
January 222
January 483
February 1.36
February 259
February 495
March 1.28
March 259
March 477
April 1.28
April 262
April 478
May 1.30
May 252
May 469
June 1.28
June 241
June 479
July 1.24
July 217
July 468
August 1.26
August 196
August 450
September 1.25
September 178
September 441
Source: GTA
Source: MAFF
Source: MIC
* Import prices are average import CIF prices. ** Wholesale prices are average wholesale prices at the major wholesale markets. (Seikabutsu Ryutsu Tokei) *** Retail prices are average retail prices in the Metro Tokyo area.

Policy:
The Japan-Mexico Economic Partnership Agreement (EPA):
The Japan-Mexico EPA has been in effect since April 1, 2005. Under this agreement, various Mexican
agricultural products, including fresh oranges, enter Japan at a reduced import duty. In MY2011/12,
Japan and Mexico renegotiated tariff concessions granted under the EPA. In the case of Mexican
oranges, Japan increased the in-quota volume and extended tariff reductions to Mexico’s seasonal
preferential tariff-quota. In-quota imports of Mexican oranges (up to 4,100 MT) receive a tariff of 5.0
percent when imported between June 1 and November 30, and a tariff of 10.0 percent when imported
from December 1 to May 31. Out-of-quota imports of Mexican oranges face the WTO tariff rates
shown below. Since the majority of Mexican orange exports are traditionally shipped to nearby
markets, Japan imported only 330 MT (0.3 percent of total imports) of fresh oranges from Mexico in
MY 2015/16. The Japan-Mexico EPA agreement can be found at the following website:
http://www.mofa.go.jp/region/latin/mexico/agreement/index.html
The Japan-Australia Economic Partnership Agreement (EPA):
The Japan-Australia Economic Partnership Agreement has been in effect since January 15, 2015. Under
this EPA, the tariff on fresh Australian oranges imported between June 1st and September 30 is 11.6
percent in JFY 2016 (i.e., April 1 to March 31).
Import Duties:
Japan: Import Duties 2015
Tariff Code (HS) Description
Duty Rate (%)*
0805.10-000 Fresh oranges, imports between December 1 - May 31 32%
Fresh oranges, imports between June1 - November 30 16%
Source: Customs Tariff Schedules of Japan as of June 07, 2016 (latest as of Dec 15, 2016)
* all duties are charged on a CIF basis
Orange Juice
PS&D Table
Orange Juice 2014/2015 2015/2016 2016/2017 Market Begin Year Oct 2014 Oct 2015 Oct 2016
Japan USDA Official New Post USDA Official New Post USDA Official New Post
Deliv. To Processors 0 0 0 0 0 0
Beginning Stocks 10672 10672 17182 17524 0 12667
Production 0 0 0 0 0 0
Imports 74010 86352 65000 73413 0 80000
Total Supply 84682 97024 82182 90667 0 92667
Exports 0 0 0 0 0 0

Domestic Consumption 67500 79500 67000 78000 0 77500
Ending Stocks 17182 17524 15182 12667 0 15167
Total Distribution 84682 97024 82182 90667 0 92667
(MT)
* Production, Consumption, and Stocks measured in metric tons at a 65 Brix equivalent.
Production
Japan’s production of orange juice is marginal. Rather, Japan produces Unshu-based orange juice, often
referred to as mikan juice. Japan has few Unshu orchards designated specifically for juice production.
Rather, low quality Unshu mikan that are unsuitable for fresh consumption are diverted for juice
processing. For MY 2015/16, 65,000 MT of Unshu oranges were processed for juice, resulting in
approximately 6,000 MT at a 65 Brix equivalent. Unfavorable weather conditions during the 2016
growing season are likely to increase the volume of low quality Unshu oranges in MY 2016/17, which
will offset the reduction of Unshu acreage and production in Japan. Therefore, FAS/Tokyo forecasts
Japanese Unshu-based orange juice production to remain the same at 6,000 MT (at a 65 Brix equivalent)
for MY 2016/17.
Consumption
According to leading juice manufacturing companies in Japan, total Japanese consumption of fruit juice-
based beverages has been declining steadily since its peak in 2013. 100 percent orange juice and 100
percent mixed juice blends make up 30 percent of the market. The remaining 40 percent is comprised of
orange juice-based beverages. This category consists of both carbonated and non-carbonated juice, and
various fruit beverages that contain less than 100 percent juice.
Japanese consumption of 100 percent juice is declining because of consumer concerns related to its
sugar content and calories. Furthermore, many retailers increased the retail price of 100 percent orange
juice by 13 percent during MY 2015/16 -- a result of reduced orange production in Brazil and the related
increase in average Frozen Concentrated Orange Juice (FCOJ) prices. Carbonated orange juice-based
beverages are the only category with increased consumption in Japan, and it is expected to continue to
grow in MY 2016/17. However, the percentage of orange juice in carbonated drinks is generally low
(i.e., below 5 percent). Accordingly, these beverages do not contribute to higher consumption rates of
orange juice. As the low-calorie beverage trend continues in MY 2016/17, and therefore FAS/Tokyo
expects domestic consumption will decrease 500 MT, a 1 percent decrease compared to MY 2015/16.
Trade
In MY2015/16, Japan’s total imports of orange juice decreased 15 percent from the previous year to
73,143 MT (on a 65 Brix equivalent). This decline is attributed to large purchases made during MY

2014/15 when the price of Brazilian orange juice concentrate was low. Brazil is the largest supplier of
orange juice to Japan, accounting for about 70 percent of Japan’s total orange juice imports. In
MY2015/16, Japan’s import of U.S. orange juice was 480 MT on a 65 Brix basis; a 13 percent increase
from the previous year (423 MT), but accounting for only 0.7 percent of total Japanese imports.
Japan’s imports of Mexican orange juice has been growing dramatically since the implementation of the
Mexico-Japan economic partnership agreement (EPA) in 2005, under which Mexico continues to enjoy
a significant advantage over other FCOJ suppliers (see policy section). Mexican exports of FCOJ to
Japan recovered by 11 percent in MY2015/16 due to reduced supplies of Brazilian orange juice.
Another alternative source to Brazilian orange juice was Spain, whose exports increased 37 percent in
MY 2015/16.
Although relatively high world orange juice prices are expected to continue in MY 2016/17, if Brazilian
orange production is restored to its historically average level, orange juice prices are expected to
decrease. Furthermore, higher prices have depleted Japanese stocks, and lower prices are expected to
encourage Japan to increase imports to replenish them. FAS/Tokyo therefore estimates total Japanese
imports of orange juice to increase 9 percent to 80,000 MT (on a 65 Brix equivalent) in MY 2016/17.
Japanese Orange Juice Imports (MT at a 65 Brix equivalent)
MY
2013/14
MY
2014/15
MY
2015/16
World
76,374 86,352 73,143
United States 577 423 480
Market Share: 0.8% 0.5% 0.7%
Brazil
50,682 62,248 49,481
Mexico
8,630 7,831 8,675
Israel
10,948 9,319 6,954
Spain
378 2,409 3,279
Italy
2,775 2,826 2,627
Uruguay
444 400 526
Costa Rica
458 290 242
Australia
180 152 203
Others 1,301 455 675
Source: Global Trade Atlas
* Imports of orange juice are the sum of imports for HS codes; 2009.11, 2009.12, and 2009.19.
** Global Trade Atlas provides Japanese import statistics for orange juice in kiloliters only. Hence, the
following factors are used to convert from kiloliters to metric tons at a 65 Brix equivalent: for
concentrated orange juice 2009.11 (frozen) and 2009.19 (non-frozen), kiloliter is multiplied by 1.3154
to get metric ton, and for single strength orange juice 2009.12, kiloliter is multiplied by 0.1897 to get
metric ton at a 65 Brix equivalent.
Prices:
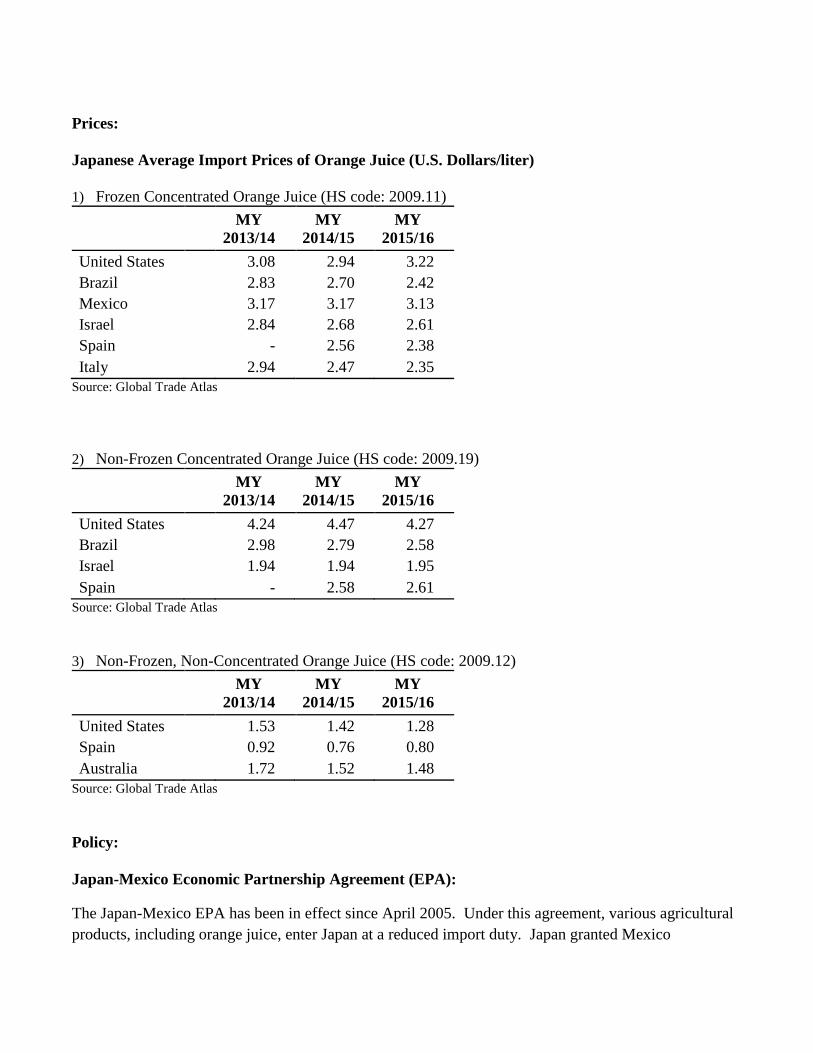
Japanese Average Import Prices of Orange Juice (U.S. Dollars/liter)
1) Frozen Concentrated Orange Juice (HS code: 2009.11)
MY
2013/14
MY
2014/15
MY
2015/16
United States 3.08 2.94 3.22
Brazil
2.83 2.70 2.42
Mexico
3.17 3.17 3.13
Israel
2.84 2.68 2.61
Spain
- 2.56 2.38
Italy 2.94 2.47 2.35
Source: Global Trade Atlas
2) Non-Frozen Concentrated Orange Juice (HS code: 2009.19)
MY
2013/14
MY
2014/15
MY
2015/16
United States 4.24 4.47 4.27
Brazil
2.98 2.79 2.58
Israel
1.94 1.94 1.95
Spain - 2.58 2.61
Source: Global Trade Atlas
3) Non-Frozen, Non-Concentrated Orange Juice (HS code: 2009.12)
MY
2013/14
MY
2014/15
MY
2015/16
United States 1.53 1.42 1.28
Spain
0.92 0.76 0.80
Australia 1.72 1.52 1.48
Source: Global Trade Atlas
Policy:
Japan-Mexico Economic Partnership Agreement (EPA):
The Japan-Mexico EPA has been in effect since April 2005. Under this agreement, various agricultural
products, including orange juice, enter Japan at a reduced import duty. Japan granted Mexico

preferential tariff-quotas on all orange juice line items with in-quota duties reduced by half. As a result,
Mexico has continued to enjoy a preferential tariff-quota since the first year of the EPA’s
implementation.
In MY2011/12, Japan and Mexico renegotiated tariff concessions granted under the 2005 EPA. As a
result, Japan extended the quota provisions and accelerated tariff reductions for Mexican orange juice,
beginning in April 2012. Depending on the tariff code, the in-quota tariff rate will be lowered to either:
1) 5.3 percent; 2) 6.3 percent; or 3) whichever is the greater of 7.4 percent or 5.7 yen per kilogram. The
quota for Mexican FCOJ (HS 2009.11 and 2009.19) is set in Japanese Fiscal Year (JFY, April - March)
2016 at 7,000 MT. The quota for orange juice other than FCOJ (HS 2009.12) set at 5,000 MT in
JFY2016.
As shown in the chart below, depending on the tariff code, out-of-quota imports of Mexican orange
juice face the WTO tariff rate of either: 1) 21.3 percent; 2) 25.5 percent; or 3) whichever is greater of
29.8 percent or 23 yen per kilogram.
Tariff concessions under the Japan-Mexico EPA agreement can be found at the following website:
http://www.mofa.go.jp/region/latin/mexico/agreement/index.html
The Japan-Australia Economic Partnership Agreement (EPA):
The Japan-Australia Economic Partnership Agreement has been in effect since January 15, 2015. Under
this EPA, Japan granted Australia preferential tariff quotas on all orange juice line items with reduced
tariffs. For JPY 2016, the annual quota is set at 1,300 MT and in-quota tariff rates are set below.
Import Duties (Orange Juice):
Japan: Import Duties 2016
Tariff
Code (HS) Description
WTO EPA EPA
Duty Rate (%)* Mexico Rate (%)* Australia Rate (%)*
2009.11-
110
Orange juice, frozen, containing added sugar,
not more than 10% by weight of sucrose,
naturally and artificially contained
25.5% 6.3% 12.8%
2009.11-
190
Orange juice, frozen, containing added sugar,
other
29.8% or 23
yen/kg, whichever
is the greater
7.4% or
5.7yen/kg,
whichever is the
greater
14.9% or
11.5yen/kg,
whichever is the
greater
2009.11-
210
Orange juice, frozen, not containing added
sugar, not more than 10% by weight of sucrose 21.3% 5.3% 10.7%

2009.11-
290
Orange juice, frozen, not containing added
sugar, other 25.5% 6.3% 12.8%
2009.12-
110
Orange juice, not frozen, of a Brix value not
exceeding 20, containing added sugar, not
more than 10% by weight of sucrose, naturally
and artificially contained
25.5% 6.3% 12.8%
2009.12-
190
Orange juice, not frozen, of a Brix value not
exceeding 20, containing added sugar, other
29.8% or 23
yen/kg, whichever
is the greater
7.4% or 5.7
yen/kg, whichever
is the greater
14.9% or
11.5yen/kg,
whichever is the
greater
2009.12-
210
Orange juice, not frozen, of a Brix value not
exceeding 20, not containing added sugar, not
more than 10% by weight of sucrose
21.3% 5.3% 10.7%
2009.12-
290
Orange juice, not frozen, of a Brix value not
exceeding 20, not containing added sugar,
other
25.5% 6.3% 12.8%
2009.19-
110
Orange juice, other, containing added sugar,
not more than 10% by weight of sucrose,
naturally and artificially contained
25.5% 6.3% 12.8%
2009.19-
190
Orange juice, other, containing added sugar,
other
29.8% or 23
yen/kg, whichever
is the greater
7.4% or 5.7
yen/kg, whichever
is the greater
14.9% or
11.5yen/kg,
whichever is the
greater
2009.19-
210
Orange juice, other, not containing added
sugar, not more than 10% by weight of sucrose 21.3% 5.3% 10.7%
2009.19-
290
Orange juice, other, not containing added
sugar, other 25.5% 6.3% 12.8%
Source: Customs Tariff Schedules of Japan as of June 07, 2016 (latest as of Dec 15, 2016)
* all duties are charged on a CIF basis
Lemon and Lime
PS&D Table
Note: Beginning with this Annual, FAS/Tokyo has incorporated data for domestic citrus varieties with
similar functionality to lemons and limes to the PS&D data. The addition has resulted in significant
changes to some numbers compared to previous PS&Ds. Those changes are outlined in the narrative
below.
Lemons/Limes, Fresh 2014/2015 2015/2016 2016/2017 Market Begin Year Oct 2014 Oct 2015 Oct 2016
Japan USDA Official New Post USDA Official New Post USDA Official New Post
Area Planted 0 0 0 0 0 0
Area Harvested 500 4400 500 4500 0 4600
Bearing Trees 0 0 0 0 0 0
Non-Bearing Trees 0 0 0 0 0 0
Total No. Of Trees 0 0 0 0 0 0

Production 10 51 10 52 0 53
Imports 51 51 50 51 0 52
Total Supply 61 102 60 103 0 105
Exports 0 0 0 0 0 0
Fresh Dom. Consumption 58 75 57 74 0 74
For Processing 3 27 3 29 0 31
Total Distribution 61 102 60 103 0 105
(HECTARES) ,(1000 TREES) ,(1000 MT)
Production
The harvested area and production of lemons and other flavorful acidic citrus varieties have grown
steadily over recent decades in Japan. The increase in acidic citrus contrasts with the continuous decline
observed for other major citrus products, such as Unshu mandarins and navel oranges. Strong consumer
preferences for local lemons, which consumers believe have lower chemical residues compared to
imports, is driving local growth. This consumer preference became particularly strong when media
coverage popularized a trend in pickling lemon peels. This trend created negative impressions toward
imported lemons, which are required to label the post-harvest treatment of fungicides. Japanese citrus
frequently apply the same chemicals, but are not required to label their use as fungicides are applied pre-
harvest – a key legal distinction in Japan.
Hiroshima prefecture, located 450 miles west of Tokyo, is the largest domestic producer of lemons with
approximately 6,500 MT in 2015, and accounting for 60 percent of domestic lemon production.
Regions within Hiroshima, such as the town of Setoda, which produce 30 percent of Japan’s lemons,
market their lemons as premium “Eco-lemon”. Eco-lemon is defined as production with reduced use of
agrochemicals and synthetic fertilizers. Given this consumer preference and steady demand of domestic
lemons, FAS/Tokyo estimates Japan’s lemon harvest area to remain at 500 hectares, with production
volumes increasing slightly to 10,500 MT in MY 2016/17.
Besides lemons, Japan grows many other types of citrus whose consumption is functionally similar to
lemon and lime. Major local varieties are “Yuzu” (Citrus junos), “Kabosu” (Citrus sphaerocarpa), and
“Sudachi” (Citrus sudachi), of which Yuzu has the largest planted area and production. Similar to
lemons, Yuzu production has been steadily increasing and was approximately 24,000 MT in 2015 --
approximately double the level 20 years ago. Yuzu fruit are about 100-120 grams and produce in two
seasons, between July to August and October to December. Summer Yuzu is green in color and is
mainly used for seasoning in mixtures with chili peppers. Winter Yuzu is yellow and is used for
multiple purposes including seasoning. Although the functionality of Yuzu is similar to lemon, Japanese
consumers treat them as distinct flavors and scents.
Both Sudachi and Kabosu are used like limes in Japan, and are harvested when they are immature and
green to maximize their scent and flavor. Sudachi is 25-50 grams and Japan produced about 5,000 MT
in 2015 at a gradual decline of 2-5 percent annually. Kabosu is slightly larger in size compared to
Sudachi at 100-150 grams. Domestic production of Kabosu was approximately 5,500 MT in 2015.
Cultivation and distribution of Sudachi and Kabosu are limited to specific regions in Japan, limiting
their competiveness with lime in the Japanese market.

Given these unique citrus varieties, overall Japanese production of lemons and other flavorful acidic
citrus totaled 52,000 MT in MY 2015/16. FAS/Tokyo anticipates consumer preference for domestic
lemons and citrus similar to lemon to grow steadily, and as a consequence of acreage expansion by 2
percent, overall production will increase by 2 percent to 53,000 MT in MY 2016/17.
Consumption
Fresh lemons, as well as other unique lemon-like citrus in Japan, are largely consumed in the food sector
as a garnish or as a seasoning agent in food, beverages, and as an ingredient in salad dressings. For MY
2015/16, Japan’s total consumption of lemons was 61,000 MT (of which 10,500 MT was from domestic
production). However, the total consumption for all flavor-adding, acidic citrus varieties was 103,000
MT (of which 74,000 MT was consumed fresh and 29,000 were processed). As introduced above,
domestic lemon producers have been benefited from consumers’ perception of food safety due to the
lack of agrochemical names on their product labels. The Japanese Government regards agrochemicals
that are applied post-harvest as food additives, and Japan’s labeling legislation requires their display at
the point-of-sale. As Japanese farmers apply the same chemicals pre-harvest, domestic produce are not
required to display the agrochemical names at the point-of-sale, despite containing similar chemical
residues.
The leading use for domestic varieties of acidic citrus is for a wide range of processed products such as
salad dressing, yuzu teas using peeled skins, comfitures, liqueur, and miso. In MY 2015/16, nearly 70
percent of domestic variety production (excluding lemons) was used for processing.
Another common use of Yuzu, lemon and lime is in citrus flavored alcoholic beverages known as
“lemon sour” or “lemon chuhai”. Reduced lemon production in 2011 contributed to a marketing
campaign that popularized whiskey-soda beverages. According to sources, lemon-based cocktails have
nearly a third of the alcoholic beverage market share in Japan, and sales are growing again. Industry has
observed a 2-3 percent increase in lemon consumption associated with increased sales of lemon-based
cocktails. Although lemon prices remain relatively high, members of Japan’s alcoholic beverage
industry anticipate further growth of lemon-based cocktails, and therefore of lemons.
Considering these trends, Post estimates that Japan’s MY 2016/17 lemon consumption will be 62,000
MT, with domestic market share accounting for 17 percent at 10,500 MT. Total flavorful, acidic citrus
consumption is forecast at 105,000 MT, including lemon, lime, and Japanese varieties such as Yuzu.
Trade – Imports
Japanese Lemon Imports (MT)
MY
2012/13
MY
2013/14
MY
2014/15
MY
2015/16
World
48,895 49,123 49,323 48,734
United States 34,806 32,916 30,519 29,462
Market Share: 71% 67% 62% 60%

Chile
12,164 14,376 16,724 17,641
Others 1,925 1,832 2,081 1,631
Source: Global Trade Atlas
Although total lemon imports decreased by 1 percent in MY 2015/16, FAS/Tokyo anticipates an
increase in lemon consumption and hence imports in MY2016/17. FAS/Tokyo estimates a 2 percent
increase in the import of fresh lemons to 49,000 MT.
The United States is the largest supplier of fresh lemons to Japan, with a market share of about 60
percent of imports. In MY 2015/16, imports of U.S. fresh lemons decreased about 3 percent to 29,500
MT as U.S domestic demand increased and prices for U.S. fresh lemons were high. Although the good
reputation of the U.S. lemons continues to attract Japanese traders and consumers, FAS/Tokyo
anticipates continued tight supplies and high prices in MY 2016/17. Therefore, Post estimates fresh
lemon imports from the U.S. to Japan to decline a further 3 percent to 28,500 MT in MY 2016/17.
Chile is the second largest supplier of fresh lemons to Japan with 36 percent of the market share,
approximately 17,500 MT in MY 2016/17. Chile supplies fresh lemons between June and October,
when U.S. lemons are generally unavailable. Fresh lemons from Chile also compensated for the
decrease in U.S. supplies in MY 2015/16, increasing their market share by five percent from the
previous MY. In addition, Chilean lemons have benefited from lower prices compared to U.S. fresh
lemons. FAS/Tokyo expects Japanese traders to further increase imports from Chile by 10 percent to
19,500 MT in MY 2016/17.
Mexico has the highest market share of limes with 2,200 MT of exports to Japan in MY 2015/16. This
quantity has been stable over several years, and FAS/Tokyo anticipates that Japan will continue to
import the same level of limes for MY 2016/17 as well.
Trade – Exports
Japan does not export any fresh lemons or limes. There is demand for Yuzu in Southeast Asia and
Europe. Japan began exporting Yuzu to France in 2012, but the quantity was limited due to plant
protection and quarantine issues.
Prices:
Japan: Fresh Lemon and Lime Prices – Import, Wholesale, Retail
Import CIF Prices Wholesale Prices Retail Prices
MY 2015/16 US $ / KG
MY 2015/16 JPY / KG
MY 2015/16 JPY / KG
October 1.81
October 283
October 785
November 2.49
November 265
November 778
December 2.32
December 314
December 706
January 2.21
January 334
January 698
February 2.15
February 322
February 701
March 2.07
March 297
March 671
April 2.17
April 306
April 685
May 2.30
May 319
May 726

June 2.13
June 323
June 698
July 1.76
July 318
July 707
August 1.66
August 299
August 698
September 1.64
September 267
September 734
Source: GTA
Source: MAFF
Source: MIC
* Import prices are average import CIF prices. ** Wholesale prices are average wholesale prices at the major wholesale markets. (Seikabutsu Ryutsu Tokei) *** Retail prices are average retail prices in the Metro Tokyo area.
Policy:
No major changes occurred during the reported marketing year.
Import Duties:
Japan: Import Duties 2016
Tariff Code (HS) Description Duty Rate (%)*
0805.50-010 Fresh Lemon Free
Source: Customs Tariff Schedules of Japan as of June 07, 2016 (latest as of Dec 15, 2016)
* all duties are charged on a CIF basis