Embed Size (px)
Citation preview
www.fxtradersedge.com ©2014 FX Trader’s EDGE TM All Rights Reserved
Japanese CandlestickPrimer
©2014 FX Trader’s EDGE TM All Rights Reservedwww.fxtradersedge.com
The candlestick patterns explained in this presentation are for information purposes only. Candlestick patterns are used to supplement your chart analysis and are not meant to be used on their own without other confirmations.
FX Traders EDGE cannot be held responsible for any consequences that may result from the use of these candlestick patterns or any other information in this presentation. This presentation is for Educational Purposes only.
Disclaimer
©2014 FX Trader’s EDGE TM All Rights Reservedwww.fxtradersedge.com
Notes
We learned that there are two types of patterns: Continuation and Reversal. Reversal patterns occur at the end of a trend. Continuation patterns occur during the trend and are merely pauses or consolidations in the trend.
Several things occur at market reversal points: At market tops, traders are greedy and at market bottoms, traders and investors are fearful – both sentiments lead to market extremes, even in currencies!
At either extreme, there is a major trend line break – so plot those trend lines! Also, price tends to deviate from the moving averages so look for the rubber band effect! Certain candlestick patterns emerge at the end of the trend – this is where you tend to see long wicks and patterns such as bullish and bearish engulfing, morning and evening stars, hammers, shooting stars, and tweezer tops and bottoms.
Finally, the longer the pattern takes to materialize, and the larger the pattern, the further the prices will move outside of that pattern, and the greater its importance. That doesn’t mean that these patterns aren’t found on shorter time frames – they are, but they need to be traded nimbly with definitive profit objectives and stop losses.
Reversal Chart Patterns
©2014 FX Trader’s EDGE TM All Rights Reservedwww.fxtradersedge.com
Markets are fractal, meaning that chart patterns form repeating arrangements or shapes in any time frame.
Classical technical analysis books defined chart patterns in the 70’s that are still true today.
Correctly identify these patterns to determine future trading opportunities.
Reversal chart pattern recognition helps determine change in market sentiment and time entries and exits.
All chart patterns have measured objectives.
Reversal Chart Patterns
Reversal Chart Patterns
©2014 FX Trader’s EDGE TM All Rights Reservedwww.fxtradersedge.com
Reversal Days are also called Top or Bottom Reversal Days, Buying or Selling Climaxes, and Key Reversal Days. Learning how to trade them can get you into a trend reversal early.
Two Day Reversals are also quite common, as sometimes it takes two days for the market to reverse itself.
Topping and bottoming fractals are 3-day formations found at the top and bottom of markets and can get you into the new trend early.
Reversal Candle Patterns
Reversal Candle Patterns
©2014 FX Trader’s EDGE TM All Rights Reservedwww.fxtradersedge.com
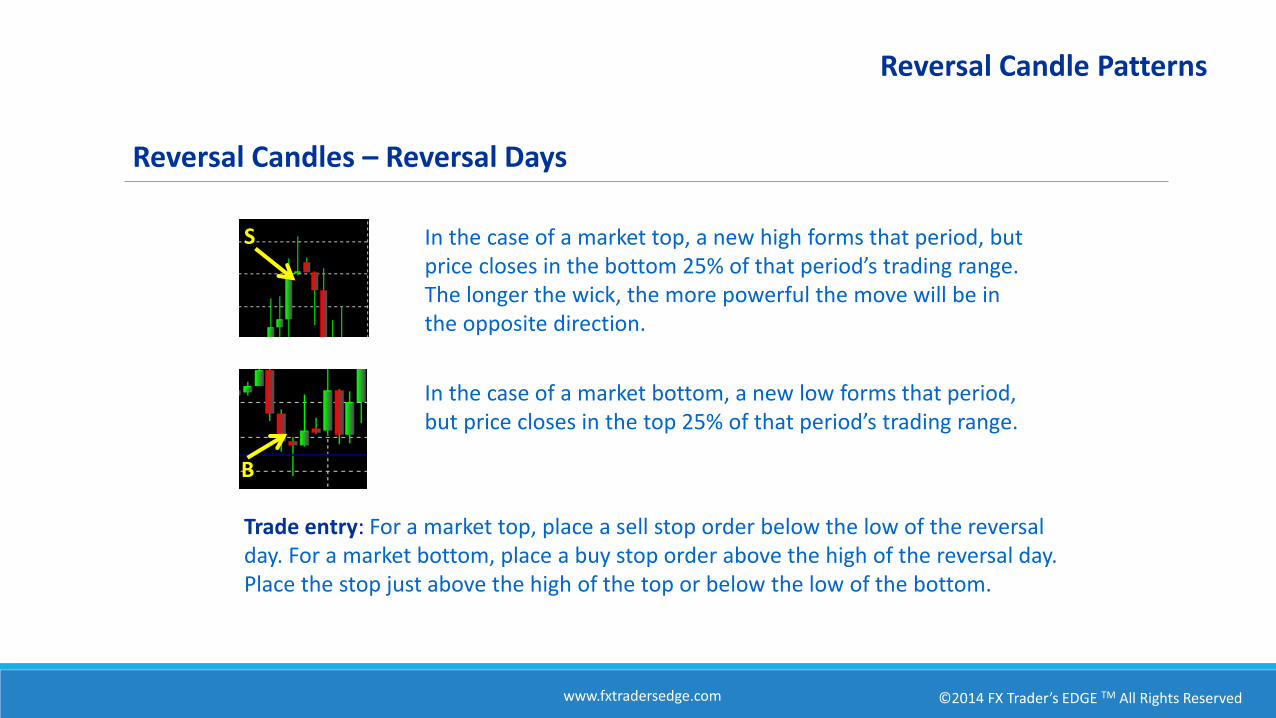
Reversal Candles – Reversal Days
In the case of a market top, a new high forms that period, but price closes in the bottom 25% of that period’s trading range. The longer the wick, the more powerful the move will be in the opposite direction.
In the case of a market bottom, a new low forms that period, but price closes in the top 25% of that period’s trading range.
Trade entry: For a market top, place a sell stop order below the low of the reversal day. For a market bottom, place a buy stop order above the high of the reversal day. Place the stop just above the high of the top or below the low of the bottom.
S
B
Reversal Candle Patterns
©2014 FX Trader’s EDGE TM All Rights Reservedwww.fxtradersedge.com
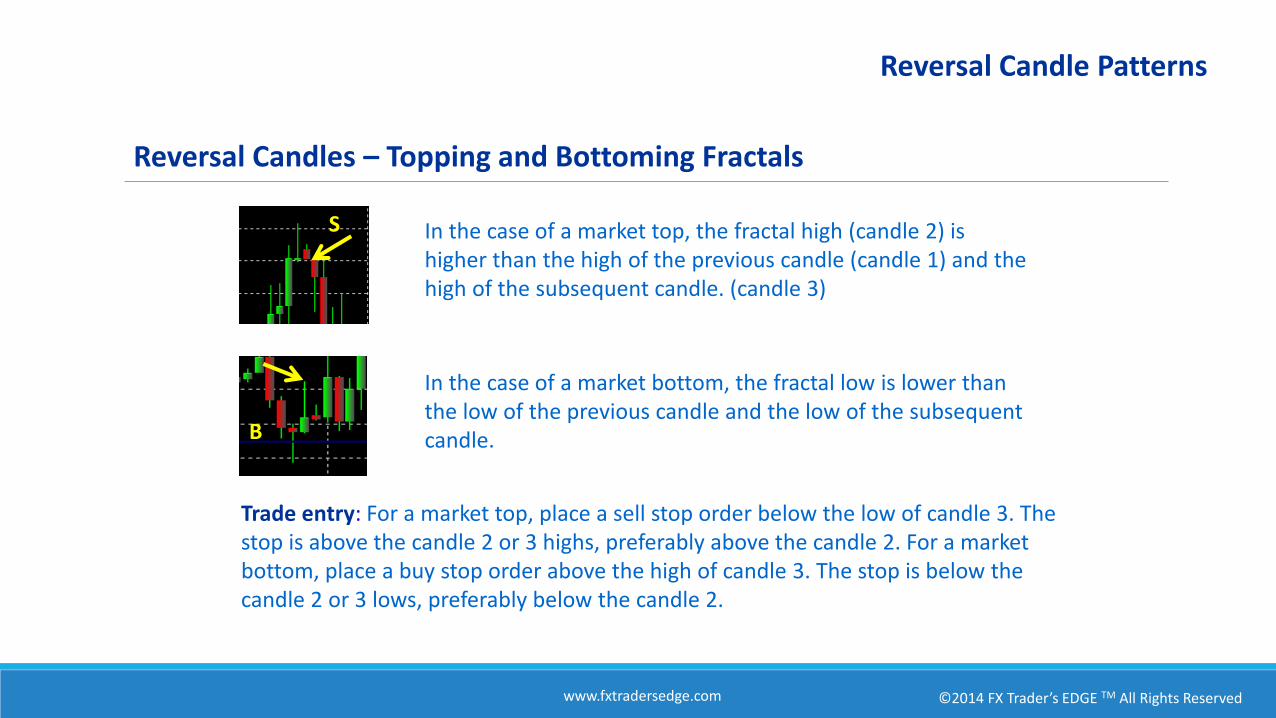
Reversal Candles – Topping and Bottoming Fractals
In the case of a market top, the fractal high (candle 2) is higher than the high of the previous candle (candle 1) and the high of the subsequent candle. (candle 3)
In the case of a market bottom, the fractal low is lower than the low of the previous candle and the low of the subsequent candle.
Trade entry: For a market top, place a sell stop order below the low of candle 3. The stop is above the candle 2 or 3 highs, preferably above the candle 2. For a market bottom, place a buy stop order above the high of candle 3. The stop is below the candle 2 or 3 lows, preferably below the candle 2.
S
B
Reversal Candle Patterns
©2014 FX Trader’s EDGE TM All Rights Reservedwww.fxtradersedge.com
The Japanese have used candlesticks as a charting and analysis technique for centuries.
Candlesticks mostly help pick tops and bottoms and are most powerful when they confirm a western indicator.
Candlestick patterns are psychological imprints of what traders are thinking at any given time.
There are approximately 40 reversal candle patterns that vary from single candlesticks to groupings of up to five candlesticks.
Candlestick Patterns
Candlestick Patterns
©2014 FX Trader’s EDGE TM All Rights Reservedwww.fxtradersedge.com
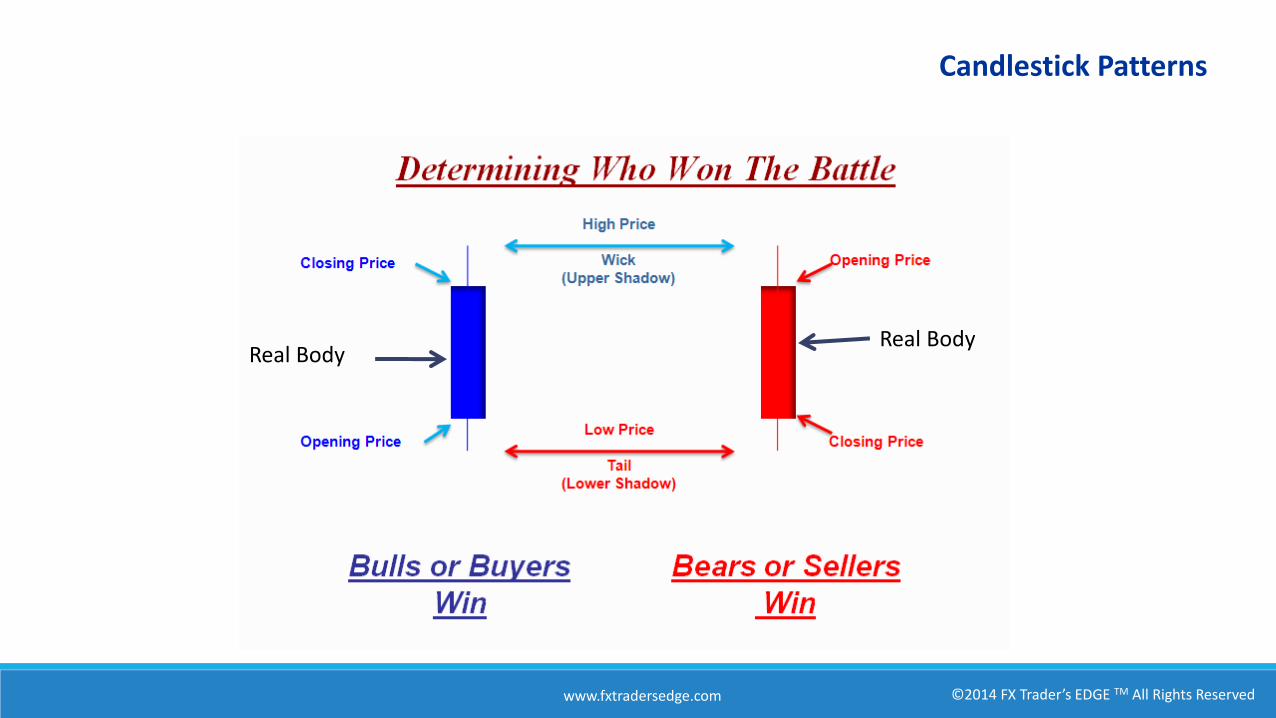
Real BodyReal Body
Candlestick Patterns
©2014 FX Trader’s EDGE TM All Rights Reservedwww.fxtradersedge.com
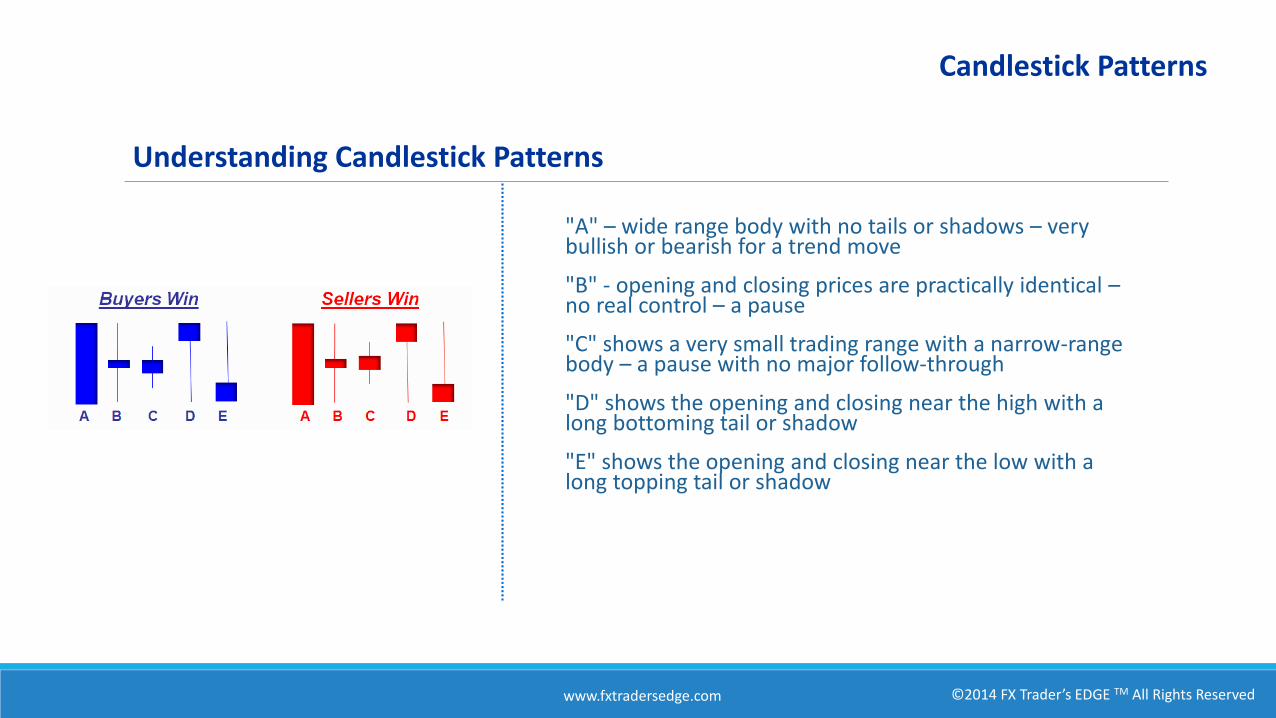
"A" – wide range body with no tails or shadows – very bullish or bearish for a trend move
"B" - opening and closing prices are practically identical –no real control – a pause
"C" shows a very small trading range with a narrow-range body – a pause with no major follow-through
"D" shows the opening and closing near the high with a long bottoming tail or shadow
"E" shows the opening and closing near the low with a long topping tail or shadow
Candlestick Patterns
Understanding Candlestick Patterns
©2014 FX Trader’s EDGE TM All Rights Reservedwww.fxtradersedge.com
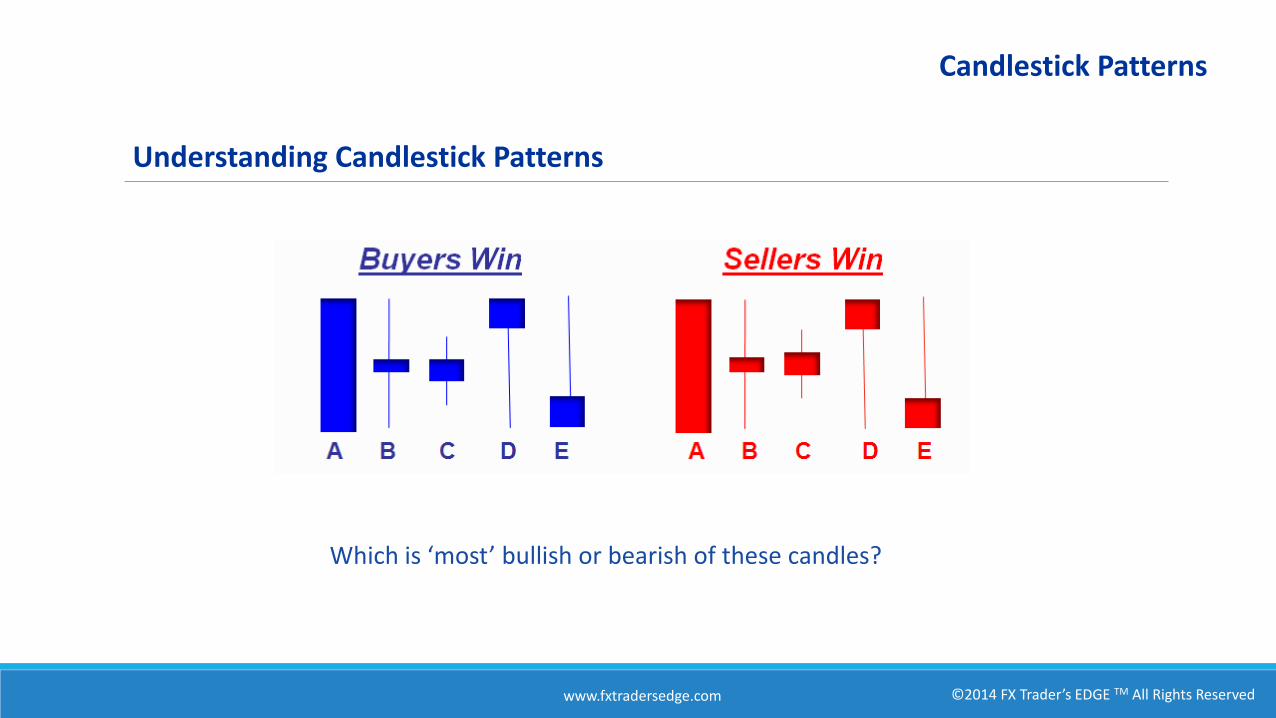
Which is ‘most’ bullish or bearish of these candles?
Candlestick Patterns
Understanding Candlestick Patterns
©2014 FX Trader’s EDGE TM All Rights Reservedwww.fxtradersedge.com
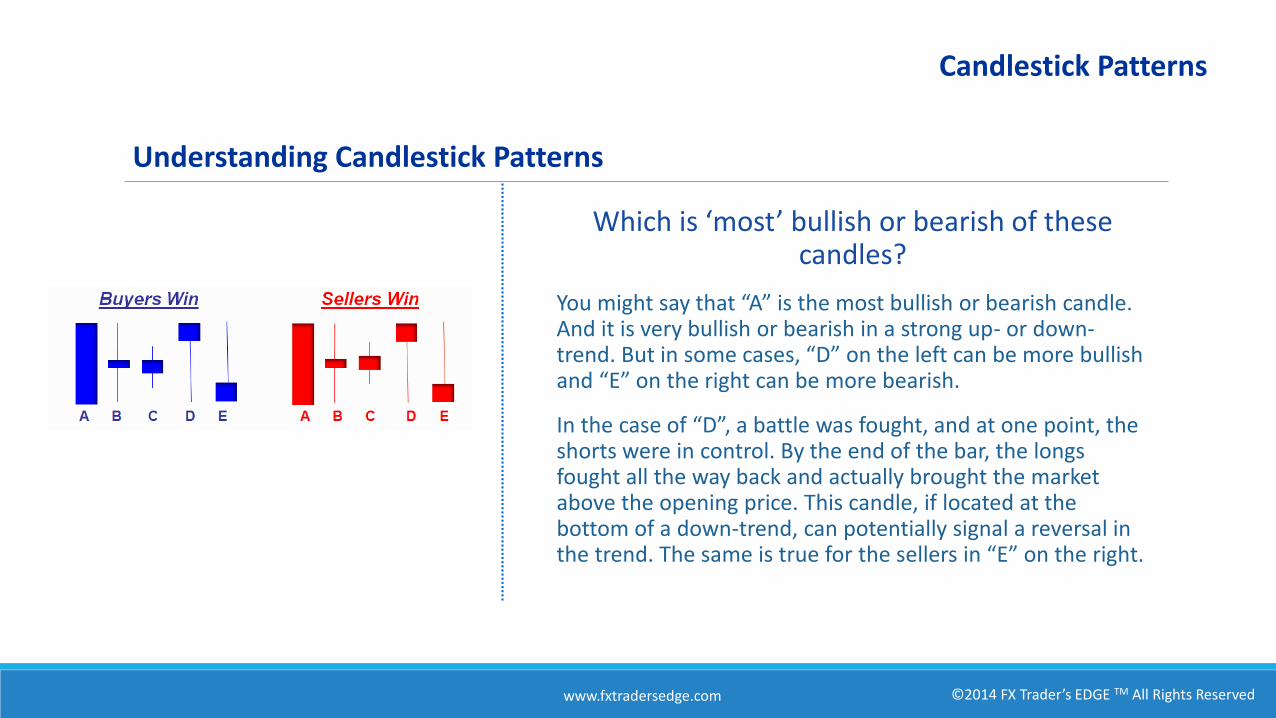
Which is ‘most’ bullish or bearish of these candles?
You might say that “A” is the most bullish or bearish candle. And it is very bullish or bearish in a strong up- or down-trend. But in some cases, “D” on the left can be more bullish and “E” on the right can be more bearish.
In the case of “D”, a battle was fought, and at one point, the shorts were in control. By the end of the bar, the longs fought all the way back and actually brought the market above the opening price. This candle, if located at the bottom of a down-trend, can potentially signal a reversal in the trend. The same is true for the sellers in “E” on the right.
Candlestick Patterns
Understanding Candlestick Patterns
©2014 FX Trader’s EDGE TM All Rights Reservedwww.fxtradersedge.com
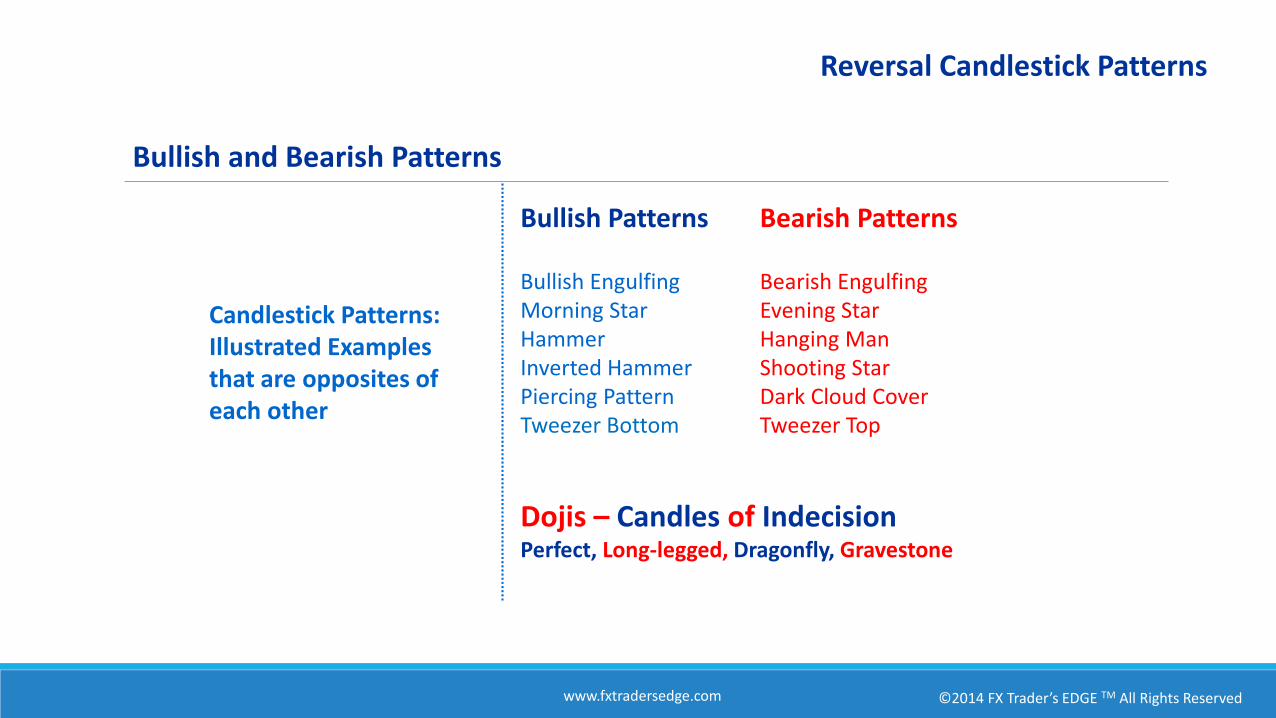
Bullish Patterns Bearish Patterns
Bullish Engulfing Bearish EngulfingMorning Star Evening StarHammer Hanging ManInverted Hammer Shooting StarPiercing Pattern Dark Cloud CoverTweezer Bottom Tweezer Top
Dojis – Candles of IndecisionPerfect, Long-legged, Dragonfly, Gravestone
Candlestick Patterns: Illustrated Examples that are opposites of each other
Reversal Candlestick Patterns
Bullish and Bearish Patterns
©2014 FX Trader’s EDGE TM All Rights Reservedwww.fxtradersedge.com
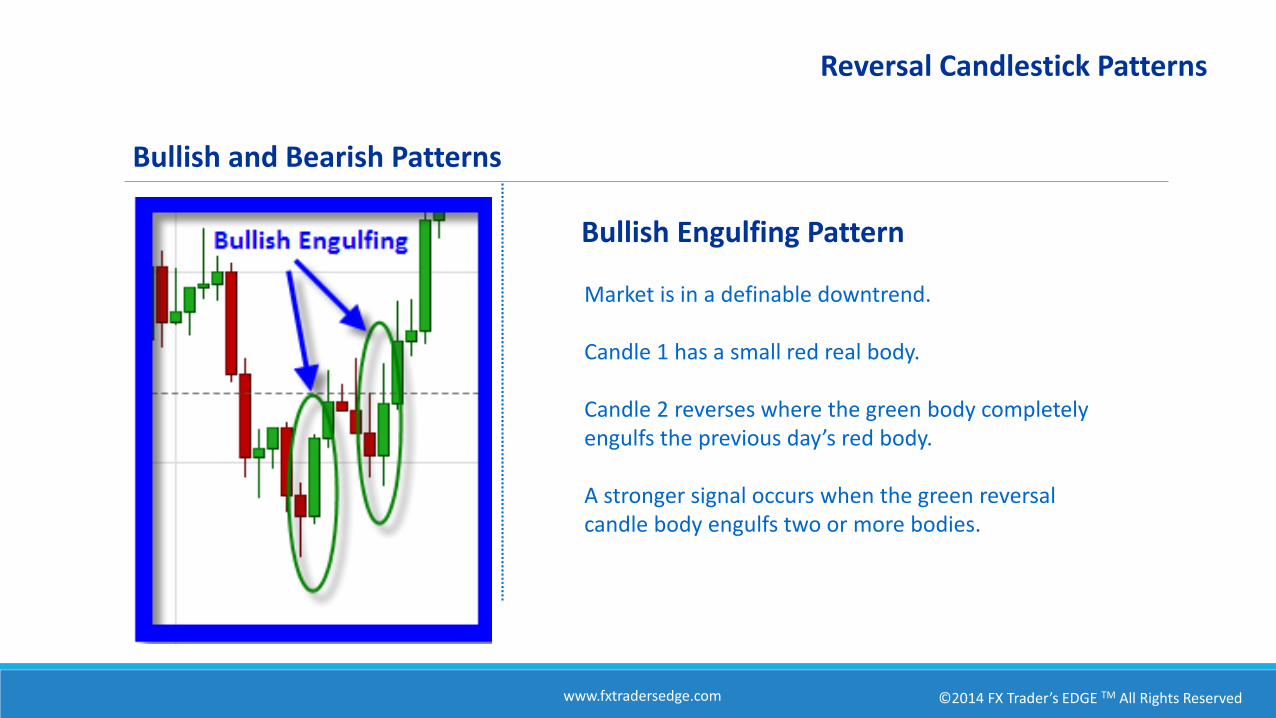
Market is in a definable downtrend.
Candle 1 has a small red real body.
Candle 2 reverses where the green body completely engulfs the previous day’s red body.
A stronger signal occurs when the green reversal candle body engulfs two or more bodies.
Bullish and Bearish Patterns
Bullish Engulfing Pattern
Bullish and Bearish Patterns
Reversal Candlestick Patterns
©2014 FX Trader’s EDGE TM All Rights Reservedwww.fxtradersedge.com
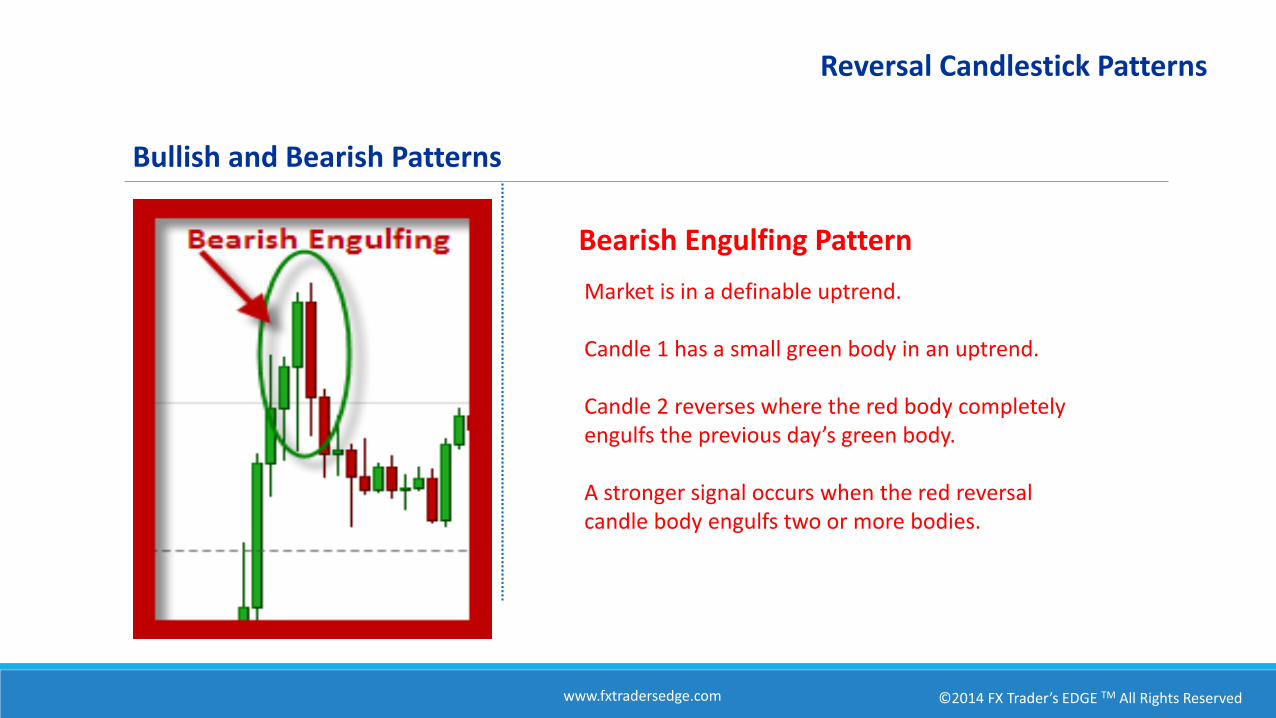
Market is in a definable uptrend.
Candle 1 has a small green body in an uptrend.
Candle 2 reverses where the red body completely engulfs the previous day’s green body.
A stronger signal occurs when the red reversal candle body engulfs two or more bodies.
Bearish Engulfing Pattern
Bullish and Bearish Patterns
Reversal Candlestick Patterns
©2014 FX Trader’s EDGE TM All Rights Reservedwww.fxtradersedge.com
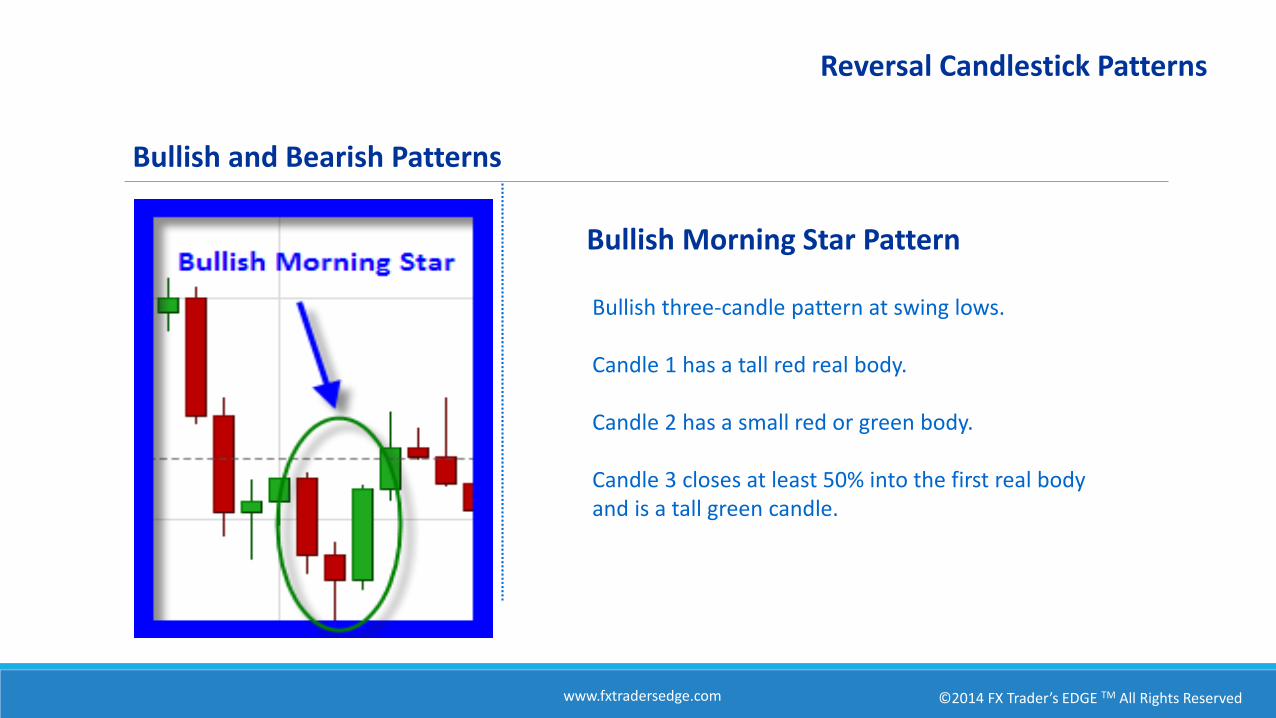
Bullish three-candle pattern at swing lows.
Candle 1 has a tall red real body.
Candle 2 has a small red or green body.
Candle 3 closes at least 50% into the first real body and is a tall green candle.
Bullish Morning Star Pattern
Reversal Candlestick Patterns
Bullish and Bearish Patterns
©2014 FX Trader’s EDGE TM All Rights Reservedwww.fxtradersedge.com
Candlestick Pattern:
Evening Star
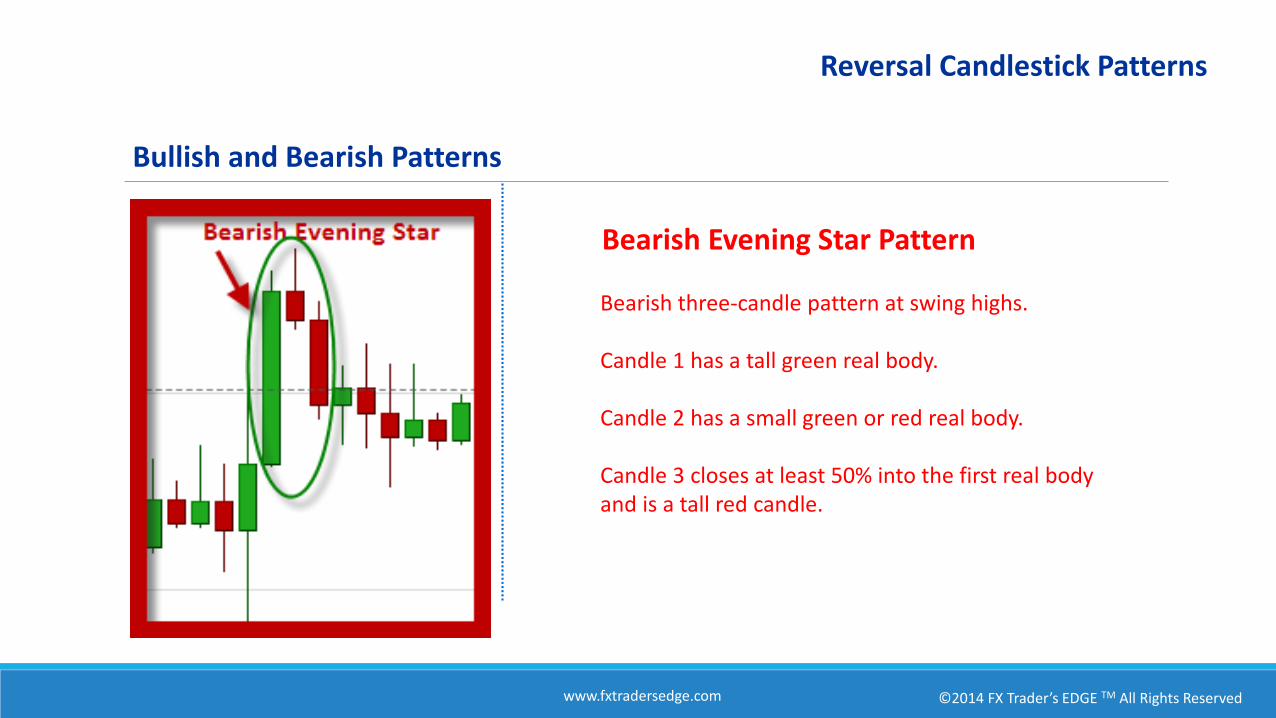
Bearish three-candle pattern at swing highs.
Candle 1 has a tall green real body.
Candle 2 has a small green or red real body.
Candle 3 closes at least 50% into the first real body and is a tall red candle.
Bullish and Bearish Patterns
Bearish Evening Star Pattern
Reversal Candlestick Patterns
Bullish and Bearish Patterns
©2014 FX Trader’s EDGE TM All Rights Reservedwww.fxtradersedge.com
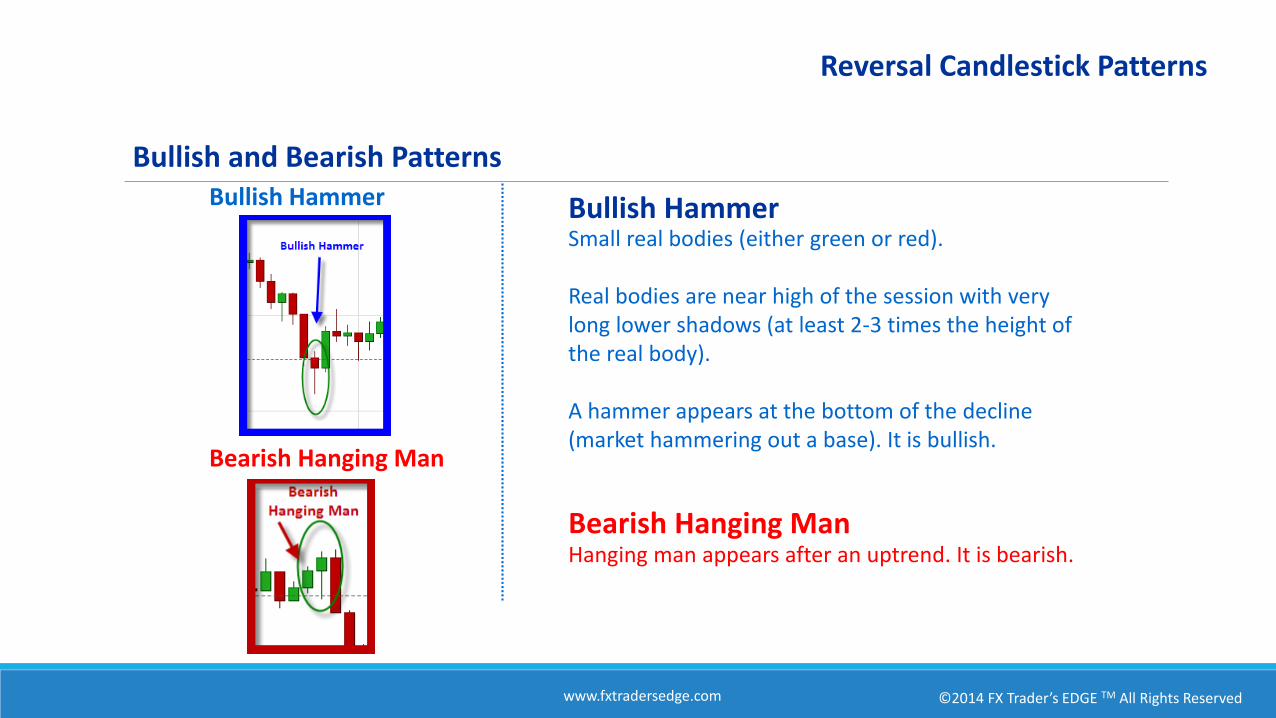
Small real bodies (either green or red).
Real bodies are near high of the session with very long lower shadows (at least 2-3 times the height of the real body).
A hammer appears at the bottom of the decline (market hammering out a base). It is bullish.
Hanging man appears after an uptrend. It is bearish.
Bearish Hanging Man
Bullish Hammer Bullish Hammer
Bearish Hanging Man
Reversal Candlestick Patterns
Bullish and Bearish Patterns
©2014 FX Trader’s EDGE TM All Rights Reservedwww.fxtradersedge.com
Candlestick Pattern:
Shooting Star
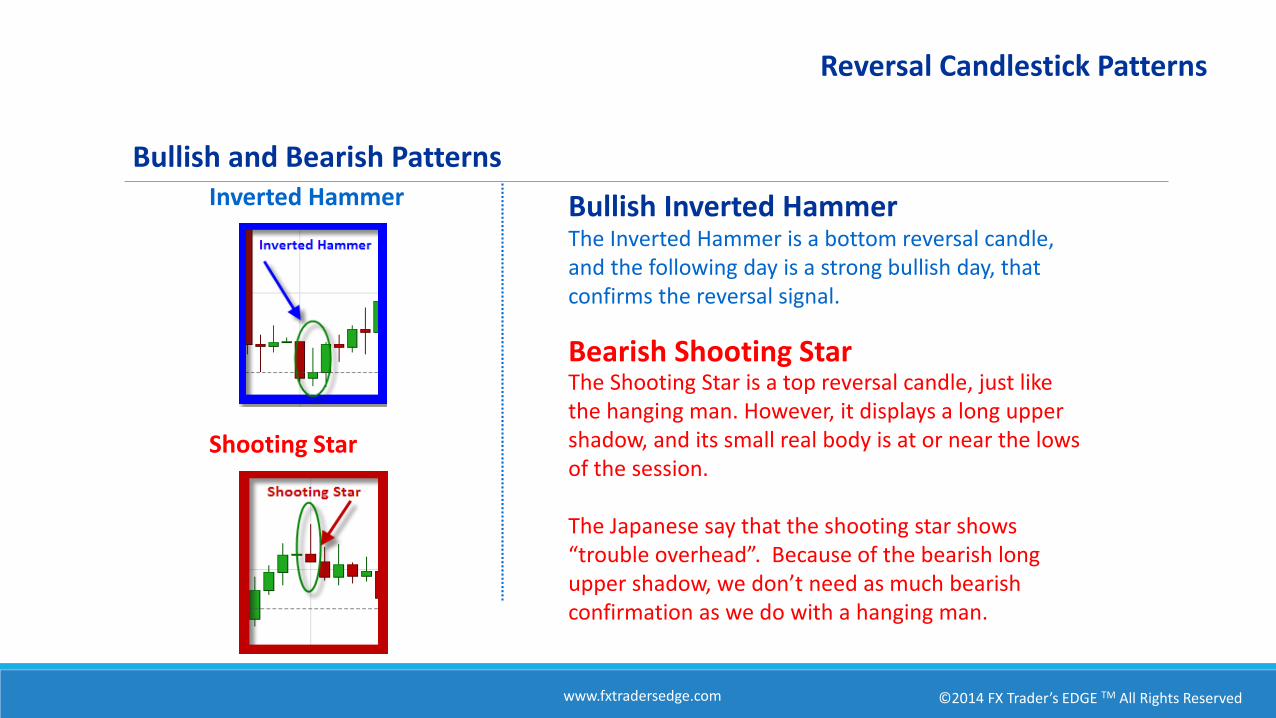
The Inverted Hammer is a bottom reversal candle, and the following day is a strong bullish day, that confirms the reversal signal.
The Shooting Star is a top reversal candle, just like the hanging man. However, it displays a long upper shadow, and its small real body is at or near the lows of the session.
The Japanese say that the shooting star shows “trouble overhead”. Because of the bearish long upper shadow, we don’t need as much bearish confirmation as we do with a hanging man.
Bullish Inverted Hammer
Bearish Shooting Star
Inverted Hammer
Shooting Star
Reversal Candlestick Patterns
Bullish and Bearish Patterns
©2014 FX Trader’s EDGE TM All Rights Reservedwww.fxtradersedge.com
Candlestick Pattern:
Shooting Star
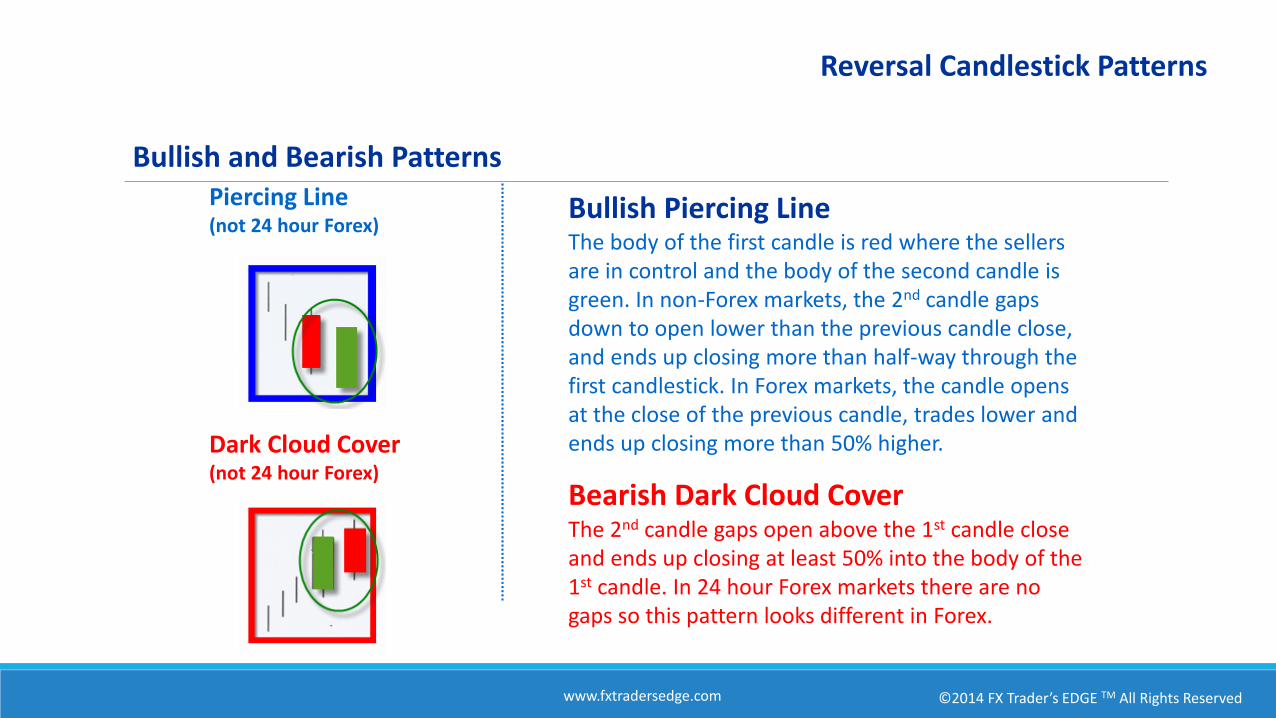
The body of the first candle is red where the sellers are in control and the body of the second candle is green. In non-Forex markets, the 2nd candle gaps down to open lower than the previous candle close, and ends up closing more than half-way through the first candlestick. In Forex markets, the candle opens at the close of the previous candle, trades lower and ends up closing more than 50% higher.
The 2nd candle gaps open above the 1st candle close and ends up closing at least 50% into the body of the 1st candle. In 24 hour Forex markets there are no gaps so this pattern looks different in Forex.
Piercing Line (not 24 hour Forex)
Dark Cloud Cover(not 24 hour Forex)
Bullish Piercing Line
Bearish Dark Cloud Cover
Reversal Candlestick Patterns
Bullish and Bearish Patterns
©2014 FX Trader’s EDGE TM All Rights Reservedwww.fxtradersedge.com
Candlestick Pattern:
Shooting Star
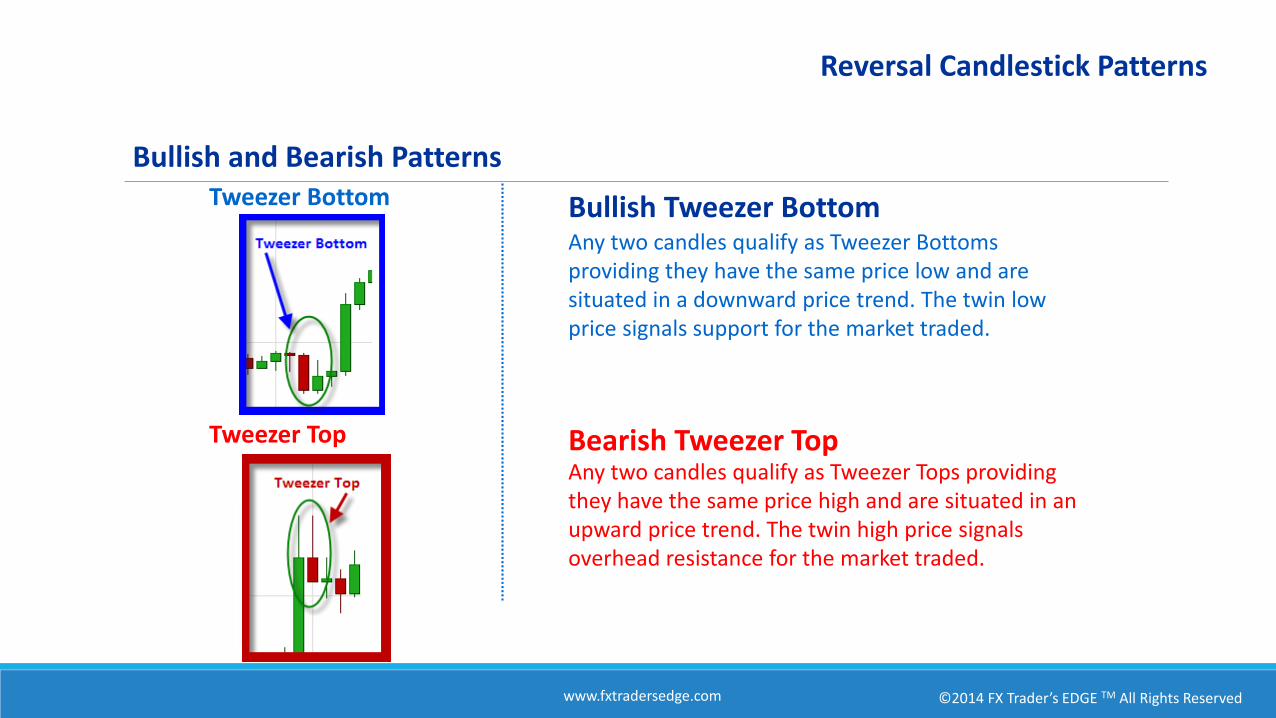
Any two candles qualify as Tweezer Bottoms providing they have the same price low and are situated in a downward price trend. The twin low price signals support for the market traded.
Any two candles qualify as Tweezer Tops providing they have the same price high and are situated in an upward price trend. The twin high price signals overhead resistance for the market traded.
Tweezer Bottom
Tweezer Top
Bullish Tweezer Bottom
Bearish Tweezer Top
Reversal Candlestick Patterns
Bullish and Bearish Patterns
©2014 FX Trader’s EDGE TM All Rights Reservedwww.fxtradersedge.com
Bullish and Bearish Patterns
Candlestick Patterns
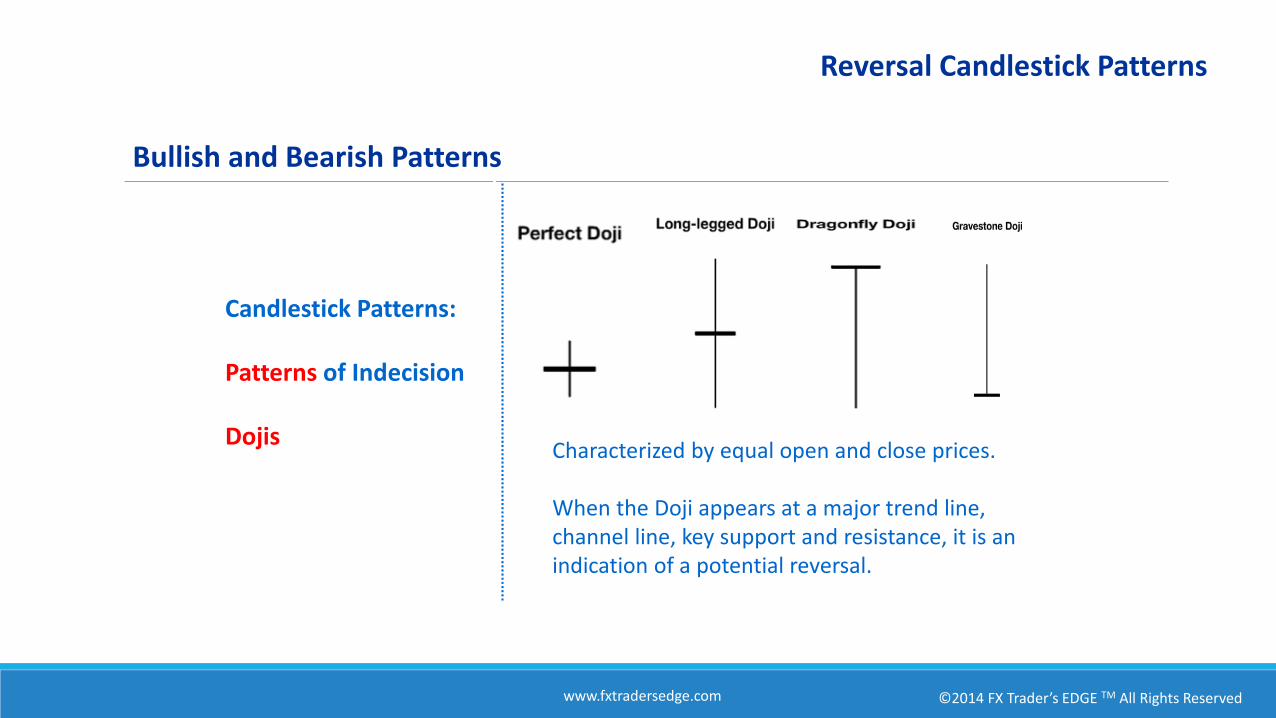
Patterns of Indecision:
Dojis Characterized by equal open and close prices.
When the Doji appears at a major trend line, channel line, key support and resistance, it is an indication of a potential reversal.
Candlestick Patterns:
Patterns of Indecision
Dojis
Reversal Candlestick Patterns
Bullish and Bearish Patterns


![Japanese Candlestick Charting Techniques [1991 330p S. Nison] [Trading eBook]](https://img.pdfslide.net/doc/110x75/55cf87f555034664618be125/japanese-candlestick-charting-techniques-1991-330p-s-nison-trading-ebook.jpg)


