Embed Size (px)
Citation preview
Japanese experience: Beyond the delocalization and new economic partnerships with East Asian and OECD regions
October 2006
Tsuyoshi NAKAIDirector General
JETRO Paris & European Coordination [email protected]
151bis rue St-Honoré 75001 Paris Tel : 01 42 61 27 27

2
JAPAN GDP (Real) Contribution of the Final Households Consumption 0.3%
-1
-0.5
0
0.5
1
1.5
2
2.5
Current Balance 0.3 0 0.3 0.2 0.4 0.3 0.3 -0.2 -0.1 -0.1 0.2 -0.1 0.6 0 -0.1
Contribution of the Total Government Expenditure -0.1 -0.1 -0.2 0 -0.2 0.7 -0.8 0 0.1 0.1 0.1 0.1 0 0 0
Contribution of the Gross Fixed Capital Formation 0.3 0 0.6 0 1 -0.4 0.5 0 0 0.4 0.3 0.1 -0.1 0.2 0.6
Contribution of final Households Consumption -0.2 -0.1 -0.2 0.1 0.7 0.4 0 0 -0.2 0.7 0.4 0.2 0.4 0.2 0.3
GDP 0.4 -0.5 0.6 0.5 1.6 1.3 -0.3 -0.2 0.1 1.5 1.3 0.3 1.4 0.5 0.2
02/10
-12
03/1-
3
03/4-
6
03/7-
9
03/10
-12
04/1-
3
04/4-
6
04/7-
9
04/10
-12
05/1-
3
05/4-
6
05/7-
9
05/10
-12
06/1-
3
06/4-
6
Contribution of the GFCF 0.6%
Contribution of the Total Government Expenditure0.0%
Current Balance-0.1%
GDP0.2%
© JETRO Paris

3
Real GDP growth~3% Growth for FY 2005
490
500
510
520
530
540
550
560
Ⅱ Ⅲ Ⅳ Ⅰ Ⅱ Ⅲ Ⅳ Ⅰ Ⅱ Ⅲ Ⅳ Ⅰ Ⅱ Ⅲ Ⅳ Ⅰ Ⅱ Ⅲ Ⅳ Ⅰ
2002 2003 2004 2005 2006 2007
(trillion yen)
FY2005GDP 543.1 trillion yen(+3.2%)<FY2005 Governmental
Economic Outlook><+2.7%>
(▲0.3%)
(+0.9%)
(+0.7%)
(+0.4%) (+0.5%)
FY2002GDP 506.0 trillion yen
(+1.1%)
(+0.8%)
(+0.8%)
(+1.6%)
(+1.4%)
(+1.3%)
To meet the FY2006 CAO Forecast (+2.1%) ,
+0.4% growth (QoQ)needed after 2006/Jul.-Sep.
FY2003GDP 517.6 trillion yen
(+2.3%)
(▲0.2%)
(+0.1%)
(▲0.3%)
FY2004GDP526.4 trillion yen
(+1.7%)
(+0.1%)
(+1.1%)
The annual growth rate,if the GDP remains at the same
level after 2006/Jul.-Sep. +1.4%
(+0.2%)(+0.7%)
*Source : The 1nd Preliminary Quarterly Estimates of GDP Apr.-Jun. 2006, Cabinet Office
© METI

4
Fiscal Year 2005Earnings level in major sectors of activity (turnover, operation profits)
-40
-20
0
20
40
60
80
0 2 4 6 8 10 12 14 16 18
増収率(%)
増益
率(%
)
Mining industries
Wholesales
Metal non ferreux
Drugs&MedecinesIndustrial MachineryReal Estate
ConsumersalesGlass/Stone/Soil
Transports terrestres
Services
Precision Mechanics
Machinery for transportation sector
Chemical
Textiles
Rubbernon manufacturers
Industries
manufacturers
Electrical machinery
Wood pulp
Information Communication
Electricity/Gas
Profit rate evolution (%)
Sales increase rate (%)
+ profit- CA
+ profit+ CA
- profit- CA
- profit+ CA
© JETRO Paris

5
Declining Unemployment ~Labor Market sees Clear Improvement
Trend in Unemployment Rate and Active Job Opening Rate
3.0
3.5
4.0
4.5
5.0
5.5
6.0
97 98 99 00 01 02 03 04 05 06
(%)0.4
0.5
0.6
0.7
0.8
0.9
1
1.1
1.2
Unemployment Rate (Left scale)
Active Job Rate (Right scale)
(points)
Worse
Better
Source: Monthly Labour Survey, Ministry of Health, Labour and Welfare, July 28 : Report on Employment Service,Ministory of Internal Affairs and Communications,July 28
June 2006Unemployment Rate : 4.2%Active Job Rate : 1.08points
(Seasonally adjusted)Trend in Unemployment Rate and Active Job Opening Rate
Source:Monthly Labour Survey, Ministry of Health, Labour and Welfare, July 28Report on Employment Service, Ministory of International Affaires and Communications, July 28
© METI

6
Lowered business costs
Downward Trend in the Real Estate Prices
Real Estate Price (march 1995= 100) Office Rent (1993 =100)
Source : White paper on real estatate(KK Ikoma Data Service System)Source : Real Estate Institute
© JETRO Paris

Percentage of non-performing loans (Main Banks)
8.4%
8.1%
7.2%
6.5%
5.2%
4.7%
2.9%
2.0%
3.0%
4.0%
5.0%
6.0%
7.0%
8.0%
9.0%
Mars 02 September 02 March 03 September 03 March 04 September 04 March 05
Source : MOF

8
Growth of the Digital Housing EquipementMarket
451 000
(unite)
439 0002624 000
0
200
400
600
800
1,000
1,200
1,400
1,600
1,800
2,000
2 3 4 5 6 7 8 9 10 11 12 1 2 3 4 5 6 7 8 9 10 11 12 1 2 3 4 5 6 7 8 9 10 11 12 1 2 3 4 5 6 7 8 9 10 11 12 1 2 3 4 5 6 7
2003 2004 2005 2006
Flat Screen Television
DVD
Degital Camera
*Contour line « Digital Camera » indicate productionSource : Business Associations

9
Innovative ReplacementInnovative Replacement
© JETRO Paris

10
Are Japanese companies ready to relocate their production sites into Japan ?
Production prospects in Japan within 3 years (survey of 115 companies)
Reasons which justify increasing their domestic production capacities
49%
37%
11%3%
increase same level decrease no opinion
59%
50%
25%
16%
0%
10%
20%
30%
40%
50%
60%
70%
existing R&D center in
Japan
High domestic demand Avoid Technologies flight low production cost
SOURCE :Nikkei Shimbun Aug. 19, 2004© JETRO Paris

11
Changes in Japan’s trade values with and direct investments in China and ASEAN
0
5
10
15
20
25
30
35
40
45
0
Trade (China + ASEAN) on the left scaleInvestment (China + ASEAN) on the right scale
1989 1990 1991 1992 1993 1994 1995 1996 1997 1998 1999 2000 2001 2002 2003 2004FY
2,000
4,000
6,000
8,000
10,000
12,000
14,000(\ trillion) (\100 million)
Source: Ministry of Finance
© METI

12
Developing de-facto integration in East Asia
< Intra-regional Trade Ratio >
38%
57%
45%
East Asia
EU15
NAFTA
30
40
50
60
70
1980 1982 1984 1986 1988 1990 1992 1994 1996 1998 2000 2002(year)
(%)
EU15
NAFTA
East Asia
Note: East Asia includes Japan, China, Korea, Hong Kong, Taiwan, ASEAN10, Australia, NZ and India.Source: IMF “DOT” Board of Foreign Trade, Taiwan, Chinese Taipei “Trade Statistics"(http://eweb.trade.gov.tw/default.asp)
NAFTA: enters into force
ASEAN: CEPT commences
EU: Agree to form single market
EU: Intra-regional marketintegration completed EU: Euro introduced
60%
© JETRO

13
Foreign Direct Investment Climate in Japan
Low Foreign Direct Investment Level in Japan (stocks)
(comparaison nominal GDP - Year 2004)
22.1
2.1
37.5
27.4
42.6
30.133
0
5
10
15
20
25
30
35
40
45
JAPAN US UK Germany France Canada Australia
(%)
Source : International Finance Statistics Yearbook 2004 (IMF)
© JETRO Paris

14
« We will double the FDI in Japan within the next 5 years »(Prime Minister KOIZUMI, January 23, 2003)
Foreign Direct Investment in Japan will be doubled
9,3699,610
10,455
6,632
0
2,000
4,000
6,000
8,000
10,000
12,000
14,000
96 97 98 99 00 01 02 03 04 05 06
3,013
13,200
(Unit : 1 billion yen)
Source:Ministry of Finance & Bank of Japan “International investment position”
© JETRO Paris
15
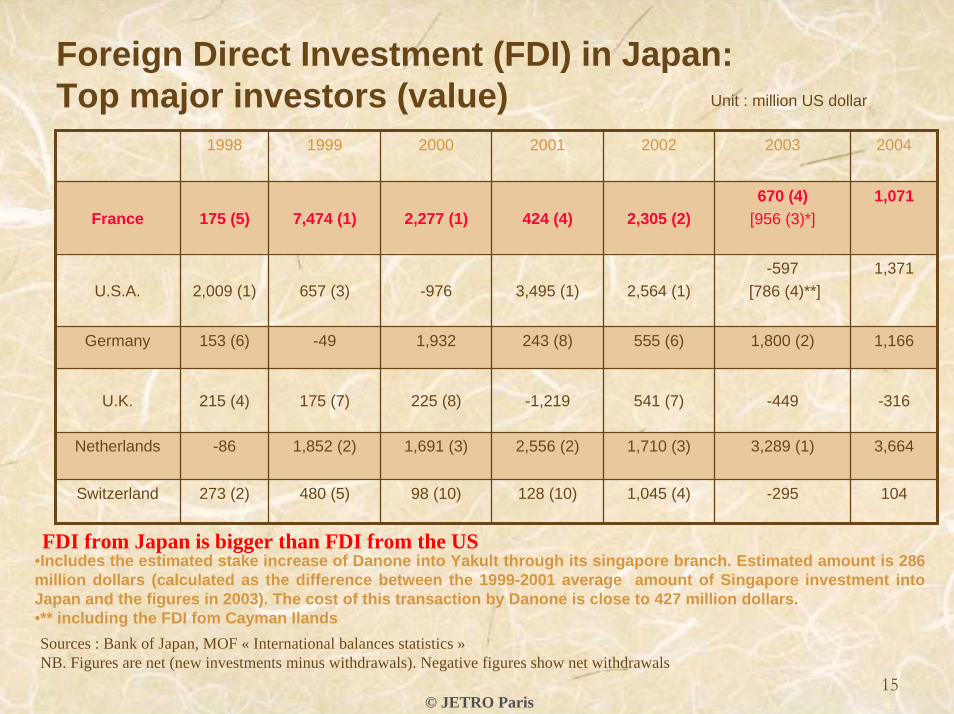
Foreign Direct Investment (FDI) in Japan: Top major investors (value) Unit : million US dollar
1998 1999 2000 2001 2002 2003 2004
France 175 (5) 7,474 (1) 2,277 (1) 424 (4) 2,305 (2)670 (4)
[956 (3)*]
-597[786 (4)**]
1,800 (2)
-449
3,289 (1)
-295
1,071
U.S.A. 2,009 (1) 657 (3) -976 3,495 (1) 2,564 (1)1,371
Germany 153 (6) -49 1,932 243 (8) 555 (6) 1,166
U.K. 215 (4) 175 (7) 225 (8) -1,219 541 (7) -316
Netherlands -86 1,852 (2) 1,691 (3) 2,556 (2) 1,710 (3) 3,664
Switzerland 273 (2) 480 (5) 98 (10) 1,045 (4) 104128 (10)
FDI from Japan is bigger than FDI from the US
Sources : Bank of Japan, MOF « International balances statistics »NB. Figures are net (new investments minus withdrawals). Negative figures show net withdrawals
•Includes the estimated stake increase of Danone into Yakult through its singapore branch. Estimated amount is 286 million dollars (calculated as the difference between the 1999-2001 average amount of Singapore investment intoJapan and the figures in 2003). The cost of this transaction by Danone is close to 427 million dollars.•** including the FDI fom Cayman Ilands
© JETRO Paris

16
- Foreign Direct Investment (FDI) in Japan -
Increasing Japan’s Inward FDI Stock
OECD Countries:EU Countries, Australia, Canada, Iceland, New Zealand, Norway, Switzerland, Turkey, U.S.A., Mexico, Czech and Hungary. EU: Belgium, Denmark, France, Germany, Greece, Ireland, Italy, Luxembourg, Netherlands, Portugal, Spain, United Kingdom, Austria, Finland and Sweden.Western Europe :UK, Germany , France, Netherlands, Italy, Belgium, Luxembourg, Switzerland, Sweden and SpainSource: Ministry of Finance and Bank of Japan:“Regional Direct Investment Position and Regional Portfolio Investment Position”
(Billion Yen)
1,172 8752,218
2,981 3,2483,981 4,201 4,336 4,4761,881
1,790
1,979
1,934
2,719
4,666 4,3884,878
5,692
466348
516
867
665
722884
1,735
1,021
85.4%
89.4%
92.3%
90.0%
85.0%
89.1%88.4%
86.8%
91.2%
0
2,000
4,000
6,000
8,000
10,000
12,000
14,000
97 98 99 00 01 02 03 04 05
80.0%
82.0%
84.0%
86.0%
88.0%
90.0%
92.0%
94.0%
Others
Other OECD Countries
Western Europe
OECD Countries share(%)
© JETRO

17
Chugoku①Project of settlement of a new generation of machinery industries inChugoku②Project to set-upa waste management Industry
Kyushu①Plaza Kyushu for Waste treatment andEnvironment industry (K-RIP)②Kyushu project of a silicon cluster
METI ShikokuShikoku’sTechnoBridge Project
HokkaidoHokkaido’s project to settle a Super Cluster → Good Marketing of the «Chondroitin
sulfate» cosmetic component for a radiant complexion
(4 companies and the University of Hokkaido have developed a process to extract this chemical from thesalmon fish’s head with state subsidies to promoteapplied reseearch)
Kinki①Kinki’s project related to biotechnologies→ ・a company, born in the university incubator bids a
OPI (Initial Public Offer).・sucessful recycling project ofr used oil for food into a cheap
combustible②Incentive subsidies to back-up dynamic industries③Promotion project of the IT cluster④Kinki promotion fproject in the field of Energy andEnvironnement
Industrial cluster Project(Regional revitalization and industry accumulation)
OkinawaOkinawa’s Projet to promote its industries
Tohoku①Promotion of the third age industries②Promotion of environment friendlyindustries
KantoNetworking to develop indutrial clusters in
the Kanto area①Project for revitalization of regionalindustries② introduction of venture capital in thebiotechnologies sector③introduction of venture capital in the IT industries
→ ・Successful development of new generation treatment process for DVDs
・successful development of a control apparel for a new generation of semi-conductors
Chubu①Tokai’s project to create new industries②Hokuriku’s project to create new
industries③Project to set-up a new industrial activityin the digital field
- 19 projects all over Japan- 6100 companies involved, 250 universities- 9 regional METI offices
© JETRO Paris


![2 特別講演②(塚本氏) (NXPowerLite).ppt [互換モード] · 2013. 10. 4. · (2005~ 2020) 増減数 増減数 ( 千人 ) (2005~ 2035) 増減率 (%) 地域別GDPの推移(](https://img.pdfslide.net/doc/110x75/60fab90627d5260d7b2f8bee/2-ceaioei-nxpowerliteppt-fff-2013-10-4.jpg)