Embed Size (px)
Citation preview
TSCF 2013 Shipbuilders Meeting
Page 1 of 12
Japanese Joint Research Project on the Thickness Effect to Fatigue
Strength
Tetsuo Okada <[email protected]>
Japan Marine United Corporation, Tokyo, Japan
Norio Yamamoto <[email protected]>
Nippon Kaiji Kyokai, Chiba, Japan
Masashi Mouri <[email protected]>
IHI Corporation, Yokohama, Japan
Takeshi Mori <[email protected]>
Hosei University, Tokyo, Japan
Abstract
In recent years, fatigue strength issue on tanker structures has been one of the greatest concerns among
the industries, and more and more consistent and direct analytical fatigue strength assessment method has
been introduced to the international rules, such as the Common Structural Rules for Double Hull Oil
Tankers (CSR-O/T). However, as compared with the rigorous analytical approach, the effect of plate
thickness has been left alone with simple and conventional application of thickness exponent of n=1/4.
In this regard, the Shipbuilders’ Association of Japan (SAJ) has had a great concern, and organized a joint
research project with steel makers, classification societies and universities in 2010. Since then, we have
carried out many experiments and associated analyses, including series of fundamental mother plate
experiments, fundamental joint experiments and structure experiments.
This paper outlines the results of the project in combination with some considerations on how the
harmonized CSR can incorporate the results of the project, and enhance the quality of structural design
and safety of oil tankers.
1 Introduction
In recent years, fatigue strength issue on tanker structures has been one of the greatest concerns among
the industries, and more and more consistent and direct analytical fatigue strength assessment method has
been introduced to the international rules, such as the Common Structural Rules for Double Hull Oil
Tankers (CSR-O/T) [1]. Such new rules take account of various parameters which affect fatigue strength,
one of which is plate thickness. It is commonly known as thickness effect that increase in plate thickness
causes a decrease in fatigue strength. Although some design standards [1, 2, 3] had taken account of this
thickness effect, as compared with the rigorous analytical approach for other factors, the effect of plate
thickness has been considered with simple application of thickness exponent of n=1/4, for example in
CSR-O/T, based on the work by Gurney [4].
In this regard, it has been shown through some studies that this thickness effect can be relaxed by
allowing for geometry of each specific joint, and some analytical or experimental studies were carried out
accordingly. Yagi et al. [5, 6] carried out parametric experiments with thickness range between 10mm and
80mm, and revealed that the as-welded joints with constant-sized attachments have much milder
thickness effect of an exponent of 1/10, while as-welded joints under bending stress have severer
thickness effect of an exponent of 1/3. Nakamura et al. [7] conducted analytical research on stress
concentrations in the welded joints between longitudinal stiffeners and web stiffeners, and concluded that
the thickness effect is negligible. Polezhayeva et al. [8] studied the thickness effect for base material and
TSCF 2013 Shipbuilders Meeting
Page 2 of 12
butt welded joints of the thicknesses between 22mm and 66mm, and proposed a thickness exponent of
1/10 for base material and 1/5 for butt welds. Fukuoka et al. [9] carried out several fatigue tests and stress
analyses, and pointed out that the thickness effect for weld joints on I-section beams is much smaller than
that of established rules and standards, and proposed new correction exponents.
In this circumstance, the authors considered that more comprehensive study is necessary to establish more
reasonable and reliable method to evaluate thickness effect applicable to variations of details of actual
ship structures, to avoid prohibiting rational usage of thick plates to hull structures and to promote
enhanced quality of structural design and safety of oil tankers. The Shipbuilders’ Association of Japan
(SAJ) has also had a great concern to this, and organized a joint research project with steel makers,
classification societies and universities in 2010. Since then, we have carried out many experiments and
associated analyses, including the following three types of experimental study:
(1) Fundamental experiment to reveal the difference of stress concentration and stress gradient to the
thickness direction around the weld toe depending on the thickness difference. Small specimens
which imitate the shape of fillet weld joint section of a series of different thicknesses were cut out
from the steel plate, and were prepared to fatigue strength experiment.
(2) Basic welded joint experiment to confirm the outcome from the fundamental experiments. In this
experiment, the effect of weld residual stress in the cruciform joint was also evaluated.
(3) Structural model experiment to reveal thickness effect in the actual ship structural details depending
on the load transfer mechanism.
This paper outlines the results of the project in combination with some considerations on how the
harmonized CSR [10] can incorporate the results of the project, and enhance the quality of structural
design and safety of oil tankers.
2 Fatigue Tests
2.1 Fundamental experiment
To restrict the discussion to the effect of plate thickness to the stress concentration and stress gradient
around the weld toe, excluding the possible effect of welding bead profile and residual stress, test
specimens which imitate the shape of welded–joint section were made by cutting out from a steel plate of
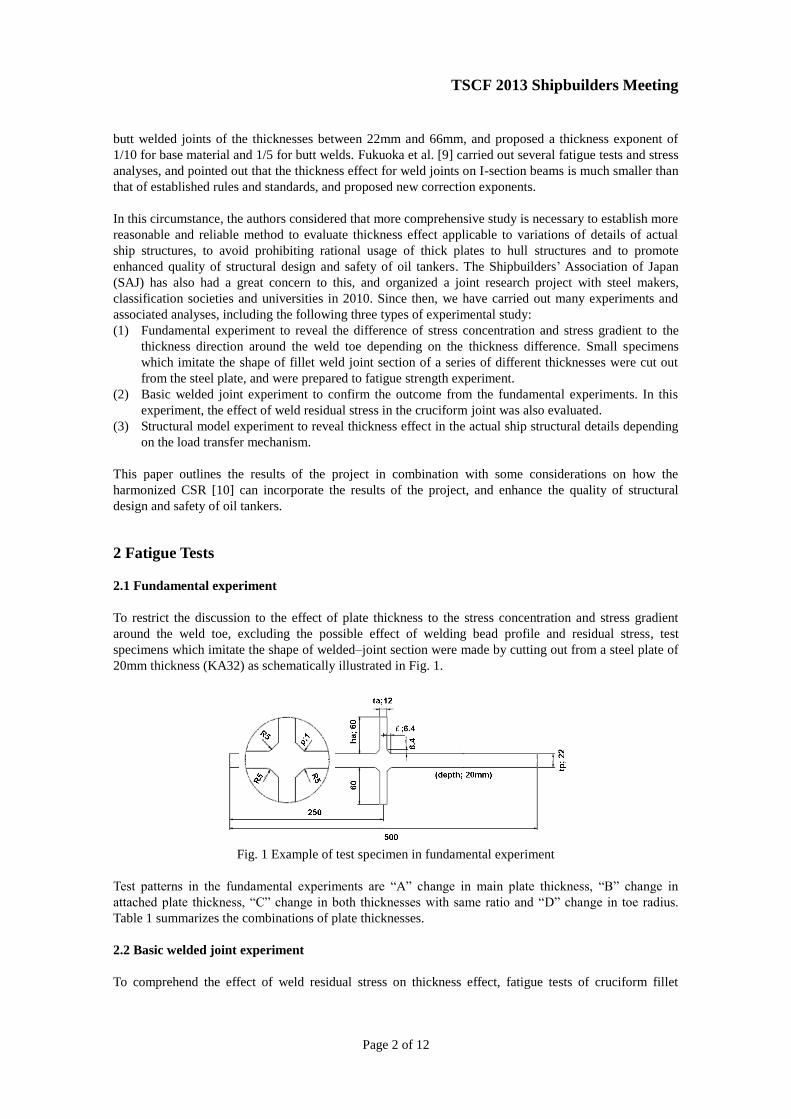
20mm thickness (KA32) as schematically illustrated in Fig. 1.
Fig. 1 Example of test specimen in fundamental experiment
Test patterns in the fundamental experiments are “A” change in main plate thickness, “B” change in
attached plate thickness, “C” change in both thicknesses with same ratio and “D” change in toe radius.
Table 1 summarizes the combinations of plate thicknesses.
2.2 Basic welded joint experiment
To comprehend the effect of weld residual stress on thickness effect, fatigue tests of cruciform fillet
TSCF 2013 Shipbuilders Meeting
Page 3 of 12
welded joint of as-welded specimen and of PWHT (post weld heat treatment) specimen were carried out.
And, to comprehend the thickness effect on welded joint, fatigue tests of out-of-plane gusset welded joint
were carried out. Test specimens were made of TMCP steel of YP32.
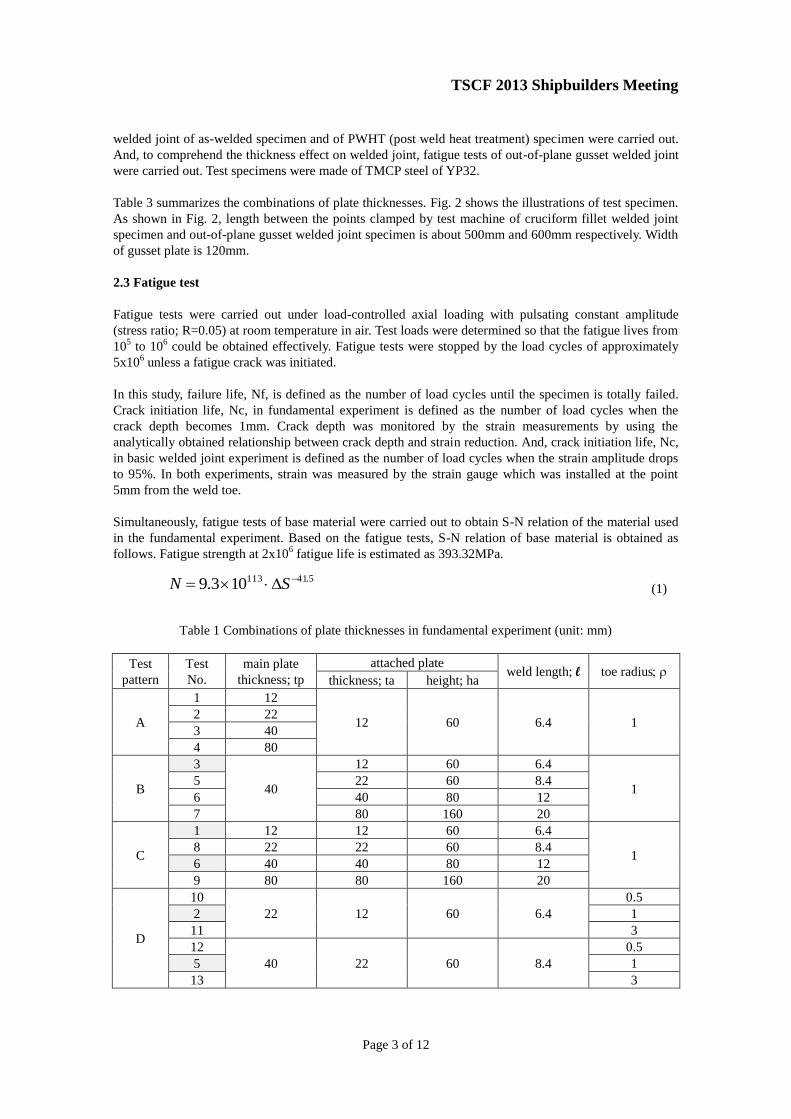
Table 3 summarizes the combinations of plate thicknesses. Fig. 2 shows the illustrations of test specimen.
As shown in Fig. 2, length between the points clamped by test machine of cruciform fillet welded joint
specimen and out-of-plane gusset welded joint specimen is about 500mm and 600mm respectively. Width
of gusset plate is 120mm.
2.3 Fatigue test
Fatigue tests were carried out under load-controlled axial loading with pulsating constant amplitude
(stress ratio; R=0.05) at room temperature in air. Test loads were determined so that the fatigue lives from
105 to 10
6 could be obtained effectively. Fatigue tests were stopped by the load cycles of approximately
5x10⁶ unless a fatigue crack was initiated.
In this study, failure life, Nf, is defined as the number of load cycles until the specimen is totally failed.
Crack initiation life, Nc, in fundamental experiment is defined as the number of load cycles when the
crack depth becomes 1mm. Crack depth was monitored by the strain measurements by using the
analytically obtained relationship between crack depth and strain reduction. And, crack initiation life, Nc,
in basic welded joint experiment is defined as the number of load cycles when the strain amplitude drops
to 95%. In both experiments, strain was measured by the strain gauge which was installed at the point
5mm from the weld toe.
Simultaneously, fatigue tests of base material were carried out to obtain S-N relation of the material used
in the fundamental experiment. Based on the fatigue tests, S-N relation of base material is obtained as
follows. Fatigue strength at 2x10⁶ fatigue life is estimated as 393.32MPa.
5.41113103.9 SN (1)
Table 1 Combinations of plate thicknesses in fundamental experiment (unit: mm)
Test
pattern
Test
No.
main plate
thickness; tp
attached plate weld length; l toe radius
thickness; ta height; ha
A
1 12
12 60 6.4 1 2 22
3 40
4 80
B
3
40
12 60 6.4
1 5 22 60 8.4
6 40 80 12
7 80 160 20
C
1 12 12 60 6.4
1 8 22 22 60 8.4
6 40 40 80 12
9 80 80 160 20
D
10
22 12 60 6.4
0.5
2 1
11 3
12
40 22 60 8.4
0.5
5 1
13 3
TSCF 2013 Shipbuilders Meeting
Page 4 of 12
Fig. 2 Test Specimen in basic welded joint experiments
Table 3 Combinations of plate thicknesses in basic welded joint experiment (unit: mm)
joint type Test
No.
main plate
thickness
attached plate Target weld
length
Target toe
radius thickness height
cruciform
fillet welded
joint
2-AW 40 22 60 8.4 1
2-SR 40 22 60 8.4 1
3-AW 40 80 160 12 1
3-SR 40 80 160 12 1
out-of-plane
gusset
welded joint
5-AW 12 12 60 6.4 1
6-AW 22 12 60 6.4 1
7-AW 40 12 60 6.4 1
8-AW 80 12 60 6.4 1
9-AW 40 24 60 8.4 1
AW ; as welded, SR ; stress relieved by PWHT
3 Finite Element Analysis
3.1 Analysis model
Finite element elastic analyses using MSC/Nastran were carried out. Plane strain element FE model (1/2
model) was used for specimen of fundamental experiments, and solid element FE model (1/8 model) was
used for specimen of basic welded joints experiments. For plane strain FE analysis, corrected Young’s
modulus of 21' EE was applied, where E=206GPa and =0.3.
Identical element size of minimum 0.05mm was applied at the weld toe of all the specimens of
fundamental experiments in order to eliminate the difference due to element size. Lengths of each side of
the elements were made identical as far as practicable to keep accuracy of the analysis. Dummy rod
elements were attached on the surface along the weld toe contour shape to obtain the boundary stresses
along the weld toe surface.
Weld toe of specimens of basic welded joint experiments was modeled based on its toe radius. 10
elements were arranged along the curvature. Root face between main plate and attached plate was
modeled by the slit of 0.4mm. In order to evaluate nodal load on the surface of main plate, membrane
elements of 10-3
mm thickness were attached on the surface around the weld toe.
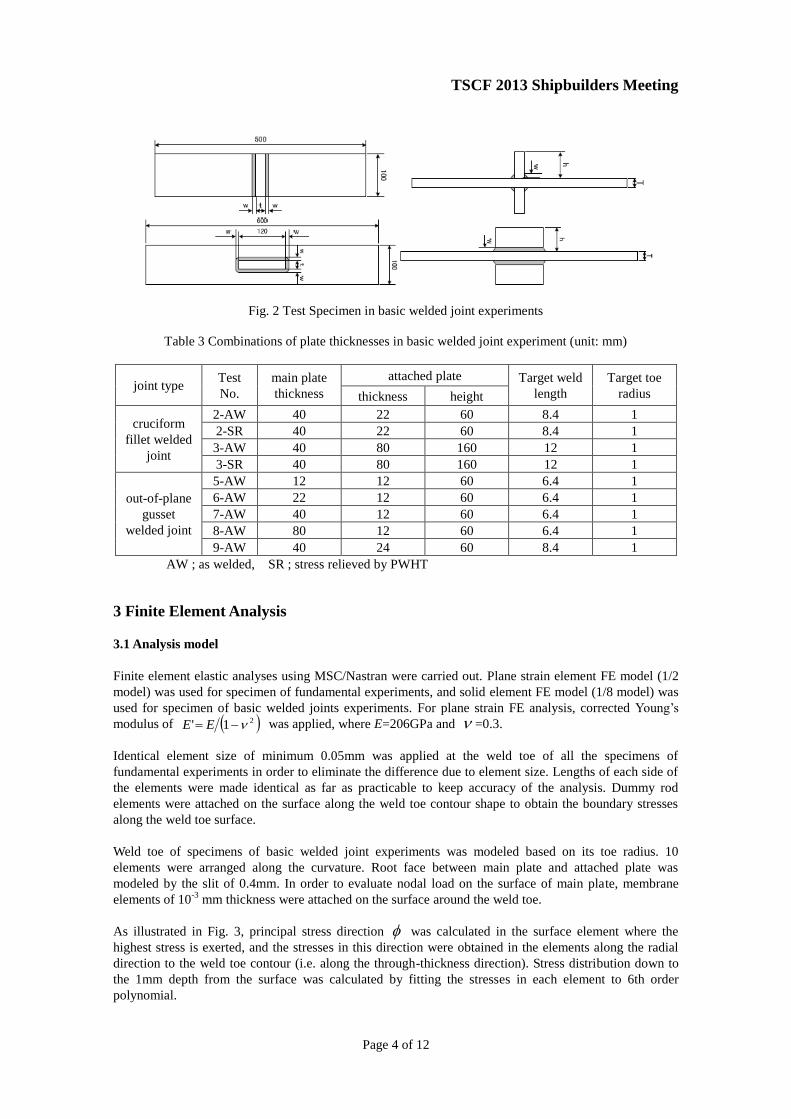
As illustrated in Fig. 3, principal stress direction was calculated in the surface element where the
highest stress is exerted, and the stresses in this direction were obtained in the elements along the radial
direction to the weld toe contour (i.e. along the through-thickness direction). Stress distribution down to
the 1mm depth from the surface was calculated by fitting the stresses in each element to 6th order
polynomial.
TSCF 2013 Shipbuilders Meeting
Page 5 of 12
3.2 Results of the analysis
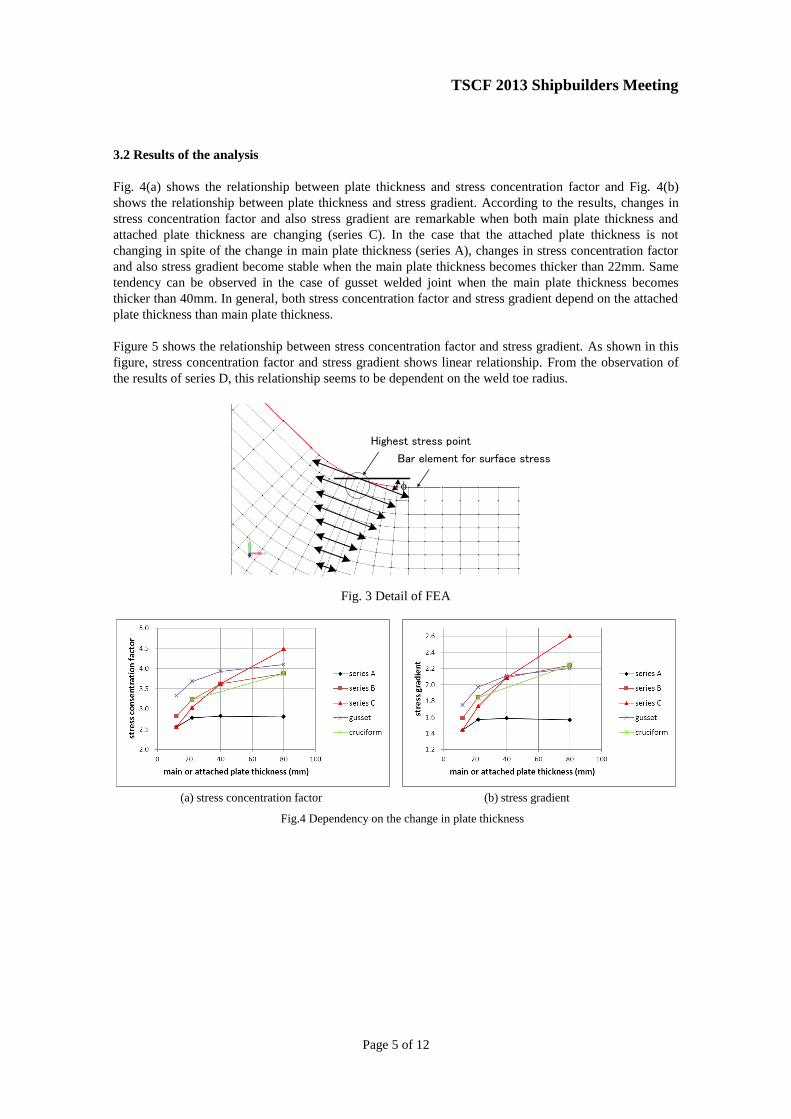
Fig. 4(a) shows the relationship between plate thickness and stress concentration factor and Fig. 4(b)
shows the relationship between plate thickness and stress gradient. According to the results, changes in
stress concentration factor and also stress gradient are remarkable when both main plate thickness and
attached plate thickness are changing (series C). In the case that the attached plate thickness is not
changing in spite of the change in main plate thickness (series A), changes in stress concentration factor
and also stress gradient become stable when the main plate thickness becomes thicker than 22mm. Same
tendency can be observed in the case of gusset welded joint when the main plate thickness becomes
thicker than 40mm. In general, both stress concentration factor and stress gradient depend on the attached
plate thickness than main plate thickness.
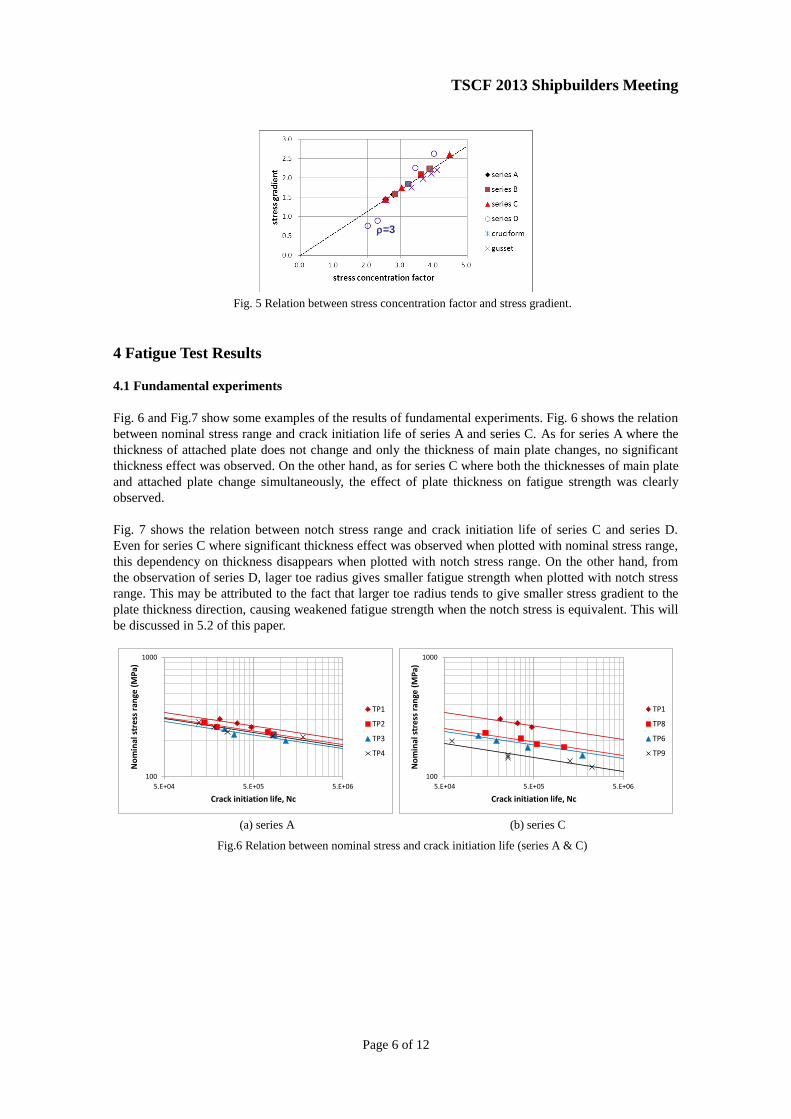
Figure 5 shows the relationship between stress concentration factor and stress gradient. As shown in this
figure, stress concentration factor and stress gradient shows linear relationship. From the observation of
the results of series D, this relationship seems to be dependent on the weld toe radius.
バー要素
評価部要素寸法を一様に調整
バー要素
評価部要素寸法を一様に調整
Bar element for surface stress
Highest stress point
Fig. 3 Detail of FEA
(a) stress concentration factor (b) stress gradient
Fig.4 Dependency on the change in plate thickness
TSCF 2013 Shipbuilders Meeting
Page 6 of 12
=3
Fig. 5 Relation between stress concentration factor and stress gradient.
4 Fatigue Test Results
4.1 Fundamental experiments
Fig. 6 and Fig.7 show some examples of the results of fundamental experiments. Fig. 6 shows the relation
between nominal stress range and crack initiation life of series A and series C. As for series A where the
thickness of attached plate does not change and only the thickness of main plate changes, no significant
thickness effect was observed. On the other hand, as for series C where both the thicknesses of main plate
and attached plate change simultaneously, the effect of plate thickness on fatigue strength was clearly
observed.
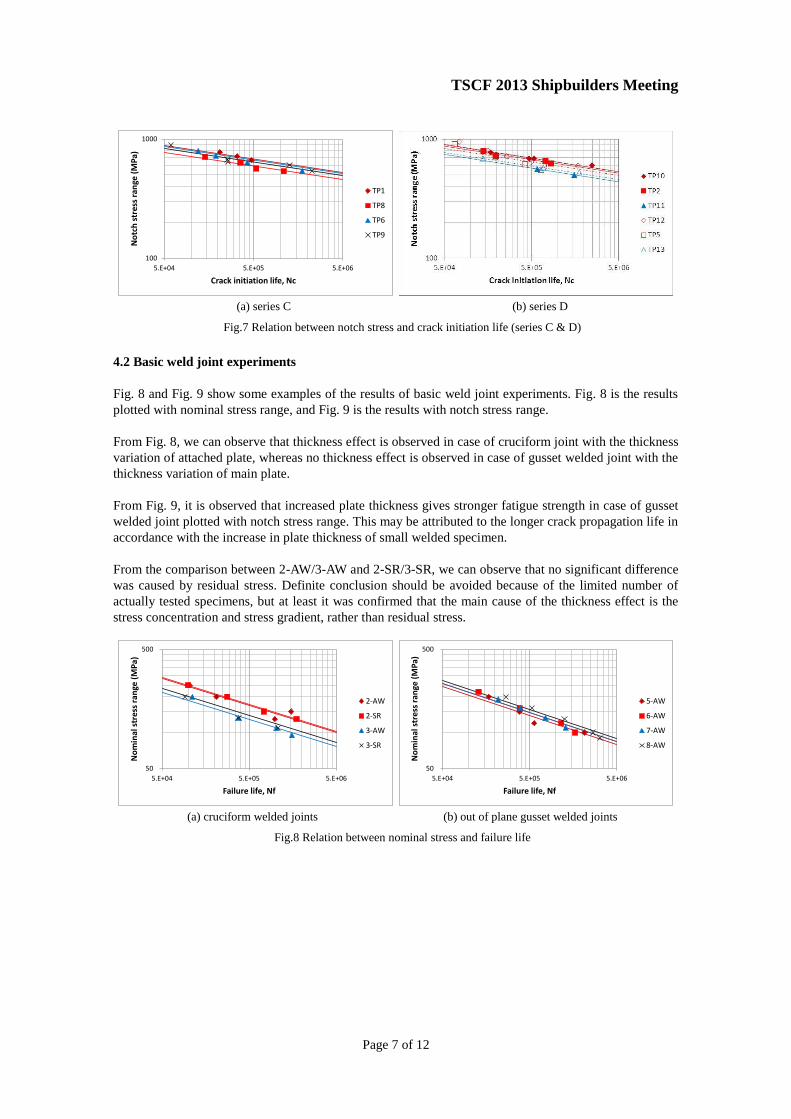
Fig. 7 shows the relation between notch stress range and crack initiation life of series C and series D.
Even for series C where significant thickness effect was observed when plotted with nominal stress range,
this dependency on thickness disappears when plotted with notch stress range. On the other hand, from
the observation of series D, lager toe radius gives smaller fatigue strength when plotted with notch stress
range. This may be attributed to the fact that larger toe radius tends to give smaller stress gradient to the
plate thickness direction, causing weakened fatigue strength when the notch stress is equivalent. This will
be discussed in 5.2 of this paper.
100
1000
5.E+04 5.E+05 5.E+06
No
min
al s
tre
ss r
ange
(M
Pa)
Crack initiation life, Nc
TP1
TP2
TP3
TP4
100
1000
5.E+04 5.E+05 5.E+06
No
min
al s
tres
s ra
nge
(M
Pa)
Crack initiation life, Nc
TP1
TP8
TP6
TP9
(a) series A (b) series C
Fig.6 Relation between nominal stress and crack initiation life (series A & C)
TSCF 2013 Shipbuilders Meeting
Page 7 of 12
100
1000
5.E+04 5.E+05 5.E+06
No
tch
str
ess
ran
ge (
MP
a)
Crack initiation life, Nc
TP1
TP8
TP6
TP9
(a) series C (b) series D
Fig.7 Relation between notch stress and crack initiation life (series C & D)
4.2 Basic weld joint experiments
Fig. 8 and Fig. 9 show some examples of the results of basic weld joint experiments. Fig. 8 is the results
plotted with nominal stress range, and Fig. 9 is the results with notch stress range.
From Fig. 8, we can observe that thickness effect is observed in case of cruciform joint with the thickness
variation of attached plate, whereas no thickness effect is observed in case of gusset welded joint with the
thickness variation of main plate.
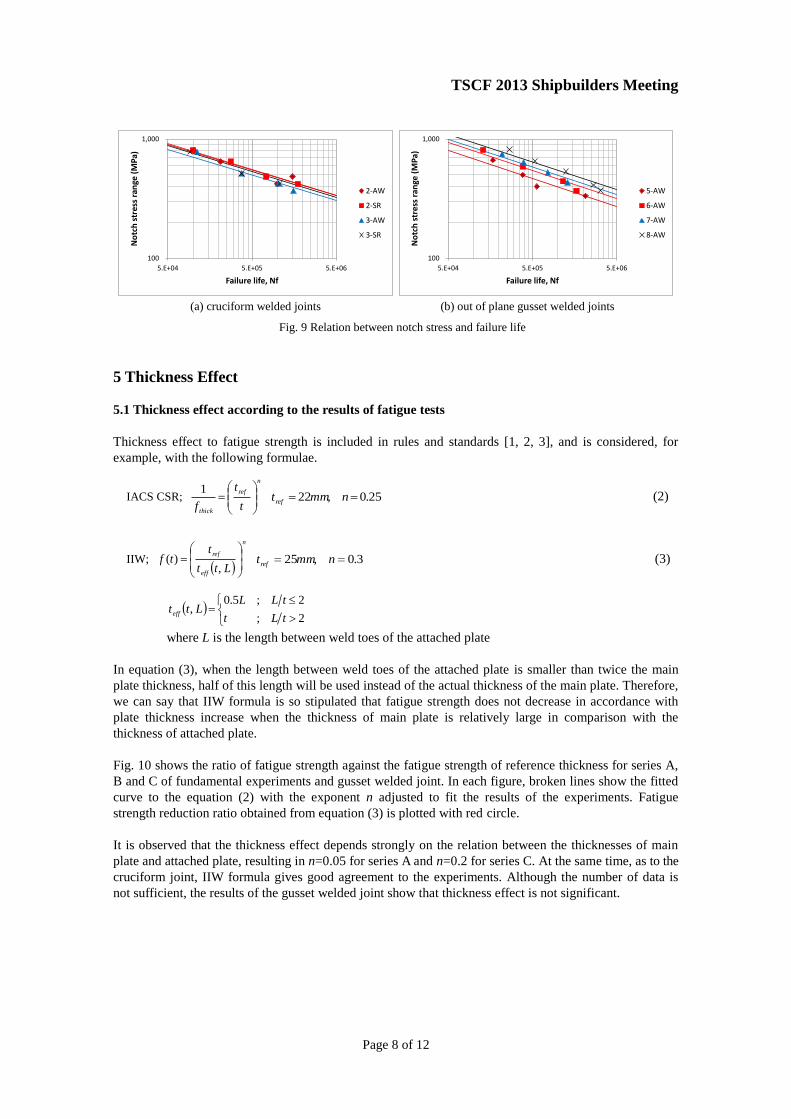
From Fig. 9, it is observed that increased plate thickness gives stronger fatigue strength in case of gusset
welded joint plotted with notch stress range. This may be attributed to the longer crack propagation life in
accordance with the increase in plate thickness of small welded specimen.
From the comparison between 2-AW/3-AW and 2-SR/3-SR, we can observe that no significant difference
was caused by residual stress. Definite conclusion should be avoided because of the limited number of
actually tested specimens, but at least it was confirmed that the main cause of the thickness effect is the
stress concentration and stress gradient, rather than residual stress.
50
500
5.E+04 5.E+05 5.E+06
No
min
al s
tres
s ra
nge
(M
Pa)
Failure life, Nf
2-AW
2-SR
3-AW
3-SR
50
500
5.E+04 5.E+05 5.E+06
No
min
al s
tre
ss r
ange
(M
Pa)
Failure life, Nf
5-AW
6-AW
7-AW
8-AW
(a) cruciform welded joints (b) out of plane gusset welded joints
Fig.8 Relation between nominal stress and failure life
TSCF 2013 Shipbuilders Meeting
Page 8 of 12
100
1,000
5.E+04 5.E+05 5.E+06
No
tch
str
ess
ran
ge (
MP
a)
Failure life, Nf
2-AW
2-SR
3-AW
3-SR
100
1,000
5.E+04 5.E+05 5.E+06
No
tch
str
ess
ran
ge (
MP
a)
Failure life, Nf
5-AW
6-AW
7-AW
8-AW
(a) cruciform welded joints (b) out of plane gusset welded joints
Fig. 9 Relation between notch stress and failure life
5 Thickness Effect 5.1 Thickness effect according to the results of fatigue tests
Thickness effect to fatigue strength is included in rules and standards [1, 2, 3], and is considered, for
example, with the following formulae.
IACS CSR;
n
ref
thick t
t
f
1 25.0,22 nmmtref
(2)
IIW;
n
eff
ref
Ltt
ttf
,)( 3.0,25 nmmtref
(3)
2;
2;5.0,
tLt
tLLLtteff
where L is the length between weld toes of the attached plate
In equation (3), when the length between weld toes of the attached plate is smaller than twice the main
plate thickness, half of this length will be used instead of the actual thickness of the main plate. Therefore,
we can say that IIW formula is so stipulated that fatigue strength does not decrease in accordance with
plate thickness increase when the thickness of main plate is relatively large in comparison with the
thickness of attached plate.
Fig. 10 shows the ratio of fatigue strength against the fatigue strength of reference thickness for series A,
B and C of fundamental experiments and gusset welded joint. In each figure, broken lines show the fitted
curve to the equation (2) with the exponent n adjusted to fit the results of the experiments. Fatigue
strength reduction ratio obtained from equation (3) is plotted with red circle.
It is observed that the thickness effect depends strongly on the relation between the thicknesses of main
plate and attached plate, resulting in n=0.05 for series A and n=0.2 for series C. At the same time, as to the
cruciform joint, IIW formula gives good agreement to the experiments. Although the number of data is
not sufficient, the results of the gusset welded joint show that thickness effect is not significant.

TSCF 2013 Shipbuilders Meeting
Page 9 of 12
0.6
0.8
1.0
1.2
1.4
0 20 40 60 80
fati
gue
str
engt
h r
ed
uct
ion
rat
io
main plate thickness
Nf Nominal
Nc Nominal
n= 0.05
IIW
0.6
0.8
1.0
1.2
1.4
0 20 40 60 80
fati
gue
str
engt
h r
ed
uct
ion
rat
io
attached plate thickness
Nf Nominal
Nc Nominal
n= 0.15
IIW
(a) series A (b) series B
0.6
0.8
1.0
1.2
1.4
0 20 40 60 80
fati
gue
str
engt
h r
ed
uct
ion
rat
io
main & attached plate thickness
Nf Nominal
Nc Nominal
n= 0.2
IIW
0.6
0.8
1.0
1.2
1.4
0 20 40 60 80
fati
gue
str
engt
h r
ed
uct
ion
rat
io
main plate thickness
Nf Nominal
Nc Nominal
n= -0.05
IIW
(c) series C (d) gusset welded joint
Fig.10 Fatigue strength reduction due to thickness effect
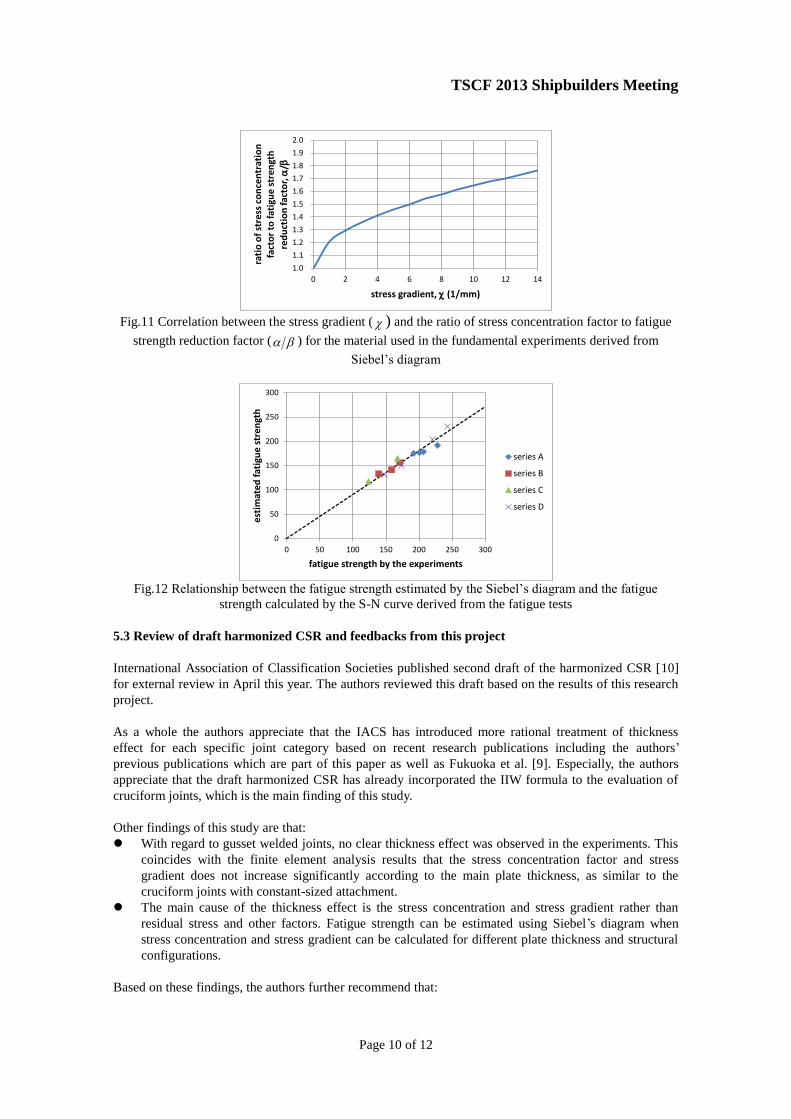
5.2 Effect of stress concentration and stress gradient on fatigue strength
According to the results shown in Fig.4 and Fig.10, it is considered that the thickness effect on fatigue
strength is closely related with stress concentration and stress gradient at weld toe. Regarding this matter,
Siebel [11] showed the correlation between the stress gradient ( ) and the ratio of stress concentration
factor to fatigue strength reduction factor ( ) for various mechanically notched materials. Based on
the Siebel’s diagram of the steels whose yield stresses are 196MPa and 392MPa, correlation between
and for the material used in the fundamental experiments whose yield stress is 350MPa can be
derived as shown in Fig.11.
Fatigue strength of fundamental experiments can be numerically estimated based on the Siebel’s diagram
shown in Fig.11 if the stress concentration factor and the stress gradient are obtained from FE analysis.
Figure 12 indicates the relationship between the fatigue strength estimated by the Siebel’s diagram and
the fatigue strength calculated by the S-N curve, which is derived from the fatigue tests.
Although the estimation tends to make under-estimation of about 10% when compared with the
experimental results, scatter in estimation is quite small. According to these results, it is considered that
the fatigue strength is dominated by not only the stress concentration factor but also the stress gradient at
weld toe that would change according to the form of joint. As the observation of the results of series D
experiments, we pointed out that larger toe radius gives smaller fatigue strength when plotted with notch
stress range. Because even these results fit well when plotted in Fig. 12, it is confirmed that the effect is
attributed to the fact that larger toe radius tends to give smaller stress gradient to the plate thickness
direction, causing weakened fatigue strength when the notch stress is equivalent.
TSCF 2013 Shipbuilders Meeting
Page 10 of 12
1.0
1.1
1.2
1.3
1.4
1.5
1.6
1.7
1.8
1.9
2.0
0 2 4 6 8 10 12 14
rati
o o
f st
ress
co
nce
ntr
atio
n
fact
or
to f
atig
ue
stre
ngt
h
red
uct
ion
fac
tor,
/
stress gradient, (1/mm)
Fig.11 Correlation between the stress gradient ( ) and the ratio of stress concentration factor to fatigue
strength reduction factor ( ) for the material used in the fundamental experiments derived from
Siebel’s diagram
0
50
100
150
200
250
300
0 50 100 150 200 250 300
esti
mat
ed f
atig
ue
str
engt
h
fatigue strength by the experiments
series A
series B
series C
series D
Fig.12 Relationship between the fatigue strength estimated by the Siebel’s diagram and the fatigue
strength calculated by the S-N curve derived from the fatigue tests
5.3 Review of draft harmonized CSR and feedbacks from this project
International Association of Classification Societies published second draft of the harmonized CSR [10]
for external review in April this year. The authors reviewed this draft based on the results of this research
project.
As a whole the authors appreciate that the IACS has introduced more rational treatment of thickness
effect for each specific joint category based on recent research publications including the authors’
previous publications which are part of this paper as well as Fukuoka et al. [9]. Especially, the authors
appreciate that the draft harmonized CSR has already incorporated the IIW formula to the evaluation of
cruciform joints, which is the main finding of this study.
Other findings of this study are that:
With regard to gusset welded joints, no clear thickness effect was observed in the experiments. This
coincides with the finite element analysis results that the stress concentration factor and stress
gradient does not increase significantly according to the main plate thickness, as similar to the
cruciform joints with constant-sized attachment.
The main cause of the thickness effect is the stress concentration and stress gradient rather than
residual stress and other factors. Fatigue strength can be estimated using Siebel’s diagram when
stress concentration and stress gradient can be calculated for different plate thickness and structural
configurations.
Based on these findings, the authors further recommend that:
TSCF 2013 Shipbuilders Meeting
Page 11 of 12
There are still rooms to rationalize thickness effect exponent for gusset welded joints, butt joints and
also large scale actual welded structures such as bilge hopper connections and lower stool
connections.
Thickness effect for such applications can be verified using calculated stress concentration factors
and stress gradients. The thickness effect exponents given in the draft harmonized CSR should be
verified based on this approach, or the Rules should include description to allow application of this
approach to establish thickness effect for each specific application.
6 Conclusion
The main remarks obtained by the present study are as follows.
(1) According to the fundamental experiments, thickness effect on fatigue strength depends on the
change in attached plate thickness rather than the change in main plate thickness.
(2) The reason of above mentioned tendency is considered to be that the fatigue strength is dominated
by the stress concentration and the stress gradient at weld toe, that depend on the weld size. And, in
the case of ship structural design, weld size is usually determined based on the attached plate
thickness.
(3) According to the fatigue test results of out-of-plane gusset welded joint and the previously reported
fatigue test results of cruciform welded joint [5] that the attached plate thickness were not changing,
thickness effect was quite small. The reason of these facts is considered to be that the stress
concentration and the stress gradient are not so sensitive to the increase in main plate thickness.
(4) With regard to the cruciform joint, the correction method of IIW is effective, taking account of the
relation between the thicknesses of main plate and attached plate
(5) The authors reviewed the draft harmonized CSR, and confirmed that important part of the findings
of this study have already been incorporated. In addition, the authors recommend that more rational
approach to thickness effect using stress concentration factor and stress gradient should be applied to
other welded joints, such as gusset welded joints, butt joints and large scale actual welded structures
such as bilge hopper connections and lower stool connections.
These obtained results have been fed back to IACS to improve the quality of the forthcoming harmonized
CSR, thus to enhance the safety level by applying reasonable considerations of the thickness effect to the
fatigue strength.
Results of one of the Japanese joint research projects were introduced in this paper. SAJ will continue to
devote its power to various research activities to give relevant feedbacks to rule making process, and
contribute to the maritime safety.
Acknowledgement
The authors would like to thank all the committee members of the Joint Research Project, who conducted
the various experiments, analyses and discussions
References
[1] International Association of Classification Societies : Common structural rules for double hull oil
tankers, July 2012.
[2] U.K. Department of Energy Offshore Installations : Guidance on design, construction and
certification, 4th edition, 1990.
[3] International Institute of Welding document IIW-1823-07 / XIII-2151r4-07 / XV-1254r4-07 :
Fatigue design of welded joints and components, December 2008.
[4] Gurney, T. R. : The Basis of the Revised Fatigue Design Rules, Department of Energy, Paper 55, 2nd
International Conference on Welded Structures, London, 1982.
[5] Yagi, J., Machida, S., Tomita, Y., Matoba, M. and Soya, I. : Influencing factors on thickness effect of
TSCF 2013 Shipbuilders Meeting
Page 12 of 12
fatigue strength in as-welded joints for steel structures, Journals of SNAJ, Vol.169, pp.289-299,
1991. (in Japanese)
[6] Yagi, J., Machida, S., Tomita, Y., Matoba, M. and Soya, I. : Thickness effect criterion for fa-tigue
evaluation of welded steel structures, Journals of SNAJ, Vol.169, pp.301-309, 1991. (in Japanese)
[7] Nakamura, T and Yamamoto, S : A Study on Thickness Effect on Welded Joint of Longitudinal
Stiffener, 10th International Symposium on Practical Design of Ships and Other Floating Structures,
Houston, 2007.
[8] Polezhayeva, H and Badger, C : Effect of Plate Thickness on Fatigue Strength of Base Material and
Butt Welded Specimens Made from EH40 Steel Thick Plates: Phase 1, Proceedings of the
Nineteenth International Offshore and Polar Engineering Conference, Osaka, Japan, 2009.
[9] Fukuoka, T and Mochizuki, K : Effect of Plate Thickness on Fatigue Strength of Typical Welded
Joints for a Ship Structure, IIW, XIII-2333-10, 2010.
[10] International Association of Classification Societies : Common structural rules for bulk carriers and
oil tankers, April 2013
[11] Siebel, E. and Stieler, M. : Ungleichformige Spannungsverteilung bei Schwingender Beanspruchung,
VDI Z., Nr. 97, pp.121-126, 1995.