Embed Size (px)
Citation preview
Japanese population norms for preference-based measures:EQ-5D-3L, EQ-5D-5L, and SF-6D
Takeru Shiroiwa1 • Takashi Fukuda1 • Shunya Ikeda2 • Ataru Igarashi3 •
Shinichi Noto4 • Shinya Saito5 • Kojiro Shimozuma6
Accepted: 17 August 2015 / Published online: 25 August 2015
� The Author(s) 2015. This article is published with open access at Springerlink.com
Abstract
Purpose The purpose of this study was to measure the
population norms for the Japanese versions of preference-
based measures (EQ-5D-3L, EQ-5D-5L, and SF-6D). We
also considered the relations between QOL score in the
general population and socio-demographic factors.
Methods A total of 1143 adult respondents (aged C
20 years) were randomly sampled from across Japan using
data from the Basic Resident Register. The health status of
each respondent was measured using the EQ-5D-3L, EQ-
5D-5L, and SF-6D, and responses regarding socio-demo-
graphic data as well as subjective diseases and symptoms
were obtained. The responses were converted to a QOL
score using Japanese value sets.
Results The percentages of respondents with full health
scores were 68 % (EQ-5D-3L), 55 % (EQ-5D-5L), and
4 % (SF-6D). The QOL score measured using the SF-6D
was significantly lower than those measured using either
EQ-5D score. The QOL score was significantly lower
among respondents over the age of 60 years, those who had
a lower income, and those who had a shorter period of
education. Intraclass correlation coefficient showed a poor
agreement between the EQ-5D and SF-6D scores. The
differences in QOL scores between respondents with and
those without any disease were 0.064 for the EQ-5D-3L,
0.061 for the EQ-5D-5L, and 0.073 for the SF-6D; these
differences are regarded as between-group minimal
important differences in the general population.
Conclusion The Japanese population norms of three
preference-based QOL measures were examined for the
first time. Such information is useful for economic evalu-
ations and research examining QOL score.
Keywords EQ-5D � SF-6D � Health-related quality of
life � Population norms � QALY � Japan
Introduction
When economic evaluations of healthcare technologies are
performed, the incremental cost-effectiveness ratio (ICER)
is regarded as a standard calculation. Various outcomes can
be used as the denominator of ICER, but quality-adjusted
life year (QALY) is widely applied for various areas of
cost-effectiveness analysis. One reason is that quality of
life (QOL) is one of the most important outcomes for not
only medical interventions, but also healthcare policies. To
calculate the QALY, the QOL score must be measured on a
scale of 0 (death) to 1 (full health). Preference-based
measures, such as the EuroQol 5-dimension (EQ-5D) [1,
2], the Health Utilities Index (HUI) [3–5], and the Short
Form 6-dimension (SF-6D) [6–8], have been developed to
calculate QOL scores. These measures were originally
& Takeru Shiroiwa
1 Department of Health and Welfare Services, National
Institute of Public Health, 2-3-6 Minami, Wako,
Saitama 351-0197, Japan
2 School of Pharmacy, International University of Health
and Welfare, Otawara, Japan
3 Graduate School of Pharmaceutical Sciences, The University
of Tokyo, Tokyo, Japan
4 Department of Health Sciences, Niigata University of Health
and Welfare, Niigata, Japan
5 Graduate School of Health Sciences, Okayama University,
Okayama, Japan
6 Department of Biomedical Sciences, College of Life
Sciences, Ritsumeikan University, Kyoto, Japan
123
Qual Life Res (2016) 25:707–719
DOI 10.1007/s11136-015-1108-2
developed in English but have been translated into many
languages. Japanese value sets for the EQ-5D (3L [9] and
5L [10]) and the SF-6D [11] have also been developed.
The mean QOL score in the general population is nor-
mally\1 because some people will have a less than full
health score. People with diseases or symptoms are likely
to continue living in their local community. Others may not
report their health state as full health even if they do not
have any diseases. Such reductions in QOL should be
reflected in QALY calculations for economic evaluations.
In addition, to interpret QOL scores obtained through a
survey, it is important to be compared with the score for the
general population as a reference value. Therefore, the
population norms, which have been previously defined as
‘‘population reference data… for a specific country or
international region’’ [12], used for preference-based
measures are essential for both researchers and policy-
makers. The norms for these measures, especially for the
EQ-5D-3L, have already been reported in many countries,
including the UK [13], USA [14, 15], six European coun-
tries (Belgium, France, Germany, Italy, Netherlands and
Spain) [16, 17], Spain (Catalonia) [18], Switzerland
(French-speaking population) [19], Finland [20], Denmark
[21], Portugal [22], Poland [23], Canada (Alberta) [24],
Australia (Queensland) [25], China [26], Taiwan [27],
Singapore [28, 29], Sri Lanka [30], and Brazil [31]. The
population norms for the SF-6D have also been investi-
gated in some countries, including the UK [32], USA [15],
Australia [33], Portugal [34], and Brazil [35]. However, the
Japanese population norms for QOL scores do not currently
exist, with the exception of surveys performed in three
areas [12] that were originally performed to obtain a value
set [9]. Few standard norms for the EQ-5D-5L, a newly
developed measure by the EuroQol Group, have been
reported across the world.
The population in Japan was about 12.5 million in 2015,
and almost all of the population speaks Japanese. Therefore,
Japanese versions of the EQ-5D-3L, EQ-5D-5L, and SF-6D
are widely used for calculating QOL scores in Japan, and
Japan’s economic evaluation guideline [36] recommends the
use of measures with value sets developed in Japan. The
Ministry of Health, Labour and Welfare (MHLW) of Japan
has collected data on these measures based on our concept.
They also collected responses to a questionnaire included in
the National Livelihood Survey, which Japan’s MHLW
performs annually. This questionnaire includes questions
regarding disease types and subjective symptoms.
Therefore, the objective of this study was to analyze
data to obtain the population norms for the Japanese ver-
sions of three preference-based measures: the EQ-5D-3L,
EQ-5D-5L, and SF-6D. The second objective was to
examine the characteristics of each measure and the rela-
tions among measures. We also aimed to present the
relation between the QOL score for the general population
and characteristics such as sex, age, diseases, symptoms,
and other socio-demographic factors.
Methods
Sampling
Data in this study came fromMHLW’s survey, which took a
representative sample. In the survey, a total of 1000 adult
respondents (aged C 20 years) were targeted in a random
sampling from 100 sites (municipalities). The method used
to select the 100 sites was as follows: First, the number of
sites in each region (8 regions) was determined in proportion
to the population of each region. Then, in every region, the
number of sites belonging to each stratum (prefecture 9 size
ofmunicipalities) was calculated based on the populations of
the stratum. The surveyed district (Cho-me, in Japanese) was
randomly determined in a manner corresponding to the
allocated number of sites in each stratum. Respondents were
also randomly sampled from each selected district, stratified
according to sex and age. People in a hospital or a nursing
home were not included.
The Basic Resident Register can be used to select
respondents living on each street in a random manner. In
Japan, each municipality has its own Basic Resident
Register data, which includes information on the name,
sex, address, and date of birth of all residents. Each
municipality has permitted the use of such data for public
surveys. A door-to-door survey was performed from Jan-
uary to March in 2013. Investigators visited the registered
addresses and distributed the questionnaire. They then
collected the questionnaires a few days later and checked
for any apparent errors (placement method). These visits
continued until the planned number of responses was col-
lected for each district. The investigators obtained the
informed consent of all the respondents.
Measures
Health status was measured using the EQ-5D-3L, EQ-5D-
5L, and SF-6D. The respondents were presented with the
EQ-5D-5L, EQ-5D-3L, and SF-6D (SF-36) in a fixed order.
In addition, socio-demographic data for the respondents,
such as sex, age, education, marital status, employment,
and household income, were also collected.
The EQ-5D was developed by the EuroQol Group. The
original version of the EQ-5D (now called the EQ-5D-3L)
is comprised of five items: ‘‘mobility,’’ ‘‘self-care,’’ ‘‘usual
activities,’’ ‘‘pain/discomfort,’’ and ‘‘anxiety/depression’’
assessed at three levels of description. To improve the lack
of a sufficient sensitivity and the ceiling effect of the EQ-
708 Qual Life Res (2016) 25:707–719
123
5D-3L, the newly developed EQ-5D-5L [37] has increased
the number of levels for each health dimension from three
to five.
The SF-6D is a measure for converting responses to the
SF-36 (or SF-12 [38]) to a preference-based QOL score for
economic evaluation. The SF-36 [39–41] is the most
widely used measure for assessing health states in the
world. Responses to selected items of the SF-36 can be
classified according to descriptions of the SF-6D system,
which consists of six dimensions [physical functioning
(PF), role limitation (RL), social functioning (SF), bodily
pain (BP), mental health (MH), and vitality (VT)] with five
or six levels (defining a total of 22,500 health states). As
the direct use of the SF-6D questionnaire is not recom-
mended, we used the Japanese SF-36, version 2 [42].
The questionnaire also included a part of the National
Livelihood Survey, which Japan’s MHLW performs annu-
ally. The questionnaire asks respondents whether they have
any diseases for which they consult a doctor or not and
whether they have any subjective symptoms or not. If they
answer ‘‘yes,’’ they must then select the most important
diseases and symptoms that they exhibit from a list of forty
symptoms (having a fever, feeling sluggish, sleeplessness,
etc.) and diseases (diabetes, obesity, hyperlipidemia, etc.).
Statistical analysis
The responses obtained for the EQ-5D-3L, EQ-5D-5L, and
SF-6D were first converted to QOL scores based on the
Japanese value sets. Summary statistics for the QOL scores
were calculated according to sex and age category (20–29,
30–39, 40–49, 50–59, 60–69, and 70 years and older). The
percentage of people reporting any problem in each
dimension was calculated after stratifying the subjects
according to sex and age category. Chi-square tests (or the
Fisher exact test if the expected frequency was low) were
applied to determine the significance between the fre-
quency of respondents with any problem and sex or age.
The McNemar test was performed to confirm the fre-
quencies of respondents with any problem in the EQ-5D-
3L and the EQ-5D-5L. The intraclass correlation coeffi-
cient (ICC) was used for reliability between the three
measures in addition to the Bland–Altman plot [43]. In the
Bland–Altman plot, the average of the two measures was
plotted on the x-axis, and the difference between the two
measurements on the y-axis was used to check for sys-
tematic errors.
To detect the influence of socio-demographic factors
and diseases/symptoms on the QOL scores, these variables
were added (in addition to sex and age) to an analysis of
variance (ANOVA). Diseases and symptoms for which
more than 10 respondents had responded positively or that
had a significant influence on the QOL score were included
in the above statistical model. The influence of each dis-
ease and symptom was estimated using an ANOVA that
included all the pertinent variables. The significance level
was set at 0.05. Statistical analyses were performed using
SAS 9.4.
We compared the QOL scores of the respondents
between those with any subjective diseases/symptoms and
those without using an ANOVA model. The difference was
interpreted as the between-group minimal important dif-
ference (MID) of each preference-based measure in the
general population. The MID, which corresponds to the
smallest improvement considered to be worthwhile by a
patient, is normally measured using a distribution-based or
anchor-based method. Reportedly, ‘‘anchor-based differ-
ences can be determined either cross-sectionally at a single
time point or longitudinally across multiple time points’’
[44]. The former cross-sectional anchor-based method was
applied to our data, as the diseases and subjective symp-
toms were regarded as the anchors for the between-group
MID.
This analysis was approved by the Ethics Committee of
the National Institute of Public Health.
Results
Socio-demographic factors
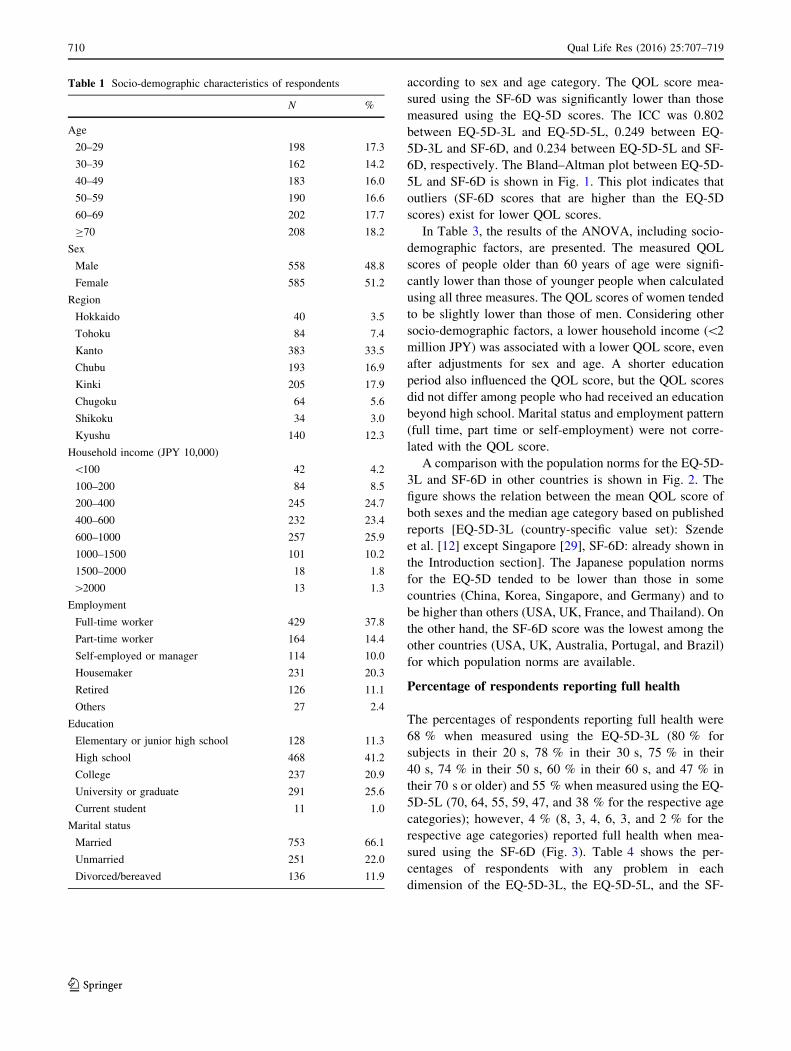
Table 1 shows the socio-demographic factors of the sam-
pled respondents. In total, the responses of 1143 respon-
dents were randomly collected. In 2013, 4.3 % of the
Japanese population lived in Hokkaido region, 7.1 % lived
in Tohoku, 33.5 % lived in Kanto, 16.9 % lived in Chubu,
17.8 % lived in Kinki, 5.9 % lived in Chugoku, 3.1 %
lived in Shikoku, and 11.4 % lived in Kyushu. The actual
Japanese median household income was JPY 4.3 million,
while the average was JPY 5.4 million in 2012. Married
and unmarried people accounted for 61.1 and 22.8 % of the
population, respectively. Overall, 19.1 % had graduated
from university. Note that this statistic reflects the actual
distribution of the population, but we sampled the same
number of respondents from each age category. This means
that the percentage among younger people was higher than
that of the entire Japanese population. Based on the
responses to the National Livelihood Survey, 48.2 % of the
respondents had some disease for which they were con-
sulting a doctor, while 48.6 % had some symptoms.
QOL score and relation to socio-demographic
factors
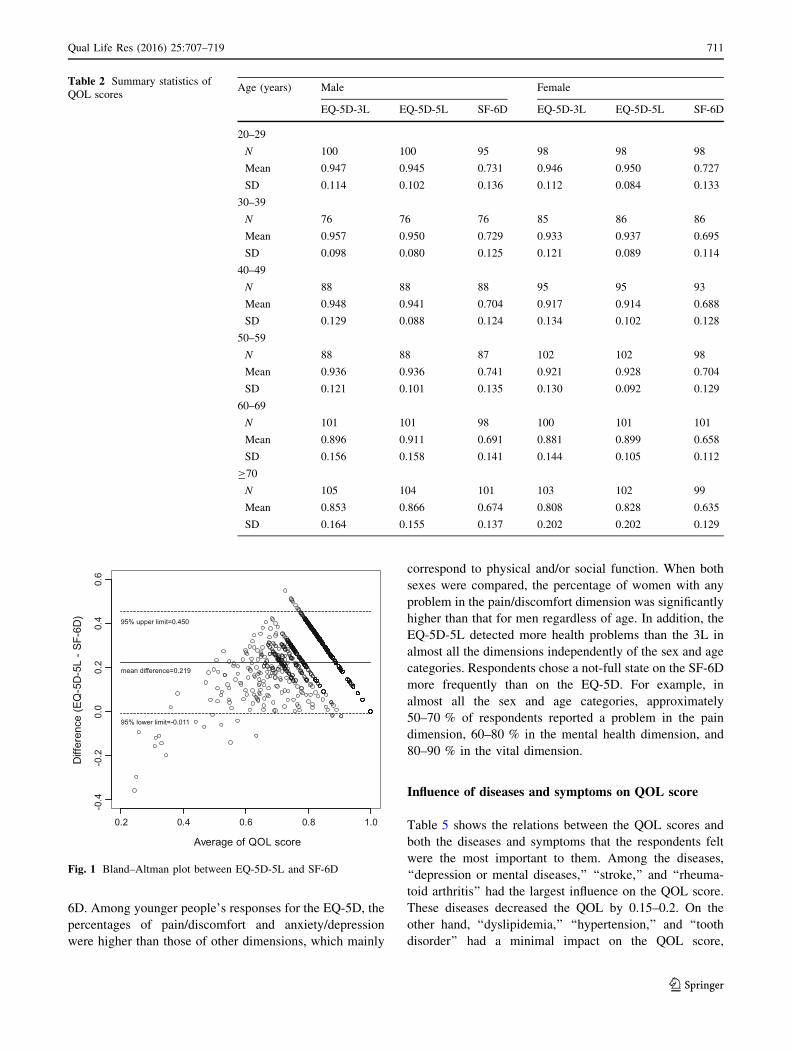
Table 2 shows the mean scores of the EQ-5D-3L, EQ-5D-
5L, and SF-6D in the general population classified
Qual Life Res (2016) 25:707–719 709
123
according to sex and age category. The QOL score mea-
sured using the SF-6D was significantly lower than those
measured using the EQ-5D scores. The ICC was 0.802
between EQ-5D-3L and EQ-5D-5L, 0.249 between EQ-
5D-3L and SF-6D, and 0.234 between EQ-5D-5L and SF-
6D, respectively. The Bland–Altman plot between EQ-5D-
5L and SF-6D is shown in Fig. 1. This plot indicates that
outliers (SF-6D scores that are higher than the EQ-5D
scores) exist for lower QOL scores.
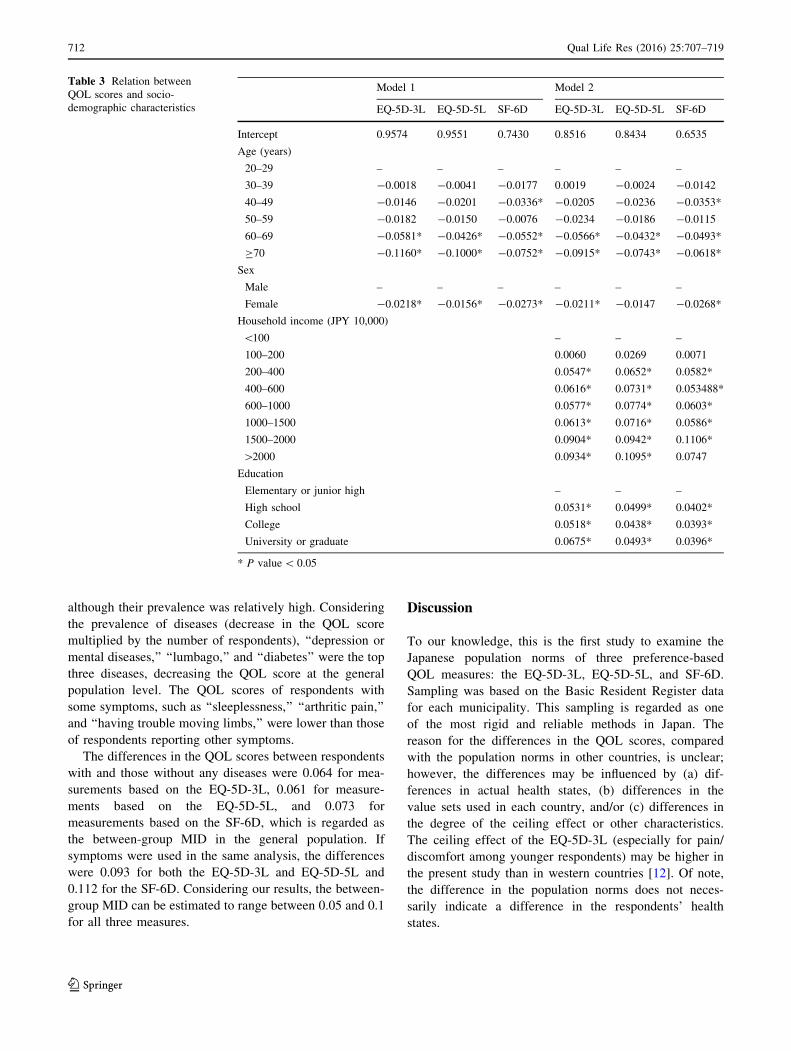
In Table 3, the results of the ANOVA, including socio-
demographic factors, are presented. The measured QOL
scores of people older than 60 years of age were signifi-
cantly lower than those of younger people when calculated
using all three measures. The QOL scores of women tended
to be slightly lower than those of men. Considering other
socio-demographic factors, a lower household income (\2
million JPY) was associated with a lower QOL score, even
after adjustments for sex and age. A shorter education
period also influenced the QOL score, but the QOL scores
did not differ among people who had received an education
beyond high school. Marital status and employment pattern
(full time, part time or self-employment) were not corre-
lated with the QOL score.
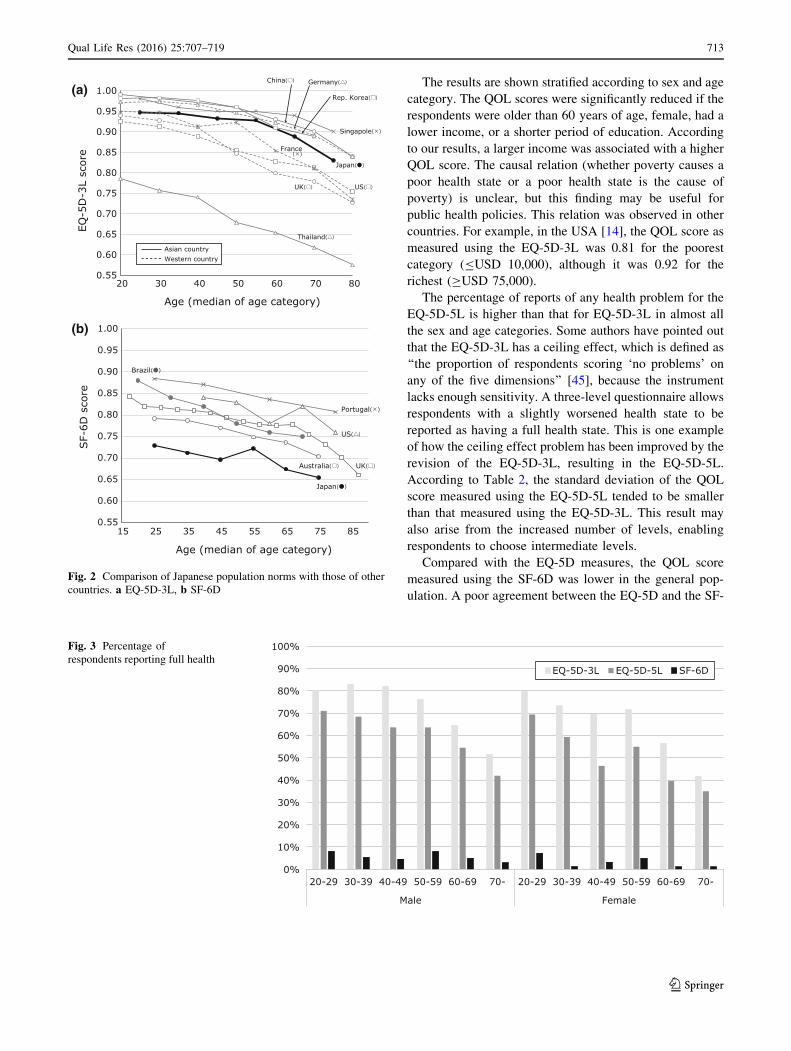
A comparison with the population norms for the EQ-5D-
3L and SF-6D in other countries is shown in Fig. 2. The
figure shows the relation between the mean QOL score of
both sexes and the median age category based on published
reports [EQ-5D-3L (country-specific value set): Szende
et al. [12] except Singapore [29], SF-6D: already shown in
the Introduction section]. The Japanese population norms
for the EQ-5D tended to be lower than those in some
countries (China, Korea, Singapore, and Germany) and to
be higher than others (USA, UK, France, and Thailand). On
the other hand, the SF-6D score was the lowest among the
other countries (USA, UK, Australia, Portugal, and Brazil)
for which population norms are available.
Percentage of respondents reporting full health
The percentages of respondents reporting full health were
68 % when measured using the EQ-5D-3L (80 % for
subjects in their 20 s, 78 % in their 30 s, 75 % in their
40 s, 74 % in their 50 s, 60 % in their 60 s, and 47 % in
their 70 s or older) and 55 % when measured using the EQ-
5D-5L (70, 64, 55, 59, 47, and 38 % for the respective age
categories); however, 4 % (8, 3, 4, 6, 3, and 2 % for the
respective age categories) reported full health when mea-
sured using the SF-6D (Fig. 3). Table 4 shows the per-
centages of respondents with any problem in each
dimension of the EQ-5D-3L, the EQ-5D-5L, and the SF-
Table 1 Socio-demographic characteristics of respondents
N %
Age
20–29 198 17.3
30–39 162 14.2
40–49 183 16.0
50–59 190 16.6
60–69 202 17.7
C70 208 18.2
Sex
Male 558 48.8
Female 585 51.2
Region
Hokkaido 40 3.5
Tohoku 84 7.4
Kanto 383 33.5
Chubu 193 16.9
Kinki 205 17.9
Chugoku 64 5.6
Shikoku 34 3.0
Kyushu 140 12.3
Household income (JPY 10,000)
\100 42 4.2
100–200 84 8.5
200–400 245 24.7
400–600 232 23.4
600–1000 257 25.9
1000–1500 101 10.2
1500–2000 18 1.8
[2000 13 1.3
Employment
Full-time worker 429 37.8
Part-time worker 164 14.4
Self-employed or manager 114 10.0
Housemaker 231 20.3
Retired 126 11.1
Others 27 2.4
Education
Elementary or junior high school 128 11.3
High school 468 41.2
College 237 20.9
University or graduate 291 25.6
Current student 11 1.0
Marital status
Married 753 66.1
Unmarried 251 22.0
Divorced/bereaved 136 11.9
710 Qual Life Res (2016) 25:707–719
123
6D. Among younger people’s responses for the EQ-5D, the
percentages of pain/discomfort and anxiety/depression
were higher than those of other dimensions, which mainly
correspond to physical and/or social function. When both
sexes were compared, the percentage of women with any
problem in the pain/discomfort dimension was significantly
higher than that for men regardless of age. In addition, the
EQ-5D-5L detected more health problems than the 3L in
almost all the dimensions independently of the sex and age
categories. Respondents chose a not-full state on the SF-6D
more frequently than on the EQ-5D. For example, in
almost all the sex and age categories, approximately
50–70 % of respondents reported a problem in the pain
dimension, 60–80 % in the mental health dimension, and
80–90 % in the vital dimension.
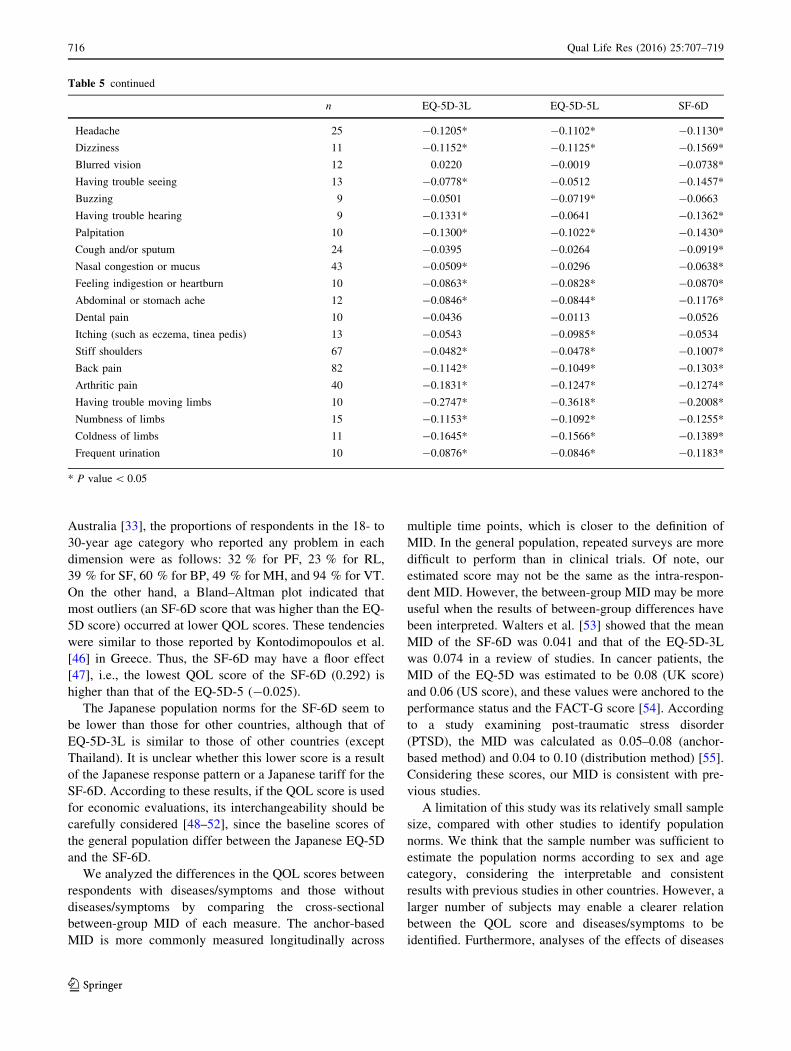
Influence of diseases and symptoms on QOL score
Table 5 shows the relations between the QOL scores and
both the diseases and symptoms that the respondents felt
were the most important to them. Among the diseases,
‘‘depression or mental diseases,’’ ‘‘stroke,’’ and ‘‘rheuma-
toid arthritis’’ had the largest influence on the QOL score.
These diseases decreased the QOL by 0.15–0.2. On the
other hand, ‘‘dyslipidemia,’’ ‘‘hypertension,’’ and ‘‘tooth
disorder’’ had a minimal impact on the QOL score,
Table 2 Summary statistics of
QOL scoresAge (years) Male Female
EQ-5D-3L EQ-5D-5L SF-6D EQ-5D-3L EQ-5D-5L SF-6D
20–29
N 100 100 95 98 98 98
Mean 0.947 0.945 0.731 0.946 0.950 0.727
SD 0.114 0.102 0.136 0.112 0.084 0.133
30–39
N 76 76 76 85 86 86
Mean 0.957 0.950 0.729 0.933 0.937 0.695
SD 0.098 0.080 0.125 0.121 0.089 0.114
40–49
N 88 88 88 95 95 93
Mean 0.948 0.941 0.704 0.917 0.914 0.688
SD 0.129 0.088 0.124 0.134 0.102 0.128
50–59
N 88 88 87 102 102 98
Mean 0.936 0.936 0.741 0.921 0.928 0.704
SD 0.121 0.101 0.135 0.130 0.092 0.129
60–69
N 101 101 98 100 101 101
Mean 0.896 0.911 0.691 0.881 0.899 0.658
SD 0.156 0.158 0.141 0.144 0.105 0.112
C70
N 105 104 101 103 102 99
Mean 0.853 0.866 0.674 0.808 0.828 0.635
SD 0.164 0.155 0.137 0.202 0.202 0.129
Average of QOL score
Diff
eren
ce (E
Q-5
D-5
L - S
F-6D
)
0.2 0.4 0.6 0.8 1.0
-0.4
-0.2
0.0
0.2
0.4
0.6
95% upper limit=0.450
mean difference=0.219
95% lower limit=-0.011
Fig. 1 Bland–Altman plot between EQ-5D-5L and SF-6D
Qual Life Res (2016) 25:707–719 711
123
although their prevalence was relatively high. Considering
the prevalence of diseases (decrease in the QOL score
multiplied by the number of respondents), ‘‘depression or
mental diseases,’’ ‘‘lumbago,’’ and ‘‘diabetes’’ were the top
three diseases, decreasing the QOL score at the general
population level. The QOL scores of respondents with
some symptoms, such as ‘‘sleeplessness,’’ ‘‘arthritic pain,’’
and ‘‘having trouble moving limbs,’’ were lower than those
of respondents reporting other symptoms.
The differences in the QOL scores between respondents
with and those without any diseases were 0.064 for mea-
surements based on the EQ-5D-3L, 0.061 for measure-
ments based on the EQ-5D-5L, and 0.073 for
measurements based on the SF-6D, which is regarded as
the between-group MID in the general population. If
symptoms were used in the same analysis, the differences
were 0.093 for both the EQ-5D-3L and EQ-5D-5L and
0.112 for the SF-6D. Considering our results, the between-
group MID can be estimated to range between 0.05 and 0.1
for all three measures.
Discussion
To our knowledge, this is the first study to examine the
Japanese population norms of three preference-based
QOL measures: the EQ-5D-3L, EQ-5D-5L, and SF-6D.
Sampling was based on the Basic Resident Register data
for each municipality. This sampling is regarded as one
of the most rigid and reliable methods in Japan. The
reason for the differences in the QOL scores, compared
with the population norms in other countries, is unclear;
however, the differences may be influenced by (a) dif-
ferences in actual health states, (b) differences in the
value sets used in each country, and/or (c) differences in
the degree of the ceiling effect or other characteristics.
The ceiling effect of the EQ-5D-3L (especially for pain/
discomfort among younger respondents) may be higher in
the present study than in western countries [12]. Of note,
the difference in the population norms does not neces-
sarily indicate a difference in the respondents’ health
states.
Table 3 Relation between
QOL scores and socio-
demographic characteristics
Model 1 Model 2
EQ-5D-3L EQ-5D-5L SF-6D EQ-5D-3L EQ-5D-5L SF-6D
Intercept 0.9574 0.9551 0.7430 0.8516 0.8434 0.6535
Age (years)
20–29 – – – – – –
30–39 -0.0018 -0.0041 -0.0177 0.0019 -0.0024 -0.0142
40–49 -0.0146 -0.0201 -0.0336* -0.0205 -0.0236 -0.0353*
50–59 -0.0182 -0.0150 -0.0076 -0.0234 -0.0186 -0.0115
60–69 -0.0581* -0.0426* -0.0552* -0.0566* -0.0432* -0.0493*
C70 -0.1160* -0.1000* -0.0752* -0.0915* -0.0743* -0.0618*
Sex
Male – – – – – –
Female -0.0218* -0.0156* -0.0273* -0.0211* -0.0147 -0.0268*
Household income (JPY 10,000)
\100 – – –
100–200 0.0060 0.0269 0.0071
200–400 0.0547* 0.0652* 0.0582*
400–600 0.0616* 0.0731* 0.053488*
600–1000 0.0577* 0.0774* 0.0603*
1000–1500 0.0613* 0.0716* 0.0586*
1500–2000 0.0904* 0.0942* 0.1106*
[2000 0.0934* 0.1095* 0.0747
Education
Elementary or junior high – – –
High school 0.0531* 0.0499* 0.0402*
College 0.0518* 0.0438* 0.0393*
University or graduate 0.0675* 0.0493* 0.0396*
* P value\ 0.05
712 Qual Life Res (2016) 25:707–719
123
The results are shown stratified according to sex and age
category. The QOL scores were significantly reduced if the
respondents were older than 60 years of age, female, had a
lower income, or a shorter period of education. According
to our results, a larger income was associated with a higher
QOL score. The causal relation (whether poverty causes a
poor health state or a poor health state is the cause of
poverty) is unclear, but this finding may be useful for
public health policies. This relation was observed in other
countries. For example, in the USA [14], the QOL score as
measured using the EQ-5D-3L was 0.81 for the poorest
category (BUSD 10,000), although it was 0.92 for the
richest (CUSD 75,000).
The percentage of reports of any health problem for the
EQ-5D-5L is higher than that for EQ-5D-3L in almost all
the sex and age categories. Some authors have pointed out
that the EQ-5D-3L has a ceiling effect, which is defined as
‘‘the proportion of respondents scoring ‘no problems’ on
any of the five dimensions’’ [45], because the instrument
lacks enough sensitivity. A three-level questionnaire allows
respondents with a slightly worsened health state to be
reported as having a full health state. This is one example
of how the ceiling effect problem has been improved by the
revision of the EQ-5D-3L, resulting in the EQ-5D-5L.
According to Table 2, the standard deviation of the QOL
score measured using the EQ-5D-5L tended to be smaller
than that measured using the EQ-5D-3L. This result may
also arise from the increased number of levels, enabling
respondents to choose intermediate levels.
Compared with the EQ-5D measures, the QOL score
measured using the SF-6D was lower in the general pop-
ulation. A poor agreement between the EQ-5D and the SF-
0.55
0.60
0.65
0.70
0.75
0.80
0.85
0.90
0.95
1.00
20 30 40 50 60 70 80
EQ-5
D-3
L sc
ore
Age (median of age category)
0.55
0.60
0.65
0.70
0.75
0.80
0.85
0.90
0.95
1.00
15 25 35 45 55 65 75 85
SF-
6D s
core
Age (median of age category)
Thailand
UK US
France
Japan( )
Singapole
China Germany
Rep. Korea
Japan
UK
Portugal
US
Australia
Brazil
Asian countryWestern country
(a)
(b)
Fig. 2 Comparison of Japanese population norms with those of other
countries. a EQ-5D-3L, b SF-6D
0%
10%
20%
30%
40%
50%
60%
70%
80%
90%
100%
20-29 30-39 40-49 50-59 60-69 70- 20-29 30-39 40-49 50-59 60-69 70-
Male Female
EQ-5D-3L EQ-5D-5L SF-6D
Fig. 3 Percentage of
respondents reporting full health
Qual Life Res (2016) 25:707–719 713
123
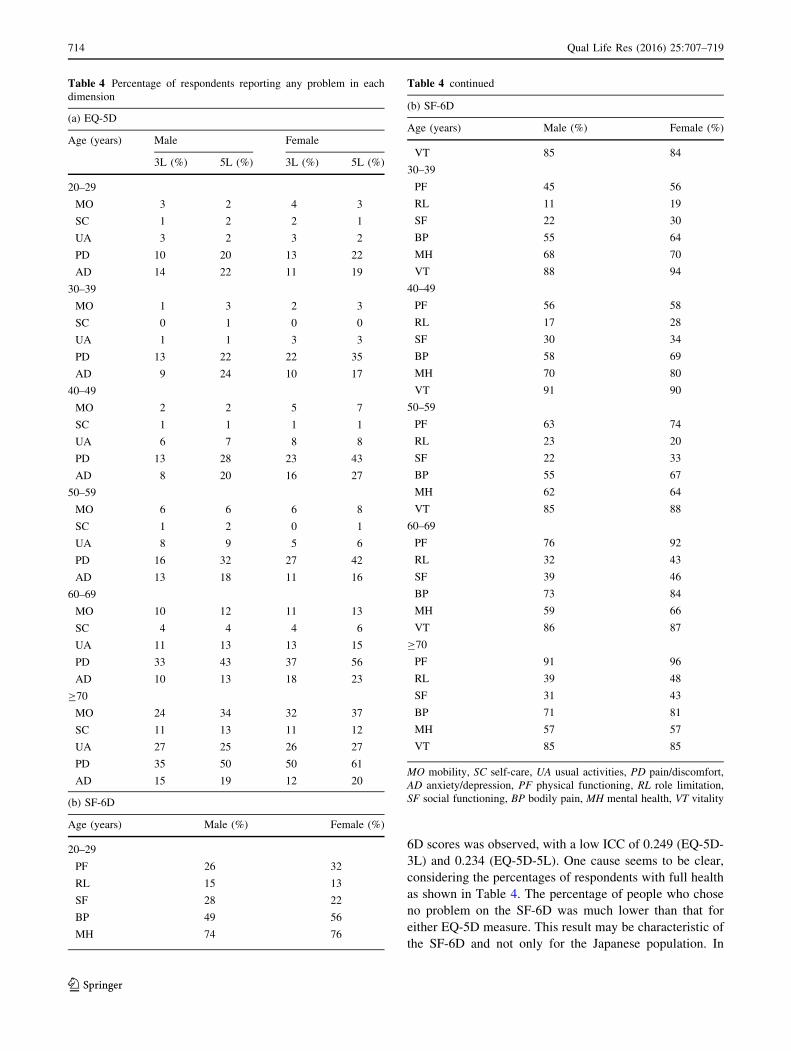
6D scores was observed, with a low ICC of 0.249 (EQ-5D-
3L) and 0.234 (EQ-5D-5L). One cause seems to be clear,
considering the percentages of respondents with full health
as shown in Table 4. The percentage of people who chose
no problem on the SF-6D was much lower than that for
either EQ-5D measure. This result may be characteristic of
the SF-6D and not only for the Japanese population. In
Table 4 Percentage of respondents reporting any problem in each
dimension
(a) EQ-5D
Age (years) Male Female
3L (%) 5L (%) 3L (%) 5L (%)
20–29
MO 3 2 4 3
SC 1 2 2 1
UA 3 2 3 2
PD 10 20 13 22
AD 14 22 11 19
30–39
MO 1 3 2 3
SC 0 1 0 0
UA 1 1 3 3
PD 13 22 22 35
AD 9 24 10 17
40–49
MO 2 2 5 7
SC 1 1 1 1
UA 6 7 8 8
PD 13 28 23 43
AD 8 20 16 27
50–59
MO 6 6 6 8
SC 1 2 0 1
UA 8 9 5 6
PD 16 32 27 42
AD 13 18 11 16
60–69
MO 10 12 11 13
SC 4 4 4 6
UA 11 13 13 15
PD 33 43 37 56
AD 10 13 18 23
C70
MO 24 34 32 37
SC 11 13 11 12
UA 27 25 26 27
PD 35 50 50 61
AD 15 19 12 20
(b) SF-6D
Age (years) Male (%) Female (%)
20–29
PF 26 32
RL 15 13
SF 28 22
BP 49 56
MH 74 76
Table 4 continued
(b) SF-6D
Age (years) Male (%) Female (%)
VT 85 84
30–39
PF 45 56
RL 11 19
SF 22 30
BP 55 64
MH 68 70
VT 88 94
40–49
PF 56 58
RL 17 28
SF 30 34
BP 58 69
MH 70 80
VT 91 90
50–59
PF 63 74
RL 23 20
SF 22 33
BP 55 67
MH 62 64
VT 85 88
60–69
PF 76 92
RL 32 43
SF 39 46
BP 73 84
MH 59 66
VT 86 87
C70
PF 91 96
RL 39 48
SF 31 43
BP 71 81
MH 57 57
VT 85 85
MO mobility, SC self-care, UA usual activities, PD pain/discomfort,
AD anxiety/depression, PF physical functioning, RL role limitation,
SF social functioning, BP bodily pain, MH mental health, VT vitality
714 Qual Life Res (2016) 25:707–719
123
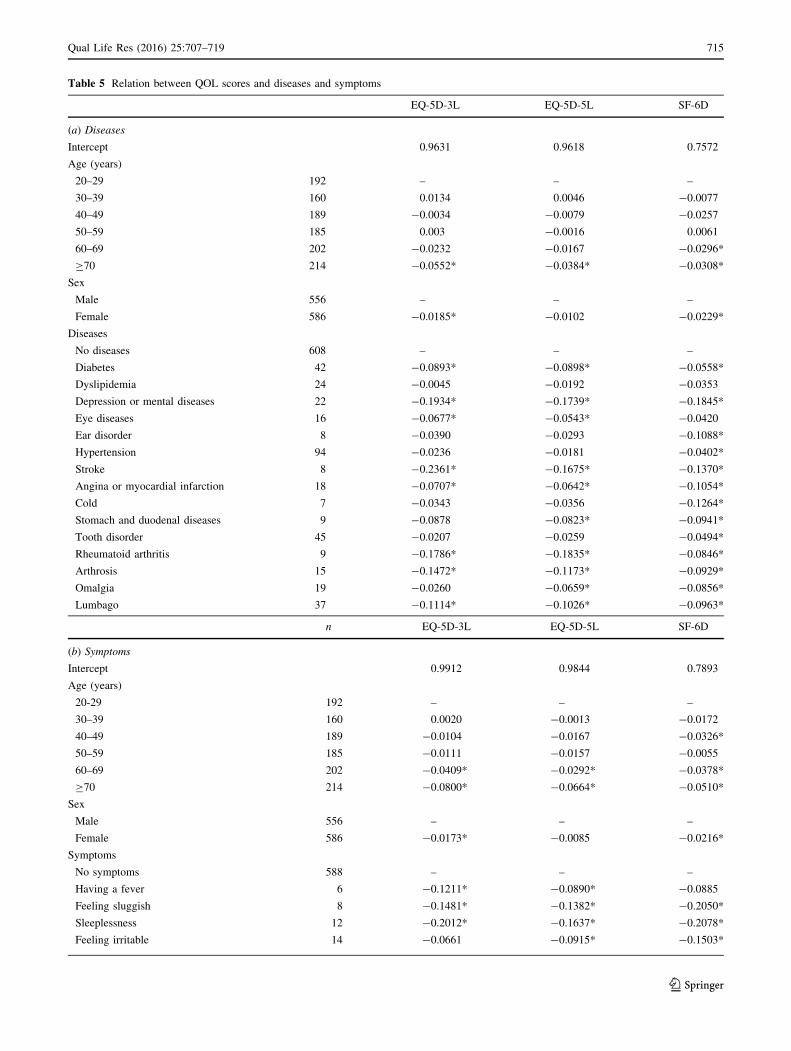
Table 5 Relation between QOL scores and diseases and symptoms
EQ-5D-3L EQ-5D-5L SF-6D
(a) Diseases
Intercept 0.9631 0.9618 0.7572
Age (years)
20–29 192 – – –
30–39 160 0.0134 0.0046 -0.0077
40–49 189 -0.0034 -0.0079 -0.0257
50–59 185 0.003 -0.0016 0.0061
60–69 202 -0.0232 -0.0167 -0.0296*
C70 214 -0.0552* -0.0384* -0.0308*
Sex
Male 556 – – –
Female 586 -0.0185* -0.0102 -0.0229*
Diseases
No diseases 608 – – –
Diabetes 42 -0.0893* -0.0898* -0.0558*
Dyslipidemia 24 -0.0045 -0.0192 -0.0353
Depression or mental diseases 22 -0.1934* -0.1739* -0.1845*
Eye diseases 16 -0.0677* -0.0543* -0.0420
Ear disorder 8 -0.0390 -0.0293 -0.1088*
Hypertension 94 -0.0236 -0.0181 -0.0402*
Stroke 8 -0.2361* -0.1675* -0.1370*
Angina or myocardial infarction 18 -0.0707* -0.0642* -0.1054*
Cold 7 -0.0343 -0.0356 -0.1264*
Stomach and duodenal diseases 9 -0.0878 -0.0823* -0.0941*
Tooth disorder 45 -0.0207 -0.0259 -0.0494*
Rheumatoid arthritis 9 -0.1786* -0.1835* -0.0846*
Arthrosis 15 -0.1472* -0.1173* -0.0929*
Omalgia 19 -0.0260 -0.0659* -0.0856*
Lumbago 37 -0.1114* -0.1026* -0.0963*
n EQ-5D-3L EQ-5D-5L SF-6D
(b) Symptoms
Intercept 0.9912 0.9844 0.7893
Age (years)
20-29 192 – – –
30–39 160 0.0020 -0.0013 -0.0172
40–49 189 -0.0104 -0.0167 -0.0326*
50–59 185 -0.0111 -0.0157 -0.0055
60–69 202 -0.0409* -0.0292* -0.0378*
C70 214 -0.0800* -0.0664* -0.0510*
Sex
Male 556 – – –
Female 586 -0.0173* -0.0085 -0.0216*
Symptoms
No symptoms 588 – – –
Having a fever 6 -0.1211* -0.0890* -0.0885
Feeling sluggish 8 -0.1481* -0.1382* -0.2050*
Sleeplessness 12 -0.2012* -0.1637* -0.2078*
Feeling irritable 14 -0.0661 -0.0915* -0.1503*
Qual Life Res (2016) 25:707–719 715
123
Australia [33], the proportions of respondents in the 18- to
30-year age category who reported any problem in each
dimension were as follows: 32 % for PF, 23 % for RL,
39 % for SF, 60 % for BP, 49 % for MH, and 94 % for VT.
On the other hand, a Bland–Altman plot indicated that
most outliers (an SF-6D score that was higher than the EQ-
5D score) occurred at lower QOL scores. These tendencies
were similar to those reported by Kontodimopoulos et al.
[46] in Greece. Thus, the SF-6D may have a floor effect
[47], i.e., the lowest QOL score of the SF-6D (0.292) is
higher than that of the EQ-5D-5 (-0.025).
The Japanese population norms for the SF-6D seem to
be lower than those for other countries, although that of
EQ-5D-3L is similar to those of other countries (except
Thailand). It is unclear whether this lower score is a result
of the Japanese response pattern or a Japanese tariff for the
SF-6D. According to these results, if the QOL score is used
for economic evaluations, its interchangeability should be
carefully considered [48–52], since the baseline scores of
the general population differ between the Japanese EQ-5D
and the SF-6D.
We analyzed the differences in the QOL scores between
respondents with diseases/symptoms and those without
diseases/symptoms by comparing the cross-sectional
between-group MID of each measure. The anchor-based
MID is more commonly measured longitudinally across
multiple time points, which is closer to the definition of
MID. In the general population, repeated surveys are more
difficult to perform than in clinical trials. Of note, our
estimated score may not be the same as the intra-respon-
dent MID. However, the between-group MID may be more
useful when the results of between-group differences have
been interpreted. Walters et al. [53] showed that the mean
MID of the SF-6D was 0.041 and that of the EQ-5D-3L
was 0.074 in a review of studies. In cancer patients, the
MID of the EQ-5D was estimated to be 0.08 (UK score)
and 0.06 (US score), and these values were anchored to the
performance status and the FACT-G score [54]. According
to a study examining post-traumatic stress disorder
(PTSD), the MID was calculated as 0.05–0.08 (anchor-
based method) and 0.04 to 0.10 (distribution method) [55].
Considering these scores, our MID is consistent with pre-
vious studies.
A limitation of this study was its relatively small sample
size, compared with other studies to identify population
norms. We think that the sample number was sufficient to
estimate the population norms according to sex and age
category, considering the interpretable and consistent
results with previous studies in other countries. However, a
larger number of subjects may enable a clearer relation
between the QOL score and diseases/symptoms to be
identified. Furthermore, analyses of the effects of diseases
Table 5 continued
n EQ-5D-3L EQ-5D-5L SF-6D
Headache 25 -0.1205* -0.1102* -0.1130*
Dizziness 11 -0.1152* -0.1125* -0.1569*
Blurred vision 12 0.0220 -0.0019 -0.0738*
Having trouble seeing 13 -0.0778* -0.0512 -0.1457*
Buzzing 9 -0.0501 -0.0719* -0.0663
Having trouble hearing 9 -0.1331* -0.0641 -0.1362*
Palpitation 10 -0.1300* -0.1022* -0.1430*
Cough and/or sputum 24 -0.0395 -0.0264 -0.0919*
Nasal congestion or mucus 43 -0.0509* -0.0296 -0.0638*
Feeling indigestion or heartburn 10 -0.0863* -0.0828* -0.0870*
Abdominal or stomach ache 12 -0.0846* -0.0844* -0.1176*
Dental pain 10 -0.0436 -0.0113 -0.0526
Itching (such as eczema, tinea pedis) 13 -0.0543 -0.0985* -0.0534
Stiff shoulders 67 -0.0482* -0.0478* -0.1007*
Back pain 82 -0.1142* -0.1049* -0.1303*
Arthritic pain 40 -0.1831* -0.1247* -0.1274*
Having trouble moving limbs 10 -0.2747* -0.3618* -0.2008*
Numbness of limbs 15 -0.1153* -0.1092* -0.1255*
Coldness of limbs 11 -0.1645* -0.1566* -0.1389*
Frequent urination 10 -0.0876* -0.0846* -0.1183*
* P value\ 0.05
716 Qual Life Res (2016) 25:707–719
123
with small prevalence could not be performed. Another
limitation is the order in which the three instruments were
presented to the respondents. As the order was fixed, and
not randomized, the possible influence of the order on the
results cannot be excluded based only on our data.
In conclusion, we demonstrated the following charac-
teristics of three preference-based measures: (a) the Japa-
nese population norms according to sex and age category,
(b) the relation between QOL scores and socio-demo-
graphic factors, (c) the reliability of the three measures in
the general Japanese population, (d) the percentage of
reports of any problem, (e) the influence of diseases/
symptoms on the QOL scores, and (f) the between-group
MID. The respondents were randomly collected from all
eight regions of Japan in a door-to-door survey, and the
representativeness of the sample was considered to be
good. The resulting information may be useful for calcu-
lating QALY in economic evaluations and research
examining QOL score.
Acknowledgments We thank Makoto Kobayashi (CRECON
MEDICAL ASSESSMENT INC.) for advice and support concerning
this project. This work was supported by JSPS KAKENHI Grant No.
25871156.
Funding This study was funded by Grant-in-Aid for Scientific
Research (KAKENHI) from Japan Society for the Promotion of
Science (JSPS).
Compliance with ethical standards
Conflict of interest We have no conflict of interest to declare.
Ethical approval This article does not contain any studies with
human participants performed by any of the authors.
Open Access This article is distributed under the terms of the
Creative Commons Attribution 4.0 International License (http://crea
tivecommons.org/licenses/by/4.0/), which permits unrestricted use,
distribution, and reproduction in any medium, provided you give
appropriate credit to the original author(s) and the source, provide a
link to the Creative Commons license, and indicate if changes were
made.
References
1. Brooks, R. (1996). EuroQol: The current state of play. Health
Policy, 37(1), 53–72.
2. Dolan, P. (1997). Modeling valuations for EuroQol health states.
Medical Care, 35(11), 1095–1108.
3. Feeny, D., Furlong, W., Boyle, M., & Torrance, G. W. (1995).
Multi-attribute health status classification systems. Health Utili-
ties Index. Pharmacoeconomics, 7(6), 490–502.
4. Torrance, G. W., Furlong, W., Feeny, D., & Boyle, M. (1995).
Multi-attribute preference functions. Health Utilities Index.
Pharmacoeconomics, 7(6), 503–520.
5. Torrance, G. W., Feeny, D. H., Furlong, W. J., Barr, R. D.,
Zhang, Y., & Wang, Q. (1996). Multiattribute utility function for
a comprehensive health status classification system. Health
Utilities Index Mark 2. Medical Care, 34(7), 702–722.
6. Brazier, J., Usherwood, T., Harper, R., & Thomas, K. (1998).
Deriving a preference-based single index from the UK SF-36
health survey. Journal of Clinical Epidemiology, 51(11),
1115–1128.
7. Brazier, J., Roberts, J., & Deverill, M. (2002). The estimation of a
preference-based measure of health from the SF-36. Journal of
Health Economics, 21(2), 271–292.
8. Kharroubi, S. A., Brazier, J. E., Roberts, J., & O’Hagan, A.
(2007). Modelling SF-6D health state preference data using a
nonparametric Bayesian method. Journal of Health Economics,
26(3), 597–612. doi:10.1016/j.jhealeco.2006.09.002.
9. Tsuchiya, A., Ikeda, S., Ikegami, N., Nishimura, S., Sakai, I.,
Fukuda, T., et al. (2002). Estimating an EQ-5D population value
set: The case of Japan. Health Economics, 11(4), 341–353.
doi:10.1002/hec.673.
10. Ikeda, S., Shiroiwa, T., Igarashi, I., Noto, S., Fukuda, T., Saito,
S., et al. (2015). Developing a Japanese version of the EQ-5D-5L
value set. Journal of the National Institute of Public Health,
64(1), 47–55. doi:10.1007/s10198-013-0474-3. (in Japanese).11. Brazier, J. E., Fukuhara, S., Roberts, J., Kharroubi, S., Yama-
moto, Y., Ikeda, S., et al. (2009). Estimating a preference-based
index from the Japanese SF-36. Journal of Clinical Epidemiol-
ogy, 62(12), 1323–1331. doi:10.1016/j.jclinepi.2009.01.022.
12. Szende, A., Janssen, B., & Cabases, J. (Eds.). (2014). Self-re-
ported population health: An international perspective based on
EQ-5D. Netherlands: Dordrecht Springer.
13. Kind, P., Dolan, P., Gudex, C., & Williams, A. (1998). Variations
in population health status: Results from a United Kingdom
national questionnaire survey. BMJ, 316(7133), 736–741.
14. Luo, N., Johnson, J. A., Shaw, J. W., Feeny, D., & Coons, S. J.
(2005). Self-reported health status of the general adult US pop-
ulation as assessed by the EQ-5D and Health Utilities Index.
Medical Care, 43(11), 1078–1086.
15. Fryback, D. G., Dunham, N. C., Palta, M., Hanmer, J., Buechner,
J., Cherepanov, D., et al. (2007). US norms for six generic health-
related quality-of-life indexes from the National Health Mea-
surement Study. Medical Care, 45(12), 1162–1170. doi:10.1097/
MLR.0b013e31814848f1.
16. Konig, H. H., Bernert, S., Angermeyer, M. C., Matschinger, H.,
Martinez, M., Vilagut, G., et al. (2009). Comparison of popula-
tion health status in six european countries: Results of a repre-
sentative survey using the EQ-5D questionnaire. Medical Care,
47(2), 255–261. doi:10.1097/MLR.0b013e318184759e.
17. Konig, H. H., Heider, D., Lehnert, T., Riedel-Heller, S. G.,
Angermeyer, M. C., Matschinger, H., et al. (2010). Health status
of the advanced elderly in six European countries: Results from a
representative survey using EQ-5D and SF-12. Health and
Quality of Life Outcomes, 8, 143. doi:10.1186/1477-7525-8-143.
18. Cunillera, O., Tresserras, R., Rajmil, L., Vilagut, G., Brugulat, P.,
Herdman, M., et al. (2010). Discriminative capacity of the EQ-
5D, SF-6D, and SF-12 as measures of health status in population
health survey. Quality of Life Research, 19(6), 853–864. doi:10.
1007/s11136-010-9639-z.
19. Perneger, T. V., Combescure, C., & Courvoisier, D. S. (2010).
General population reference values for the French version of the
EuroQol EQ-5D health utility instrument. Value Health, 13(5),
631–635. doi:10.1111/j.1524-4733.2010.00727.x.
20. Saarni, S. I., Harkanen, T., Sintonen, H., Suvisaari, J., Koskinen,
S., Aromaa, A., et al. (2006). The impact of 29 chronic conditions
on health-related quality of life: A general population survey in
Finland using 15D and EQ-5D. Quality of Life Research, 15(8),
1403–1414. doi:10.1007/s11136-006-0020-1.
21. Sorensen, J., Davidsen, M., Gudex, C., Pedersen, K. M., &
Bronnum-Hansen, H. (2009). Danish EQ-5D population norms.
Qual Life Res (2016) 25:707–719 717
123
Scandinavian Journal of Public Health, 37(5), 467–474. doi:10.
1177/1403494809105286.
22. Ferreira, L. N., Ferreira, P. L., Pereira, L. N., & Oppe, M. (2014).
EQ-5D Portuguese population norms. Quality of Life Research,
23(2), 425–430. doi:10.1007/s11136-013-0488-4.
23. Golicki, D., & Niewada, M. (2015). General population reference
values for 3-level EQ-5D (EQ-5D-3L) questionnaire in Poland.
Polskie Archiwum Medycyny Wewnetrznej, 125(1–2), 18–26.
24. Johnson, J. A., & Pickard, A. S. (2000). Comparison of the EQ-
5D and SF-12 health surveys in a general population survey in
Alberta, Canada. Medical Care, 38(1), 115–121.
25. Clemens, S., Begum, N., Harper, C., Whitty, J. A., & Scuffham,
P. A. (2014). A comparison of EQ-5D-3L population norms in
Queensland, Australia, estimated using utility value sets from
Australia, the UK and USA. Quality of Life Research, 23(8),
2375–2381. doi:10.1007/s11136-014-0676-x.
26. Sun, S., Chen, J., Johannesson, M., Kind, P., Xu, L., Zhang, Y.,
et al. (2011). Population health status in China: EQ-5D results, by
age, sex and socio-economic status, from the national health
services survey 2008. Quality of Life Research, 20(3), 309–320.
doi:10.1007/s11136-010-9762-x.
27. Yu, S. T., Chang, H. Y., Yao, K. P., Lin, Y. H., & Hurng, B. S.
(2015). Validity of EQ-5D in general population of Taiwan:
Results of the 2009 national health interview and drug abuse
survey of Taiwan. Quality of Life Research,. doi:10.1007/s11136-
015-0978-7.
28. Abdin, E., Subramaniam, M., Vaingankar, J. A., Luo, N., &
Chong, S. A. (2013). Measuring health-related quality of life
among adults in Singapore: Population norms for the EQ-5D.
Quality of Life Research, 22(10), 2983–2991. doi:10.1007/
s11136-013-0405-x.
29. Abdin, E., Subramaniam, M., Vaingankar, J. A., Luo, N., &
Chong, S. A. (2014). Population norms for the EQ-5D index
scores using Singapore preference weights. Quality of Life
Research,. doi:10.1007/s11136-014-0859-5.
30. Kularatna, S., Whitty, J. A., Johnson, N. W., Jayasinghe, R., &
Scuffham, P. A. (2014). EQ-5D-3L derived population norms for
health related quality of life in Sri Lanka. PLoS One, 9(11),
e108434. doi:10.1371/journal.pone.0108434.
31. Menezes, R. M., Andrade, M. V., Noronha, K. V., & Kind, P.
(2015). EQ-5D-3L as a health measure of Brazilian adult popu-
lation. Quality of Life Research,. doi:10.1007/s11136-015-0994-
7.
32. van den Berg, B. (2012). Sf-6d population norms. Health Eco-
nomics, 21(12), 1508–1512. doi:10.1002/hec.1823.
33. Norman, R., Church, J., van den Berg, B., & Goodall, S. (2013).
Australian health-related quality of life population norms derived
from the SF-6D. Australian and New Zealand Journal of Public
Health, 37(1), 17–23. doi:10.1111/1753-6405.12005.
34. Ferreira, P. L., Ferreira, L. N., & Pereira, L. N. (2015). SF-6D
Portuguese population norms. The European Journal of Health
Economics, 16(3), 235–241. doi:10.1007/s10198-014-0568-6.
35. Ciconelli, R. M., Ferraz, M. B., Kowalski, S., Pinheiro, G. R. C.,
& Sato, E. I. (2015). Brazilian urban population norms derived
from the health-related quality of life SF-6D. Quality of Life
Research,. doi:10.1007/s11136-015-0991-x.
36. Fukuda, T., Shiroiwa, T., Ikeda, S., Igarashi, I., Akazawa, M.,
Ishida, H., et al. (2013). Guideline for economic evaluation of
healthcare technologies in Japan. Journal of the National Institute
of Public Health, 62(6), 625–640. doi:10.1007/s10198-013-0474-
3. (in Japanese).37. Herdman, M., Gudex, C., Lloyd, A., Janssen, M., Kind, P., Par-
kin, D., et al. (2011). Development and preliminary testing of the
new five-level version of EQ-5D (EQ-5D-5L). Quality of Life
Research, 20(10), 1727–1736. doi:10.1007/s11136-011-9903-x.
38. Brazier, J. E., & Roberts, J. (2004). The estimation of a prefer-
ence-based measure of health from the SF-12. Medical Care,
42(9), 851–859.
39. Ware, J. E, Jr, & Sherbourne, C. D. (1992). The MOS 36-item
short-form health survey (SF-36). I. Conceptual framework and
item selection. Medical Care, 30(6), 473–483.
40. Fukuhara, S., Bito, S., Green, J., Hsiao, A., & Kurokawa, K.
(1998). Translation, adaptation, and validation of the SF-36
Health Survey for use in Japan. Journal of Clinical Epidemiology,
51(11), 1037–1044.
41. Fukuhara, S., Ware, J. E, Jr, Kosinski, M., Wada, S., & Gandek,
B. (1998). Psychometric and clinical tests of validity of the
Japanese SF-36 Health Survey. Journal of Clinical Epidemiology,
51(11), 1045–1053.
42. Jenkinson, C., Stewart-Brown, S., Petersen, S., & Paice, C.
(1999). Assessment of the SF-36 version 2 in the United King-
dom. Journal of Epidemiology and Community Health, 53(1),
46–50.
43. Bland, J. M., & Altman, D. G. (1986). Statistical methods for
assessing agreement between two methods of clinical measure-
ment. The Lancet, 1(8476), 307–310.
44. Eton, D. T., Cella, D., Yost, K. J., Yount, S. E., Peterman, A. H.,
Neuberg, D. S., et al. (2004). A combination of distribution- and
anchor-based approaches determined minimally important dif-
ferences (MIDs) for four endpoints in a breast cancer scale.
Journal of Clinical Epidemiology, 57(9), 898–910. doi:10.1016/j.
jclinepi.2004.01.012.
45. Janssen, M. F., Pickard, A. S., Golicki, D., Gudex, C., Niewada,
M., Scalone, L., et al. (2013). Measurement properties of the EQ-
5D-5L compared to the EQ-5D-3L across eight patient groups: A
multi-country study. Quality of Life Research, 22(7), 1717–1727.
doi:10.1007/s11136-012-0322-4.
46. Kontodimopoulos, N., Pappa, E., Papadopoulos, A. A., Tountas,
Y., & Niakas, D. (2009). Comparing SF-6D and EQ-5D utilities
across groups differing in health status. Quality of Life Research,
18(1), 87–97. doi:10.1007/s11136-008-9420-8.
47. Brazier, J., Roberts, J., Tsuchiya, A., & Busschbach, J. (2004). A
comparison of the EQ-5D and SF-6D across seven patient groups.
Health Economics, 13(9), 873–884. doi:10.1002/hec.866.
48. Ferreira, P. L., Ferreira, L. N., & Pereira, L. N. (2008). How
consistent are health utility values? Quality of Life Research,
17(7), 1031–1042. doi:10.1007/s11136-008-9368-8.
49. Whitehurst, D. G., & Bryan, S. (2011). Another study showing
that two preference-based measures of health-related quality of
life (EQ-5D and SF-6D) are not interchangeable. But why should
we expect them to be? Value Health, 14(4), 531–538. doi:10.
1016/j.jval.2010.09.002.
50. De Smedt, D., Clays, E., Annemans, L., & De Bacquer, D.
(2014). EQ-5D versus SF-12 in coronary patients: Are they
interchangeable? Value Health, 17(1), 84–89. doi:10.1016/j.jval.
2013.10.010.
51. van Stel, H. F., & Buskens, E. (2006). Comparison of the SF-6D
and the EQ-5D in patients with coronary heart disease. Health
and Quality of Life Outcomes, 4, 20. doi:10.1186/1477-7525-4-
20.
52. Yang, F., Lau, T., Lee, E., Vathsala, A., Chia, K. S., & Luo, N.
(2014). Comparison of the preference-based EQ-5D-5L and SF-
6D in patients with end-stage renal disease (ESRD). The Euro-
pean Journal of Health Economics,. doi:10.1007/s10198-014-
0664-7.
53. Walters, S. J., & Brazier, J. E. (2005). Comparison of the mini-
mally important difference for two health state utility measures:
EQ-5D and SF-6D. Quality of Life Research, 14(6), 1523–1532.
54. Pickard, A. S., Neary, M. P., & Cella, D. (2007). Estimation of
minimally important differences in EQ-5D utility and VAS scores
718 Qual Life Res (2016) 25:707–719
123

in cancer. Health and Quality of Life Outcomes, 5, 70. doi:10.
1186/1477-7525-5-70.
55. Le, Q. A., Doctor, J. N., Zoellner, L. A., & Feeny, N. C. (2013).
Minimal clinically important differences for the EQ-5D and
QWB-SA in post-traumatic stress disorder (PTSD): Results from
a doubly randomized preference trial (DRPT). Health and
Quality of Life Outcomes, 11, 59. doi:10.1186/1477-7525-11-59.
Qual Life Res (2016) 25:707–719 719
123