Embed Size (px)
Citation preview

Japan's Balance of Payments Statistics and
International Investment Position for 2020
August 2021
International Department
Bank of Japan
This report is an English translation of the Japanese original released on July 8, 2021.
Japan's balance of payments statistics for 2020 -- the annually revised figures for the first
through the third quarter of 2020 and the second preliminary figures for the fourth quarter of
2020 -- were released on April 8, 2021, by the Ministry of Finance and the Bank of Japan in
the Balance of Payments.
Japan's international investment position at year-end 2020 was released on May 25, 2021, by
the Ministry of Finance and the Bank as the International Investment Position of Japan (End
of 2020).

Please contact below in advance to request permission when reproducing or copying the
content of this report for commercial purposes.
Please credit the source when reproducing or copying the content of this report.
Balance of Payments Division,
International Department, Bank of Japan
E-mail: [email protected]
i
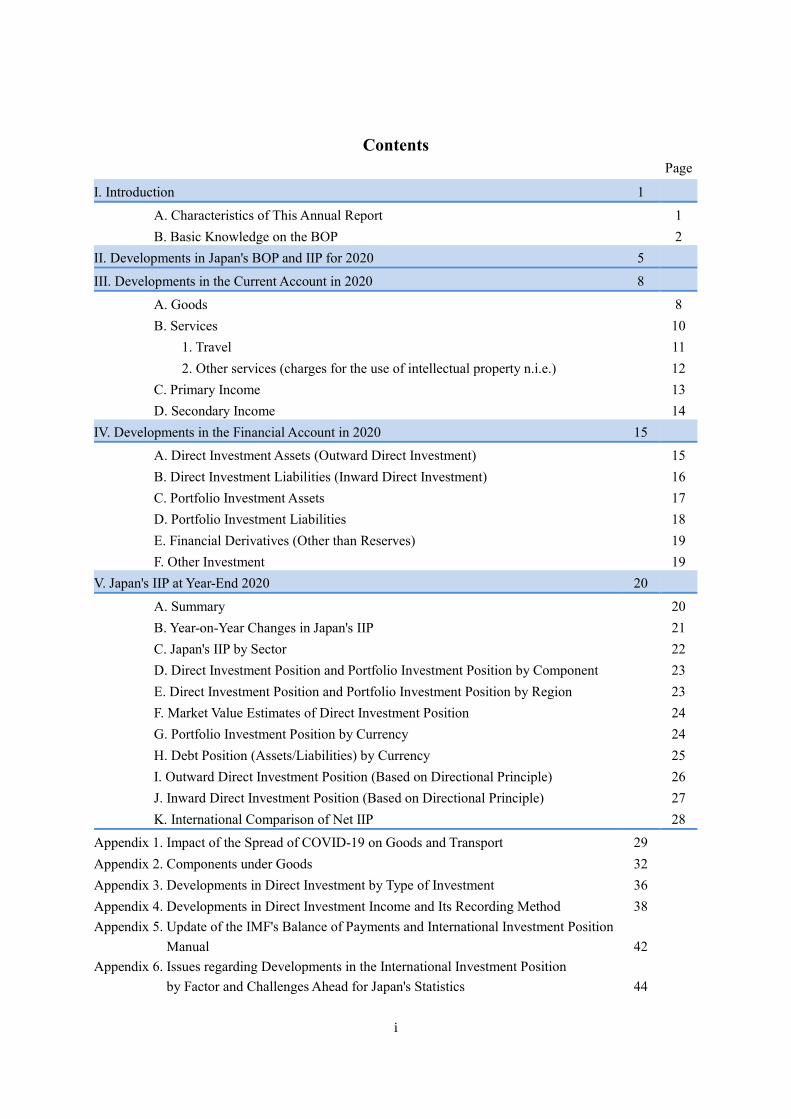
Contents
Page
I. Introduction 1
A. Characteristics of This Annual Report 1
B. Basic Knowledge on the BOP 2
II. Developments in Japan's BOP and IIP for 2020 5
III. Developments in the Current Account in 2020 8
A. Goods 8
B. Services 10
1. Travel 11
2. Other services (charges for the use of intellectual property n.i.e.) 12
C. Primary Income 13
D. Secondary Income 14
IV. Developments in the Financial Account in 2020 15
A. Direct Investment Assets (Outward Direct Investment) 15
B. Direct Investment Liabilities (Inward Direct Investment) 16
C. Portfolio Investment Assets 17
D. Portfolio Investment Liabilities 18
E. Financial Derivatives (Other than Reserves) 19
F. Other Investment 19
V. Japan's IIP at Year-End 2020 20
A. Summary 20
B. Year-on-Year Changes in Japan's IIP 21
C. Japan's IIP by Sector 22
D. Direct Investment Position and Portfolio Investment Position by Component 23
E. Direct Investment Position and Portfolio Investment Position by Region 23
F. Market Value Estimates of Direct Investment Position 24
G. Portfolio Investment Position by Currency 24
H. Debt Position (Assets/Liabilities) by Currency 25
I. Outward Direct Investment Position (Based on Directional Principle) 26
J. Inward Direct Investment Position (Based on Directional Principle) 27
K. International Comparison of Net IIP 28
Appendix 1. Impact of the Spread of COVID-19 on Goods and Transport 29
Appendix 2. Components under Goods 32
Appendix 3. Developments in Direct Investment by Type of Investment 36
Appendix 4. Developments in Direct Investment Income and Its Recording Method 38
Appendix 5. Update of the IMF's Balance of Payments and International Investment Position
Manual
42
Appendix 6. Issues regarding Developments in the International Investment Position
by Factor and Challenges Ahead for Japan's Statistics
44

ii
Explanatory Notes
- Unless otherwise noted, the figures and charts in this report are based on data from the
balance of payments related statistics, such as the Balance of Payments and the
International Investment Position, jointly released by the Bank of Japan and the Ministry
of Finance.
- Figures from 2014 onward are compiled based on the sixth edition of the Balance of
Payments and International Investment Position Manual (BPM6) published by the
International Monetary Fund (IMF).
- In principle, figures before 2014 in this report use "historical data rearranged based on
the BPM6," in which figures that were originally compiled based on the fifth edition of
the Balance of Payments Manual (BPM5) were rearranged in accordance with the BPM6
to the greatest extent possible. However, unless otherwise stated, figures by partner
economy, including those by region, have been compiled based on the BPM5. For this
reason, the totals may differ from corresponding data underlying the charts using
"historical data rearranged based on the BPM6." Moreover, for figures for portfolio
investment and "other investment" under the financial account, those compiled based on
the BPM5 excluding securities lending transactions are used so that the data are
comparable with the BPM6-based data.
- In the Direct Investment by Region and Industry statistics, figures for flows under the
financial account and those for positions are compiled based on the directional principle,
while those for income under primary income in the current account are compiled based
on the asset and liability principle. For the difference between the two principles, see
Recording Principles of Direct Investment on the Bank's website.

1
I. Introduction
A. Characteristics of This Annual Report
The balance of payments (BOP) is a set of statistics that records the international transactions
of an economy with the rest of the world -- trade in goods and services, financial transactions
in securities and other assets, as well as the associated financial flows -- in a comprehensive
and systematic manner. The financial assets and liabilities arising as a result of such
transactions are recorded in the international investment position (IIP). The BOP and IIP are
compiled in accordance with the Balance of Payments and International Investment Position
Manual published by the International Monetary Fund (IMF), so that figures for Japan and
other countries can be aggregated and compared.
Japan's BOP and IIP (which together, including breakdowns by partner economy, are referred
to as the "BOP related statistics") are compiled mainly from reports prepared by government
offices, financial institutions, business corporations, and individuals based on the Foreign
Exchange and Foreign Trade Act. The number of such reports used for the statistics amounts
to over 400 thousand a year. The BOP related statistics are employed as source data for the
System of National Accounts statistics and the Flow of Funds Accounts statistics. In addition,
they are provided to international organizations such as the IMF and the Organisation for
Economic Co-operation and Development (OECD) and are employed to gauge and analyze
global economic and financial developments.
The International Department of the Bank of Japan annually releases a report summarizing
developments in Japan's BOP and IIP during the preceding year. The report contains a section
entitled "Basic Knowledge on the BOP" to allow those looking at these statistics for the first
time to gain a basic understanding. Moreover, recent efforts regarding the compilation and
release of Japan's BOP related statistics as well as developments in international discussions
are outlined in the appendixes.
Most of Japan's BOP related data are available in the Bank's online data portal, the BOJ Time-
Series Data Search (except for data on Direct Investment by Region and Industry, which are
provided in file format on the Bank's website). Information on the BOJ Time-Series Data
Search as well as a list of the series codes of data used in this report are provided together
with this report on the Bank's website.
A comprehensive list of BOP related statistics and details on how they are released are
provided on the Balance of Payments Related Statistics (Data Based on the BPM6) page of
the Bank's website. See also FAQs on the Balance of Payments Related Statistics for more
information.

2
B. Basic Knowledge on the BOP
The BOP is a set of statistics that records various transactions of an economy with the rest of
the world in a systematic manner. The statistics are compiled in accordance with the sixth
edition of the Balance of Payments and International Investment Position Manual (BPM6)
and are based on double-entry accounting. Specifically, the details of the transactions and the
associated financial flows are categorized based on the standard components of the BPM6
and equal amounts are recorded on the credit and the debit side.
This section, to provide some basic knowledge for understanding the BOP, outlines the
components of the statistics and explains double-entry accounting.
Components of the BOP
In the BPM6, the BOP consists of three major standard components: the current account, the
financial account, and the capital account. The current account comprises goods, services,
primary income, and secondary income, while the financial account comprises direct
investment, portfolio investment, financial derivatives (other than reserves), other investment,
and reserve assets.
In principle, transactions recorded in Japan's BOP statistics are classified according to the
nature of the economic value provided and are recorded under the components shown in the
BPM6. The main types of transactions included in each component are as follows:
Current account Transactions in goods and services as well as receipts/payments of income.
Goods Exports/imports of goods and intermediary trade (i.e., merchanting).
Services Travel, transport, charges for the use of intellectual property, and other
service transactions related to business activities.
Primary income Receipts/payments of dividends paid out of earnings and interest on bonds.
Secondary income Receipts/payments of insurance premiums/claims and compensation for
damages, as well as contributions to international organizations.
Capital account Debt forgiveness and transfer of assets through inheritances.
Financial account Transactions involving the acquisition/disposal of external financial assets
and incurrence/repayment of external liabilities.
Direct investment Investments for the acquisition of firms and establishment of subsidiaries,
as well as withdrawals.
Portfolio investment Sales/purchases of equity as well as sales/purchases and issuances/
redemptions of debt securities.
Financial derivatives
(other than reserves)
Receipts/payments of forward trading gains/losses and notional exchange
gains/losses on currency swaps.
Other investment Loans, deposits, accounts receivable/payable resulting from the time
difference between the contract date and settlement of securities.
Reserve assets Changes in reserve assets.

3
Credit (Receipts) Debit (Payments) Net Balance
80 10 +70 +70
Goods 80(1) +80 +80
Services 0 0
Primary income 10(2) –10 –10
Secondary income 0 0
0 0
Credit Debit Net Credit Debit Net
50 220 +170 100 0 +100 +70
Direct investment 40(3) +40 0 +40
Portfolio investment 0 0 0
Financial derivatives
(other than reserves)0 0 0
Other investment 10(2)
+40(3)
80(1)
+100(4) +130 100
(4) +100 +30
Reserve assets 0 0
0
Current account
Capital account
Assets LiabilitiesBalance
Financial account
Net errors and omissions
Double-entry accounting in the BOP
In the BOP statistics, each transaction consists of two entries, a credit entry and a debit entry,
of equal value, and the sum of the credit entries and the sum of the debit entries are in principle
the same. The following are recorded as credits: exports of goods and services, income
receipts, transfer receipts, decreases in financial assets, and increases in liabilities. Conversely,
the following are recorded as debits: imports of goods and services, income payments,
transfer payments, increases in financial assets, and decreases in liabilities.
The following concrete transaction examples illustrate how the BOP statistics are compiled
based on double-entry accounting:
(1) Export of motor vehicles to an overseas firm, receipt of export proceeds worth 80
Exports 80 (Credit – Export of goods)
Currency 80 (Debit – Increase in financial assets)
(2) Remittance of dividends of 10 to an overseas investor holding shares in a Japanese firm
Currency 10 (Credit – Decrease in financial assets)
Dividends 10 (Debit – Income payments)
(3) Remittance by a Japanese parent firm of funds of 40 for the establishment of an overseas
subsidiary
Currency 40 (Credit – Decrease in financial assets)
Shares 40 (Debit – Increase in financial assets)
(4) Receipt in cash of a loan of 100 from an overseas bank
Loan 100 (Credit – Increase in liabilities)
Currency 100 (Debit – Increase in financial assets)
Note: Example (3) assumes that the investment ratio (for voting rights) is 10 percent or more, while
example (4) assumes that the investment ratio is less than 10 percent.
4
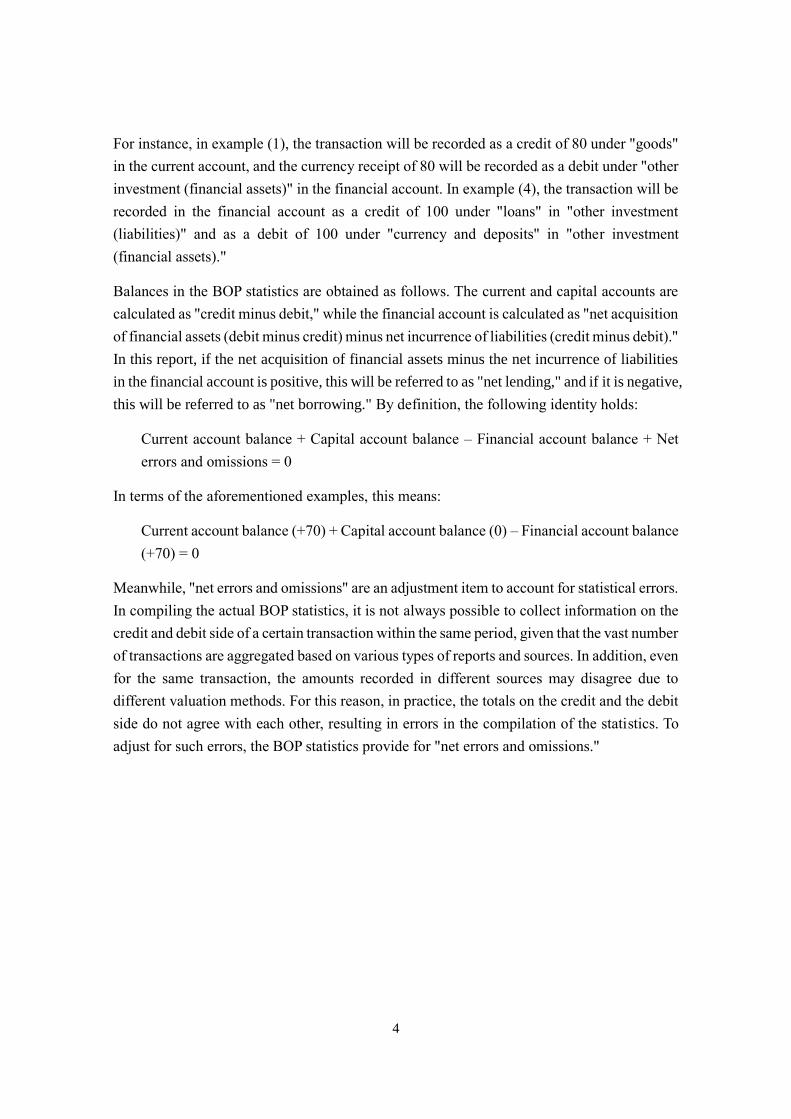
For instance, in example (1), the transaction will be recorded as a credit of 80 under "goods"
in the current account, and the currency receipt of 80 will be recorded as a debit under "other
investment (financial assets)" in the financial account. In example (4), the transaction will be
recorded in the financial account as a credit of 100 under "loans" in "other investment
(liabilities)" and as a debit of 100 under "currency and deposits" in "other investment
(financial assets)."
Balances in the BOP statistics are obtained as follows. The current and capital accounts are
calculated as "credit minus debit," while the financial account is calculated as "net acquisition
of financial assets (debit minus credit) minus net incurrence of liabilities (credit minus debit)."
In this report, if the net acquisition of financial assets minus the net incurrence of liabilities
in the financial account is positive, this will be referred to as "net lending," and if it is negative,
this will be referred to as "net borrowing." By definition, the following identity holds:
Current account balance + Capital account balance – Financial account balance + Net
errors and omissions = 0
In terms of the aforementioned examples, this means:
Current account balance (+70) + Capital account balance (0) – Financial account balance
(+70) = 0
Meanwhile, "net errors and omissions" are an adjustment item to account for statistical errors.
In compiling the actual BOP statistics, it is not always possible to collect information on the
credit and debit side of a certain transaction within the same period, given that the vast number
of transactions are aggregated based on various types of reports and sources. In addition, even
for the same transaction, the amounts recorded in different sources may disagree due to
different valuation methods. For this reason, in practice, the totals on the credit and the debit
side do not agree with each other, resulting in errors in the compilation of the statistics. To
adjust for such errors, the BOP statistics provide for "net errors and omissions."

5
II. Developments in Japan's BOP and IIP for 2020
Overall developments
The overall current account surplus decreased. While the spread of the novel coronavirus
(COVID-19) had a wide-ranging impact on the current account, the decrease in the current
account surplus mainly reflects the increase in the deficit on services, largely due to the
decline in the surplus on travel. The surplus on primary income also decreased, mainly due
to a decline in the surplus on portfolio investment income. Meanwhile, the surplus on goods
increased, reflecting the fact that although exports decreased due to the depression in overseas
economies, imports fell even more.
Japan's financial account registered a decrease in net lending mainly due to a decline in net
lending under direct investment.
Japan's net asset position remained essentially unchanged from the previous year.
Figure 1: Japan's BOP and IIP for 2020
Overall Developments
BOP (Flows)
Current account
17.5 tril. yen
Capital account
–0.2 tril. yen
At year-end 2019 Financial account (transactions) At year-end 2020
Net assets 15.4 tril. yen Net assets
357.0 tril. yen Exchange rate changes and other changes 357.0 tril. yen
–15.4 tril. yen
BOP
IIP
tril. yen
2019 2020 y/y chg.
Current account 19.3 17.5 –1.7
Goods 0.2 3.0 +2.9
Services –1.1 –3.7 –2.7
Primary income 21.6 20.8 –0.8
Secondary income –1.4 –2.5 –1.2
Capital account –0.4 –0.2 +0.2
Financial account 24.9 15.4 –9.5
Direct investment 23.9 11.3 –12.6
Portfolio investment 9.4 4.2 –5.1
Financial derivatives
(other than reserves)0.4 0.9 +0.5
Other investment –11.5 –2.2 +9.4
Reserve assets 2.8 1.2 –1.6
Net errors and omissions 6.0 –2.0 ─
6
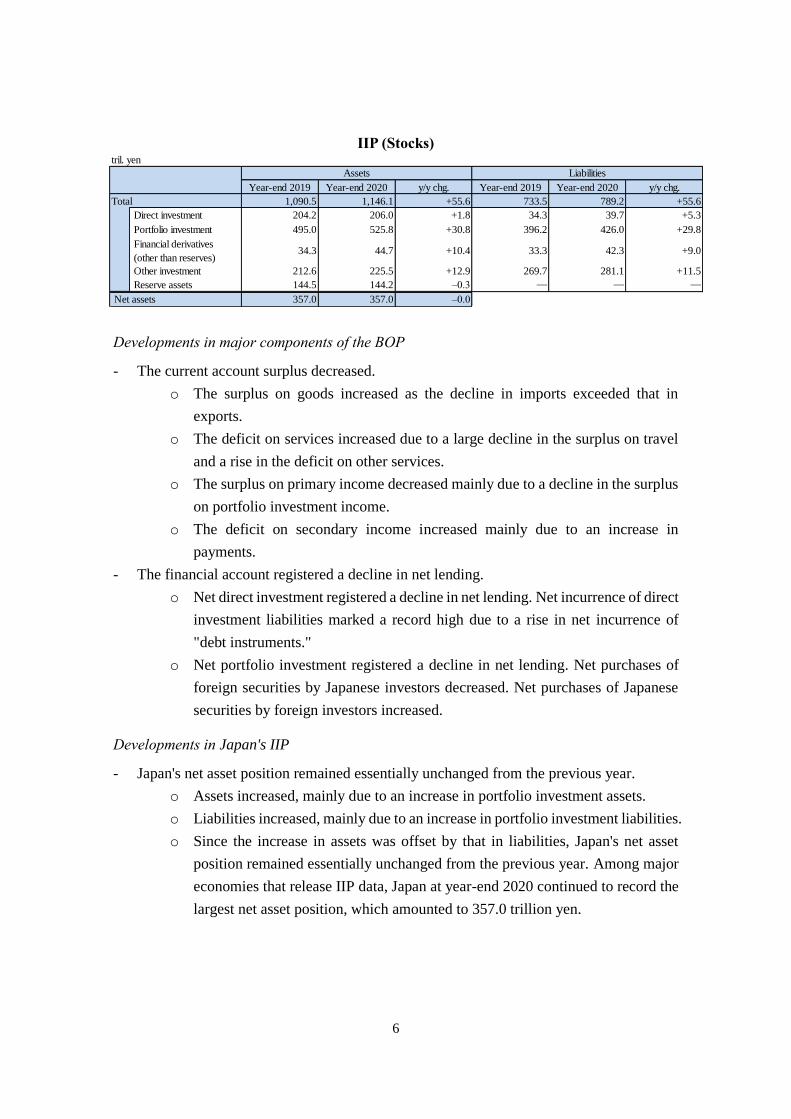
IIP (Stocks)
Developments in major components of the BOP
- The current account surplus decreased.
o The surplus on goods increased as the decline in imports exceeded that in
exports.
o The deficit on services increased due to a large decline in the surplus on travel
and a rise in the deficit on other services.
o The surplus on primary income decreased mainly due to a decline in the surplus
on portfolio investment income.
o The deficit on secondary income increased mainly due to an increase in
payments.
- The financial account registered a decline in net lending.
o Net direct investment registered a decline in net lending. Net incurrence of direct
investment liabilities marked a record high due to a rise in net incurrence of
"debt instruments."
o Net portfolio investment registered a decline in net lending. Net purchases of
foreign securities by Japanese investors decreased. Net purchases of Japanese
securities by foreign investors increased.
Developments in Japan's IIP
- Japan's net asset position remained essentially unchanged from the previous year.
o Assets increased, mainly due to an increase in portfolio investment assets.
o Liabilities increased, mainly due to an increase in portfolio investment liabilities.
o Since the increase in assets was offset by that in liabilities, Japan's net asset
position remained essentially unchanged from the previous year. Among major
economies that release IIP data, Japan at year-end 2020 continued to record the
largest net asset position, which amounted to 357.0 trillion yen.
tril. yen
Year-end 2019 Year-end 2020 y/y chg. Year-end 2019 Year-end 2020 y/y chg.
Total 1,090.5 1,146.1 +55.6 733.5 789.2 +55.6
Direct investment 204.2 206.0 +1.8 34.3 39.7 +5.3
Portfolio investment 495.0 525.8 +30.8 396.2 426.0 +29.8
Financial derivatives
(other than reserves)34.3 44.7 +10.4 33.3 42.3 +9.0
Other investment 212.6 225.5 +12.9 269.7 281.1 +11.5
Reserve assets 144.5 144.2 –0.3 ─ ─ ─
Net assets 357.0 357.0 –0.0
Assets Liabilities

7
0
100
200
300
400
500
0
250
500
750
1,000
1,250
Asse
tsL
iabilitie
sA
sse
tsL
iabilitie
sA
sse
tsL
iabilitie
sA
sse
tsL
iabilitie
sA
sse
tsL
iabilitie
sA
sse
tsL
iabilitie
sA
sse
tsL
iabilitie
sA
sse
tsL
iabilitie
sA
sse
tsL
iabilitie
sA
sse
tsL
iabilitie
sA
sse
tsL
iabilitie
sA
sse
tsL
iabilitie
sA
sse
tsL
iabilitie
sA
sse
tsL
iabilitie
sA
sse
tsL
iabilitie
sA
sse
tsL
iabilitie
sA
sse
tsL
iabilitie
sA
sse
tsL
iabilitie
sA
sse
tsL
iabilitie
sA
sse
tsL
iabilitie
sA
sse
tsL
iabilitie
sA
sse
tsL
iabilitie
sA
sse
tsL
iabilitie
sA
sse
tsL
iabilitie
sA
sse
tsL
iabilitie
s
1996 97 98 99 2000 01 02 03 04 05 06 07 08 09 10 11 12 13 14 15 16 17 18 19 20
Reserve assets
Other investment
Financial derivatives (other than reserves)
Portfolio investment
Direct investment
Net assets (right scale)
tril. yen tril. yen
year-end
Figure 2: Japan's BOP and IIP
Current Account
Financial Account
IIP
–20
–10
0
10
20
30
40
1996 97 98 99 2000 01 02 03 04 05 06 07 08 09 10 11 12 13 14 15 16 17 18 19 20
Secondary income
Primary income
Services
Goods
Current account
tril. yen
–40
–20
0
20
40
60
1996 97 98 99 2000 01 02 03 04 05 06 07 08 09 10 11 12 13 14 15 16 17 18 19 20
Reserve assets
Other investment
Financial derivatives (other than reserves)
Portfolio investment
Direct investment
Financial account
tril. yen
Net lending
Net borrowing

8
III. Developments in the Current Account in 2020
A. Goods
Figure 3: Goods
Figure 4: Goods by Region
Figure 5: Exports by Region Figure 6: Imports by Region
–15
–10
–5
0
5
10
15
20
1996 97 98 99 2000 01 02 03 04 05 06 07 08 09 10 11 12 13 14 15 16 17 18 19 20
Nonmonetary goldNet exports of goods under merchanting (credit)General merchandise on a balance of payments basisGoods
tril. yen
The surplus on goods increased to 3.0 trillion yen in 2020 from 0.2 trillion yen in 2019
as the decline in imports exceeded that in exports.
Exports fell to 67.4 trillion yen in 2020 from 75.8 trillion yen in 2019 mainly due to a
decrease in exports of transport equipment (such as motor vehicles) to Europe and North
America. Imports fell to 64.4 trillion yen in 2020 from 75.6 trillion yen in 2019 mainly due
to a decrease in imports of mineral fuels (such as crude oil) from the Middle East as a result
of the drop in crude oil prices and a decline in fuel demand.
Breaking down changes in trade indexes into the contribution of changes in quantities
and changes in prices shows that the decline in exports was mainly due to a decline in
quantities, while the decline in imports was due to declines in both prices and quantities.
–30
–20
–10
0
10
20
30
1996 97 98 99 2000 01 02 03 04 05 06 07 08 09 10 11 12 13 14 15 16 17 18 19 20
Other regions Middle EastEurope North AmericaAsia Goods
tril. yen
0
10
20
30
40
50
60
70
80
90
1996 99 2002 05 08 11 14 17 20
Other regions Middle East Europe
North America Asia
tril. yen
0
10
20
30
40
50
60
70
80
90
1996 99 2002 05 08 11 14 17 20
Other regions Middle East Europe
North America Asia
tril. yen

9
Figure 7: Exports by Commodity Figure 8: Imports by Commodity
Source: Ministry of Finance, "Trade Statistics Source: Ministry of Finance, "Trade Statistics
of Japan." of Japan."
Figure 9: Year-on-Year Changes in Trade Indexes
<Exports> <Imports>
Source: Ministry of Finance, "Trade Statistics Source: Ministry of Finance, "Trade Statistics
of Japan." of Japan."
(Reference) While the Trade Statistics of Japan are the main data source for goods in Japan's BOP, the
definitions of exports and imports of goods differ between the two statistics and certain adjustments
are made to compile the BOP. The major differences are as follows:
Trade Statistics of Japan Goods in the BOP
Valuation
Exports: FOB (Free on Board), i.e., the price of goods
at the frontier of the exporting country is recorded.
Imports: CIF (Cost, Insurance, and Freight), i.e.,
including insurance premiums and freight charges in
addition to the price of goods.
Exports: FOB
Imports: FOB
Coverage Goods that have crossed Japan's customs frontier.
Goods whose ownership has
changed between residents and
nonresidents. Returned goods are
excluded.
Time of
recording
Exports: When the ship or aircraft carrying the goods
leaves the port.
Imports: When import of the goods is permitted.
When ownership changes.
–40
–30
–20
–10
0
10
20
30
1996 99 2002 05 08 11 14 17 20
Unit value index
Quantum index
Value index
%
–40
–30
–20
–10
0
10
20
30
1996 99 2002 05 08 11 14 17 20
Unit value index
Quantum index
Value index
%
0
10
20
30
40
50
60
70
80
90
1996 99 2002 05 08 11 14 17 20
Other ChemicalsManufactured goods Electrical machineryMachinery Transport equipment
tril. yen
0
10
20
30
40
50
60
70
80
90
1996 99 2002 05 08 11 14 17 20Other Manufactured goodsMachinery ChemicalsElectrical machinery Mineral fuels
tril. yen

10
B. Services
Figure 10: Services1
Figure 11: Services Credit and Debit
<Credit> <Debit>
Figure 12: Services by Region
1 For data from 2014 onward, other services include the estimated values of transactions worth 30
million yen or less.
–8
–6
–4
–2
0
2
4
1996 97 98 99 2000 01 02 03 04 05 06 07 08 09 10 11 12 13 14 15 16 17 18 19 20
Travel Other services Transport Services
tril. yen
0
5
10
15
20
25
1996 99 2002 05 08 11 14 17 20
Transport
Other services
Travel
tril. yen
0
5
10
15
20
25
1996 99 2002 05 08 11 14 17 20
Transport
Other services
Travel
tril. yen
The deficit on services increased to 3.7 trillion yen in 2020 from 1.1 trillion yen in 2019
due to a large decline in the surplus on travel and a rise in the deficit on other services. The
deficit on services registered the largest increase since 1997, from when comparable data are
available.
By region, the surplus vis-à-vis Asia decreased considerably.
–8
–6
–4
–2
0
2
4
1996 97 98 99 2000 01 02 03 04 05 06 07 08 09 10 11 12 13 14 15 16 17 18 19 20
Asia North America Europe
Other regions Services
tril. yen
11
1. Travel
Figure 13: Travel
Figure 14: Travel by Partner Economy Figure 15: Credit by Partner Economy
Figure 16: Number of Foreign Visitors to Figure 17: Travel Expenditure per
Japan by Partner Economy and Foreign Visitor to Japan
Number of Japanese Departures
–4
–2
0
2
4
6
1996 97 98 99 2000 01 02 03 04 05 06 07 08 09 10 11 12 13 14 15 16 17 18 19 20
Credit
Debit
Travel
tril. yen
0
50
100
150
200
250
300
350
2010 11 12 13 14 15 16 17 18 19 20
China
United States
Hong Kong
Taiwan
South Korea
Average
thous. yen
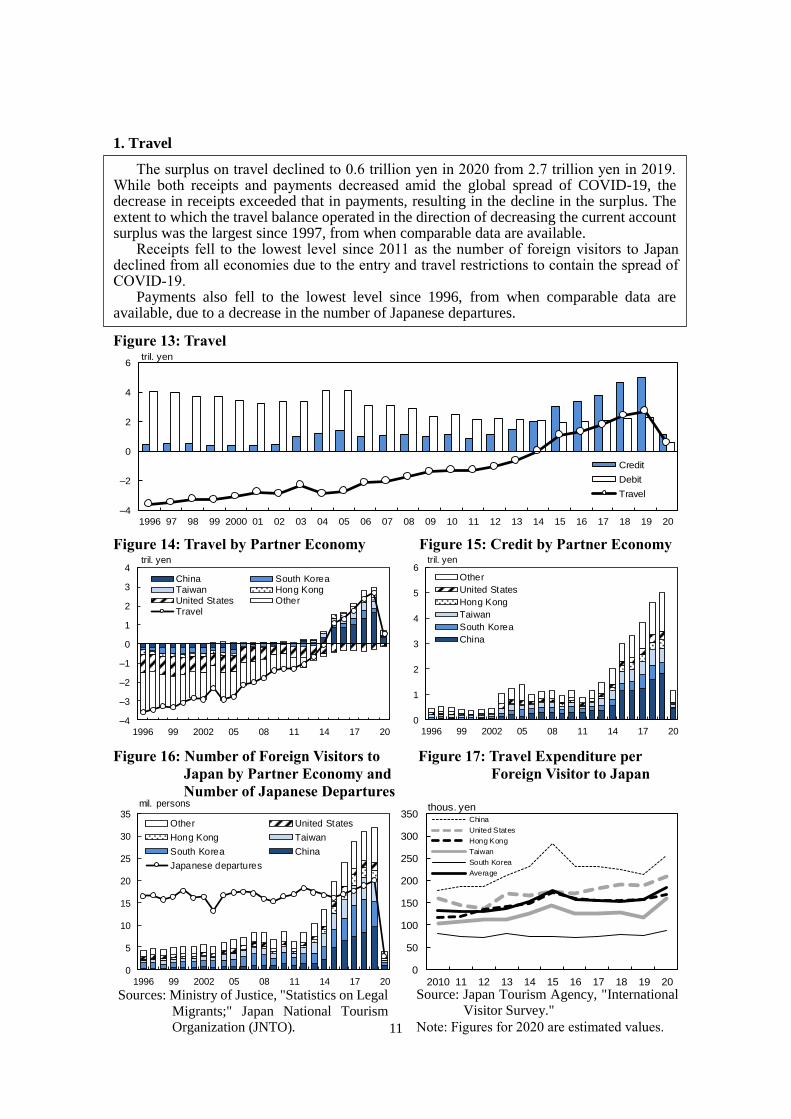
The surplus on travel declined to 0.6 trillion yen in 2020 from 2.7 trillion yen in 2019. While both receipts and payments decreased amid the global spread of COVID-19, the decrease in receipts exceeded that in payments, resulting in the decline in the surplus. The extent to which the travel balance operated in the direction of decreasing the current account surplus was the largest since 1997, from when comparable data are available.
Receipts fell to the lowest level since 2011 as the number of foreign visitors to Japan declined from all economies due to the entry and travel restrictions to contain the spread of COVID-19.
Payments also fell to the lowest level since 1996, from when comparable data are available, due to a decrease in the number of Japanese departures.
Sources: Ministry of Justice, "Statistics on Legal
Migrants;" Japan National Tourism
Organization (JNTO).
Source: Japan Tourism Agency, "International
Visitor Survey."
Note: Figures for 2020 are estimated values.
–4
–3
–2
–1
0
1
2
3
4
1996 99 2002 05 08 11 14 17 20
China South KoreaTaiwan Hong KongUnited States OtherTravel
tril. yen
0
1
2
3
4
5
6
1996 99 2002 05 08 11 14 17 20
Other
United States
Hong Kong
Taiwan
South Korea
China
dummy
tril. yen
0
5
10
15
20
25
30
35
1996 99 2002 05 08 11 14 17 20
Other United States
Hong Kong Taiwan
South Korea China
Japanese departures
mil. persons

12
2. Other services (charges for the use of intellectual property n.i.e.)
Figure 18: Other Services
Figure 19: Charges for the Use of Intellectual Property n.i.e.
Figure 20: Charges for the Use of Intellectual Property n.i.e. by Region
<Credit> <Debit>
–6
–5
–4
–3
–2
–1
0
1
2
3
1996 97 98 99 2000 01 02 03 04 05 06 07 08 09 10 11 12 13 14 15 16 17 18 19 20
Charges for the use of intellectual property n.i.e.
Other
Other services
tril. yen
The deficit on other services increased. Looking at charges for the use of intellectual
property n.i.e., which were the main cause of the overall increase in the deficit, the surplus
decreased to 1.6 trillion yen in 2020 from 2.2 trillion yen in 2019. This mainly reflects a
decline in receipts of charges for the use of industrial property n.i.e. due to a decrease in
production and sales of Japanese manufacturers' overseas affiliates.
A breakdown by region shows that the decrease in receipts of charges for the use of
intellectual property n.i.e. was led by a fall in receipts from Asia and North America.
–2
–1
0
1
2
3
4
1996 97 98 99 2000 01 02 03 04 05 06 07 08 09 10 11 12 13 14 15 16 17 18 19 20
Charges for the use of industrial property n.i.e.
Charges for the use of copyrights n.i.e.
Charges for the use of intellectual property n.i.e.
tril. yen
0
1
2
3
4
5
6
1996 99 2002 05 08 11 14 17 20
Other regions
Europe
North America
Asia
tril. yen
0
1
2
3
4
5
6
1996 99 2002 05 08 11 14 17 20
Other regions
Europe
North America
Asia
tril. yen
13
C. Primary Income
III. C.
Figure 21: Primary Income
Figure 22: Direct Investment Income Figure 23: Direct Investment Income
by Region by Industry
Figure 24: Portfolio Investment Income Figure 25: Portfolio Investment Income
by Region by Component
0
5
10
15
20
25
1996 97 98 99 2000 01 02 03 04 05 06 07 08 09 10 11 12 13 14 15 16 17 18 19 20
Other
Portfolio investment income
Direct investment income
dummy
tril. yen
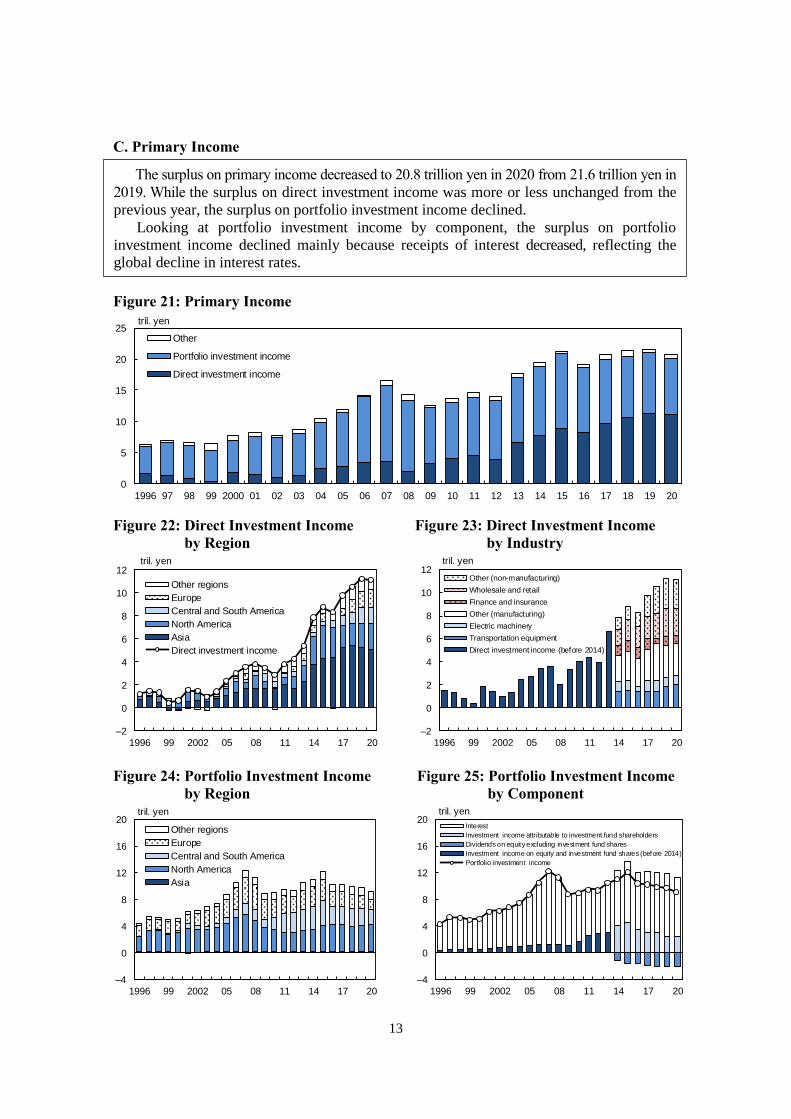
The surplus on primary income decreased to 20.8 trillion yen in 2020 from 21.6 trillion yen in
2019. While the surplus on direct investment income was more or less unchanged from the
previous year, the surplus on portfolio investment income declined.
Looking at portfolio investment income by component, the surplus on portfolio
investment income declined mainly because receipts of interest decreased, reflecting the global decline in interest rates.
–2
0
2
4
6
8
10
12
1996 99 2002 05 08 11 14 17 20
Other regions
Europe
Central and South America
North America
Asia
Direct investment income
tril. yen
–2
0
2
4
6
8
10
12
1996 99 2002 05 08 11 14 17 20
Other (non-manufacturing)
Wholesale and retail
Finance and insurance
Other (manufacturing)
Electric machinery
Transportation equipment
Direct investment income (before 2014)
dummy
tril. yen
–4
0
4
8
12
16
20
1996 99 2002 05 08 11 14 17 20
Other regions
Europe
Central and South America
North America
Asia
dummy
tril. yen
–4
0
4
8
12
16
20
1996 99 2002 05 08 11 14 17 20
Interest
Investment income attributable to investment fund shareholders
Dividends on equity excluding investment fund shares
Investment income on equity and investment fund shares (before 2014)
Portfolio investment income
tril. yen
14
D. Secondary Income
2
Figure 26: Secondary Income
Figure 27: Secondary Income by Region
2 "NPISHs" stands for "nonprofit institutions serving households."
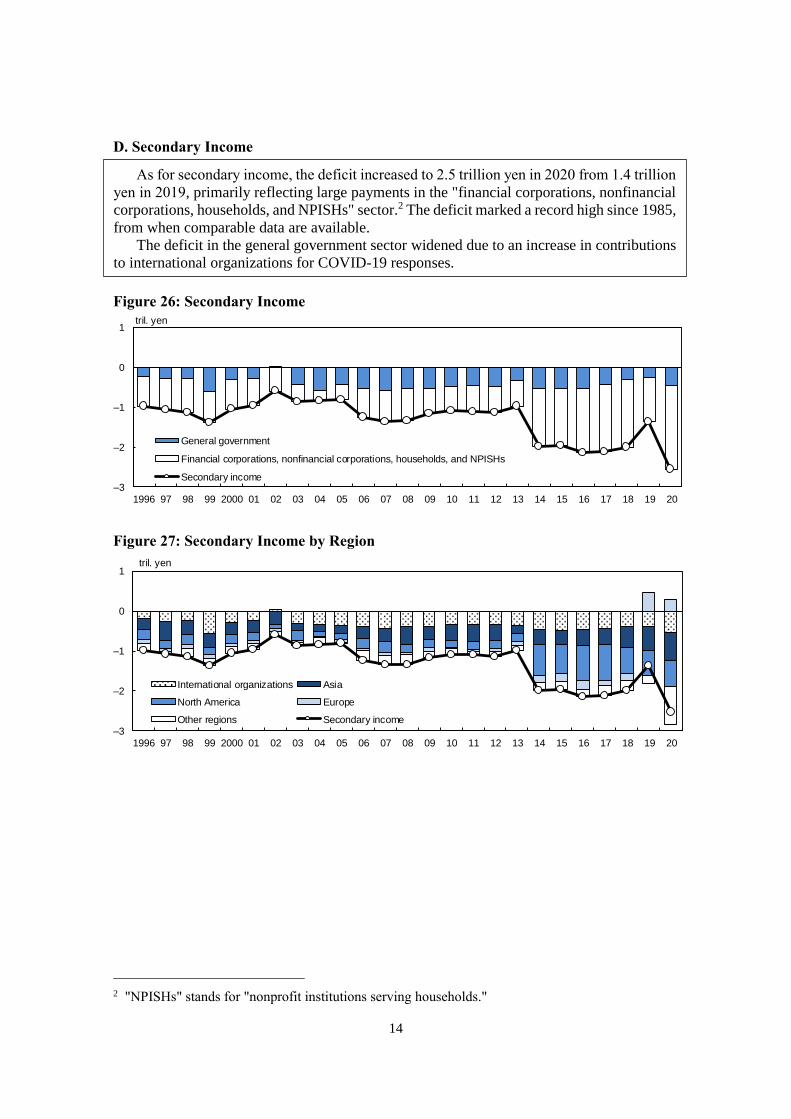
As for secondary income, the deficit increased to 2.5 trillion yen in 2020 from 1.4 trillion
yen in 2019, primarily reflecting large payments in the "financial corporations, nonfinancial
corporations, households, and NPISHs" sector.2 The deficit marked a record high since 1985,
from when comparable data are available.
The deficit in the general government sector widened due to an increase in contributions
to international organizations for COVID-19 responses.
–3
–2
–1
0
1
1996 97 98 99 2000 01 02 03 04 05 06 07 08 09 10 11 12 13 14 15 16 17 18 19 20
tril. yen
General government
Financial corporations, nonfinancial corporations, households, and NPISHs
Secondary income
–3
–2
–1
0
1
1996 97 98 99 2000 01 02 03 04 05 06 07 08 09 10 11 12 13 14 15 16 17 18 19 20
International organizations Asia
North America Europe
Other regions Secondary income
tril. yen
15
IV. Developments in the Financial Account in 2020
A. Direct Investment Assets (Outward Direct Investment)
Figure 28: Direct Investment Assets
Figure 29: Outward Direct Investment by Region and Industry
(Based on Directional Principle)
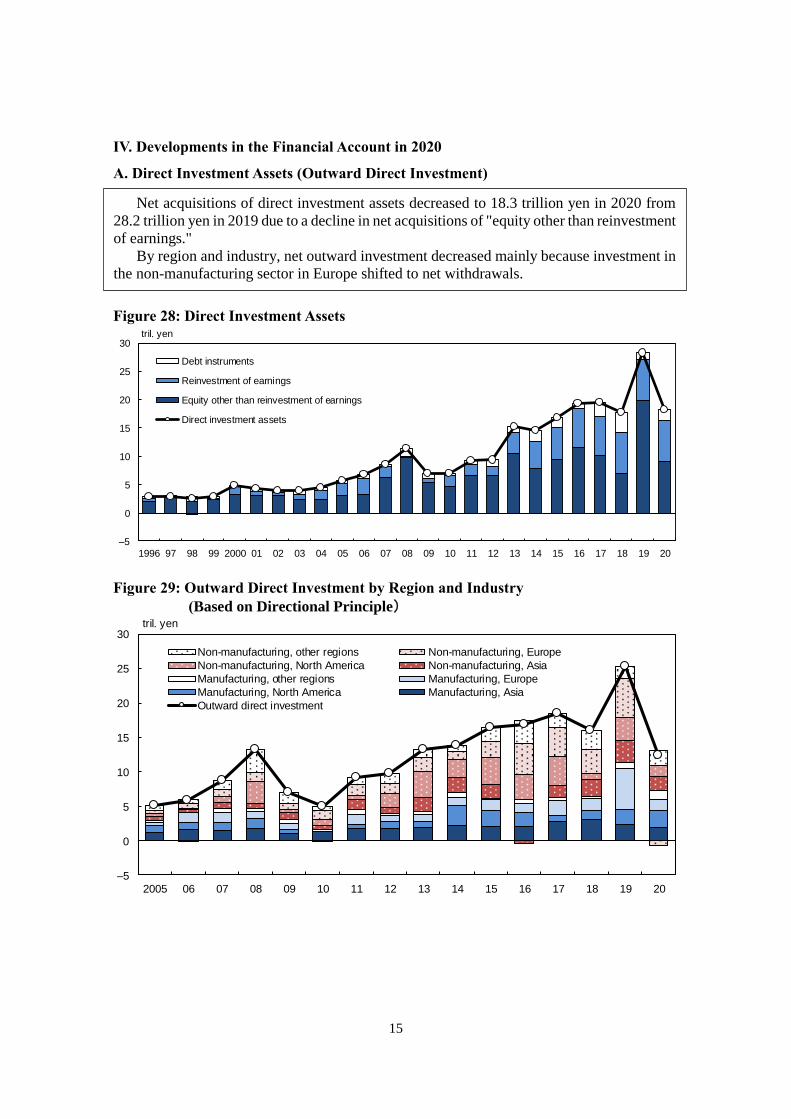
Net acquisitions of direct investment assets decreased to 18.3 trillion yen in 2020 from
28.2 trillion yen in 2019 due to a decline in net acquisitions of "equity other than reinvestment
of earnings."
By region and industry, net outward investment decreased mainly because investment in
the non-manufacturing sector in Europe shifted to net withdrawals.
–5
0
5
10
15
20
25
30
1996 97 98 99 2000 01 02 03 04 05 06 07 08 09 10 11 12 13 14 15 16 17 18 19 20
Debt instruments
Reinvestment of earnings
Equity other than reinvestment of earnings
Direct investment assets
tril. yen
–5
0
5
10
15
20
25
30
2005 06 07 08 09 10 11 12 13 14 15 16 17 18 19 20
Non-manufacturing, other regions Non-manufacturing, Europe
Non-manufacturing, North America Non-manufacturing, Asia
Manufacturing, other regions Manufacturing, Europe
Manufacturing, North America Manufacturing, Asia
Outward direct investment
tril. yen

16
B. Direct Investment Liabilities (Inward Direct Investment)
Figure 30: Direct Investment Liabilities
Figure 31: Inward Direct Investment by Region and Industry
(Based on Directional Principle)
–2
–1
0
1
2
3
4
5
6
7
8
1996 97 98 99 2000 01 02 03 04 05 06 07 08 09 10 11 12 13 14 15 16 17 18 19 20
Debt instruments
Reinvestment of earnings
Equity other than reinvestment of earnings
Direct investment liabilities
tril. yen
Net incurrence of direct investment liabilities increased to 7.1 trillion yen in 2020 from
4.4 trillion yen in 2019, marking a record high, due to a rise in net incurrence of "debt
instruments" led by an increase in loans from overseas subsidiaries.
On the other hand, based on the directional principle, net inward direct investment
decreased. By region and industry, inward investment in the manufacturing sector from
North America shifted to net withdrawals.
–2
–1
0
1
2
3
2005 06 07 08 09 10 11 12 13 14 15 16 17 18 19 20
Non-manufacturing, other regions Non-manufacturing, EuropeNon-manufacturing, North America Non-manufacturing, AsiaManufacturing, other regions Manufacturing, EuropeManufacturing, North America Manufacturing, AsiaInward direct investment
tril. yen
17
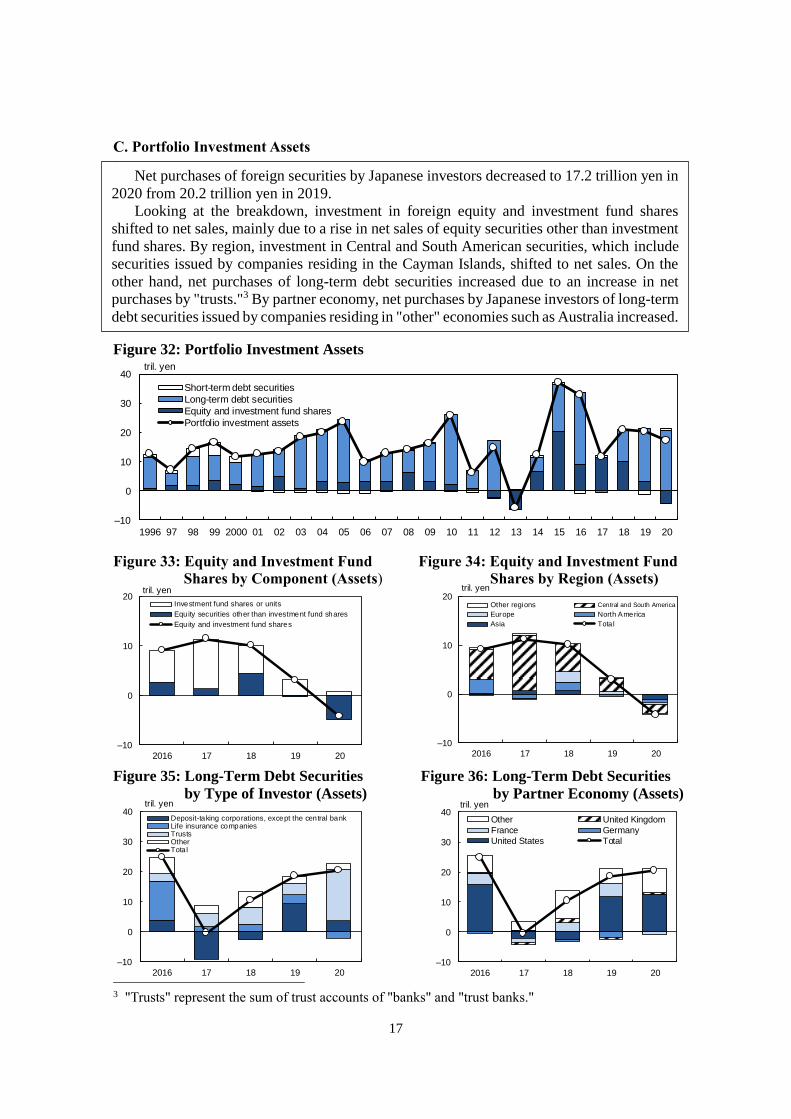
C. Portfolio Investment Assets 3
Figure 32: Portfolio Investment Assets
Figure 33: Equity and Investment Fund Figure 34: Equity and Investment Fund
Shares by Component (Assets) Shares by Region (Assets)
Figure 35: Long-Term Debt Securities Figure 36: Long-Term Debt Securities
by Type of Investor (Assets) by Partner Economy (Assets)
3 "Trusts" represent the sum of trust accounts of "banks" and "trust banks."
–10
0
10
20
2016 17 18 19 20
Other regions Central and South America
Europe North America
Asia Tota l
tril. yen
–10
0
10
20
2016 17 18 19 20
Investment fund shares or units
Equity securities other than investment fund shares
Equity and investment fund shares
tril. yen
–10
0
10
20
30
40
1996 97 98 99 2000 01 02 03 04 05 06 07 08 09 10 11 12 13 14 15 16 17 18 19 20
tril. yen
Short-term debt securities
Long-term debt securities
Equity and investment fund shares
Portfolio investment assets
–10
0
10
20
30
40
2016 17 18 19 20
tril. yen
Deposit-taking corporations, except the central bankLife insurance companiesTrustsOtherTotal
Net purchases of foreign securities by Japanese investors decreased to 17.2 trillion yen in
2020 from 20.2 trillion yen in 2019.
Looking at the breakdown, investment in foreign equity and investment fund shares
shifted to net sales, mainly due to a rise in net sales of equity securities other than investment
fund shares. By region, investment in Central and South American securities, which include
securities issued by companies residing in the Cayman Islands, shifted to net sales. On the
other hand, net purchases of long-term debt securities increased due to an increase in net
purchases by "trusts."3 By partner economy, net purchases by Japanese investors of long-term
debt securities issued by companies residing in "other" economies such as Australia increased.
–10
0
10
20
30
40
2016 17 18 19 20
tril. yen
Other United Kingdom
France Germany
United States Total

18
D. Portfolio Investment Liabilities
Figure 37: Portfolio Investment Liabilities
Figure 38: Equity and Investment Fund Figure 39: Equity and Investment Fund
Shares by Component (Liabilities) Shares by Region (Liabilities)
Figure 40: Long-Term Debt Securities Figure 41: Short-Term Debt Securities
(Changes in Liabilities by (Changes in Liabilities by
Region)4 Region)4
4 There are discrepancies between the flows and the sums of changes in liabilities by region.
–10
–5
0
5
10
2016 17 18 19 20
tril. yen
Other regions Europe
North America Asia
Total
–10
–5
0
5
10
15
20
2016 17 18 19 20
tril. yen
Other regions EuropeNorth America AsiaFlow
–15
–10
–5
0
5
10
15
20
25
30
1996 97 98 99 2000 01 02 03 04 05 06 07 08 09 10 11 12 13 14 15 16 17 18 19 20
Short-term debt securities
Long-term debt securities
Equity and investment fund shares
Portfolio investment liabilities
tril. yen
Net purchases of Japanese securities by foreign investors increased to 12.9 trillion yen in
2020 from 10.8 trillion yen in 2019, because investment in short-term debt securities shifted
to net purchases.
Investment in Japanese equity and investment fund shares shifted to net sales, mainly
because investment in equity securities other than investment fund shares shifted to net sales.
Net purchases of Japanese long-term debt securities decreased.
–10
–5
0
5
10
2016 17 18 19 20
Investment fund shares or units
Equity securities other than investment fund shares
Equity and investment fund shares
tril. yen
–10
–5
0
5
10
15
20
25
2016 17 18 19 20
tril. yen
Other regions Europe
North America Asia
Flow
19
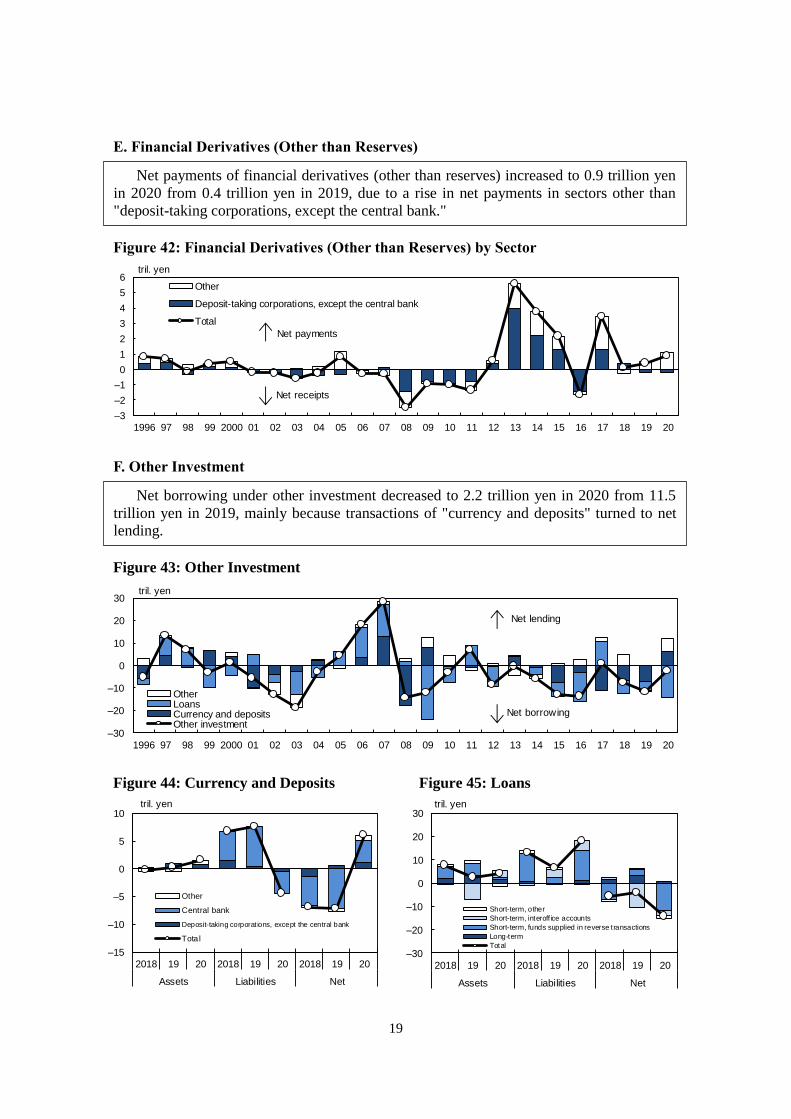
E. Financial Derivatives (Other than Reserves)
Figure 42: Financial Derivatives (Other than Reserves) by Sector
F. Other Investment
Figure 43: Other Investment
Figure 44: Currency and Deposits Figure 45: Loans
–30
–20
–10
0
10
20
30
1996 97 98 99 2000 01 02 03 04 05 06 07 08 09 10 11 12 13 14 15 16 17 18 19 20
OtherLoansCurrency and depositsOther investment
tril. yen
Net lending
Net borrowing
–3
–2
–1
0
1
2
3
4
5
6
1996 97 98 99 2000 01 02 03 04 05 06 07 08 09 10 11 12 13 14 15 16 17 18 19 20
Other
Deposit-taking corporations, except the central bank
Total
tril. yen
Net payments
Net receipts
Net payments of financial derivatives (other than reserves) increased to 0.9 trillion yen
in 2020 from 0.4 trillion yen in 2019, due to a rise in net payments in sectors other than
"deposit-taking corporations, except the central bank."
Net borrowing under other investment decreased to 2.2 trillion yen in 2020 from 11.5
trillion yen in 2019, mainly because transactions of "currency and deposits" turned to net lending.
–30
–20
–10
0
10
20
30
2018 19 20 2018 19 20 2018 19 20
Assets Liabilities Net
Short-term, other
Short-term, interoff ice accounts
Short-term, funds supplied in reverse transactions
Long-term
Total
tril. yen
–15
–10
–5
0
5
10
2018 19 20 2018 19 20 2018 19 20
Assets Liabilities Net
Other
Central bank
Deposit-taking corporat ions, except the central bank
Tota l
tril. yen

20
V. Japan's IIP at Year-End 2020
A. Summary
Figure 46: Assets
Figure 47: Liabilities
Figure 48: Net IIP
Japan's external financial assets and liabilities both increased, mainly due to increases in
portfolio investment. External financial assets increased to 1,146.1 trillion yen at year-end
2020 from 1,090.5 trillion yen at year-end 2019, while liabilities increased to 789.2 trillion
yen at year-end 2020 from 733.5 trillion yen at year-end 2019.
Japan's net asset position at year-end 2020 remained essentially unchanged from a year
earlier at 357.0 trillion yen.
0
200
400
600
800
1,000
1,200
1996 97 98 99 2000 01 02 03 04 05 06 07 08 09 10 11 12 13 14 15 16 17 18 19 20
Reserve assetsOther investmentFinancial derivatives (other than reserves)Portfolio investmentDirect investment
tril. yen
year-end
0
100
200
300
400
500
600
700
800
900
1996 97 98 99 2000 01 02 03 04 05 06 07 08 09 10 11 12 13 14 15 16 17 18 19 20
Other investment
Financial derivatives (other than reserves)
Portfolio investment
Direct investment
tril. yen
year-end
–100
0
100
200
300
400
500
1996 97 98 99 2000 01 02 03 04 05 06 07 08 09 10 11 12 13 14 15 16 17 18 19 20
Reserve assetsOther investmentFinancial derivatives (other than reserves)Portfolio investmentDirect investmentNet IIP
year-end
tril. yen

21
B. Year-on-Year Changes in Japan's IIP
Figure 49: Year-on-Year Changes in the IIP by Component
Figure 50: Year-on-Year Changes in the IIP by Factor5 excluding Financial Derivatives
(Other than Reserves)6
5 Year-on-year changes in the IIP by factor before 2020 do not add up as the figures for "exchange
rate changes" and "other changes" do not reflect annual revisions. 6 See footnote 4 in Appendix 6 for an explanation of why financial derivatives (other than reserves)
are excluded.
–8
–5
–3
0
3
5
8
10
–75
–50
–25
0
25
50
75
100
2016 17 18 19 20 2016 17 18 19 20 2016 17 18 19 20
Assets Liabilities Net assets
TransactionsExchange rate changesOther changesYear-on-year changeUSD-JPY y/y % chg. (right scale)
%tril. yen
–50
0
50
100
2016 17 18 19 20 2016 17 18 19 20 2016 17 18 19 20
Assets Liabilities Net assets
tril. yen
Reserve assets
Other investment
Financial derivatives (other than reserves)
Portfolio investment
Direct investment
Year-on-year change
Looking at year-on-year changes in the IIP by component, increases in portfolio
investment made the largest contribution to increases in both assets and liabilities. Since the
increase in assets was offset by that in liabilities, net assets remained more or less unchanged
from the previous year.
By factor, transactions operated in the direction of increasing net assets, while exchange
rate changes operated in the direction of decreasing net assets. Meanwhile, other changes
pushed up both assets and liabilities, which can primarily be attributed to valuation gains on
portfolio investments driven by the rise in foreign stock prices.

22
Figure 51: Other Changes by Component excluding Financial Derivatives (Other than
Reserves)7
C. Japan's IIP by Sector
Figure 52: IIP by Sector8
7 See footnote 4 in Appendix 6 for an explanation of why financial derivatives (other than reserves)
are excluded. 8 All direct investment is included in "others."
Looking at the IIP by sector, assets increased led by an increase in assets of other financial
corporations. Meanwhile, increases in the liabilities of other financial corporations and of
"others" made the largest contributions to the increase in liabilities overall.
–25
0
25
50
–40
–20
0
20
40
60
80
2016 17 18 19 20 2016 17 18 19 20 2016 17 18 19 20
Assets Liabilities Net assets
tril. yen %
Reserve assets Other investment Portfolio investment
Direct investment Other changes S&P 500 y/y % chg. (right scale)
TOPIX y/y % chg. (right scale)
–200
0
200
400
600
800
1,000
1,200
2016 17 18 19 20 2016 17 18 19 20 2016 17 18 19 20
Assets Liabilities Net assets
Central bank and general government
Deposit-taking corporat ions, except thecentral bankOther financial corporations
Others
Total
tril. yen
year-end

23
D. Direct Investment Position and Portfolio Investment Position by Component
Figure 53: Direct Investment Position Figure 54: Portfolio Investment Position
by Component9 by Component
E. Direct Investment Position and Portfolio Investment Position by Region
Figure 55: Direct Investment Position Figure 56: Portfolio Investment Position
by Region by Region
9 On the liabilities side, debt instruments to direct investors represent liabilities vis-à-vis overseas
parent companies (direct investors) etc., while debt instruments to direct investment enterprises
represent liabilities vis-à-vis overseas subsidiaries etc.
Looking at the direct investment position and the portfolio investment position by region,
in both positions, assets increased led by investment in North America while liabilities
increased led by investment from Europe.
Looking at the direct investment position by component, assets increased led by an
increase in equity other than reinvestment of earnings, while liabilities increased mainly due
to an increase in debt instruments. As for the portfolio investment position, assets increased
led by an increase in long-term debt securities, while liabilities increased led by an increase
in short-term debt securities.
0
100
200
300
400
500
600
2016 17 18 19 20 2016 17 18 19 20
Assets Liabilities
Equity and investment fund shares
Long-term debt securities
Short-term debt securities
tril. yen
year-end
0
10
20
30
40
50
0
50
100
150
200
250
2016 17 18 19 20 2016 17 18 19 20
Assets Liabilities
Other regions
Europe
North America
Asia
assets, tril. yen liabilities, tril. yen
year-end
0
10
20
30
40
50
0
50
100
150
200
250
2016 17 18 19 20 2016 17 18 19 20
Assets Liabilities
assets, tril. yen liabilities, tril. yen
year-end
Equity other than reinvestment of earningsReinvestment of earningsDebt instrumentsDebt instruments to direct investorsDebt instruments to direct investment enterprises
0
100
200
300
400
500
600
2016 17 18 19 20 2016 17 18 19 20
Assets Liabilities
Other regionsEuropeNorth AmericaAsia
tril. yen
year-end

24
F. Market Value Estimates of Direct Investment Position
Figure 57: Market Value Estimates of Direct Investment Position
<Assets> <Liabilities>
G. Portfolio Investment Position by Currency
Figure 58: Portfolio Investment Position by Currency
<Assets> <Liabilities>10
10 Figures for the portfolio investment position (liabilities) by currency have been released starting
with those for year-end 2014.
Looking at the direct investment position estimated using market values, assets and
liabilities stood at 218.1 trillion yen and 48.9 trillion yen, respectively (on a book value basis,
assets and liabilities amounted to 206.0 trillion yen and 39.7 trillion yen, respectively).
Looking at the portfolio investment position by currency, the increase in portfolio
investment assets was mainly due to an increase in Japanese investors' holdings of U.S.
dollar-denominated long-term debt securities. Meanwhile, the increase in portfolio
investment liabilities was mainly due to an increase in overseas investors' holdings of yen-
denominated equities.
0
50
100
150
200
250
2000 02 04 06 08 10 12 14 16 18 20
Assets (book value basis)
Market value estimates
tril. yen
year-end0
10
20
30
40
50
60
2000 02 04 06 08 10 12 14 16 18 20
Liabilities (book value basis)
Market value estimates
tril. yen
year-end
0
100
200
300
400
500
600
200506 07 08 09 10 11 12 13 14 15 16 17 18 19 20
Other Japanese yen British pound Australian dollar Euro U.S. dollar
tril. yen
year-end0
50
100
150
200
250
300
350
400
450
200506 07 08 09 10 11 12 13 14 15 16 17 18 19 20
tril. yen
year-end
25
0
100
200
300
400
500
600
1996 98 2000 02 04 06 08 10 12 14 16 18 20
Short-term, Japanese yen Short-term, foreign currency Short-term (before 2014)
Long-term, Japanese yen Long-term, foreign currency Long-term (before 2014)
tril. yen
year-end0
100
200
300
400
500
600
1996 98 2000 02 04 06 08 10 12 14 16 18 20
tril. yen
year-end
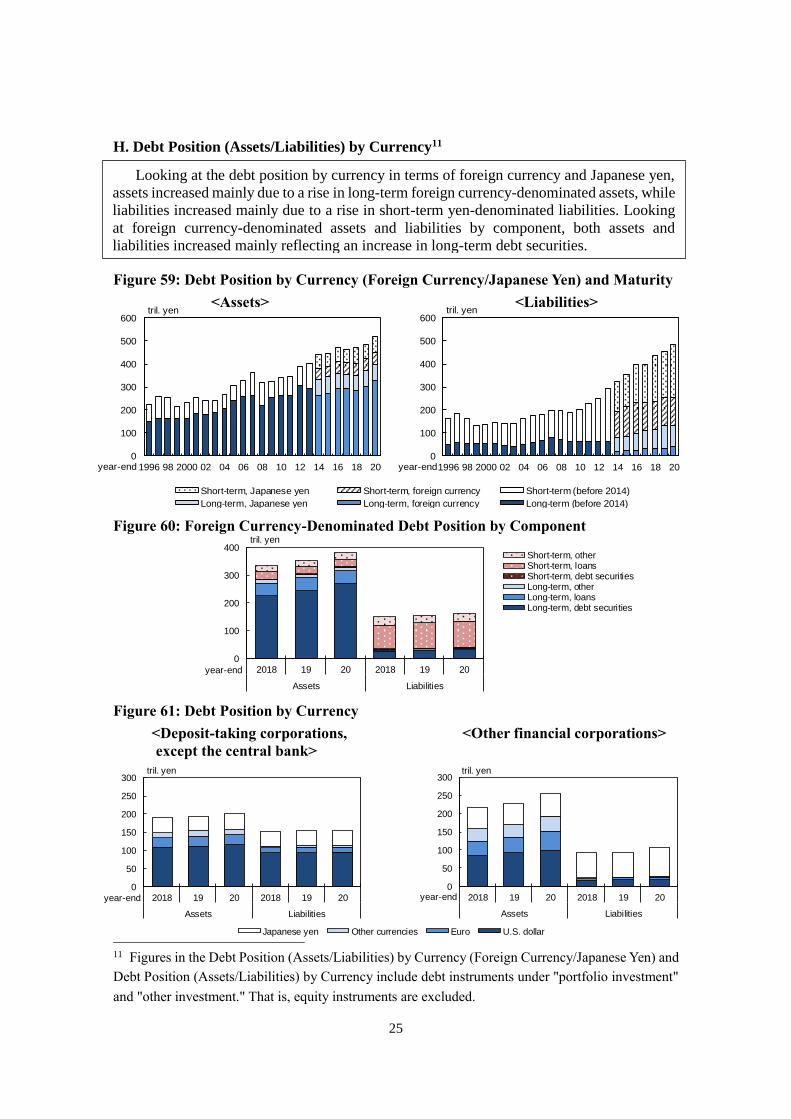
H. Debt Position (Assets/Liabilities) by Currency11
Figure 59: Debt Position by Currency (Foreign Currency/Japanese Yen) and Maturity
<Assets> <Liabilities>
Figure 60: Foreign Currency-Denominated Debt Position by Component
Figure 61: Debt Position by Currency
<Deposit-taking corporations, <Other financial corporations>
except the central bank>
11 Figures in the Debt Position (Assets/Liabilities) by Currency (Foreign Currency/Japanese Yen) and
Debt Position (Assets/Liabilities) by Currency include debt instruments under "portfolio investment"
and "other investment." That is, equity instruments are excluded.
Looking at the debt position by currency in terms of foreign currency and Japanese yen,
assets increased mainly due to a rise in long-term foreign currency-denominated assets, while
liabilities increased mainly due to a rise in short-term yen-denominated liabilities. Looking
at foreign currency-denominated assets and liabilities by component, both assets and
liabilities increased mainly reflecting an increase in long-term debt securities.
0
100
200
300
400
2018 19 20 2018 19 20
Assets Liabilities
Short-term, otherShort-term, loansShort-term, debt securitiesLong-term, otherLong-term, loansLong-term, debt securities
tril. yen
year-end
0
50
100
150
200
250
300
2018 19 20 2018 19 20
Assets Liabilities
Japanese yen Other currencies Euro U.S. dollar
tril. yen
year-end
0
50
100
150
200
250
300
2018 19 20 2018 19 20
Assets Liabilities
tril. yen
year-end

26
I. Outward Direct Investment Position (Based on Directional Principle)
Figure 62: Outward Direct Investment Position by Region and Industry
Figure 63: Outward Investment Position in the Manufacturing Sector
Figure 64: Outward Investment Position in the Non-Manufacturing Sector
The outward direct investment position based on the directional principle decreased. By
region and industry, a major reason for the decrease was the decline in the investment
position in the manufacturing sector in Europe.
By industry, the investment position in the manufacturing sector decreased, mainly due
to a decline in "chemicals and pharmaceuticals." That in the non-manufacturing sector
decreased for the first time since 2006, from when comparable data are available, mainly due
to a decline in communications.
0
20
40
60
80
100
120
2005 06 07 08 09 10 11 12 13 14 15 16 17 18 19 20
Other non-manufacturing Services
Communications Mining
Wholesale and retail Finance and insurance
tril. yen
year-end
0
50
100
150
200
2005 06 07 08 09 10 11 12 13 14 15 16 17 18 19 20
Non-manufacturing, other regions Manufacturing, other regionsNon-manufacturing, Asia Manufacturing, AsiaNon-manufacturing, North America Manufacturing, North AmericaNon-manufacturing, Europe Manufacturing, Europe
tril. yen
year-end
0
20
40
60
80
100
120
2005 06 07 08 09 10 11 12 13 14 15 16 17 18 19 20
Other manufacturing General machinery
Food Electric machinery
Chemicals and pharmaceuticals Transportation equipment
tril. yen
year-end
27
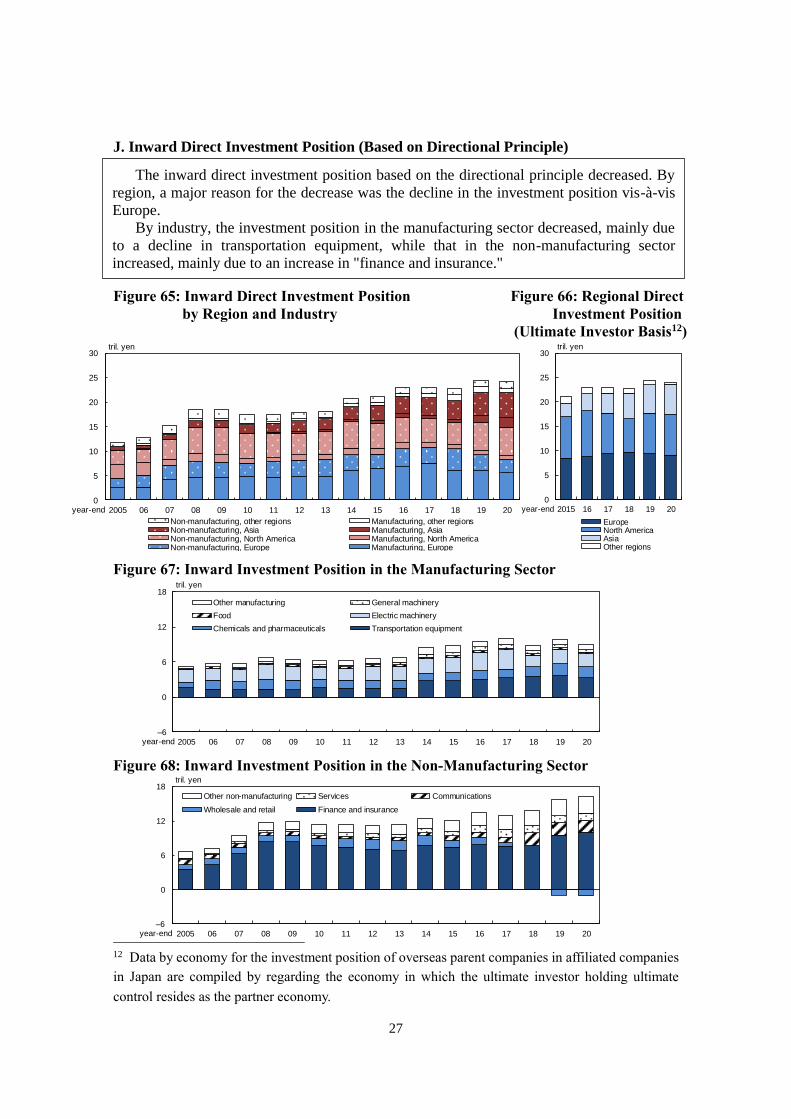
J. Inward Direct Investment Position (Based on Directional Principle)
Figure 65: Inward Direct Investment Position Figure 66: Regional Direct
by Region and Industry Investment Position
(Ultimate Investor Basis12)
Figure 67: Inward Investment Position in the Manufacturing Sector
Figure 68: Inward Investment Position in the Non-Manufacturing Sector
12 Data by economy for the investment position of overseas parent companies in affiliated companies
in Japan are compiled by regarding the economy in which the ultimate investor holding ultimate
control resides as the partner economy.
The inward direct investment position based on the directional principle decreased. By
region, a major reason for the decrease was the decline in the investment position vis-à-vis
Europe.
By industry, the investment position in the manufacturing sector decreased, mainly due
to a decline in transportation equipment, while that in the non-manufacturing sector
increased, mainly due to an increase in "finance and insurance."
0
5
10
15
20
25
30
2005 06 07 08 09 10 11 12 13 14 15 16 17 18 19 20
Non-manufacturing, other regions Manufacturing, other regionsNon-manufacturing, Asia Manufacturing, AsiaNon-manufacturing, North America Manufacturing, North AmericaNon-manufacturing, Europe Manufacturing, Europe
tril. yen
year-end
0
5
10
15
20
25
30
2015 16 17 18 19 20
EuropeNorth AmericaAsiaOther regions
tril. yen
year-end
–6
0
6
12
18
2005 06 07 08 09 10 11 12 13 14 15 16 17 18 19 20
tril. yen
year-end
Other manufacturing General machinery
Food Electric machinery
Chemicals and pharmaceuticals Transportation equipment
–6
0
6
12
18
2005 06 07 08 09 10 11 12 13 14 15 16 17 18 19 20
tril. yen
year-end
Other non-manufacturing Services Communications
Wholesale and retail Finance and insurance

28
K. International Comparison of Net IIP
Figure 69: International Comparison of Net IIP (Time Series)
Source: IMF.
Figure 70: International Comparison of Net IIP at Year-End 2020
Source: IMF.
Among major economies that release IIP data, Japan at year-end 2020 continued to record
the largest net asset position, which amounted to 357.0 trillion yen.
–1,600
–1,400
–1,200
–1,000
–800
–600
–400
–200
0
200
400
199697 98 99 200001 02 03 04 05 06 07 08 09 10 11 12 13 14 15 16 17 18 19 20
Japan
Germany
Hong Kong
China
Italy
France
United Kingdom
United States
tril. yen
year-end
–1,600
–1,400
–1,200
–1,000
–800
–600
–400
–200
0
200
400
600
UnitedStates
UnitedKingdom
France Italy China Hong Kong Germany Japan
tril. yen
Reserve assets
Other investment
Financial derivatives (other than reserves)
Portfolio investment
Direct investment
Net assets

29
–8
–6
–4
–2
0
2
4
6
1996 98 2000 02 04 06 08 10 12 14 16 18 20
Air passenger transport Air freight transportSea freight transport OtherTransport
↑ Credit (receipts), surplus
↓ Debit (payments), deficit
tril. yen
Appendix 1. Impact of the Spread of COVID-19 on Goods and Transport
While Japan in 2020 registered an increase in the surplus on goods, on a gross basis, both
exports and imports fell substantially. The decline in exports was the largest since 2009 in the
wake of the Global Financial Crisis, and the second largest since 1997, from when
comparable data are available. The decline in imports also was the largest after the drops in
2009 and 2016.1 As the spread of COVID-19 restricted the movement of people and goods,
there was a decline in both receipts and payments for passenger and freight transport. This
appendix examines the impact of the spread of COVID-19 by looking at monthly
developments in exports and imports, as well as developments in individual items of transport.
Appendix Figure 1.1: Goods Appendix Figure 1.2: Transport (Annual)
Goods
Monthly developments in exports during 2020 show that the year-on-year rate of decline
accelerated from around February to May but then decelerated toward the end of the year
amid the economic stimulus measures taken by economies around the world, so that in
December the year-on-year rate of change turned positive. Exports of transport equipment to
North America and the European Union (EU) played a major role in these developments.
However, differences were seen in the pace of recovery in exports to the two regions.
Specifically, while exports to North America by the end of 2020 had generally returned to the
same level as in 2019, the pace of recovery in exports to the EU was slower than that to North
America, and exports by the end of 2020 had not recovered to the previous year's level, as
preventive measures against COVID-19 such as lockdowns were still being taken in the
second half of the year. Meanwhile, as for exports to China, the decline in the first half of the
year was small as COVID-19 subsided early in China, and in the second half of the year, the
year-on-year rate of change in exports turned positive, led by exports of motor vehicles and
"semiconductor machinery etc."
1 The decline in imports in 2016 was mainly due to the drop in crude oil prices.
–100
–80
–60
–40
–20
0
20
40
60
80
100
1996 98 2000 02 04 06 08 10 12 14 16 18 20
Exports
Imports
Goods
tril. yen

30
Turning to imports, overall imports decreased mainly reflecting the decrease in imports of
mineral fuels from the Middle East. Moreover, the pace of recovery in imports was slower
than that in exports, as the effects of the drop in crude oil prices and a decline in fuel demand
lingered throughout the year, so that the year-on-year change in imports remained negative
through the end of 2020.
Appendix Figure 1.3: Year-on-Year Appendix Figure 1.4: Year-on-Year
Changes in Exports Changes in Imports
by Region by Region
Source: Ministry of Finance, "Trade Statistics of Japan."
Transport
The decrease in exports and imports of goods as well as the decrease in the number of
travelers seen in travel also had an impact on transport.
As for the movement of people, in 2020, the number of travelers both entering and leaving
Japan decreased by more than 80 percent compared to the previous year, and air passenger
transport receipts decreased by 75 percent while payments declined by 84 percent. The larger
decline in payments, coupled with the fact that payments have historically outstripped
receipts, meant that the net deficit declined.
As for the movement of goods, the decrease in exports and imports affected receipts and
payments for freight transport. In the BOP statistics, since importers are regarded to bear not
only the cost of goods but also the cost of freight charges, freight charges received by
Japanese carriers for exports from Japan are recorded as receipts, and freight charges paid to
foreign carriers for imports into Japan are recorded as payments. 2 In addition, freight
transport receipts/payments also include receipts/payments of charter fees for freight ships
and aircraft.
2 Payments to foreign carriers are estimated by dividing the receipts of Japanese carriers for imports
by the share of Japanese carriers.
–30
–25
–20
–15
–10
–5
0
5
10
Jan. Mar. May July Sept. Nov. Jan. Mar. May July Sept. Nov.
North America
EU
China
Middle East
Other regions
Total
% pts., %
2019 20
–30
–25
–20
–15
–10
–5
0
5
10
Jan. Mar. May July Sept. Nov. Jan. Mar. May July Sept. Nov.
North America
EU
China
Middle East
Other regions
Total
% pts., %
2019 20
31
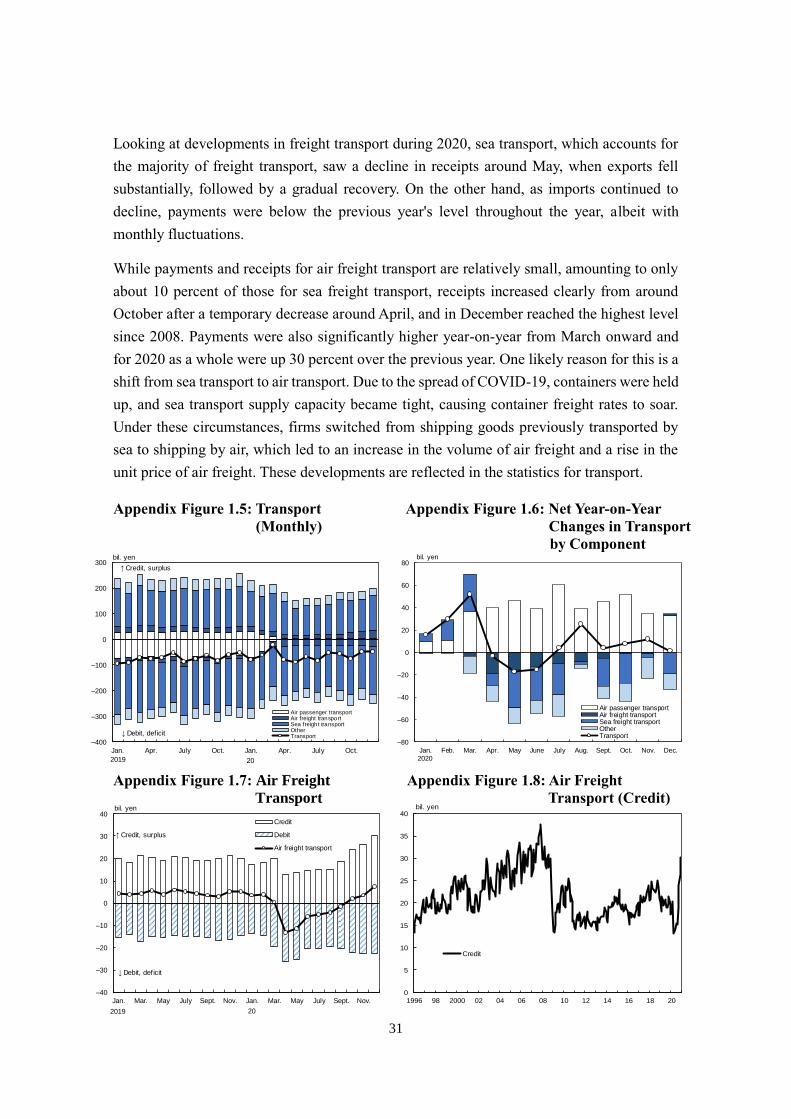
Looking at developments in freight transport during 2020, sea transport, which accounts for
the majority of freight transport, saw a decline in receipts around May, when exports fell
substantially, followed by a gradual recovery. On the other hand, as imports continued to
decline, payments were below the previous year's level throughout the year, albeit with
monthly fluctuations.
While payments and receipts for air freight transport are relatively small, amounting to only
about 10 percent of those for sea freight transport, receipts increased clearly from around
October after a temporary decrease around April, and in December reached the highest level
since 2008. Payments were also significantly higher year-on-year from March onward and
for 2020 as a whole were up 30 percent over the previous year. One likely reason for this is a
shift from sea transport to air transport. Due to the spread of COVID-19, containers were held
up, and sea transport supply capacity became tight, causing container freight rates to soar.
Under these circumstances, firms switched from shipping goods previously transported by
sea to shipping by air, which led to an increase in the volume of air freight and a rise in the
unit price of air freight. These developments are reflected in the statistics for transport.
Appendix Figure 1.5: Transport Appendix Figure 1.6: Net Year-on-Year
(Monthly) Changes in Transport
by Component
Appendix Figure 1.7: Air Freight Appendix Figure 1.8: Air Freight
Transport Transport (Credit)
0
5
10
15
20
25
30
35
40
1996 98 2000 02 04 06 08 10 12 14 16 18 20
Credit
bil. yen
–40
–30
–20
–10
0
10
20
30
40
Jan. Mar. May July Sept. Nov. Jan. Mar. May July Sept. Nov.
Credit
Debit
Air freight transport
↑ Credit, surplus
↓ Debit, deficit
bil. yen
2019 20
–400
–300
–200
–100
0
100
200
300
Jan. Apr. July Oct. Jan. Apr. July Oct.
Air passenger transportAir freight transportSea freight transportOtherTransport
↑ Credit, surplus
↓ Debit, deficit
bil. yen
2019 20
–80
–60
–40
–20
0
20
40
60
80
Jan. Feb. Mar. Apr. May June July Aug. Sept. Oct. Nov. Dec.
Air passenger transportAir freight transportSea freight transportOtherTransport
bil. yen
2020
32
Appendix 2. Components under Goods
While the Trade Statistics of Japan (the Trade Statistics) are the main data source for "goods"
in Japan's BOP statistics, the coverage of transactions and the time of recording differ between
the BOP statistics and the Trade Statistics. The Trade Statistics record goods that have crossed
Japan's customs frontier, regardless of whether ownership of the goods has changed. On the
other hand, the BOP statistics record goods whose ownership has changed between residents
and nonresidents, regardless of whether they have crossed Japan's customs frontier. The BOP
data on "goods" therefore are compiled and disseminated after necessary adjustments to the
Trade Statistics data have been made, such as making certain additions to and deductions
from exports and imports depending on whether there have been changes in ownership.1
In response to the government's "Basic Policy for the Fundamental Reform of Economic
Statistics," which calls for a clarification of the differences between exports/imports of goods
in the BOP statistics and the Trade Statistics, the BOP statistics released from November
2020 onward include a breakdown of adjustments to figures in the Trade Statistics.2 Looking
at components under goods in the BOP statistics makes it possible to understand and analyze
developments in trade that cannot be ascertained using the Trade Statistics alone. The
following is an overview of (1) the newly released additions to and deductions from the Trade
Statistics and (2) developments in merchanting.
(1) Additions to and deductions from the Trade Statistics
Looking at additions to and deductions from exports and imports shows that deductions
exceed additions for both exports and imports.
1 For an overview of the differences between the BOP statistics and the Trade Statistics, see the
reference table in Section III. A. 2 For details, see "Changes in the Compilation and Dissemination of the Balance of Payments
Statistics in Response to the 'Basic Policy for the Fundamental Reform of Economic Statistics'"
(October 2020).

33
Appendix Figure 2.1: Adjustments to Appendix Figure 2.2: Adjustments to
Exports Imports
The bulk of deductions is for "re-export/re-import goods." These include goods that cross the
customs frontier but are returned without change of ownership. In addition, figures from the
Trade Statistics are adjusted by deducting freight charges and insurance premiums from
imports. "Goods not passing through Japanese customs," which account for the bulk of
additions, include goods for resale through transactions between resident merchants that are
traded without passing through Japan. For example, a transaction in which resident X
purchases goods from country A, sells them to resident Y, who then resells the goods to
country B, so that the actual goods never pass through Japan, is not recorded in the Trade
Statistics because the goods do not cross Japan's customs frontier; however, the transaction
is included in the BOP statistics because ownership changes between residents and
nonresidents.3
3 Such transactions are very similar to the merchanting described below. However, because at the
time of purchase, resident X does not know whether resident Y will resell the goods purchased from
country A to another country, the sixth edition of the IMF's Balance of Payments and International
Investment Position Manual (BPM6) treats such transactions as general merchandise trade rather than
merchanting.
–10
–8
–6
–4
–2
0
2
4
6
8
2014 15 16 17 18 19 20
tril. yen
Goods not passing through Japanese customs
Other additions
Re-export/re-import goods
Other deductions
Additions to exports on a Trade Statistics basis
Deductions from exports on a Trade Statistics basis
–10
–8
–6
–4
–2
0
2
4
6
8
2014 15 16 17 18 19 20
tril. yen
Goods not passing through Japanese customs
Other additions
Re-export/re-import goods
Other deductions
Additions to imports on a Trade Statistics basis
Deductions from imports on a Trade Statistics basis
34
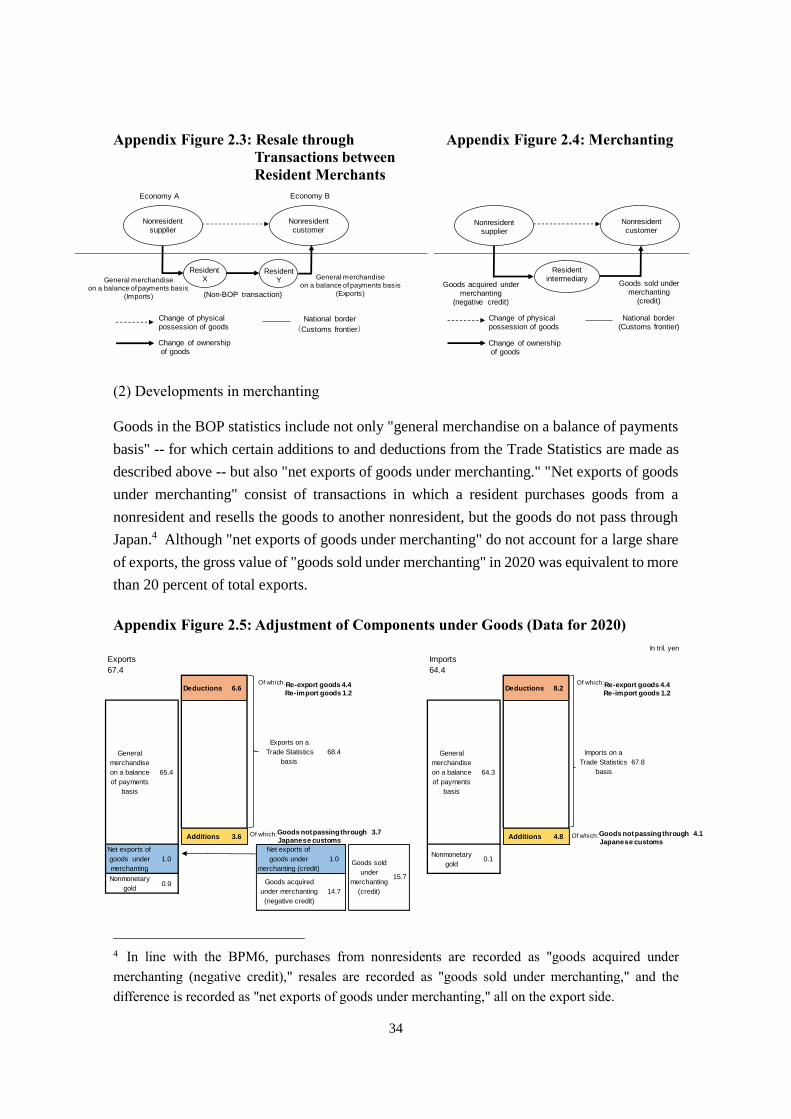
Appendix Figure 2.3: Resale through Appendix Figure 2.4: Merchanting
Transactions between
Resident Merchants
(2) Developments in merchanting
Goods in the BOP statistics include not only "general merchandise on a balance of payments
basis" -- for which certain additions to and deductions from the Trade Statistics are made as
described above -- but also "net exports of goods under merchanting." "Net exports of goods
under merchanting" consist of transactions in which a resident purchases goods from a
nonresident and resells the goods to another nonresident, but the goods do not pass through
Japan.4 Although "net exports of goods under merchanting" do not account for a large share
of exports, the gross value of "goods sold under merchanting" in 2020 was equivalent to more
than 20 percent of total exports.
Appendix Figure 2.5: Adjustment of Components under Goods (Data for 2020)
4 In line with the BPM6, purchases from nonresidents are recorded as "goods acquired under
merchanting (negative credit)," resales are recorded as "goods sold under merchanting," and the
difference is recorded as "net exports of goods under merchanting," all on the export side.
Nonresidentsupplier
Nonresidentcustomer
ResidentX
ResidentYGeneral merchandise
on a balance of payments basis(Imports)
General merchandiseon a balance of payments basis
(Exports)
National border
(Customs frontier)
Economy A Economy B
Change of physicalpossession of goods
Change of ownershipof goods
(Non-BOP transaction)
Nonresidentsupplier
Nonresidentcustomer
Residentintermediary
Goods acquired under merchanting
(negative credit)
Goods sold under merchanting
(credit)
Change of physicalpossession of goods
Change of ownershipof goods
National border(Customs frontier)
In tril. yen
Exports Imports
67.4 64.4
Deductions 6.6 Deductions 8.2
Imports on a
Trade Statistics
basis
67.8
Additions 3.6 Additions 4.8
Net exports of
goods under
merchanting
1.0
Net exports of
goods under
merchanting (credit)
1.0Nonmonetary
gold0.1
Nonmonetary
gold0.9
General
merchandise
on a balance
of payments
basis
64.3
14.7
General
merchandise
on a balance
of payments
basis
65.4
Goods acquired
under merchanting
(negative credit)
15.7
Goods sold
under
merchanting
(credit)
68.4
Exports on a
Trade Statistics
basis
Of which:Re-export goods 4.4
Re-import goods 1.2
Of which:Re-export goods 4.4
Re-import goods 1.2
Of which:Goods not passing through 3.7
Japanese customsOf which:Goods not passing through 4.1
Japanese customs

35
Looking at merchanting by partner economy, merchanting overall largely consists of the
purchase of goods from economies such as the ASEAN countries, China, Taiwan, and South
Korea, as well as the resale of such goods to Europe and the United States at a profit.
Developments in merchanting in recent years show that the ratio of goods sold under
merchanting to exports has been on a gradual downward trend. In merchanting, the difference
between the value of goods sold and the costs of acquiring them is regarded as the
merchanting margin, and looking at the ratio of this margin to the value of goods acquired
(the margin ratio) shows that it has been on an upward trend in recent years.
One possible explanation for this trend is that merchanting may be shrinking due to (1)
strategic withdrawal from transactions with low margins and (2) the fact that, as merchants
change their business practices, some of the transactions that used to fall under merchanting
are no longer subject to inclusion in the BOP statistics, such as transactions among
nonresidents.
Appendix Figure 2.6: Merchanting by Appendix Figure 2.7: Merchanting by
Region (Acquisitions/Sales) Region (Net)
Appendix Figure 2.8: Exports and Appendix Figure 2.9: Margin Ratio
Merchanting
0
5
10
15
20
25
Acq
uis
itio
ns
Sa
les
Acq
uis
itio
ns
Sa
les
Acq
uis
itio
ns
Sa
les
Acq
uis
itio
ns
Sa
les
Acq
uis
itio
ns
Sa
les
Acq
uis
itio
ns
Sa
les
2015 16 17 18 19 20
China Hong Kong TaiwanSouth Korea ASEAN United StatesEU United Kingdom Other
tril. yen
–6
–4
–2
0
2
4
6
8
2015 16 17 18 19 20
China Hong KongTaiwan South KoreaASEAN United StatesEU United KingdomOtherNet exports of goods under merchanting
↑ Net sales
↓ Net acquisitions
tril. yen
0
5
10
15
20
25
30
35
–30
–25
–20
–15
–10
–5
0
5
10
15
20
2015 16 17 18 19 20
Exports
Goods sold under merchanting
Ratio of goods sold under merchanting to exports (right scale)
y/y % chg. %
0
1
2
3
4
5
6
7
8
2014 15 16 17 18 19 20
%

36
0
10
20
30
40
2012 13 14 15 16 17 18 19 20
Total gross investments in equity capital
Investments of 10 billion yen or more
M&A type transactions
tril. yen
0
20
40
60
80
100
2012 13 14 15 16 17 18 19 20
Other investments
Investment for financial restructuring
Extension of capital for the expansion
of business operations1
%
Greenfield investment
M&A type transactions
Appendix 3. Developments in Direct Investment by Type of Investment1,2,3
Developments in direct investment classified by type of investment show the following.
Starting with direct investment assets, in 2020, M&A type transactions consisting of the
acquisition of foreign firms continued to account for a significant share. The second-largest
share was accounted for by the extension of capital for the expansion of overseas business
operations. Greenfield investment -- in which new enterprises are established by investors --
continued to be low.
On the other hand, investments under direct investment liabilities continued to be low
compared to those under direct investment assets. A breakdown by type of investment shows
that while the extension of capital for the expansion of business operations continued to
account for a significant share, the share of investment for financial restructuring increased
in 2020.
Appendix Figure 3.1: Direct Investment Assets by Type of Investment on a Gross
Value Basis (Investments of 10 Billion Yen or More)
bil. yen
Direct investment
assets
M&A type
transactions
Greenfield
investment
Extension of capital
for the expansion of
business operations
Investment for
financial
restructuring
Other
investments
Total gross
investments in
equity capital
2012 2,224.6 65.2 1,795.0 524.1 64.1 9,783.7
2013 4,750.3 143.4 2,411.4 435.2 273.8 12,491.6
2014 4,013.9 81.9 1,370.2 484.9 77.2 12,565.4
2015 5,419.2 55.1 2,285.7 304.9 ─ 12,998.0
2016 8,761.7 101.5 2,848.8 530.0 38.0 18,785.4
2017 5,798.5 77.7 2,375.5 594.2 497.9 15,233.4
2018 3,391.3 172.9 3,096.0 600.7 38.6 19,572.6
2019 13,405.4 52.0 3,584.7 1,353.5 193.7 34,600.0
2020 6,251.7 79.0 3,106.4 681.4 306.9 22,156.5
Note: Total gross investments in equity capital include investments below 10 billion yen.

37
Appendix Figure 3.2: Direct Investment Liabilities by Type of Investment on a Gross
Value Basis (Investments of 10 Billion Yen or More)
1 In accordance with the BPM6 and the OECD Benchmark Definition of Foreign Direct Investment,
Fourth Edition (BD4), 2008, direct investment transactions (gross investments in equity capital) are
classified into the following five types of investment based on the purpose of investment in the ultimate
investee enterprises: (1) M&A type transactions: investment for the acquisition of existing shares; (2)
greenfield investment: investment for the establishment of new enterprises; (3) extension of capital
for the expansion of business operations: investment for the expansion of business operations; (4)
investment for financial restructuring: investment for debt repayment or loss reduction; and (5) other
investments: other investments including investment in corporate type investment trusts. 2 Reference figures. The classification is applied only to direct investment transactions (gross
investments in equity capital) of 10 billion yen or more. 3 Figures before 2014 based on the fifth edition of the Balance of Payments Manual (BPM5) have
been retroactively revised as far back as possible and have been reclassified to the extent possible for
comparability following current international standards.
0
1
2
3
4
5
2012 13 14 15 16 17 18 19 20
Total gross investments in equity capital
Investments of 10 billion yen or more
M&A type transactions
tril. yen
0
20
40
60
80
100
2012 13 14 15 16 17 18 19 20
Other investments
Investment for financial restructuring
Extension of capital for the expansion
of business operations
M&A type transactions
%
bil. yen
Direct investment
liabilities
M&A type
transactions
Greenfield
investment
Extension of capital
for the expansion of
business operations
Investment for
financial
restructuring
Other
investments
Total gross
investments in
equity capital
2012 277.3 ─ 187.7 270.5 35.5 1,973.7
2013 165.8 ─ 63.8 276.6 68.2 1,496.4
2014 656.9 ─ 351.1 345.3 29.5 4,202.8
2015 577.1 ─ 177.2 183.4 ─ 2,028.8
2016 403.8 ─ 513.1 83.3 22.3 2,122.7
2017 736.4 ─ 358.5 35.2 21.7 2,393.1
2018 936.2 ─ 91.4 154.4 ─ 2,892.8
2019 821.3 ─ 864.9 178.4 ─ 3,482.9
2020 327.0 ─ 430.1 164.6 ─ 2,397.1
Note: Total gross investments in equity capital include investments below 10 billion yen.

38
–12
–8
–4
0
4
8
12
16
20
24
–20
–10
0
10
20
30
40
1996 97 98 99 2000 01 02 03 04 05 06 07 08 09 10 11 12 13 14 15 16 17 18 19 20
Other investment income Portfolio investment income
Direct investment income Net investment income (right scale)
Net direct investment income (right scale) Net portfolio investment income (right scale)
Net other investment income (right scale)
↑ Credit (receipts)
↓ Debit (payments)
tril. yen tril. yen
Appendix 4. Developments in Direct Investment Income and Its Recording Method
Since the latter half of the 2000s, the surplus on primary income, especially the surplus on
investment income, has been a major contributor to Japan's current account surplus. However,
while the surplus on investment income recorded a peak in 2015 and subsequently remained
more or less unchanged, in 2020, it decreased for the first time in four years.
Developments in investment income by component1
Looking at investment income by component, although the surplus on direct investment
income had followed an increasing trend, it decreased slightly in 2020. In contrast, the surplus
on portfolio investment income continued to decrease from 2016, as payments followed an
increasing trend. As a result, direct investment income overtook portfolio investment income
in 2018, and the gap has been widening since. While the surplus on other investment income
remained more or less unchanged, both receipts and payments decreased substantially in 2020
due to a decline in interest rates.
Appendix Figure 4.1: Investment Income
1 Investment income is classified into income on direct investment, portfolio investment, and other
investment depending on the functional category of the principal. Income from reserve assets, however,
only falls into either portfolio investment income or other investment income, depending on the type
of instrument (for example, interest on U.S. government bonds is included under "interest" in portfolio
investment income).
39
Understanding developments in direct investment income
Unlike investment income on equity and investment fund shares under portfolio investment
income, income on equity and investment fund shares under direct investment income records
not only dividends and withdrawals from income of quasi-corporations (hereafter "dividends
etc.") distributed to investors but also earnings retained by subsidiaries as reinvested earnings.
With direct investment, there are many cases in which dividend payments are irregular
depending on the financial strategy of the parent company and profits for several years are
distributed all at once. In the BOP statistics, profits earned by a subsidiary in a particular
period (excluding holding gains and losses) are recorded under income on equity and
investment fund shares, since they are considered as profits that belong to the parent company
regardless of whether they are distributed or not.2,3
Looking at recent developments in direct investment income, receipts continued to increase
until 2019 on the back of an increase in the position of direct investment assets. Even in 2016,
when receipts of "dividends etc." decreased amid the appreciation of the yen, receipts of
reinvested earnings increased sufficiently to make up for this decrease. Turning to payments,
from 2016 to 2019, they remained more or less unchanged, and the rate of return, calculated
as investment income divided by the direct investment position at the previous year-end,
declined. The reason is that although the position of direct investment liabilities increased,
changes in payments of "dividends etc." were offset by those in reinvested earnings payments.
While in 2020 both receipts and payments declined due to a decrease in "dividends etc.," it
should be noted that figures for reinvested earnings are currently provisional (figures for April
2019 are carried forward for May 2019 onward), as described in the following section.
2 For BOP recording purposes, it is assumed that earnings are distributed to the parent company and
immediately reinvested by the parent, and the same amount is recorded for both direct investment
income (reinvested earnings) and direct investment under the financial account (reinvestment of
earnings). 3 There are cases in which dividend payments from a subsidiary to its parent company exceed the
profits earned in a particular period. Such transactions are essentially withdrawals of the investment
by the parent company from the subsidiary. In Japan's BOP statistics, such payments in principle are
first recorded as payments of "dividends etc.," and the same amounts are then reflected as negative
values in reinvested earnings and reinvestment of earnings.

40
0
5
10
15
20
25
30
0
50
100
150
200
250
2014 15 16 17 18 19 20
Debt instruments Reinvestment of earnings
Equity other than reinvestment of earnings Rate of return on direct investment (right scale)
Rate of return on equity (right scale) Rate of return on debt instruments (right scale)
tril. yen %
0
5
10
15
20
25
30
0
10
20
30
40
50
2014 15 16 17 18 19 20
tril. yen %
–5
0
5
10
15
20
2014 15 16 17 18 19 20
Interest
Reinvested earnings
Dividends etc.
Net direct investment income
↑ Credit
↓ Debit
tril. yen
Appendix Figure 4.2: Direct Investment Income
Appendix Figure 4.3: Direct Investment Position and Rate of Return4
(Assets) (Liabilities)
4 The rate of return is calculated by dividing the annual investment income receipts/payments by the
asset/liability position at the previous year-end. However, the rate of return on equity is calculated by
dividing income on equity and investment fund shares (the sum of "dividends etc." and "reinvested
earnings") by the shareholders' equity position (the sum of "equity other than reinvestment of earnings"
and "reinvestment of earnings").

41
Method of recording and revising reinvested earnings
In Japan, figures for reinvested earnings are prepared using reports based on firms' financial
statements. 5 Until financial statements data become available for the statistics, figures
reflecting the amounts reported by firms whose accounting year ends in March -- which
constitute the large majority in Japan -- are carried forward (at present, these are figures for
April 2019, which are the first to reflect the reports of firms whose accounting year ended in
March 2020). Then, in November each year, reported amounts are aggregated and the figures
are replaced with the data for the relevant period in which the earnings accrue.6
The financial statements of firms whose accounting year ended in March 2021, which show
the impact of COVID-19, will be reflected in the figures for April 2020 onward in the revision
in November 2021.
Appendix Figure 4.4: Reflection of Accrued Earnings in the Recording of Reinvested
Earnings
5 One twelfth of the annual total of retained earnings are recorded as reinvested earnings for each
month, as retained earnings for a certain accounting year are deemed to be earned equally over that
year. 6 For details, see "FAQs on the Balance of Payments Related Statistics" on the Bank's website. In the
past, data from 17 months earlier were recorded as preliminary figures until the actual figures from
firms' financial statements became available. The actual figures were then used to replace the
preliminary figures when the annual revisions were released. In November 2020, the way in which
reinvested earnings are recorded and revised was changed in line with the government's "Basic Policy
for the Fundamental Reform of Economic Statistics," which called for a reconsideration of the
recording of reinvested earnings for harmonization with the System of National Accounts. For details,
see "Changes in the Compilation and Dissemination of the Balance of Payments Statistics in Response
to the 'Basic Policy for the Fundamental Reform of Economic Statistics'" (October 2020).
–1.0
–0.5
0.0
0.5
1.0
1.5
2.0
Jan. Feb. Mar. Apr . May June July Aug. Sept. Oct. Nov. Dec. Jan. Feb. Mar. Apr . May June July Aug. Sept. Oct. Nov. Dec. Jan. Feb. Mar. Apr . May June July Aug. Sept. Oct. Nov. Dec.
Dividends etc. Reinvested earnings
2018
Figures of reinvested earnings for April 2019 are carried forward for May 2019 onw ard.
↑ Credit
↓ Debit
Earnings of f irms w hose accounting year ends in March 2020 are reflected.
tril. yen
19 20

42
Appendix 5. Update of the IMF's Balance of Payments and International Investment
Position Manual
The International Monetary Fund (IMF) requires its member countries to provide balance of
payments (BOP) related information under the Articles of Agreement of the IMF. It publishes
the Balance of Payments and International Investment Position Manual (BPM), which serves
as the international standard for the compilation of the BOP statistics and provides guidelines
for reporting the BOP data to the IMF. Japan's BOP statistics are compiled based on the latest
version, which is the BPM6 published in 2008.
Many economies around the world also compile their BOP statistics based on the BPM6,
enabling international aggregation and comparison of the data. However, considerable time
has passed since its publication, making it necessary to address issues that the BPM6
framework does not fully capture, such as (1) the closer trade and financial ties between
economies, mainly through multinational enterprises, and (2) the growing need for data to
analyze financial interconnections and vulnerabilities in the aftermath of the Global Financial
Crisis.
In 2020, the United Nations Statistical Commission launched discussions on the update of
the System of National Accounts (SNA) targeting a release of the revised standard in 2025.
At the same time, the IMF Committee on Balance of Payments Statistics (BOPCOM) --
consisting of national compilers of BOP statistics and officials of international organizations
-- endorsed the launch of the process for updating the BPM6 with a view to ensuring
consistency between the statistical standards for macroeconomic statistics.
Technical expert groups, such as the Balance of Payments Task Team, the Current Account
Task Team, the Direct Investment Task Team, and the Financial and Payments Systems Task
Team, have been set up by BOPCOM, and these groups are currently discussing issues to be
considered for the BPM update. Based on the proposals by these groups, BOPCOM will
decide on the direction of the update and the manual will be revised for release in 2025.
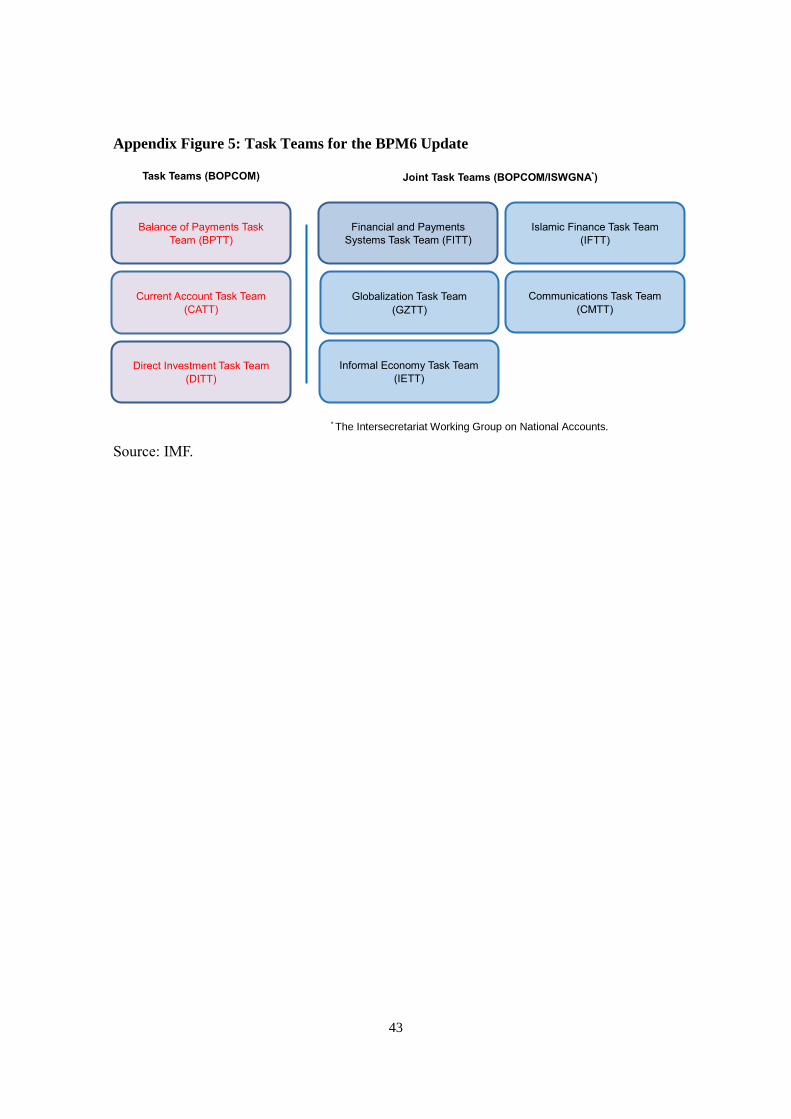
43
Appendix Figure 5: Task Teams for the BPM6 Update
Source: IMF.
Balance of Payments Task
Team (BPTT)
Financial and Payments
Systems Task Team (FITT)
Globalization Task Team
(GZTT)
Informal Economy Task Team
(IETT)
Islamic Finance Task Team
(IFTT)
Communications Task Team
(CMTT)
Current Account Task Team
(CATT)
Direct Investment Task Team
(DITT)
Task Teams (BOPCOM) Joint Task Teams (BOPCOM/ISWGNA*)
* The Intersecretariat Working Group on National Accounts.

44
Appendix 6. Issues regarding Developments in the International Investment Position by
Factor and Challenges Ahead for Japan's Statistics
Discussions toward the Update of the IMF's Balance of Payments and International
Investment Position Manual (BPM)
In recent years, the external assets and liabilities of many countries have increased to record
levels. Along with this, the gap between changes in the international investment position (IIP)
and the financial account of the balance of payments (BOP) -- which shows flows arising
from transactions -- has been widening for many countries, and reconciliation between them
has become of particular interest from an analytical and policy perspective. In response to
this, in the discussions for the next version of the BPM (BPM7), it has been proposed to place
an integrated IIP statement comprising the "beginning of period IIP," "changes in the IIP by
factor," and the "end of period IIP" at the center of the BPM7 and elevate "changes in the IIP
by factor" to a third element on par with the BOP and IIP.
Specifically, the proposal is to break down changes in positions not resulting from
transactions into (1) "revaluations," which consist of "exchange rate changes" and "other price
changes," and (2) changes in volume other than through transactions referred to as "other
changes in volume" and to include these items as additional standard components in the
BPM7. The proposal would also encourage the dissemination of "write-offs and
cancellations" and "reclassifications," which form part of "other changes in volume," as
supplementary items.1
Appendix Figure 6.1: Proposed Integrated IIP Statement and Data Availability in Japan
Current Practice of and Challenges Ahead for the Compilation of IIP Statistics in Japan
In Japan, estimates on year-on-year changes in the IIP by factor are disseminated for calendar
year-end positions. Specifically, estimates under "exchange rate changes" are obtained by
1 See "B.4 Reconciliation between Flows and Stocks" available on the Approved Guidance Notes
page of the IMF website.
Changes in the IIP by factor (accumulation accounts)
Exchange rate
changes
Other price
changes
Of which:
Write-offs
and
cancellations
Of which:
Reclassifi-
cations
Proposal for
BPM7*◎ ◎ ◎ ◎ ◎ ◎ ○ ○ ◎
Dissemination
in Japan●
●Transactions
─
●Exchange rate
changes
─ ─ ●
*The proposal recommends dissemination at the same level of detail as the IIP.
Legend: ◎ Standard components
○ Supplementary items (dissemination encouraged)
● Items currently available in Japan's statistics
Beginning
of period
IIP
End of
period IIP
Transactions
from BOP's
financial
account
●Other changes
Other changes in volumeRevaluations
45
multiplying positions denominated in foreign currencies at year-end and changes in exchange
rates (calculated by currency). Estimates under "other changes" are obtained by subtracting
changes classified under "transactions" and "exchange rate changes" from the changes in
positions and include (1) changes due to fluctuations in stock, bond, and other market prices
excluding exchange rates, (2) reclassifications,2 and (3) changes due to differences in the
way the BOP and IIP are compiled.3
However, these estimates have certain limitations. While changes due to exchange rate
changes are calculated based on the assumption that reports submitted under the Foreign
Exchange and Foreign Trade Act -- from which the IIP are compiled -- use the underlying
currency, the actual reports do not always use the underlying currency. For example, while
the source data for portfolio investment and outward direct investment are in principle
reported in the underlying currency, those for inward direct investment and financial
derivatives are reported in yen.
To compile data for Japan for the proposed integrated IIP, it would first be necessary to break
down changes due to "other changes" into those due to "other price changes" and "other
changes in volume." Regarding the estimation of changes due to price changes, while one
idea would be to use market information, compilers at national statistical offices are currently
sharing insights and working together to discuss possible approaches. Other issues to be
examined in Japan include (1) the collection of position data for items for which source data
are not available in the current reporting system and that are compiled by cumulating
transaction flows and (2) a switchover from reporting in yen terms to reporting in the
underlying currency.
(Reference) Developments in Japan's IIP by Factor
Looking at changes in Japan's IIP excluding financial derivatives (other than reserves) by
factor since 1997 shows that transactions have generally made a positive contribution to the
increases in both assets and liabilities.4 On the other hand, factors other than transactions
2 For example, when additional investment establishes a direct investment relationship, prior positions
under portfolio investment are reclassified as direct investment.
3 For example, "other changes" include differences between actual and provisional figures for the
reinvestment of earnings under direct investment, particularly until reinvested earnings actually earned
are reflected in the financial account (see Appendix 4). Moreover, "other changes" also include
changes related to tax payments (i.e., reinvestment of earnings is calculated before tax in the financial
account while it is calculated after tax in the IIP).
4 Except for items such as the payment of the option premium, financial derivatives at their inceptions
generally do not involve transactions that are recorded in the financial account, and investment
positions change during the contract period as prices in the underlying assets change. Since the
settlement of positions is recorded in the financial account as a reduction in assets and liabilities,
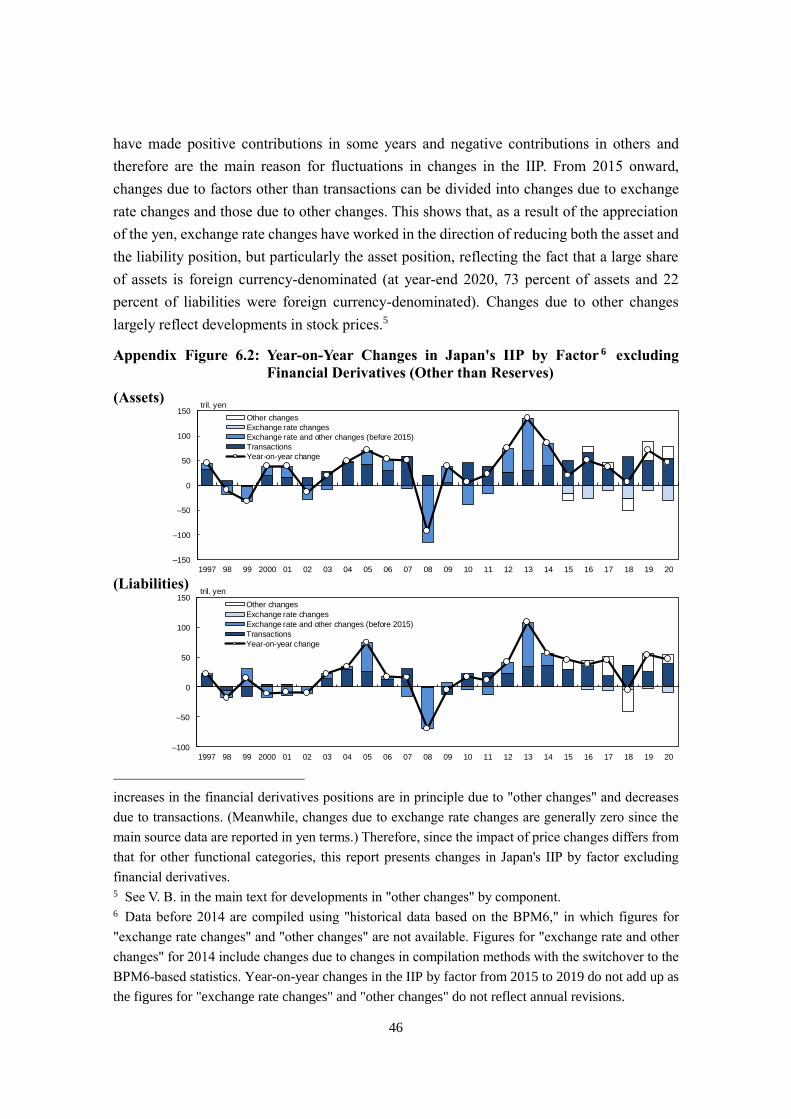
46
have made positive contributions in some years and negative contributions in others and
therefore are the main reason for fluctuations in changes in the IIP. From 2015 onward,
changes due to factors other than transactions can be divided into changes due to exchange
rate changes and those due to other changes. This shows that, as a result of the appreciation
of the yen, exchange rate changes have worked in the direction of reducing both the asset and
the liability position, but particularly the asset position, reflecting the fact that a large share
of assets is foreign currency-denominated (at year-end 2020, 73 percent of assets and 22
percent of liabilities were foreign currency-denominated). Changes due to other changes
largely reflect developments in stock prices.5
Appendix Figure 6.2: Year-on-Year Changes in Japan's IIP by Factor 6 excluding
Financial Derivatives (Other than Reserves)
(Assets)
(Liabilities)
increases in the financial derivatives positions are in principle due to "other changes" and decreases
due to transactions. (Meanwhile, changes due to exchange rate changes are generally zero since the
main source data are reported in yen terms.) Therefore, since the impact of price changes differs from
that for other functional categories, this report presents changes in Japan's IIP by factor excluding
financial derivatives. 5 See V. B. in the main text for developments in "other changes" by component. 6 Data before 2014 are compiled using "historical data based on the BPM6," in which figures for
"exchange rate changes" and "other changes" are not available. Figures for "exchange rate and other
changes" for 2014 include changes due to changes in compilation methods with the switchover to the
BPM6-based statistics. Year-on-year changes in the IIP by factor from 2015 to 2019 do not add up as
the figures for "exchange rate changes" and "other changes" do not reflect annual revisions.
–100
–50
0
50
100
150
1997 98 99 2000 01 02 03 04 05 06 07 08 09 10 11 12 13 14 15 16 17 18 19 20
Other changes
Exchange rate changes
Exchange rate and other changes (before 2015)
Transactions
Year-on-year change
tril. yen
–150
–100
–50
0
50
100
150
1997 98 99 2000 01 02 03 04 05 06 07 08 09 10 11 12 13 14 15 16 17 18 19 20
Other changes
Exchange rate changes
Exchange rate and other changes (before 2015)
Transactions
Year-on-year change
tril. yen