Embed Size (px)
Citation preview
3Q 2015 Financial Results
Japfa Ltd BOD Presentation

1
Agenda
Segmental Review 3
Financial Highlights 2
1 Company Overview
Growth Strategies 4
Company Overview
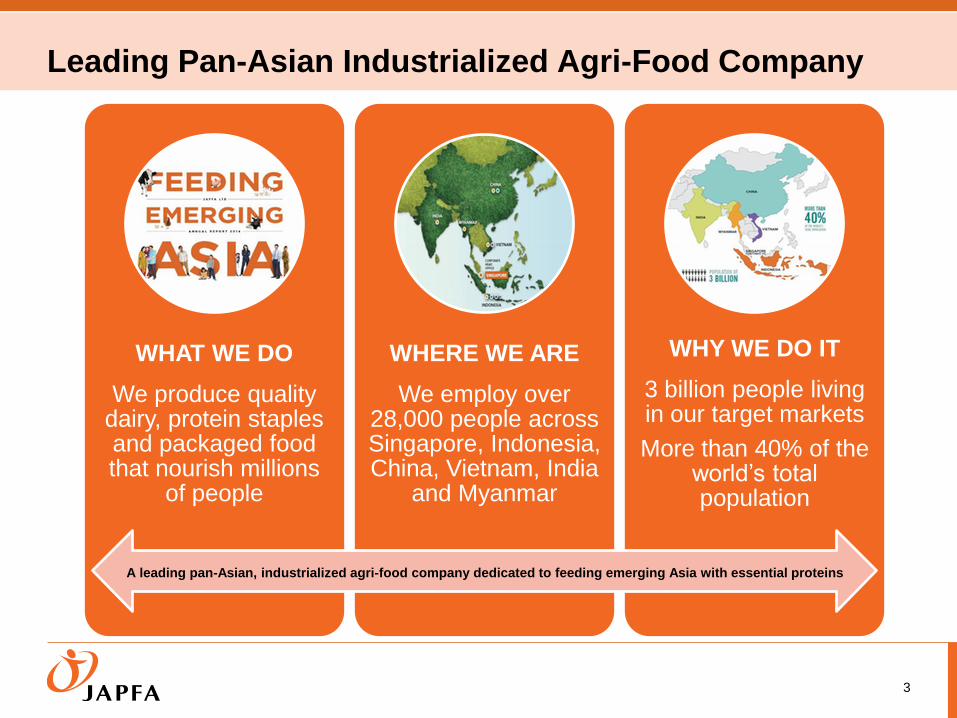
Leading Pan-Asian Industrialized Agri-Food Company
3
WHAT WE DO
We produce quality dairy, protein staples and packaged food that nourish millions
of people
WHERE WE ARE
We employ over 28,000 people across Singapore, Indonesia, China, Vietnam, India
and Myanmar
WHY WE DO IT
3 billion people living in our target markets
More than 40% of the world’s total population
A leading pan-Asian, industrialized agri-food company dedicated to feeding emerging Asia with essential proteins

Vertically Integrated Business Across Entire Value Chain
UPSTREAM: Animal Feed & Breeding
• Produce quality animal feed on an industrial scale
• Use world class genetics supported by advanced farming
technology to maximize efficiency in our breeding operations in
dairy cattle, poultry, beef cattle, swine and aquaculture
MIDSTREAM: Milking & Fattening
• Operate dairy milking parlours and commercial livestock
fattening farms
• Achieve quality and productivity gains through a combination of
superior livestock genetics, quality feed nutrition, and
international bio-security standards
DOWNSTREAM: Processing & Distribution
• Produce high quality consumer dairy, meat, and aquaculture
products with traceability and food safety assurance across the
entire supply chain
Ve
rtic
all
y In
teg
rate
d B
us
ine
ss
Mo
de
l
HOW WE DO IT
4

Bio-security
Technology and Genetics
Standardization / Replication
Large Scale
Core Competencies Across All Business Segments
5
INDUSTRIALIZED APPROACH TO FARMING AND FOOD PRODUCTION
Ability to manage mega-scale operations:
> 10,000 poultry commercial farms
> 600 million day-old-chicks (“DOCs”)
10 large scale dairy farms with more than 10,000 cattle per farm
28,000 employees across geographies
Replication of best practices and infrastructure design
Replication of farm design model in dairy farms, DOC breeding farms, feedmills, etc.
JVs with and for superior breeding and genetics
Advanced feed technology
Combined with best farm management practices
Best in class biosecurity means using stringent operating procedures
In-house vaccine production firm PT Vaksindo
1 2
3 4
We are a market leader across multiple classes of protein foods, with an emphasis on milk, poultry and beef, complemented by growing businesses in swine and aquaculture.
Financial Highlights
Overview of 3Q 2015
7
Revenue
-11.4% to
US$695.3m
Operating
Profit
+ 51.5% to
US$65.8m
EBITDA
+52.0% to
US$89.7m
Core PATMI
+ 17.5% to
US$14.1m
Gross Profit
+ 12.1% to
US$138.4m
Foreign
Exchange
Losses of
US$28.9m
Bio Assets
Valuation
Losses of
US$9.3m
Profit After Tax
-28.8% to
US$10.4m
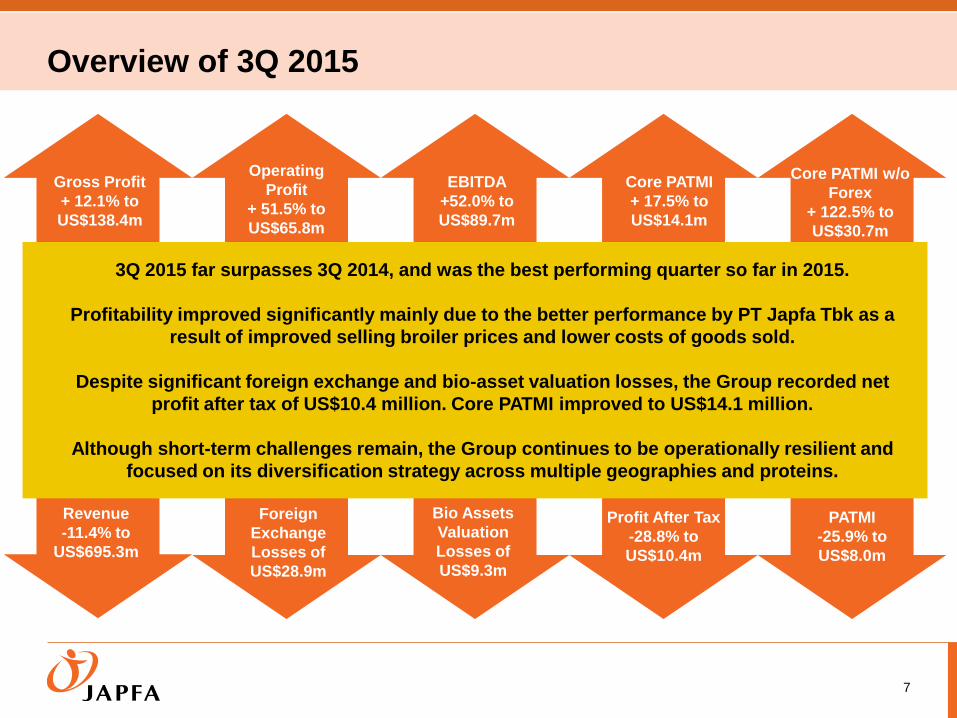
3Q 2015 far surpasses 3Q 2014, and was the best performing quarter so far in 2015.
Profitability improved significantly mainly due to the better performance by PT Japfa Tbk as a
result of improved selling broiler prices and lower costs of goods sold.
Despite significant foreign exchange and bio-asset valuation losses, the Group recorded net
profit after tax of US$10.4 million. Core PATMI improved to US$14.1 million.
Although short-term challenges remain, the Group continues to be operationally resilient and
focused on its diversification strategy across multiple geographies and proteins.
Core PATMI w/o
Forex
+ 122.5% to
US$30.7m
PATMI
-25.9% to
US$8.0m
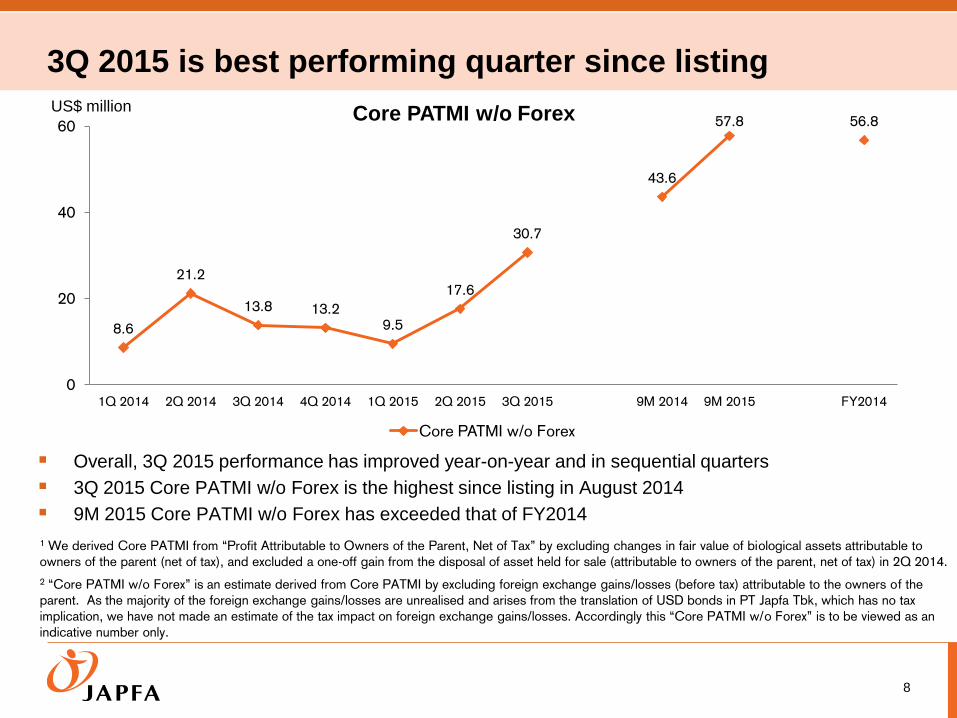
3Q 2015 is best performing quarter since listing
8.6
21.2
13.8 13.2 9.5
17.6
30.7
43.6
57.8 56.8
0
20
40
60
1Q 2014 2Q 2014 3Q 2014 4Q 2014 1Q 2015 2Q 2015 3Q 2015 - 9M 2014 9M 2015 Column1 FY2014
Core PATMI w/o Forex
8
Overall, 3Q 2015 performance has improved year-on-year and in sequential quarters
3Q 2015 Core PATMI w/o Forex is the highest since listing in August 2014
9M 2015 Core PATMI w/o Forex has exceeded that of FY2014
1 We derived Core PATMI from “Profit Attributable to Owners of the Parent, Net of Tax” by excluding changes in fair value of biological assets attributable to
owners of the parent (net of tax), and excluded a one-off gain from the disposal of asset held for sale (attributable to owners of the parent, net of tax) in 2Q 2014.
2 “Core PATMI w/o Forex” is an estimate derived from Core PATMI by excluding foreign exchange gains/losses (before tax) attributable to the owners of the
parent. As the majority of the foreign exchange gains/losses are unrealised and arises from the translation of USD bonds in PT Japfa Tbk, which has no tax
implication, we have not made an estimate of the tax impact on foreign exchange gains/losses. Accordingly this “Core PATMI w/o Forex” is to be viewed as an
indicative number only.
US$ million Core PATMI w/o Forex

9
3Q2015 Financial Overview
Consolidated sales decreased 11.4% YoY mainly due to a decline in sales at PT Japfa Tbk in USD terms. PT Japfa Tbk
sales remained stable in Rupiah terms
Significant improvement in profitability was due to the better performance in PT Japfa Tbk in 3Q 2015. PT Japfa Tbk’s
profitability improved due to higher selling prices of broilers as well as the lower cost of goods sold for feed and DOC. PT
Japfa Tbk generated US$48.8m operating profit in 3Q 2015, compared to US$21.4m in 3Q 2014
The Group’s PBT without forex and bio-asset losses in 3Q 2015 was US$56.3m, 153.3% higher compared to the same
period last year
3Q 2015 PAT affected significantly by forex losses (US$28.9m) and bio-asset valuation losses (US$9.3m)
The Rupiah exchange rate has moved 10% from 13,327 as at 30 June 2015 to 14,682 as at 30 September 2015
Notwithstanding the forex and bio-asset valuation losses, the Group achieved a PAT of US$10.4m in 3Q 2015
3Q 2015 Core PATMI was US$14.1m, up by 17.5% from US$12.0m in 3Q 2014
3Q 2015 Key Financial Highlights (US$m)
Income Statement 3Q 2015 3Q 2014 % change 9M 2015 9M 2014 % change
Revenue 695.3 784.7 -11.4% 2,075.3 2,242.1 -7.4%
Operating profit 65.8 43.5 +51.5% 141.4 144.8 -2.3%
Operating profit margin 9.5% 5.5% +4.0ppt 6.8% 6.5% +0.3ppt
EBITDA 89.7 59.0 +52.0% 202.5 202.8 -0.2%
PBT w/o Forex and Bio-Assets 56.3 22.2 +153.3% 98.4 97.6 +0.8%
PAT 10.4 14.6 -28.8% 16.8 75.7 -77.8%
Core PATMI 14.1 12.0 +17.5% 30.0 41.4 -27.5%
Core PATMI w/o Forex 30.7 13.8 +122.5% 57.8 43.6 +32.7%

3Q 2015 Segmental Highlights
10
• Better performance due to improved selling prices of broilers and lower cost of goods sold for feed and day-old-chicks (“DOCs”)
• Positive PAT and Core PATMI despite foreign exchange losses
• Growth in sales volumes and improvement in milk yields helped mitigate the impact from lower raw milk prices in China
• Impacted by biological asset valuation loss due to lower raw milk prices and global benchmark prices for heifers
• Consumer Food business broke-even, boosted by sales of Real Good milk
• The Consumer Food operations in Indonesia were profitable and continued to cover the start-up losses of Consumer Food operations in Vietnam
• Stable sales in Vietnam and Myanmar, with decline in sales in India
• Selling prices of poultry have softened in both Vietnam and India markets, affecting bottomline profit
• Swine business in Vietnam remains on an uptrend
• Animal Protein Other continues to be a key part of the Group’s diversification strategy
PT Japfa Tbk
Animal
Protein
Other
Dairy
Consumer
Food

PT Japfa Tbk46%
AP Other24%
Dairy25%
Consumer Food5%
3Q 2015 Revenue and Earnings Profile
11
3Q 2015 Revenue Composition
3Q 2015 Operating Profit Composition
3Q 2014 Revenue Composition
3Q 2014 Operating Profit Composition
PT Japfa Tbk75%
AP Other12%
Dairy11%
Consumer Food2%
“AP Other” refers to “Animal Protein Other”
Operational segments shown above excludes central purchasing subsidiary, headquarter costs and elimination adjustments between segments

19.6
2.2
6.8
9.6
3.35.8
-1.3
1.1
-5
0
5
10
15
20
25
3Q2015 3Q2014PT Japfa Tbk AP Other Dairy Consumer Food
US$m
3Q 2015 Core PATMI Breakdown
12
“AP Other” refers to “Animal Protein Other”
Operational segments shown above excludes central purchasing subsidiary, headquarter costs and elimination adjustments between segments
3Q 2015 Core PATMI Breakdown
3Q 2015 Core PATMI w/o Forex Breakdown
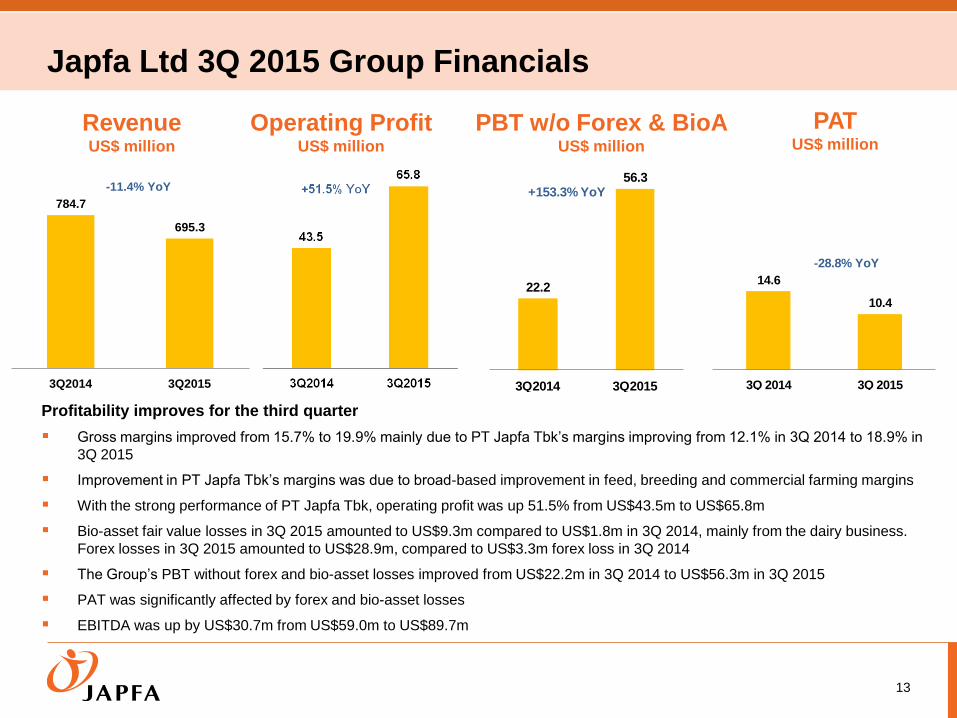
Japfa Ltd 3Q 2015 Group Financials
Profitability improves for the third quarter
Gross margins improved from 15.7% to 19.9% mainly due to PT Japfa Tbk’s margins improving from 12.1% in 3Q 2014 to 18.9% in
3Q 2015
Improvement in PT Japfa Tbk’s margins was due to broad-based improvement in feed, breeding and commercial farming margins
With the strong performance of PT Japfa Tbk, operating profit was up 51.5% from US$43.5m to US$65.8m
Bio-asset fair value losses in 3Q 2015 amounted to US$9.3m compared to US$1.8m in 3Q 2014, mainly from the dairy business.
Forex losses in 3Q 2015 amounted to US$28.9m, compared to US$3.3m forex loss in 3Q 2014
The Group’s PBT without forex and bio-asset losses improved from US$22.2m in 3Q 2014 to US$56.3m in 3Q 2015
PAT was significantly affected by forex and bio-asset losses
EBITDA was up by US$30.7m from US$59.0m to US$89.7m
13
Revenue US$ million
PAT US$ million
Operating Profit US$ million
784.7
695.3
3Q2014 3Q2015
-11.4% YoY
PBT w/o Forex & BioA US$ million
22.2
56.3
3Q2014 3Q2015
+153.3% YoY
14.6
10.4
3Q 2014 3Q 2015
-28.8% YoY
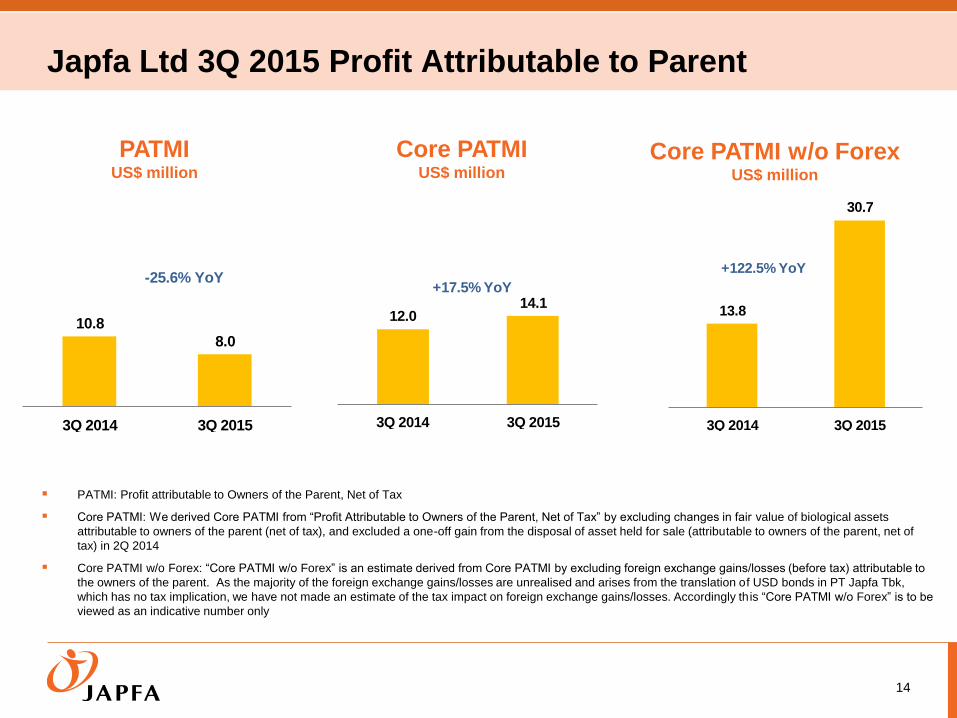
Japfa Ltd 3Q 2015 Profit Attributable to Parent
14
PATMI US$ million
Core PATMI US$ million
Core PATMI w/o Forex US$ million
10.8
8.0
3Q 2014 3Q 2015
-25.6% YoY
13.8
30.7
3Q 2014 3Q 2015
+122.5% YoY
12.014.1
3Q 2014 3Q 2015
+17.5% YoY
PATMI: Profit attributable to Owners of the Parent, Net of Tax
Core PATMI: We derived Core PATMI from “Profit Attributable to Owners of the Parent, Net of Tax” by excluding changes in fair value of biological assets
attributable to owners of the parent (net of tax), and excluded a one-off gain from the disposal of asset held for sale (attributable to owners of the parent, net of
tax) in 2Q 2014
Core PATMI w/o Forex: “Core PATMI w/o Forex” is an estimate derived from Core PATMI by excluding foreign exchange gains/losses (before tax) attributable to
the owners of the parent. As the majority of the foreign exchange gains/losses are unrealised and arises from the translation of USD bonds in PT Japfa Tbk,
which has no tax implication, we have not made an estimate of the tax impact on foreign exchange gains/losses. Accordingly this “Core PATMI w/o Forex” is to be
viewed as an indicative number only

Japfa Ltd 9M 2015 Group Financials
Operating profit, PBT before forex and bio-asset losses, as well as EBITDA, relatively stable for 9M 2015
The 18% depreciation of the Rupiah in 9M 2015 resulted in forex losses of US$45.8m (note: there is an unrealised forex loss of
US$37m from the translation of the US$207m bond outstanding (US$225m minus US$18m bond buyback)). It should be noted that
the Rp:USD exchange rate has strengthened since 30 September 2015
In 9M 2014, there was an extraordinary gain of US$9.6m from the sale of an office in Kallang, Singapore. In 9M 2015, there was a gain
of US$5m from the buy back of USD bonds in PT Japfa Tbk
For the dairy business, there were bio-asset fair value losses of US$21.9m in 9M 2015 compared to US$8.0m in 9M 2014
Notwithstanding the forex loss of US$48.8m and bio-asset valuation loss of US$19.4m, the Group still generated PAT of US$16.8m for
9M 2015
EBITDA stable at US$202.5m in 9M 2015, as compared to US$202.8m in 9M 2014
15
97.6 98.4
9M2014 9M2015
+0.8% YoY
Revenue US$ million
Operating Profit US$ million
PBT w/o Forex & BioA US$ million
PAT US$ million
75.7
16.8
9M 2014 9M 2015
-77.8% YoY

Japfa Ltd 9M 2015 Profit Attributable to Parent
16
PATMI US$ million
Core PATMI US$ million
Core PATMI w/o Forex US$ million
45.1
18.0
9M 2014 9M 2015
-60.2% YoY
43.6
57.8
9M 2014 9M 2015
+32.7% YoY
41.430.0
9M 2014 9M 2015
-27.5% YoY

-7.8
15.1
22.2
17.6
13.6
22.7
-0.2
0.4
-10
-5
0
5
10
15
20
25
9M2015 9M2014
PT Japfa Tbk AP Other Dairy Consumer Food
US$m
18.6
16.2
23.5
16.516.1
23.4
-3.1
-0.4
-5
0
5
10
15
20
25
9M2015 9M2014
PT Japfa Tbk AP Other Dairy Consumer Food
US$m
Diversification strategy across three pillars
17
9M 2015 Core PATMI w/o Forex Breakdown
Balance contribution from the Group’s three pillars – PT Japfa Tbk, Animal Protein Other and Dairy
9M 2015 Core PATMI Breakdown
“AP Other” refers to “Animal Protein Other”
Operational segments shown above excludes central purchasing subsidiary, headquarter costs and elimination adjustments between segments
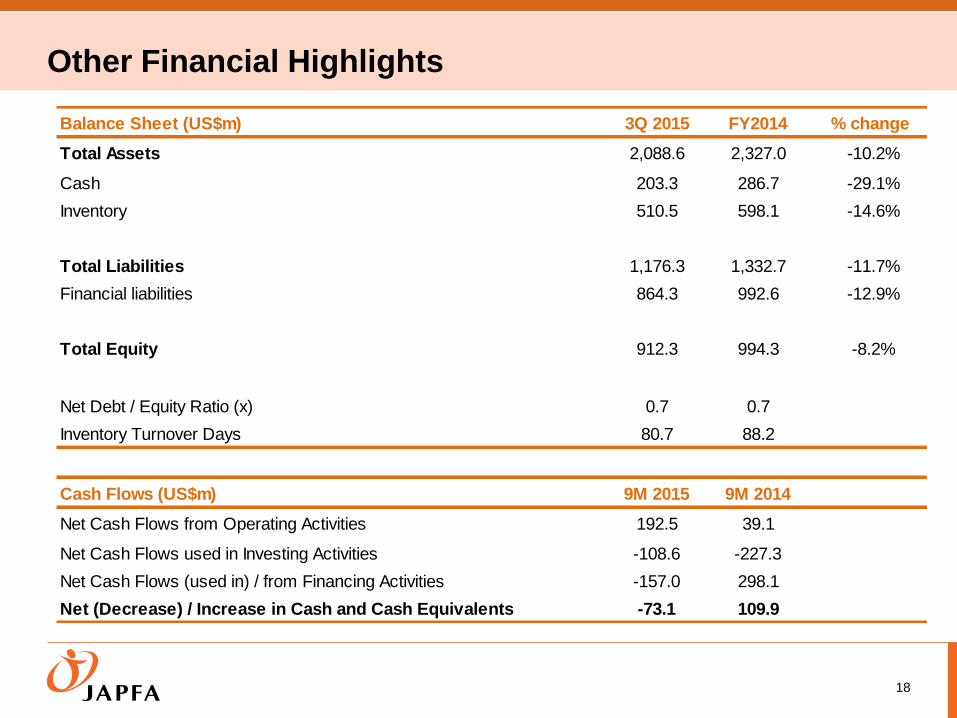
Other Financial Highlights
18
Balance Sheet (US$m) 3Q 2015 FY2014 % change
Total Assets 2,088.6 2,327.0 -10.2%
Cash 203.3 286.7 -29.1%
Inventory 510.5 598.1 -14.6%
Total Liabilities 1,176.3 1,332.7 -11.7%
Financial liabilities 864.3 992.6 -12.9%
Total Equity 912.3 994.3 -8.2%
Net Debt / Equity Ratio (x) 0.7 0.7
Inventory Turnover Days 80.7 88.2
Cash Flows (US$m) 9M 2015 9M 2014
Net Cash Flows from Operating Activities 192.5 39.1
Net Cash Flows used in Investing Activities -108.6 -227.3
Net Cash Flows (used in) / from Financing Activities -157.0 298.1
Net (Decrease) / Increase in Cash and Cash Equivalents -73.1 109.9

PT Japfa Tbk – USD Debt Exposure
19
As at end September 2015 USD millions
PT Japfa Tbk IDR book
Loans in USD 231 Loans in Local Currency (US$ equivalent) 280 Total Loans 511 % USD Loans to Total Loans 45%
As at end September 2015 USD millions
PT Japfa Tbk
USD Debt (gross) 231 USD Bond Buybacks (face value) (18) USD Debt (net) 213
Currency Hedging - Operational 80 Currency Hedging - Principal and/or Interest 8 USD Cash 25 Total Hedging + Cash 113
PT Japfa Tbk
1. Minimal operational currency exposure as able to pass on Rupiah changes by increasing feed selling prices
2. Operational hedges are applied in effect to cover the USD bond exposure
3. We have a natural hedge as we typically hold more than US$150m of USD-linked raw material inventory
4. Buyback of USD bonds from secondary market also reduces USD debt exposure

Capex 2014 – 2015
20
99
38
130
24
17
32 72
28
84 15
2
15
9M 2014 9M 2015 FY2014
Consumer Food Dairy Animal Protein Other PT Japfa Tbk
FY2014 Total: US$261 million
9M 2015 Total: US$86 million
9M 2014 Total: US$210 million

Segmental & Operational Highlights
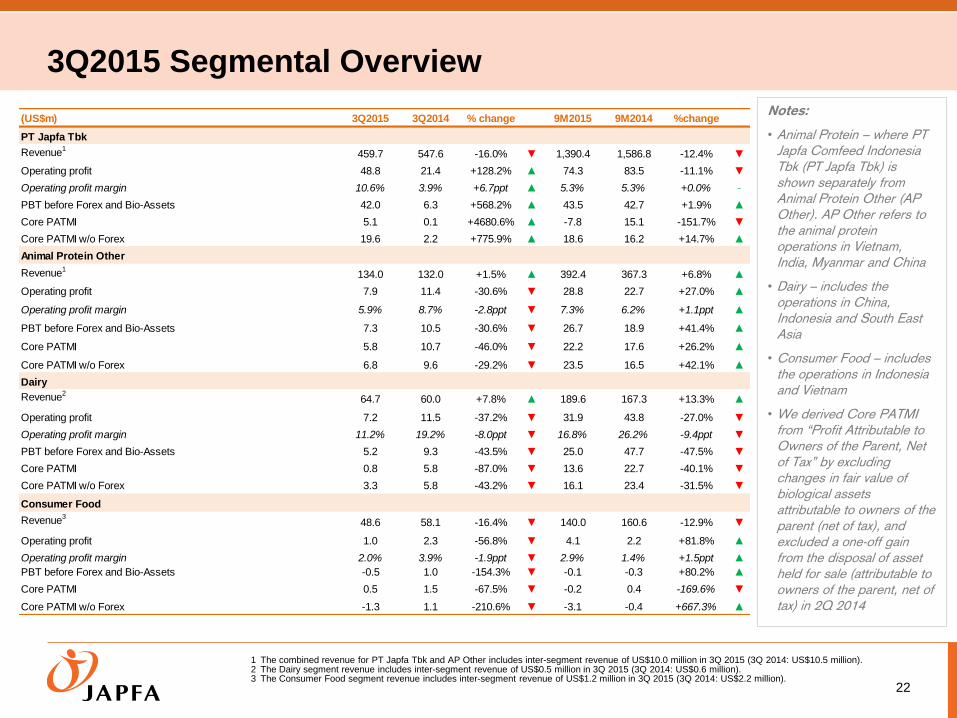
3Q2015 Segmental Overview
22
Notes:
• Animal Protein – where PT Japfa Comfeed Indonesia Tbk (PT Japfa Tbk) is shown separately from Animal Protein Other (AP Other). AP Other refers to the animal protein operations in Vietnam, India, Myanmar and China
• Dairy – includes the operations in China, Indonesia and South East Asia
• Consumer Food – includes the operations in Indonesia and Vietnam
• We derived Core PATMI from “Profit Attributable to Owners of the Parent, Net of Tax” by excluding changes in fair value of biological assets attributable to owners of the parent (net of tax), and excluded a one-off gain from the disposal of asset held for sale (attributable to owners of the parent, net of tax) in 2Q 2014
1 The combined revenue for PT Japfa Tbk and AP Other includes inter-segment revenue of US$10.0 million in 3Q 2015 (3Q 2014: US$10.5 million). 2 The Dairy segment revenue includes inter-segment revenue of US$0.5 million in 3Q 2015 (3Q 2014: US$0.6 million). 3 The Consumer Food segment revenue includes inter-segment revenue of US$1.2 million in 3Q 2015 (3Q 2014: US$2.2 million).
(US$m) 3Q2015 3Q2014 % change 9M2015 9M2014 %change
PT Japfa Tbk
Revenue1459.7 547.6 -16.0% ▼ 1,390.4 1,586.8 -12.4% ▼
Operating profit 48.8 21.4 +128.2% ▲ 74.3 83.5 -11.1% ▼
Operating profit margin 10.6% 3.9% +6.7ppt ▲ 5.3% 5.3% +0.0% -
PBT before Forex and Bio-Assets 42.0 6.3 +568.2% ▲ 43.5 42.7 +1.9% ▲
Core PATMI 5.1 0.1 +4680.6% ▲ -7.8 15.1 -151.7% ▼
Core PATMI w/o Forex 19.6 2.2 +775.9% ▲ 18.6 16.2 +14.7% ▲
Animal Protein Other
Revenue1134.0 132.0 +1.5% ▲ 392.4 367.3 +6.8% ▲
Operating profit 7.9 11.4 -30.6% ▼ 28.8 22.7 +27.0% ▲
Operating profit margin 5.9% 8.7% -2.8ppt ▼ 7.3% 6.2% +1.1ppt ▲
PBT before Forex and Bio-Assets 7.3 10.5 -30.6% ▼ 26.7 18.9 +41.4% ▲
Core PATMI 5.8 10.7 -46.0% ▼ 22.2 17.6 +26.2% ▲
Core PATMI w/o Forex 6.8 9.6 -29.2% ▼ 23.5 16.5 +42.1% ▲
Dairy
Revenue264.7 60.0 +7.8% ▲ 189.6 167.3 +13.3% ▲
Operating profit 7.2 11.5 -37.2% ▼ 31.9 43.8 -27.0% ▼
Operating profit margin 11.2% 19.2% -8.0ppt ▼ 16.8% 26.2% -9.4ppt ▼
PBT before Forex and Bio-Assets 5.2 9.3 -43.5% ▼ 25.0 47.7 -47.5% ▼
Core PATMI 0.8 5.8 -87.0% ▼ 13.6 22.7 -40.1% ▼
Core PATMI w/o Forex 3.3 5.8 -43.2% ▼ 16.1 23.4 -31.5% ▼
Consumer Food
Revenue348.6 58.1 -16.4% ▼ 140.0 160.6 -12.9% ▼
Operating profit 1.0 2.3 -56.8% ▼ 4.1 2.2 +81.8% ▲
Operating profit margin 2.0% 3.9% -1.9ppt ▼ 2.9% 1.4% +1.5ppt ▲
PBT before Forex and Bio-Assets -0.5 1.0 -154.3% ▼ -0.1 -0.3 +80.2% ▲
Core PATMI 0.5 1.5 -67.5% ▼ -0.2 0.4 -169.6% ▼
Core PATMI w/o Forex -1.3 1.1 -210.6% ▼ -3.1 -0.4 +667.3% ▲

PT Japfa Tbk – Financial performance
23
3Q 2015
3Q 2015 was the best profit quarter so far in 2015; PT Japfa Tbk recorded its first positive PAT since 3Q 2014
Operating profit margin improved mainly due to a reduction in raw material prices especially corn and soya bean meal
Operating profit in 3Q 2015 was a significant improvement from 1Q 2015 and 2Q 2015. Commercial farming operating profit rose significantly due to improved broiler
selling prices, as a result of a lower market supply as broiler farmers reduced their production post-Hari Raya as they were expecting a drop in demand for chicken
In 3Q 2015, included in the PBT w/o Forex & BioA was a gain of US$5m arising from the buyback of USD bonds with a face value of US$18m
PBT w/o Forex & BioA grew from US$6.3m in 3Q 2014 to US$42.0m in 3Q 2015
The 10% depreciation of the Rupiah in 3Q 2015 resulted in forex loss of US$25.3m (note unrealised forex loss of US$20m from the translation of the US$207m bond
outstanding (US$225m minus US$18m bond buyback))
Despite the forex loss of US$25.3m, PT Japfa Tbk still recorded a PAT of US$12.3m in 3Q 2015
There continues to be an oversupply of DOC in Indonesia, with lower purchasing power of low-income consumers
6.3
42.0
+568.2% YoY
42.7
43.5
+1.9% YoY
Revenue US$ million
PAT US$ million
Operating Profit US$ million
PBT w/o Forex & BioA US$ million
3.2
12.3
+285.2% YoY
29.6
-9.4-131.8% YoY

Animal Protein Other – Financial performance
24
3Q 2015
Sales were stable at US$134.0m in 3Q 2015 compared to last year
Poultry feed volume was up 28%; swine feed volume up 17%; and swine fattening volume up 49% in 3Q 2015
Operating profit in 3Q 2015 declined due to: (a) Vietnam: operating profit margin dropped from 10.1% in 3Q 2014 to 8.6% in 3Q 2015,
mainly because of lower selling prices for poultry DOC and Broiler; (b) India: operating profit dropped from a profit of US$0.7m in 3Q
2014 to a loss of US$0.9m in 3Q 2015 because of lower selling prices for poultry Feed, DOC and Broiler; and (c) China Beef: project
is still in start-up phase
Swine fattening in Vietnam continues to perform well due to operational efficiencies
22.7
28.8
+27.0% YoY
10.5
7.3
-30.6% YoY
18.9
26.7
+41.4% YoY
Revenue US$ million
Operating Profit US$ million
PBT w/o Forex & BioA US$ million
PAT US$ million
12.0
6.5
-45.9% YoY
22.0
24.2
-9.9% YoY

0
100
200
300
400
500
600
700
800
900
3Q2014 4Q2014 1Q2015 2Q2015 3Q2015
Japfa Myanmar Japfa Vietnam Japfa India PT Japfa Tbk
('000 tons)
850 853 824 818826
Animal Protein – Operational Performance
25
Animal Feed – Poultry: Sales Volume (‘000 tons)
DOC - Broiler: Sales Volume (mil birds) Commercial Farm – Live Birds: Sales Volume (‘000 tons)
0
20
40
60
80
100
120
140
160
180
200
3Q2014 4Q2014 1Q2015 2Q2015 3Q2015
Japfa Myanmar Japfa Vietnam Japfa India PT Japfa Tbk
(mil birds)
157147 151 147
(mil birds)(mil birds)
160

Animal Protein – Operational Performance
26
Beef – Live Cattle: Sales Volume (‘000 tons) Aquaculture – Aqua-feed: Sales Volume (‘000 tons)
Swine Fattening: Sales Volume (‘000 tons) Animal Feed – Swine: Sales Volume (‘000 tons)
11.410.0 9.4
11.1
9.1
0
2
4
6
8
10
12
3Q2014 4Q2014 1Q2015 2Q2015 3Q2015
PT Japfa Tbk
('000 tons)
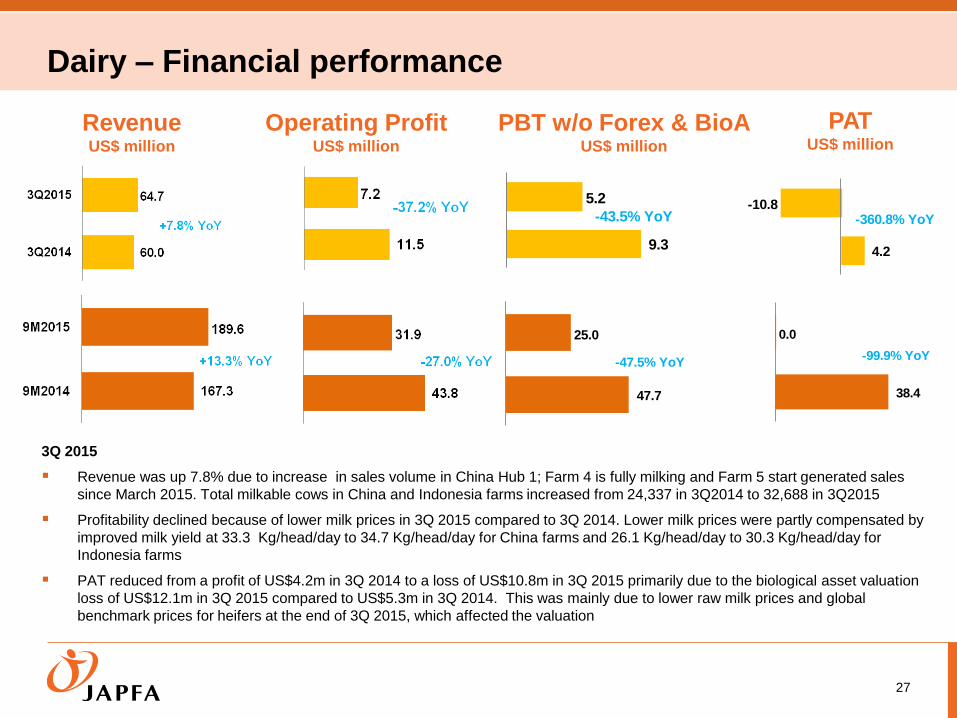
Dairy – Financial performance
27
3Q 2015
Revenue was up 7.8% due to increase in sales volume in China Hub 1; Farm 4 is fully milking and Farm 5 start generated sales
since March 2015. Total milkable cows in China and Indonesia farms increased from 24,337 in 3Q2014 to 32,688 in 3Q2015
Profitability declined because of lower milk prices in 3Q 2015 compared to 3Q 2014. Lower milk prices were partly compensated by
improved milk yield at 33.3 Kg/head/day to 34.7 Kg/head/day for China farms and 26.1 Kg/head/day to 30.3 Kg/head/day for
Indonesia farms
PAT reduced from a profit of US$4.2m in 3Q 2014 to a loss of US$10.8m in 3Q 2015 primarily due to the biological asset valuation
loss of US$12.1m in 3Q 2015 compared to US$5.3m in 3Q 2014. This was mainly due to lower raw milk prices and global
benchmark prices for heifers at the end of 3Q 2015, which affected the valuation
9.3
5.2
-43.5% YoY
47.7
25.0
-47.5% YoY
Revenue US$ million
Operating Profit US$ million
PBT w/o Forex & BioA US$ million
PAT US$ million
4.2
-10.8-360.8% YoY
38.4
0.0
-99.9% YoY
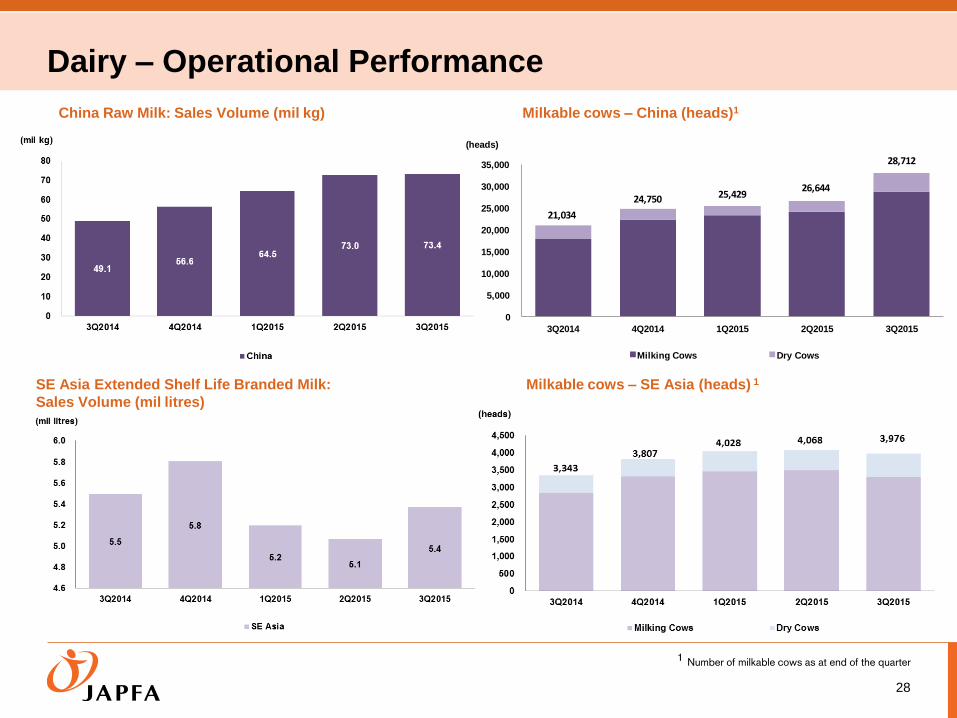
Dairy – Operational Performance
28
SE Asia Extended Shelf Life Branded Milk:
Sales Volume (mil litres)
Milkable cows – SE Asia (heads) 1
China Raw Milk: Sales Volume (mil kg) Milkable cows – China (heads)1
1 Number of milkable cows as at end of the quarter
21,034
24,750 25,42926,644
28,712
0
5,000
10,000
15,000
20,000
25,000
30,000
35,000
3Q2014 4Q2014 1Q2015 2Q2015 3Q2015
Milking Cows Dry Cows
(heads)
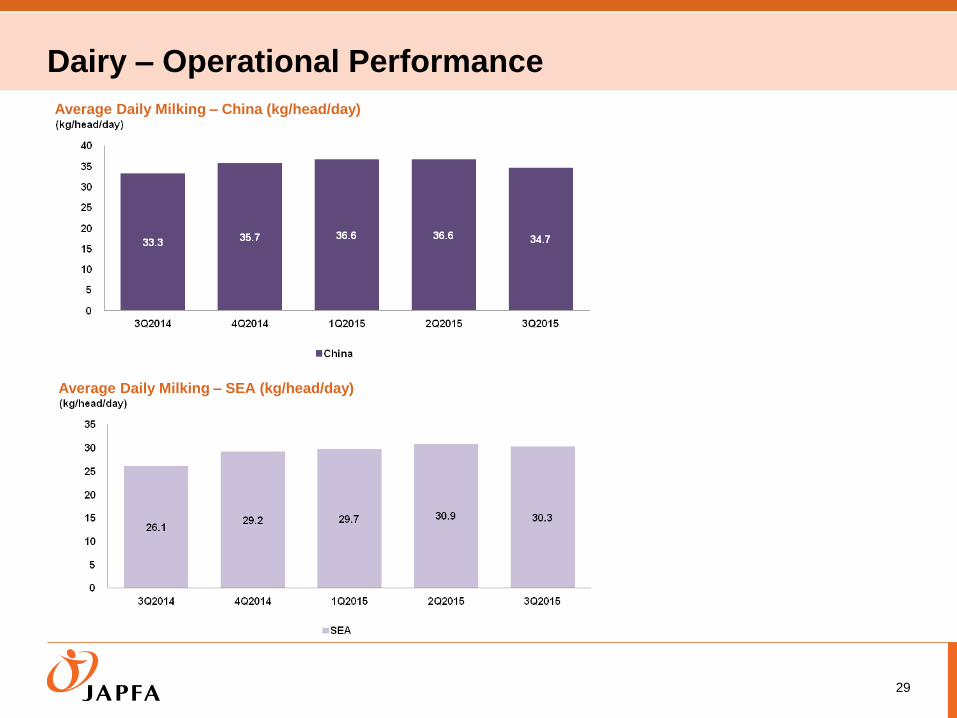
29
Average Daily Milking – SEA (kg/head/day)
Average Daily Milking – China (kg/head/day)
Dairy – Operational Performance

-0.2
-1003.4% YoY
0.0
Consumer Food – Financial performance
30
3Q 2015
Consumer Food business broke-even with PAT of US$0.5m and EBITDA of US$1.8m in 3Q 2015
Revenue dropped 16.4% in USD terms (while flat in Rupiah terms). Sales volume of Real Good milk went up 14%
The Consumer Food operations in Indonesia were profitable and continued to cover the start-up losses of Consumer Food
operations in Vietnam
1.0
-0.5-154.3% YoY
-0.3
-0.1
- 80.2% YoY
Revenue US$ million
Operating Profit US$ million
PBT w/o Forex & BioA US$ million
PAT US$ million
1.3
0.5 -63.7% YoY
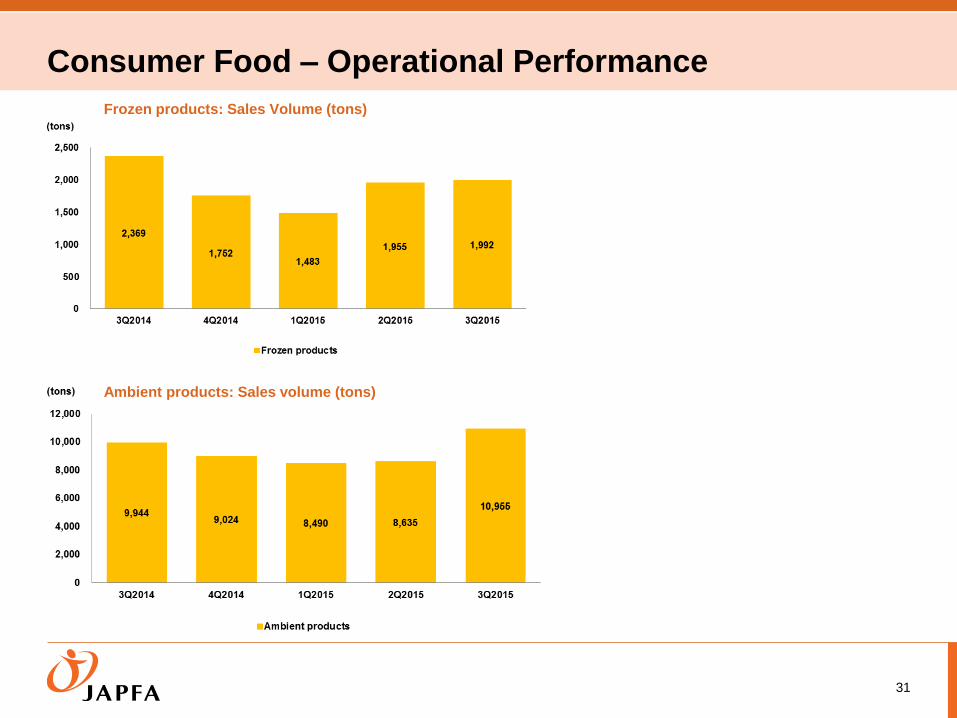
Consumer Food – Operational Performance
31
Frozen products: Sales Volume (tons)
Ambient products: Sales volume (tons)
Growth Strategies

Growth Strategies
33
Focus on Industrialization and
Diversification
Leverage our track record in replicating our industrialized
and scalable business, to build our three key business
pillars – dairy in China, poultry in Indonesia, and poultry and
swine in Indochina
Mitigating Market Challenges
Enhance efficiency and profitability of our Indonesian operations to counter near-
term price pressure on DOCs
Improve milk yields and productivity to mitigate lower average selling prices of raw
milk in China
Maximising Returns from Our Assets
Long term fundamentals for the Group remain favorable
Large-scale business enables us to tap on growth
opportunities
Strategic investments in selected markets to capture rise in consumer demand

Appendix
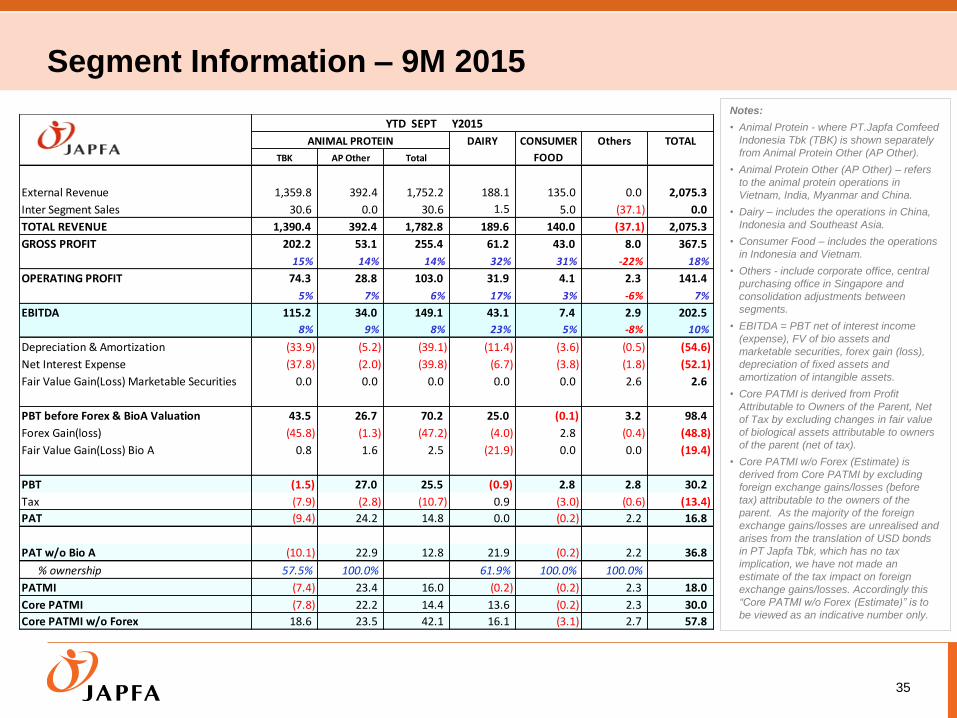
Segment Information – 9M 2015
35
Notes:
• Animal Protein - where PT.Japfa Comfeed
Indonesia Tbk (TBK) is shown separately
from Animal Protein Other (AP Other).
• Animal Protein Other (AP Other) – refers
to the animal protein operations in
Vietnam, India, Myanmar and China.
• Dairy – includes the operations in China,
Indonesia and Southeast Asia.
• Consumer Food – includes the operations
in Indonesia and Vietnam.
• Others - include corporate office, central
purchasing office in Singapore and
consolidation adjustments between
segments.
• EBITDA = PBT net of interest income
(expense), FV of bio assets and
marketable securities, forex gain (loss),
depreciation of fixed assets and
amortization of intangible assets.
• Core PATMI is derived from Profit
Attributable to Owners of the Parent, Net
of Tax by excluding changes in fair value
of biological assets attributable to owners
of the parent (net of tax).
• Core PATMI w/o Forex (Estimate) is
derived from Core PATMI by excluding
foreign exchange gains/losses (before
tax) attributable to the owners of the
parent. As the majority of the foreign
exchange gains/losses are unrealised and
arises from the translation of USD bonds
in PT Japfa Tbk, which has no tax
implication, we have not made an
estimate of the tax impact on foreign
exchange gains/losses. Accordingly this
“Core PATMI w/o Forex (Estimate)” is to
be viewed as an indicative number only.
YTD SEPT Y2015
DAIRY CONSUMER Others TOTAL
TBK AP Other Total FOOD
External Revenue 1,359.8 392.4 1,752.2 188.1 135.0 0.0 2,075.3
Inter Segment Sales 30.6 0.0 30.6 1.5 5.0 (37.1) 0.0
TOTAL REVENUE 1,390.4 392.4 1,782.8 189.6 140.0 (37.1) 2,075.3
GROSS PROFIT 202.2 53.1 255.4 61.2 43.0 8.0 367.5
15% 14% 14% 32% 31% -22% 18%
OPERATING PROFIT 74.3 28.8 103.0 31.9 4.1 2.3 141.4
5% 7% 6% 17% 3% -6% 7%
EBITDA 115.2 34.0 149.1 43.1 7.4 2.9 202.5
8% 9% 8% 23% 5% -8% 10%
Depreciation & Amortization (33.9) (5.2) (39.1) (11.4) (3.6) (0.5) (54.6)
Net Interest Expense (37.8) (2.0) (39.8) (6.7) (3.8) (1.8) (52.1)
Fair Value Gain(Loss) Marketable Securities 0.0 0.0 0.0 0.0 0.0 2.6 2.6
PBT before Forex & BioA Valuation 43.5 26.7 70.2 25.0 (0.1) 3.2 98.4
Forex Gain(loss) (45.8) (1.3) (47.2) (4.0) 2.8 (0.4) (48.8)
Fair Value Gain(Loss) Bio A 0.8 1.6 2.5 (21.9) 0.0 0.0 (19.4)
PBT (1.5) 27.0 25.5 (0.9) 2.8 2.8 30.2
Tax (7.9) (2.8) (10.7) 0.9 (3.0) (0.6) (13.4)
PAT (9.4) 24.2 14.8 0.0 (0.2) 2.2 16.8
PAT w/o Bio A (10.1) 22.9 12.8 21.9 (0.2) 2.2 36.8
% ownership 57.5% 100.0% 61.9% 100.0% 100.0%
PATMI (7.4) 23.4 16.0 (0.2) (0.2) 2.3 18.0
Core PATMI (7.8) 22.2 14.4 13.6 (0.2) 2.3 30.0
Core PATMI w/o Forex 18.6 23.5 42.1 16.1 (3.1) 2.7 57.8
ANIMAL PROTEIN
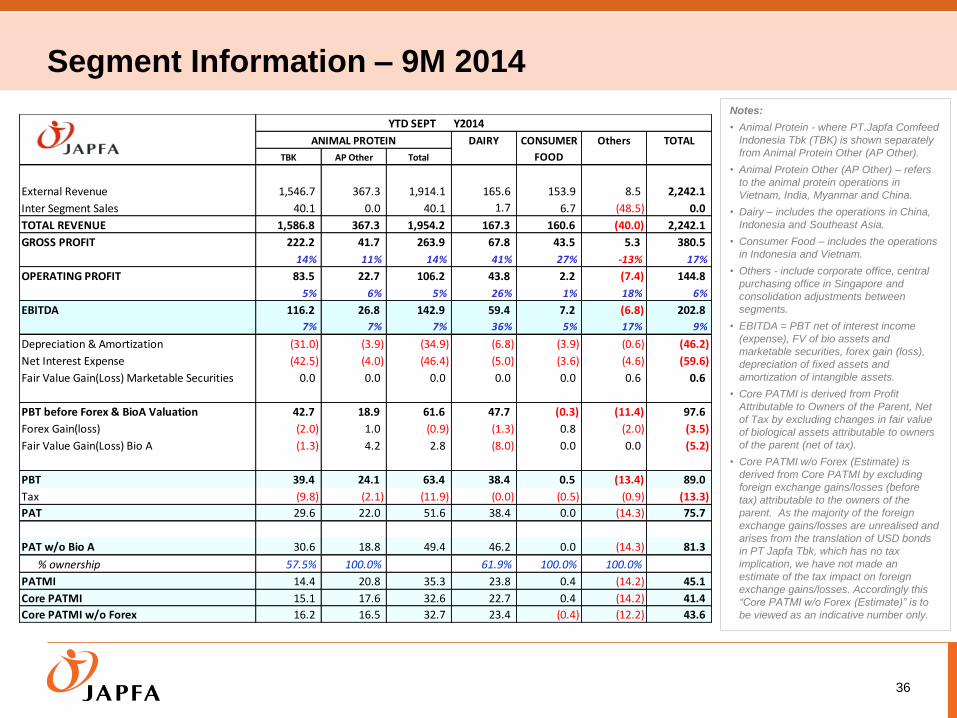
Segment Information – 9M 2014
36
Notes:
• Animal Protein - where PT.Japfa Comfeed
Indonesia Tbk (TBK) is shown separately
from Animal Protein Other (AP Other).
• Animal Protein Other (AP Other) – refers
to the animal protein operations in
Vietnam, India, Myanmar and China.
• Dairy – includes the operations in China,
Indonesia and Southeast Asia.
• Consumer Food – includes the operations
in Indonesia and Vietnam.
• Others - include corporate office, central
purchasing office in Singapore and
consolidation adjustments between
segments.
• EBITDA = PBT net of interest income
(expense), FV of bio assets and
marketable securities, forex gain (loss),
depreciation of fixed assets and
amortization of intangible assets.
• Core PATMI is derived from Profit
Attributable to Owners of the Parent, Net
of Tax by excluding changes in fair value
of biological assets attributable to owners
of the parent (net of tax).
• Core PATMI w/o Forex (Estimate) is
derived from Core PATMI by excluding
foreign exchange gains/losses (before
tax) attributable to the owners of the
parent. As the majority of the foreign
exchange gains/losses are unrealised and
arises from the translation of USD bonds
in PT Japfa Tbk, which has no tax
implication, we have not made an
estimate of the tax impact on foreign
exchange gains/losses. Accordingly this
“Core PATMI w/o Forex (Estimate)” is to
be viewed as an indicative number only.
YTD SEPT Y2014
DAIRY CONSUMER Others TOTAL
TBK AP Other Total FOOD
External Revenue 1,546.7 367.3 1,914.1 165.6 153.9 8.5 2,242.1
Inter Segment Sales 40.1 0.0 40.1 1.7 6.7 (48.5) 0.0
TOTAL REVENUE 1,586.8 367.3 1,954.2 167.3 160.6 (40.0) 2,242.1
GROSS PROFIT 222.2 41.7 263.9 67.8 43.5 5.3 380.5
14% 11% 14% 41% 27% -13% 17%
OPERATING PROFIT 83.5 22.7 106.2 43.8 2.2 (7.4) 144.8
5% 6% 5% 26% 1% 18% 6%
EBITDA 116.2 26.8 142.9 59.4 7.2 (6.8) 202.8
7% 7% 7% 36% 5% 17% 9%
Depreciation & Amortization (31.0) (3.9) (34.9) (6.8) (3.9) (0.6) (46.2)
Net Interest Expense (42.5) (4.0) (46.4) (5.0) (3.6) (4.6) (59.6)
Fair Value Gain(Loss) Marketable Securities 0.0 0.0 0.0 0.0 0.0 0.6 0.6
PBT before Forex & BioA Valuation 42.7 18.9 61.6 47.7 (0.3) (11.4) 97.6
Forex Gain(loss) (2.0) 1.0 (0.9) (1.3) 0.8 (2.0) (3.5)
Fair Value Gain(Loss) Bio A (1.3) 4.2 2.8 (8.0) 0.0 0.0 (5.2)
PBT 39.4 24.1 63.4 38.4 0.5 (13.4) 89.0
Tax (9.8) (2.1) (11.9) (0.0) (0.5) (0.9) (13.3)
PAT 29.6 22.0 51.6 38.4 0.0 (14.3) 75.7
PAT w/o Bio A 30.6 18.8 49.4 46.2 0.0 (14.3) 81.3
% ownership 57.5% 100.0% 61.9% 100.0% 100.0%
PATMI 14.4 20.8 35.3 23.8 0.4 (14.2) 45.1
Core PATMI 15.1 17.6 32.6 22.7 0.4 (14.2) 41.4
Core PATMI w/o Forex 16.2 16.5 32.7 23.4 (0.4) (12.2) 43.6
ANIMAL PROTEIN
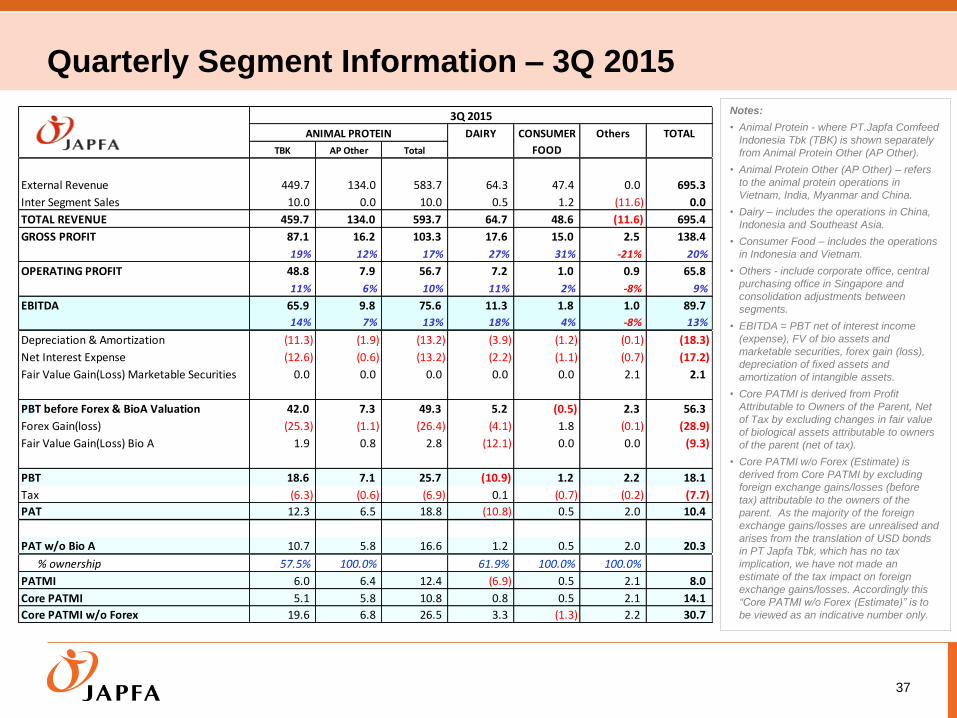
Quarterly Segment Information – 3Q 2015
37
Notes:
• Animal Protein - where PT.Japfa Comfeed
Indonesia Tbk (TBK) is shown separately
from Animal Protein Other (AP Other).
• Animal Protein Other (AP Other) – refers
to the animal protein operations in
Vietnam, India, Myanmar and China.
• Dairy – includes the operations in China,
Indonesia and Southeast Asia.
• Consumer Food – includes the operations
in Indonesia and Vietnam.
• Others - include corporate office, central
purchasing office in Singapore and
consolidation adjustments between
segments.
• EBITDA = PBT net of interest income
(expense), FV of bio assets and
marketable securities, forex gain (loss),
depreciation of fixed assets and
amortization of intangible assets.
• Core PATMI is derived from Profit
Attributable to Owners of the Parent, Net
of Tax by excluding changes in fair value
of biological assets attributable to owners
of the parent (net of tax).
• Core PATMI w/o Forex (Estimate) is
derived from Core PATMI by excluding
foreign exchange gains/losses (before
tax) attributable to the owners of the
parent. As the majority of the foreign
exchange gains/losses are unrealised and
arises from the translation of USD bonds
in PT Japfa Tbk, which has no tax
implication, we have not made an
estimate of the tax impact on foreign
exchange gains/losses. Accordingly this
“Core PATMI w/o Forex (Estimate)” is to
be viewed as an indicative number only.
3Q 2015
DAIRY CONSUMER Others TOTAL
TBK AP Other Total FOOD
External Revenue 449.7 134.0 583.7 64.3 47.4 0.0 695.3
Inter Segment Sales 10.0 0.0 10.0 0.5 1.2 (11.6) 0.0
TOTAL REVENUE 459.7 134.0 593.7 64.7 48.6 (11.6) 695.4
GROSS PROFIT 87.1 16.2 103.3 17.6 15.0 2.5 138.4
19% 12% 17% 27% 31% -21% 20%
OPERATING PROFIT 48.8 7.9 56.7 7.2 1.0 0.9 65.8
11% 6% 10% 11% 2% -8% 9%
EBITDA 65.9 9.8 75.6 11.3 1.8 1.0 89.7
14% 7% 13% 18% 4% -8% 13%
Depreciation & Amortization (11.3) (1.9) (13.2) (3.9) (1.2) (0.1) (18.3)
Net Interest Expense (12.6) (0.6) (13.2) (2.2) (1.1) (0.7) (17.2)
Fair Value Gain(Loss) Marketable Securities 0.0 0.0 0.0 0.0 0.0 2.1 2.1
PBT before Forex & BioA Valuation 42.0 7.3 49.3 5.2 (0.5) 2.3 56.3
Forex Gain(loss) (25.3) (1.1) (26.4) (4.1) 1.8 (0.1) (28.9)
Fair Value Gain(Loss) Bio A 1.9 0.8 2.8 (12.1) 0.0 0.0 (9.3)
PBT 18.6 7.1 25.7 (10.9) 1.2 2.2 18.1
Tax (6.3) (0.6) (6.9) 0.1 (0.7) (0.2) (7.7)
PAT 12.3 6.5 18.8 (10.8) 0.5 2.0 10.4
PAT w/o Bio A 10.7 5.8 16.6 1.2 0.5 2.0 20.3
% ownership 57.5% 100.0% 61.9% 100.0% 100.0%
PATMI 6.0 6.4 12.4 (6.9) 0.5 2.1 8.0
Core PATMI 5.1 5.8 10.8 0.8 0.5 2.1 14.1
Core PATMI w/o Forex 19.6 6.8 26.5 3.3 (1.3) 2.2 30.7
ANIMAL PROTEIN

Quarterly Segment Information – 2Q 2015
38
Notes:
• Animal Protein - where PT.Japfa Comfeed
Indonesia Tbk (TBK) is shown separately
from Animal Protein Other (AP Other).
• Animal Protein Other (AP Other) – refers
to the animal protein operations in
Vietnam, India, Myanmar and China.
• Dairy – includes the operations in China,
Indonesia and Southeast Asia.
• Consumer Food – includes the operations
in Indonesia and Vietnam.
• Others - include corporate office, central
purchasing office in Singapore and
consolidation adjustments between
segments.
• EBITDA = PBT net of interest income
(expense), FV of bio assets and
marketable securities, forex gain (loss),
depreciation of fixed assets and
amortization of intangible assets.
• Core PATMI is derived from Profit
Attributable to Owners of the Parent, Net
of Tax by excluding changes in fair value
of biological assets attributable to owners
of the parent (net of tax).
• Core PATMI w/o Forex (Estimate) is
derived from Core PATMI by excluding
foreign exchange gains/losses (before
tax) attributable to the owners of the
parent. As the majority of the foreign
exchange gains/losses are unrealised and
arises from the translation of USD bonds
in PT Japfa Tbk, which has no tax
implication, we have not made an
estimate of the tax impact on foreign
exchange gains/losses. Accordingly this
“Core PATMI w/o Forex (Estimate)” is to
be viewed as an indicative number only.
2Q 2015
DAIRY CONSUMER Others TOTAL
TBK AP Other Total FOOD
External Revenue 462.0 131.7 593.6 64.1 46.6 (0.0) 704.3
Inter Segment Sales 10.5 0.0 10.5 0.6 1.8 (12.9) (0.0)
TOTAL REVENUE 472.4 131.7 604.1 64.6 48.4 (12.9) 704.3
GROSS PROFIT 62.7 19.8 82.6 21.4 15.3 2.6 122.0
13% 15% 14% 33% 32% -20% 17%
OPERATING PROFIT 17.6 11.8 29.5 11.4 2.4 0.8 44.1
4% 9% 5% 18% 5% -6% 6%
EBITDA 29.0 13.4 42.4 15.4 3.6 1.1 62.4
6% 10% 7% 24% 7% -9% 9%
Depreciation & Amortization (11.4) (1.6) (13.0) (3.9) (1.2) (0.2) (18.2)
Net Interest Expense (13.2) (0.8) (14.0) (2.1) (1.3) (0.5) (18.0)
Fair Value Gain(Loss) Marketable Securities 0.0 0.0 0.0 0.0 0.0 0.7 0.7
PBT before Forex & BioA Valuation 4.4 11.0 15.4 9.4 1.0 1.1 26.9
Forex Gain(loss) (6.8) (0.2) (7.0) 0.6 0.2 0.1 (6.0)
Fair Value Gain(Loss) Bio A (1.3) (4.1) (5.4) (12.1) 0.0 0.0 (17.5)
PBT (3.7) 6.7 3.0 (2.0) 1.2 1.2 3.4
Tax (0.8) (0.8) (1.6) 0.7 (0.9) (0.2) (2.0)
PAT (4.5) 5.9 1.4 (1.3) 0.4 1.1 1.4
PAT w/o Bio A (3.5) 9.1 5.7 10.7 0.4 1.1 17.8
% ownership 57.5% 100.0% 61.9% 100.0% 100.0%
PATMI (3.2) 5.6 2.4 (0.8) 0.4 1.1 3.0
Core PATMI (2.6) 8.8 6.2 6.6 0.4 1.1 14.3
Core PATMI w/o Forex 1.3 9.0 10.3 6.3 0.1 0.9 17.6
ANIMAL PROTEIN

Quarterly Segment Information – 1Q 2015
39
Notes:
• Animal Protein - where PT.Japfa Comfeed
Indonesia Tbk (TBK) is shown separately
from Animal Protein Other (AP Other).
• Animal Protein Other (AP Other) – refers
to the animal protein operations in
Vietnam, India, Myanmar and China.
• Dairy – includes the operations in China,
Indonesia and Southeast Asia.
• Consumer Food – includes the operations
in Indonesia and Vietnam.
• Others - include corporate office, central
purchasing office in Singapore and
consolidation adjustments between
segments.
• EBITDA = PBT net of interest income
(expense), FV of bio assets and
marketable securities, forex gain (loss),
depreciation of fixed assets and
amortization of intangible assets.
• Core PATMI is derived from Profit
Attributable to Owners of the Parent, Net
of Tax by excluding changes in fair value
of biological assets attributable to owners
of the parent (net of tax).
• Core PATMI w/o Forex (Estimate) is
derived from Core PATMI by excluding
foreign exchange gains/losses (before
tax) attributable to the owners of the
parent. As the majority of the foreign
exchange gains/losses are unrealised and
arises from the translation of USD bonds
in PT Japfa Tbk, which has no tax
implication, we have not made an
estimate of the tax impact on foreign
exchange gains/losses. Accordingly this
“Core PATMI w/o Forex (Estimate)” is to
be viewed as an indicative number only.
1Q 2015
DAIRY CONSUMER Others TOTAL
TBK AP Other Total FOOD
External Revenue 448.1 126.8 574.9 59.8 41.0 0.0 675.7
Inter Segment Sales 10.1 0.0 10.1 0.4 2.0 (12.5) 0.0
TOTAL REVENUE 458.2 126.8 585.0 60.2 43.0 (12.5) 675.7
GROSS PROFIT 52.4 17.1 69.5 22.2 12.6 2.9 107.2
11% 13% 12% 37% 29% -23% 16%
OPERATING PROFIT 7.8 9.0 16.9 13.2 0.7 0.6 31.5
2% 7% 3% 22% 2% -5% 5%
EBITDA 20.3 10.8 31.1 16.4 2.0 0.8 50.3
4% 9% 5% 27% 5% -7% 7%
Depreciation & Amortization (11.2) (1.8) (13.0) (3.6) (1.2) (0.2) (18.1)
Net Interest Expense (12.0) (0.6) (12.6) (2.4) (1.3) (0.6) (16.9)
Fair Value Gain(Loss) Marketable Securities 0.0 0.0 0.0 0.0 0.0 (0.2) (0.2)
PBT before Forex & BioA Valuation (2.9) 8.4 5.5 10.4 (0.5) (0.2) 15.1
Forex Gain(loss) (13.7) (0.1) (13.8) (0.5) 0.8 (0.4) (13.9)
Fair Value Gain(Loss) Bio A 0.2 4.9 5.1 2.2 0.0 0.0 7.4
PBT (16.4) 13.2 (3.2) 12.1 0.3 (0.6) 8.6
Tax (0.7) (1.4) (2.2) 0.2 (1.4) (0.2) (3.6)
PAT (17.1) 11.8 (5.3) 12.2 (1.1) (0.8) 5.0
PAT w/o Bio A (17.3) 7.9 (9.4) 10.0 (1.1) (0.8) (1.3)
% ownership 57.5% 100.0% 61.9% 100.0% 100.0%
PATMI (10.2) 11.5 1.3 7.6 (1.1) (0.8) 7.0
Core PATMI (10.3) 7.6 (2.6) 6.2 (1.1) (0.8) 1.6
Core PATMI w/o Forex (2.4) 7.7 5.3 6.5 (1.9) (0.4) 9.5
ANIMAL PROTEIN
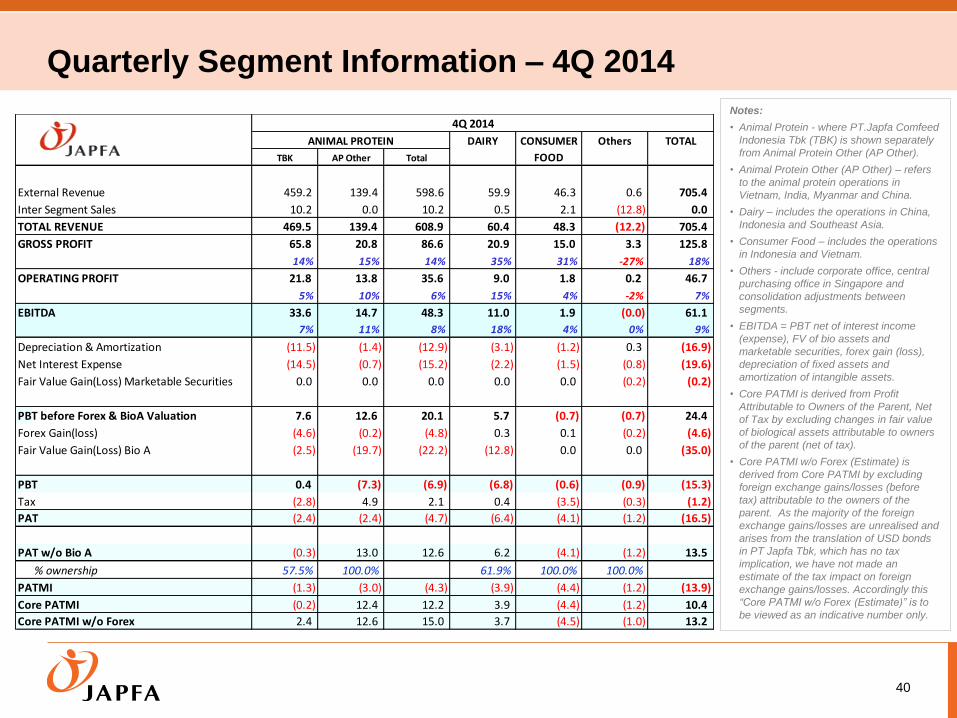
Quarterly Segment Information – 4Q 2014
40
Notes:
• Animal Protein - where PT.Japfa Comfeed
Indonesia Tbk (TBK) is shown separately
from Animal Protein Other (AP Other).
• Animal Protein Other (AP Other) – refers
to the animal protein operations in
Vietnam, India, Myanmar and China.
• Dairy – includes the operations in China,
Indonesia and Southeast Asia.
• Consumer Food – includes the operations
in Indonesia and Vietnam.
• Others - include corporate office, central
purchasing office in Singapore and
consolidation adjustments between
segments.
• EBITDA = PBT net of interest income
(expense), FV of bio assets and
marketable securities, forex gain (loss),
depreciation of fixed assets and
amortization of intangible assets.
• Core PATMI is derived from Profit
Attributable to Owners of the Parent, Net
of Tax by excluding changes in fair value
of biological assets attributable to owners
of the parent (net of tax).
• Core PATMI w/o Forex (Estimate) is
derived from Core PATMI by excluding
foreign exchange gains/losses (before
tax) attributable to the owners of the
parent. As the majority of the foreign
exchange gains/losses are unrealised and
arises from the translation of USD bonds
in PT Japfa Tbk, which has no tax
implication, we have not made an
estimate of the tax impact on foreign
exchange gains/losses. Accordingly this
“Core PATMI w/o Forex (Estimate)” is to
be viewed as an indicative number only.
4Q 2014
DAIRY CONSUMER Others TOTAL
TBK AP Other Total FOOD
External Revenue 459.2 139.4 598.6 59.9 46.3 0.6 705.4
Inter Segment Sales 10.2 0.0 10.2 0.5 2.1 (12.8) 0.0
TOTAL REVENUE 469.5 139.4 608.9 60.4 48.3 (12.2) 705.4
GROSS PROFIT 65.8 20.8 86.6 20.9 15.0 3.3 125.8
14% 15% 14% 35% 31% -27% 18%
OPERATING PROFIT 21.8 13.8 35.6 9.0 1.8 0.2 46.7
5% 10% 6% 15% 4% -2% 7%
EBITDA 33.6 14.7 48.3 11.0 1.9 (0.0) 61.1
7% 11% 8% 18% 4% 0% 9%
Depreciation & Amortization (11.5) (1.4) (12.9) (3.1) (1.2) 0.3 (16.9)
Net Interest Expense (14.5) (0.7) (15.2) (2.2) (1.5) (0.8) (19.6)
Fair Value Gain(Loss) Marketable Securities 0.0 0.0 0.0 0.0 0.0 (0.2) (0.2)
PBT before Forex & BioA Valuation 7.6 12.6 20.1 5.7 (0.7) (0.7) 24.4
Forex Gain(loss) (4.6) (0.2) (4.8) 0.3 0.1 (0.2) (4.6)
Fair Value Gain(Loss) Bio A (2.5) (19.7) (22.2) (12.8) 0.0 0.0 (35.0)
PBT 0.4 (7.3) (6.9) (6.8) (0.6) (0.9) (15.3)
Tax (2.8) 4.9 2.1 0.4 (3.5) (0.3) (1.2)
PAT (2.4) (2.4) (4.7) (6.4) (4.1) (1.2) (16.5)
PAT w/o Bio A (0.3) 13.0 12.6 6.2 (4.1) (1.2) 13.5
% ownership 57.5% 100.0% 61.9% 100.0% 100.0%
PATMI (1.3) (3.0) (4.3) (3.9) (4.4) (1.2) (13.9)
Core PATMI (0.2) 12.4 12.2 3.9 (4.4) (1.2) 10.4
Core PATMI w/o Forex 2.4 12.6 15.0 3.7 (4.5) (1.0) 13.2
ANIMAL PROTEIN
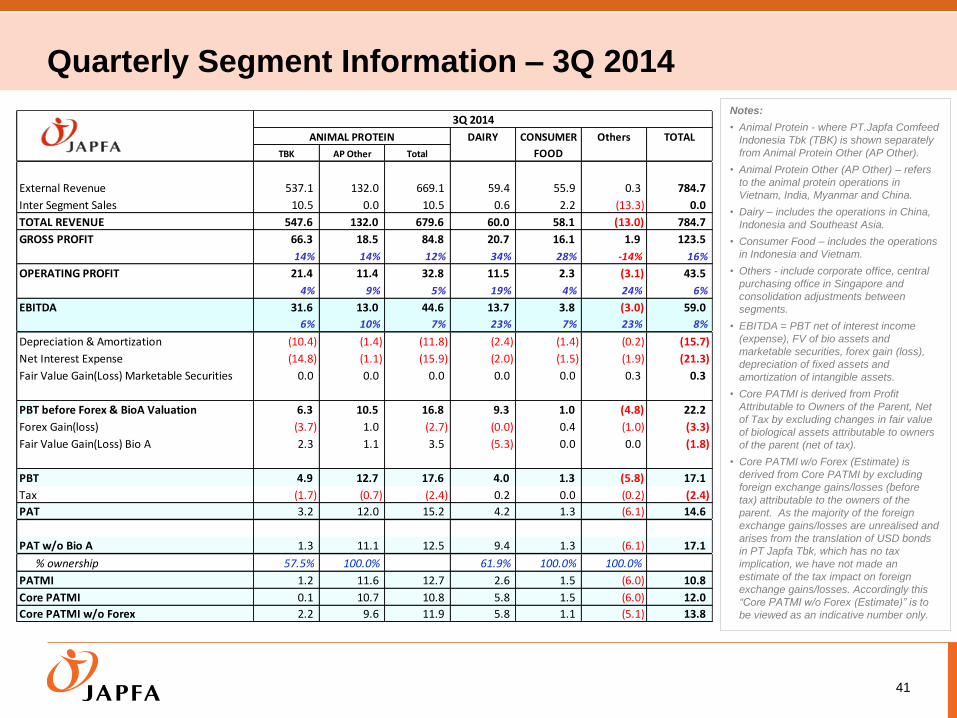
Quarterly Segment Information – 3Q 2014
41
Notes:
• Animal Protein - where PT.Japfa Comfeed
Indonesia Tbk (TBK) is shown separately
from Animal Protein Other (AP Other).
• Animal Protein Other (AP Other) – refers
to the animal protein operations in
Vietnam, India, Myanmar and China.
• Dairy – includes the operations in China,
Indonesia and Southeast Asia.
• Consumer Food – includes the operations
in Indonesia and Vietnam.
• Others - include corporate office, central
purchasing office in Singapore and
consolidation adjustments between
segments.
• EBITDA = PBT net of interest income
(expense), FV of bio assets and
marketable securities, forex gain (loss),
depreciation of fixed assets and
amortization of intangible assets.
• Core PATMI is derived from Profit
Attributable to Owners of the Parent, Net
of Tax by excluding changes in fair value
of biological assets attributable to owners
of the parent (net of tax).
• Core PATMI w/o Forex (Estimate) is
derived from Core PATMI by excluding
foreign exchange gains/losses (before
tax) attributable to the owners of the
parent. As the majority of the foreign
exchange gains/losses are unrealised and
arises from the translation of USD bonds
in PT Japfa Tbk, which has no tax
implication, we have not made an
estimate of the tax impact on foreign
exchange gains/losses. Accordingly this
“Core PATMI w/o Forex (Estimate)” is to
be viewed as an indicative number only.
3Q 2014
DAIRY CONSUMER Others TOTAL
TBK AP Other Total FOOD
External Revenue 537.1 132.0 669.1 59.4 55.9 0.3 784.7
Inter Segment Sales 10.5 0.0 10.5 0.6 2.2 (13.3) 0.0
TOTAL REVENUE 547.6 132.0 679.6 60.0 58.1 (13.0) 784.7
GROSS PROFIT 66.3 18.5 84.8 20.7 16.1 1.9 123.5
14% 14% 12% 34% 28% -14% 16%
OPERATING PROFIT 21.4 11.4 32.8 11.5 2.3 (3.1) 43.5
4% 9% 5% 19% 4% 24% 6%
EBITDA 31.6 13.0 44.6 13.7 3.8 (3.0) 59.0
6% 10% 7% 23% 7% 23% 8%
Depreciation & Amortization (10.4) (1.4) (11.8) (2.4) (1.4) (0.2) (15.7)
Net Interest Expense (14.8) (1.1) (15.9) (2.0) (1.5) (1.9) (21.3)
Fair Value Gain(Loss) Marketable Securities 0.0 0.0 0.0 0.0 0.0 0.3 0.3
PBT before Forex & BioA Valuation 6.3 10.5 16.8 9.3 1.0 (4.8) 22.2
Forex Gain(loss) (3.7) 1.0 (2.7) (0.0) 0.4 (1.0) (3.3)
Fair Value Gain(Loss) Bio A 2.3 1.1 3.5 (5.3) 0.0 0.0 (1.8)
PBT 4.9 12.7 17.6 4.0 1.3 (5.8) 17.1
Tax (1.7) (0.7) (2.4) 0.2 0.0 (0.2) (2.4)
PAT 3.2 12.0 15.2 4.2 1.3 (6.1) 14.6
PAT w/o Bio A 1.3 11.1 12.5 9.4 1.3 (6.1) 17.1
% ownership 57.5% 100.0% 61.9% 100.0% 100.0%
PATMI 1.2 11.6 12.7 2.6 1.5 (6.0) 10.8
Core PATMI 0.1 10.7 10.8 5.8 1.5 (6.0) 12.0
Core PATMI w/o Forex 2.2 9.6 11.9 5.8 1.1 (5.1) 13.8
ANIMAL PROTEIN
Thank You