Embed Size (px)
Citation preview

Research Article
Measurements of Wide-Band Cochlear Reflectance in Humans
DANIEL M. RASETSHWANE1
AND STEPHEN T. NEELY1
1Boys Town National Research Hospital, 555 North 30th Street, Omaha, NE 68131, USA
Received: 16 January 2012; Accepted: 21 May 2012; Online publication: 12 June 2012
ABSTRACT
The total sound pressure measured in the ear canalmay be decomposed into a forward- and a reverse-propagating component. Most of the reverse-propa-gating component is due to reflection at the eardrum.However, a measurable contribution to the reverse-propagating component comes from the cochlea.Otoacoustic emissions (OAEs) are associated with thiscomponent and have been shown to be importantnoninvasive probes of cochlear function. Total ear-canal reflectance (ECR) is the transfer function betweenforward and reverse propagating components mea-sured in the ear canal. Cochlear reflectance (CR) is theinner-ear contribution to the total ECR, which is themeasured OAE normalized by the stimulus. Methodsare described for measuring CR with a wide-bandnoise stimulus. These measurements offer widerbandwidth and minimize the influence of the mea-surement system while still maintaining features ofother OAEs (i.e., frequency- and level-dependentlatency). CR magnitude decreases as stimulus levelincreases. Envelopes of individual band-limited com-ponents of the time-domain CR have multiple peakswith latencies that persist across stimulus level, despitea shift in group delay. CR has the potential to infercochlear function and status, similar to other OAEmeasurements.
Keywords: otoacoustic emissions, latency,impedance, gammatone
INTRODUCTION
Sound pressure measured in the ear canal may beregarded as being composed of two components: (1) aforward-propagating component that transportsacoustic energy into the inner ear for the purpose ofhearing and (2) a reverse-propagating componentthat is produced in response to the forward compo-nent. In human ears, much of the reverse-propagatingcomponent comes from the eardrum. However, asmall but measurable contribution to the reverse-propagating component comes from the cochlea, theprimary sensory organ for hearing, which is locatedwithin the inner ear. We refer to the transfer functionbetween forward- and reverse-propagating compo-nents measured in the ear canal as ear-canal reflectance(ECR). We refer to the inner-ear contribution to thisreflectance, which is equivalent to a measurement ofotoacoustic emission (OAE) normalized by the stimu-lus, as cochlear reflectance (CR). In this study, methodsto extract CR from measurements of ECR aredescribed. The CR extraction method includes twosteps: (1) subtraction of high-level ECR (with mostlylinear cochlear response) from low-level ECR (withboth linear and nonlinear responses) and (2) time–frequency analysis. The objective is to obtain acochlear response that has the least possible influenceof the middle-ear and measurement system and thatcan be interpreted in terms of a linear model. CRmeasurements may provide alternative means forclinical prediction of supra-threshold cochlear statusand for future cochlear modeling interpretations.Abbreviations and symbols used in this article arelisted in Table 1.
Otoacoustic emissions are acoustical signals thatoriginate within the cochlea as by-products of its normalsignal-processing function and constitute the reverse-propagating component of sound pressure that origi-nates from the cochlea. OAEs may be generated either
Correspondence to: Daniel M. Rasetshwane & Boys Town NationalResearch Hospital & 555 North 30th Street, Omaha, NE 68131, USA.Telephone: +1-402-498-6372; fax: +1-402-498-6351; email: [email protected]
JARO 13: 591–607 (2012)DOI: 10.1007/s10162-012-0336-1D 2012 The Author(s). This article is published with open access at Springerlink.com
591
JAROJournal of the Association for Research in Otolaryngology
spontaneously, in the absence of any acoustical stimu-lation, or as a response evoked by stimulation. OAEs aregenerated by vibrations within the cochlea at variouslocations. These vibrations travel towards the base of thecochlea, through the middle ear, and to the ear canalwhere they can be detected as sound pressure. OAEscan be evoked using (1) a transient stimulus, (2) a puretone, or (3) a pair of tones. The type of stimulusdetermines the OAE name. Stimuli for transient-evokedOAEs (TEOAE) include clicks (click-evoked OAE orCEOAE) and short-duration tone bursts and evoke awider frequency range of OAE simultaneously (withclicks evoking a wider frequency range compared totone bursts). Stimulus-frequency OAEs (SFOAEs) areevoked using pure tones and cover a narrow frequencyrange around the frequency of the stimulus. Distortion-product OAEs (DPOAEs) are evoked using a pair ofprimary tones. OAEs have also been evoked using noisewith a band-limited spectral density that is similar to thatof a click used for evoking CEOAE (Maat et al. 2000).
OAEs can also be classified based on the mecha-nism or “source” of emission (e.g., Shera and Guinan1999). It is generally accepted that there are twodistinct OAE generation mechanisms—linear coher-ent reflection and nonlinear distortion (e.g., Sheraand Guinan 1999). OAEs produced by these twomechanisms have different properties. For example,the phase of the linear coherent reflection compo-nent changes rapidly with frequency, while the phaseof the nonlinear distortion component is essentiallyflat as a function of frequency (e.g., Shera and Guinan1999; Kemp 2002; Dhar et al. 2011). Although it isgenerally agreed that linear coherent reflection is theprimary mechanism involved in SFOAEs and thatnonlinear distortion is the primary mechanism in-volved in DPOAEs, details of these OAE generationmechanisms are still a matter of debate (e.g., Siegel etal. 2005; Yates and Withnell 1999). Knowledge of theprecise mechanism is important because it affects theparticular processing and decoding of OAE data usedto extract information relevant to the hearing process(Kemp 2002). The generation mechanisms may alsocorrelate with particular cochlear pathologies (Sheraand Guinan 1999), although empirical evidence insupport of this view remains elusive.
CR is the cochlear contribution to the total ear-canal reflectance measured in the ear canal. It isessentially the measured OAE normalized by thestimulus. Specifically, the OAE waveform is decon-volved by the forward pressure. Our definition of CRshould not be confused with Shera et al. (2005) whodefine CR looking into the cochlea from the stapes.A complete characterization of reflectance, as withany transfer function, requires measurements acrossa wide frequency range. In linear, time-invariantsystems, transfer functions are independent of thestimulus used to measure them. However, CR isstimulus dependent because cochlear nonlinearitiesare functionally significant. This study measured CRusing a wide-band noise (WBN) stimulus over a rangeof stimulus levels. Use of a WBN stimulus allows for acharacterization of the measurements as a transferfunction and also offers other benefits as describedlater. These measurements have the potential toinfer cochlea function and status, similar to OAEmeasurements.
Ear-canal reflectance (ECR) can be measured byplacing a microphone and an appropriately calibratedsound source in the ear canal (e.g., Allen 1986; Keefe etal. 1992; Siegel 1994; Neely andGorga 1998).Most of thereflected energy that constitutes ECR is linearly relatedto stimulus intensity and comes from the eardrum andmiddle ear (for a review, see Keefe and Schairer 2011);however, a small contribution, with both linear andnonlinear components, is due to reflection from thecochlea (Allen 1997). Allen described a method for
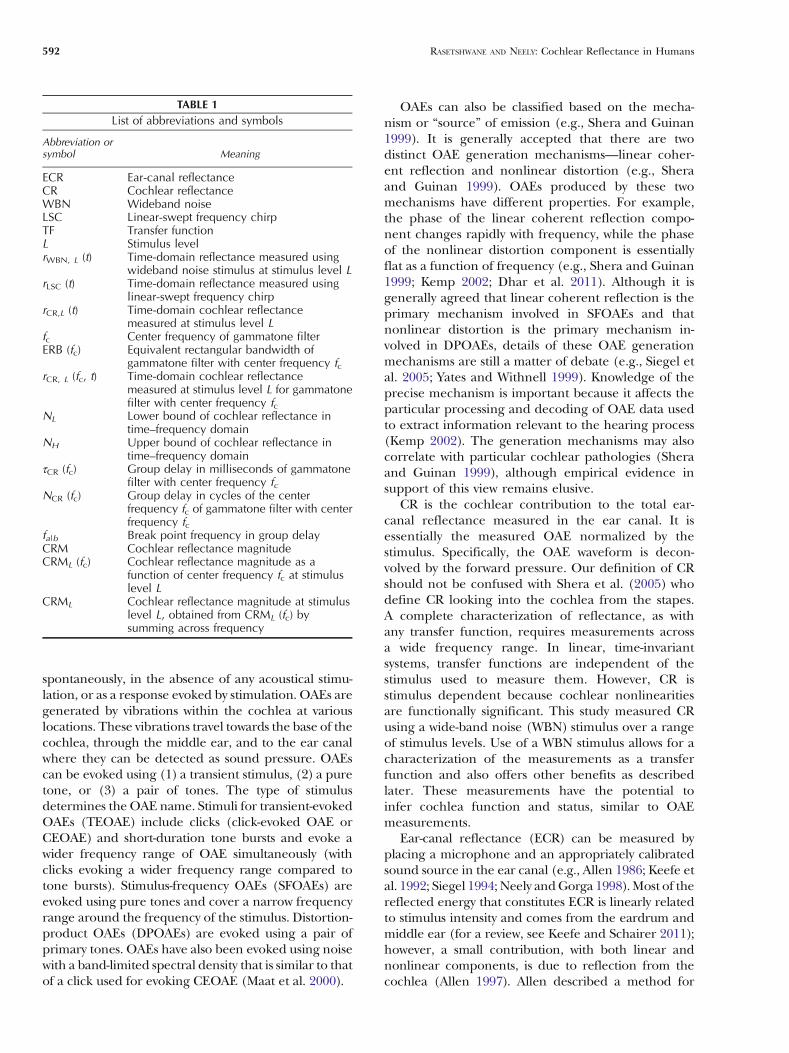
TABLE 1List of abbreviations and symbols
Abbreviation orsymbol Meaning
ECR Ear-canal reflectanceCR Cochlear reflectanceWBN Wideband noiseLSC Linear-swept frequency chirpTF Transfer functionL Stimulus levelrWBN, L (t) Time-domain reflectance measured using
wideband noise stimulus at stimulus level LrLSC (t) Time-domain reflectance measured using
linear-swept frequency chirprCR,L (t) Time-domain cochlear reflectance
measured at stimulus level Lfc Center frequency of gammatone filterERB (fc) Equivalent rectangular bandwidth of
gammatone filter with center frequency fcrCR, L (fc, t) Time-domain cochlear reflectance
measured at stimulus level L for gammatonefilter with center frequency fc
NL Lower bound of cochlear reflectance intime–frequency domain
NH Upper bound of cochlear reflectance intime–frequency domain
τCR (fc) Group delay in milliseconds of gammatonefilter with center frequency fc
NCR (fc) Group delay in cycles of the centerfrequency fc of gammatone filter with centerfrequency fc
fa|b Break point frequency in group delayCRM Cochlear reflectance magnitudeCRML (fc) Cochlear reflectance magnitude as a
function of center frequency fc at stimuluslevel L
CRML Cochlear reflectance magnitude at stimuluslevel L, obtained from CRML (fc) bysumming across frequency
592 RASETSHWANE AND NEELY: Cochlear Reflectance in Humans

measuring the nonlinear component of the ECR. Theymeasured ECR at several different stimulus levels, usingtonal stimuli and a calibrated sound source. By substi-tuting a high-level impedance for the characteristicimpedance when calculating reflectance, they extracteda nonlinear component of reflectance. Their resultsdemonstrated that cochlear reflectance varied withstimulus level. However, the interpretation of tonalresponses as a transfer function presents a theoreticalproblem because the interpretation of reflectance as atransfer function assumes a linear, time-invariant sys-tem. When the system is nonlinear, then it may nolonger be valid to combine independent measurementsmade one frequency at a time and interpret the set offrequencies as if they represent a single linear system.Use of a WBN stimulus in the current measurementsallows for the invocation of de Boer’s (1997) nonlinearequivalence (EQ-NL) theorem, which in turn theoreti-cally allows for the interpretation of the data usingconcepts and principles applicable to linear systemssuch as transfer functions, Fourier analysis, and time–frequency analysis. According to the EQ-NL theorem,for a given class of nonlinear system, of which thecochlea is an example, there is an equivalent linearsystem that has the same response as the nonlinearsystem for a WBN stimulus at a specific level.
This study describes methods for extracting CRfrom ECR. Our methods for extraction assume thatnoncochlear contributions to ECR vary linearly withstimulus level, while CR varies mainly nonlinearly withlevel. We demonstrate the level dependence of CRmeasurements and show that CR latency has frequen-cy and level dependence that is a characteristic ofsignals of cochlea origin. Qualitative comparisons aremade to previous measurement of transfer functions(TFs) of CEOAE and SFOAE (Kalluri and Shera 2007;Sisto and Moleti 2008). We apply time–frequencyanalysis to our estimate of time-domain CR toobtain frequency band-limited estimates that maybe useful in probing the function and status ofspatially limited regions of the cochlea. We exam-ine envelopes of these band-limited CR envelopesand demonstrate that they have multiple peakswith delays that persist across stimulus level,despite the shift in group delays with level. Thisanalysis may potentially provide more informationregarding the generation sites of OAEs.
METHODS
Subjects
A total of 20 subjects with ages ranging from 15 to65 years participated in this study. Subjects wererequired to have audiometric thresholds of 20 dBHL or better (ANSI 1996) for the octave and
interoctave frequencies from 0.25 to 8 kHz. Middle-ear status was assessed using tympanometry with a 226-Hz probe tone. To qualify for inclusion, the followingtympanometric criteria had to be met: peak-compen-sated static admittance of 0.3–2.5 mmhos and peakpressure between −100 and +50 daPa. Otoscopicexamination was also performed as a way to furtherensure normality of the ear-canal and ear drum. Allsubjects were recruited from a database of potentialresearch subjects that is maintained at Boys TownNational Research Hospital. Subjects were paid fortheir participation. The study described in this articlewas conducted under an approved Institutional Re-view Board protocol. After first obtaining informedconsent, then audiometric, tympanometric, and oto-scopic assessments, data collection was initiated,which required an average of 72 min per subject.
Measurements
The sound-delivery system consisted of two modifiedtweeters (TW010F1, Audax, France) acoustically at-tached by plastic tubes to an ER-10B+ probe micro-phone (Etymotic Research, Elk Grove Village, IL,USA). Each stimulus condition was repeated on eachsound source, and the independent measurementsfrom the two sources were combined into a singleaverage. Amplifiers placed between the soundcardand the tweeters provided power gain and reducedthe electrical load on the soundcard output. (Thedesign of the modified tweeters and amplifiers wasdeveloped at Northwestern University by J. H. Siegel,who generously shared a prototype with us.) Themeasurement system was calibrated prior to datacollection to determine the Thévenin-equivalentsource impedance and pressure (Allen 1986; Keefeet al. 1992; Rasetshwane and Neely 2011).
A WBN signal and a wide-band linear-swept fre-quency chirp (LSC) signal, both generated digitally ata sampling rate of 48 kHz, were used as stimuli. Theduration of each stimulus/response buffer was171 ms. The WBN stimulus was presented at levels of20–70 dB SPL in 10-dB steps, and the LSC stimuluswas presented at 60 dB SPL. These stimulus levelswere determined using a sound level meter (System824, Larson Davis, Provo, UT, USA) with C weighting,and their range is similar to those routinely used forCEOAE (e.g., Kalluri and Shera 2007) and SFOAE(Choi et al. 2008) measures. The WBN stimulus hadconstant spectral amplitude and random phase; thatis, it was white noise. White noise was chosen forcompatibility with the EQ-NL theorem. These stimu-lus conditions are summarized in Table 2. The fourthcolumn of the table reports the averaging time inseconds. More averaging was done at the lowerstimulus levels to mitigate the effect of low signal/
RASETSHWANE AND NEELY: Cochlear Reflectance in Humans 593
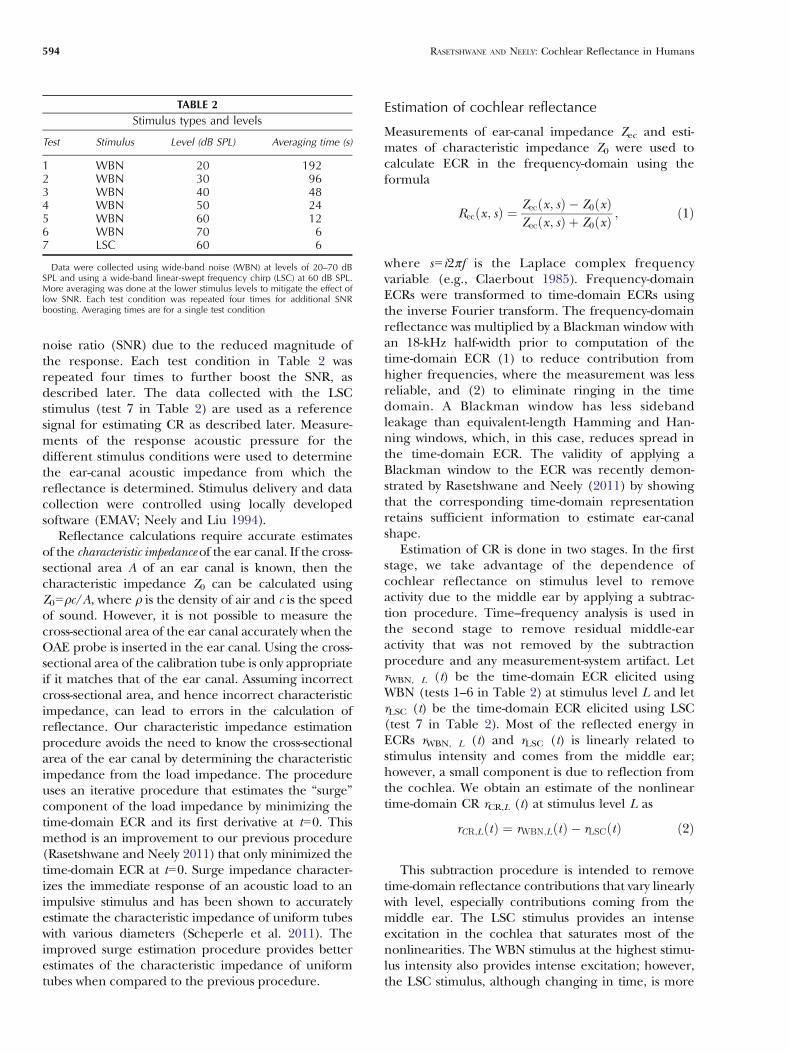
noise ratio (SNR) due to the reduced magnitude ofthe response. Each test condition in Table 2 wasrepeated four times to further boost the SNR, asdescribed later. The data collected with the LSCstimulus (test 7 in Table 2) are used as a referencesignal for estimating CR as described later. Measure-ments of the response acoustic pressure for thedifferent stimulus conditions were used to determinethe ear-canal acoustic impedance from which thereflectance is determined. Stimulus delivery and datacollection were controlled using locally developedsoftware (EMAV; Neely and Liu 1994).
Reflectance calculations require accurate estimatesof the characteristic impedance of the ear canal. If the cross-sectional area A of an ear canal is known, then thecharacteristic impedance Z0 can be calculated usingZ00ρc/A, where ρ is the density of air and c is the speedof sound. However, it is not possible to measure thecross-sectional area of the ear canal accurately when theOAE probe is inserted in the ear canal. Using the cross-sectional area of the calibration tube is only appropriateif it matches that of the ear canal. Assuming incorrectcross-sectional area, and hence incorrect characteristicimpedance, can lead to errors in the calculation ofreflectance. Our characteristic impedance estimationprocedure avoids the need to know the cross-sectionalarea of the ear canal by determining the characteristicimpedance from the load impedance. The procedureuses an iterative procedure that estimates the “surge”component of the load impedance by minimizing thetime-domain ECR and its first derivative at t00. Thismethod is an improvement to our previous procedure(Rasetshwane and Neely 2011) that only minimized thetime-domain ECR at t00. Surge impedance character-izes the immediate response of an acoustic load to animpulsive stimulus and has been shown to accuratelyestimate the characteristic impedance of uniform tubeswith various diameters (Scheperle et al. 2011). Theimproved surge estimation procedure provides betterestimates of the characteristic impedance of uniformtubes when compared to the previous procedure.
Estimation of cochlear reflectance
Measurements of ear-canal impedance Zec and esti-mates of characteristic impedance Z0 were used tocalculate ECR in the frequency-domain using theformula
Rec x; sð Þ ¼ Zec x; sð Þ � Z0ðxÞZec x; sð Þ þ Z0ðxÞ ; ð1Þ
where s0 i2πf is the Laplace complex frequencyvariable (e.g., Claerbout 1985). Frequency-domainECRs were transformed to time-domain ECRs usingthe inverse Fourier transform. The frequency-domainreflectance was multiplied by a Blackman window withan 18-kHz half-width prior to computation of thetime-domain ECR (1) to reduce contribution fromhigher frequencies, where the measurement was lessreliable, and (2) to eliminate ringing in the timedomain. A Blackman window has less sidebandleakage than equivalent-length Hamming and Han-ning windows, which, in this case, reduces spread inthe time-domain ECR. The validity of applying aBlackman window to the ECR was recently demon-strated by Rasetshwane and Neely (2011) by showingthat the corresponding time-domain representationretains sufficient information to estimate ear-canalshape.
Estimation of CR is done in two stages. In the firststage, we take advantage of the dependence ofcochlear reflectance on stimulus level to removeactivity due to the middle ear by applying a subtrac-tion procedure. Time–frequency analysis is used inthe second stage to remove residual middle-earactivity that was not removed by the subtractionprocedure and any measurement-system artifact. LetrWBN, L (t) be the time-domain ECR elicited usingWBN (tests 1–6 in Table 2) at stimulus level L and letrLSC (t) be the time-domain ECR elicited using LSC(test 7 in Table 2). Most of the reflected energy inECRs rWBN, L (t) and rLSC (t) is linearly related tostimulus intensity and comes from the middle ear;however, a small component is due to reflection fromthe cochlea. We obtain an estimate of the nonlineartime-domain CR rCR,L (t) at stimulus level L as
rCR;LðtÞ ¼ rWBN;LðtÞ � rLSCðtÞ ð2Þ
This subtraction procedure is intended to removetime-domain reflectance contributions that vary linearlywith level, especially contributions coming from themiddle ear. The LSC stimulus provides an intenseexcitation in the cochlea that saturates most of thenonlinearities. The WBN stimulus at the highest stimu-lus intensity also provides intense excitation; however,the LSC stimulus, although changing in time, is more
TABLE 2Stimulus types and levels
Test Stimulus Level (dB SPL) Averaging time (s)
1 WBN 20 1922 WBN 30 963 WBN 40 484 WBN 50 245 WBN 60 126 WBN 70 67 LSC 60 6
Data were collected using wide-band noise (WBN) at levels of 20–70 dBSPL and using a wide-band linear-swept frequency chirp (LSC) at 60 dB SPL.More averaging was done at the lower stimulus levels to mitigate the effect oflow SNR. Each test condition was repeated four times for additional SNRboosting. Averaging times are for a single test condition
594 RASETSHWANE AND NEELY: Cochlear Reflectance in Humans

localized at any given instant and was found to producebetter estimates of cochlear reflectance in preliminaryanalysis. The LSC response is thought to have lesscochlear contribution than aWBN response at the samelevel because activity within the cochlea is morelocalized at any instant in time, due to the instantaneousfrequency content of the stimulus, causing local vibra-tion amplitudes to be larger and, therefore, causingcontributions from nonlinear elements, which saturateat higher amplitudes, to be relatively smaller. Separatetime-domain CRs were computed from the four meas-urements and averaged to improve the SNR. AdditionalSNR improvements were obtained by averaging the twotime-domain CRs from the two sound sources. Anestimate of the noise level was obtained as the differencebetween repeated measurements.
Figure 1 shows examples of the time-domainreflectances after the subtraction procedure for onesubject at stimulus levels of 20–70 dB SPL of WBNstimulus. The ordinate label shows the stimulus leveland not the level of the time-domain CR. Highfrequency content temporally precedes low-frequencycontent, consistent with signals of cochlea origin. Theactivity below t01 ms is residual middle-ear activitythat was not removed by the subtraction procedureand measurement-system artifact. This activity isdominant below t01 because the ear-canal time-domain reflectance has large amplitude for tG1 (seeRasetshwane and Neely 2011, Fig. 5).
To eliminate the residual middle-ear activity andmeasurement-system artifact time–frequency analysis of
CR rCR,L (t) was performed using a complex gammatonefilterbank with 49 channels (e.g., Patterson and Holds-worth 1996; Hohmann 2002). The individual gamma-tone filters of the filterbank were of order n04 and wereimplemented using the infinite impulse response algo-rithm of Härmä (1999). The filterbank was designedsuch that all the filters had the same tuning of QERB03,with QERB defined as fc/ERB (fc), where fc is the centerfrequency and ERB (fc) is the equivalent rectangularbandwidth of the filter with center frequency fc,respectively (see Shera et al. 2010). The center frequen-cies were logarithmically spaced from fc00.0625–16 kHzin 1/6-octave steps. The outputs of the gammatonefilterbank rCR,L (fc, t) are complex-valued bandpass-filtered time-domain components of the CR rCR,L (t).The real part of the output of the filterbank representsthe band-limited gammatone filter output, whereas theimaginary part approximates its Hilbert transform(Hohmann 2002). The use of complex-valued gamma-tone filters facilitates accurate calculation of the time-domain envelope since two signals, the imaginary andreal parts, are involved in the computation of a singleenvelope as opposed to use of only one signal when thefilter outputs are real. The individual outputs of thegammatone filterbank rCR, L (fc,t) can experiencedifferent delays, which can affect the estimation ofthe latencies of these outputs. Compensation fordelay of the gammatone filters was performed bydelaying the fine structure and the envelope ofeach filter’s impulse response so that all channelshave their envelope maximum and their fine-
FIG. 1. Time-domain cochlear reflec-tance after the subtraction procedure andbefore the time–frequency analysis. Theordinate label shows the stimulus leveland not the level of the time-domain CR.High-frequency content temporally pre-cedes low-frequency content in the time-domain CR. The activity before t=1 ms ismiddle-ear activity that was not removedby the subtraction procedure.
RASETSHWANE AND NEELY: Cochlear Reflectance in Humans 595

structure maximum at the same time instant, thedesired filterbank group delay (Hohmann 2002).The advantage of using the gammatone filterbankover a short-time Fourier transform or a continu-ous-wavelet transform is that it allows frequencyresolution to be specified as desired at both low andhigh frequencies. Additionally, gammatone filtersare often used in psychophysical auditory models(e.g., Patterson and Holdsworth 1996; Meddis et al.2001; Jepsen et al. 2008) because of their similarityto physiological measures of basilar membranevibrations (e.g., Rhode and Robles 1974).
An example of the time–frequency analysis of CR isillustrated in Figure 2 for one of the subjects at astimulus level of 20 dB SPL, using a spectrogram. Werefer to this spectrogram as the gammatone spectrogram.In the figure, more reddish color corresponds tolarger magnitude compared to more bluish color andthe magnitude range (from red to blue) is 108 dB.Also plotted in Figure 2 are functions indicatingconstant numbers of delay cycles (N≡ tfc):
NL � tfc ¼ 4þ 0:27f ð3Þ
NH � tfc ¼ 40: ð4Þ
The 0.27-ms factor in the definition of NL [cf. Eq.(3)] is the average round-trip transmission delay tothe middle ear ossicles, determined from time-domain ECR (see Rasetshwane and Neely 2011,
Fig. 5). The region of high energy of the gammatonespectrogram enclosed by NL and NH includes most ofthe energy of the CR. The region below NL presum-ably includes residual middle-ear reflectance andmeasurement-system artifact that was not removed bythe subtraction procedure of Eq. (2). However, athigh frequencies (above 8 kHz), the separation of thisactivity from possible cochlear contributions from thebase is not that clear. The activity beyond t030 ms orabove NH is thought to be due to re-reflection of thetraveling wave at the stapes, sound source, and thebasilar membrane emission source. We estimate CR inthe region enclosed by NL, NH, and t030 ms. Aninspection of all the data collected revealed that thelimits NL, NH, and t030 ms were always a good boundof the exponential decaying cochlear contribution,and the limit NL was always a reasonable boundarybetween cochlear reflectance and residual middle-earactivity.
Figure 2 also provides information about CRlatency. For example, the delay of the center of energyof any given frequency is visualized as the horizontalcenter of the reddish region along the correspondingvertical location. To estimate the CR latency for agiven stimulus level L, we compute, for centerfrequency fc, the group delay τCR (fc) of the compo-nents rCR,L (fc, t)
tCR fcð Þ ¼Ptt rCR;L fc; tð Þ�� ��2
Pt
rCR;L fc; tð Þ�� ��2 : ð5Þ
This definition of group delay, which is consistentwith Goldstein et al. (1971), corresponds to the timeat which the energy of rCR,L (fc, t) is centered withinthe spectrogram region described above. The dots inFigure 2 are an example of the group-delay estimatesτCR (fc). The time limits in the summations aredefined by the functions NL and NH:
NL < N < NH ; ð6Þ
and
0 � t < 30ms: ð7Þ
The time limit t030 ms is larger than the largestpreviously reported latency measurement for signalsof cochlea origin (see, e.g., Neely et al. 1988) and doesnot result in an underestimation of τCR (fc). The timelimits of Eqs. (6) and (7) can be interpreted as awindowing method similar to that commonly used forextracting OAEs (see, e.g., Kalluri and Shera 2007),with the added feature that the onset of the window
time (ms)
freq
uenc
y (k
Hz)
NL
NH
0 10 20 30 40 50 600.0625
0.125
0.25
0.5
1
2
4
8
16
FIG. 2. Time–frequency analysis of CR using the gammatonespectrogram. The region of high energy of the gammatone spectro-gram enclosed by functions NL and NH includes most of theexponential decaying energy of CR. The region below NL includesresidual middle ear and measurement system activity that was notremoved by the subtraction procedure. The activity beyond t=30(indicated with vertical dashed line) is due to re-reflection of thetraveling wave. The dots are estimates of the group delay.
596 RASETSHWANE AND NEELY: Cochlear Reflectance in Humans

(controlled by NL) varies with frequency. An earlyonset time is used for high frequencies, allowing us toextract high frequency CR that has short delay, and alate onset time is used for low frequencies to reducecontribution from residual middle-ear reflectance andany measurement-system artifact.
Following Shera and Guinan (2003), we define
NCR fcð Þ � fctCR fcð Þ; ð8Þ
a dimensionless group delay by measuring time incycles or periods of the center frequency of the filters,fc. A power law fit, i.e., straight-line approximation onthe log–log axes, of the form
y ¼ axb ð9Þ
can be fit to the group delay data τCR(fc) or thefunction NCR(fc) to characterize the frequency–laten-cy relationship (e.g., Neely et al. 1988). In thisequation, parameter a is the latency at fc01 kHz andx0 fc/1 kHz.
The estimate of CR magnitude (CRM) as a functionof frequency is obtained as the root mean square ofthe outputs of the gammatone filters rCR,L (fc, t)
CRML fcð Þ ¼ g
ffiffiffiffiffiffiffiffiffiffiffiffiffiffiffiffiffiffiffiffiffiffiffiffiffiffiffiffiffiffiffiffiffiffiffiffiffiffiffi1N
Xt
rCR;L fc;tð Þ�� ��2s; ð10Þ
where the time limits in the summation are againspecified by Eqs. (6) and (7). The scale factor γ givenby
g ¼ffiffiffiffiffiffiffiffiffiffiffiffiffiffiffiffiffiffi
2fsERB fcð Þ
s; ð11Þ
where fs is the sampling rate and ERB (fc) is as definedabove, was applied to remove high frequency empha-sis (introduced using bandwidths that were propor-tional to the center frequencies) and to provide forphysical interpretation.
To demonstrate validity of our method for com-puting the reflectance magnitude [cf. Eq. (10)],Figure 3 compares the average ECR magnitude forthe subjects included in this study computed fromrLSC (t) using Eq. (10) to average ECR computed usingthe magnitude Fourier transform of rLSC (t). There isagreement between the two methods; the reflectancemagnitude obtained with Eq. (10) is a smooth versionof the reflectance magnitude obtained as the magni-tude Fourier transform. The smoothed spectrum isconvenient when comparing spectra across differentstimulus levels. The trends in the ECR magnitude of
Figure 3 are in agreement with recent ECR measure-ments reported by Rosowski et al. (2012), which arelikewise in agreement with several previous measure-ments of ECR (e.g., Voss and Allen 1994).
An estimate of CRM as a function of stimulus levelis obtained from Eq. (10) by integrating over frequen-cy, i.e.
CRML ¼ 1N
Xfc
CRML fcð Þ: ð12Þ
where the frequency limits in the summation areagain specified by Eqs. (6) and (7).
RESULTS
Figure 4 shows the mean levels and ±1 standarddeviation (SD) of time-domain CR rCR,L (t) after thesubtraction procedure, as function of stimulus levelfor the subjects who participated in this study. Themean noise level, defined as the difference betweenrepeated measurements of time-domain CR, is alsoshown. The levels of rCR,L (t) are presented as anindicator of the SNR of our data and not as anindicator of the level of the OAE that would beobtained if rCR,L (t) was convolved by the stimulus,since rCR,L (t) include residual contributions from themiddle-ear and measurement system. An indicator ofthe level of the OAE can be obtained from areflectance that excludes middle-ear activity, as dis-cussed later. The rCR,L (t) SNR is about 10 dB atstimulus levels of 20–50 dB and about 12 dB at higherstimulus levels. The positive SNR demonstrates thereliability of our measurements for all stimulus levels.The SDs for rCR,L (t) describe intersubject variability.Some of this variability is expected from coherent-reflection theory, due to the role of random mechan-ical irregularity in the process of otoacoustic emissiongeneration (Shera et al. 2008), and some of thevariability may be due to measurement noise.
Cochlear reflectance magnitude
Figure 5 shows examples of gammatone spectrograms ofCR at six stimulus levels for the same subject whose CRat 20 dB SPL was shown in Figure 2. As stimulus levelincreases, the energy of the component that weassociate with CR (between NL and NH) decreases andthe energy of the component in the region below NL
remains the same or increases; that is why we associatethe latter with the middle-ear and the measurementsystem. The temporal persistence of CR also depends onlevel; there is more re-reflected energy closer to 30ms atthe lower levels compared to the higher levels.
RASETSHWANE AND NEELY: Cochlear Reflectance in Humans 597

Cochlear reflectance magnitude (CRM) as a func-tion of frequency, CRML (fc) [cf. Eq. (10)] for twosubjects is plotted in Figure 6, for stimulus levels of20–70 dB SPL. The dependence of CRM on stimuluslevel is visible—CRM is higher at lower stimulus levels.Individual CRM has spectral oscillations similar to
those observed in CEOAE and SFOAE TFs by Kalluriand Shera (2007) and in CEOAE TFs by Sisto andMoleti (2008). However, the notches in the CRMspectra are not as sharp as those in the OAE TFs.Individual variation, in terms of location of peaks andnotches, between the two subjects can also beobserved.
Mean CRM for the entire group of subjects isplotted Figure 7. As expected, averaging over subjectsremoves the individual spectral oscillations but revealsglobal spectral features. Mean CRM has a bandpasscharacteristic with a broad peak centered at 1.1 kHz atstimulus levels of 20–50 dB SPL. The spectral shape ofCRML (fc) becomes flatter at 60 and 70 dB SPL. butthe peak at 1.1 kHz remains prominent. This peak, aswell as the general spectral shape of our mean CRM,is similar to TEOAE TF of Sisto and Moleti (2008).Kalluri and Shera (2007) also observed this peak intheir CEOAE and SFOAE transfer functions.
The overall dependence of CRM on level can alsobe revealed by integrating CRM functions of Figure 7across frequency to obtain CRM as a function ofstimulus level, CRML [cf. Eq. (12)]. Figure 8 showsCRML functions for individual subjects and the groupmean CRML. Although there is variability in individ-ual subjects, the CRML functions all share the samequalitative form. They all decrease with increases instimulus level, and most show saturation or onset ofsaturation at the highest stimulus level, i.e., furtherincrease in stimulus level does not result in consider-able decrease in CRM. At low level (from L020–30 dBSPL) mean CRML has a slope of −0.48 dB/dB. Thisslope steepens to −0.60 dB/dB at intermediate levels(from L030–60 dB SPL). At high stimulus levels (fromL060–70 dB SPL), mean CRML becomes independentof level and has a slope near zero (−0.06 dB/dB). Theslope of CRML at intermediate levels is similar to therange of slopes, −0.55 to −0.7, of equivalent CEOAETF analysis of Sisto and Moleti. Kalluri and Shera(2007) obtained a shallower slope of about −0.4between L030 and 60 dB SPL in their unified analysisof CEOAE and SFOAE TFs of a single subject, butinterestingly as we did, they observed a decliningslope (less steep) at low levels. However, their slope atlow levels was much shallower than the slope weobserved. The reduction in the slope of CRML at lowlevel suggests onset of cochlear linearity.
The level of the OAE at each stimulus level can bededuced by deriving an OAE input/output (I/O)function from the CRML function and it ranges from−5 dB SPL (at L020 dB SPL) to 26 dB SPL (at L070 dB SPL). This OAE I/O function (plot not shown)has a slope of 0.40 dB/dB between L030 and 60 dBSPL and a slope of 0.52 dB/dB between L020 and30 dB SPL. The OAE I/O slope of 0.40 is shallowerthan the mean slopes (0.61 and 0.65) reported by
FIG. 3. Comparison of average ECR magnitude measured usingFourier transform (solid line) to ECR reconstructed from thegammatone-filter outputs (dashed line). The reconstructed ECRmagnitude is a smooth version of the measured ECR magnitude.The agreement validates the gammatone-filterbank method forcomputing the CR magnitude [cf. Eq. (10)].
FIG. 4. Mean levels±1 SD of CR rCR,L (t) (open circles) obtainedwith the subtraction procedure (before time–frequency analysis) andnoise floor (filled triangles) as functions of stimulus level. The SNR(difference between the two curves) is near constant for stimuluslevels of 20–50 dB and increases for higher stimulus levels. Thepositive SNR demonstrates the reliability of our measurements for allstimulus levels.
598 RASETSHWANE AND NEELY: Cochlear Reflectance in Humans

Choi et al. (2008) in their two different analyses ofSFOAE I/O functions.
Reflectance latency
Latencies of time-domain components
An example of the time-domain CR envelope is shownin Figure 9 for one subject for center frequency fc04 kHz and stimulus levels of 20–70 dB SPL. Thisanalysis shows the variation in the envelope of thetime-domain CR as a function of stimulus level at agiven center frequency. In terms of the function rCR, L(fc, t), Figure 9 shows rCR;L fc ¼ 4; tð Þ��L¼20;30;:::70dB. TheCR envelopes displayed in the right panel arenormalized to the maximum peak for visual clarity,and the envelopes displayed in the left panel are notnormalized to show the dependence of their ampli-tude on stimulus level. The dashed vertical lines arethe limits NL and NH [cf. Eqs. (3) and (4)]. Super-imposed on the plots are the delay of the dominantpeak or envelope delay (filled squares) and groupdelay, τCR (fc04) (filled circles). It is interesting tonote that the CR envelopes have multiple peaks ateach level, not just the dominant peak and the timingsof these peaks persist across level. The amplitudes ofthe peaks are large at low stimulus levels and decreasewith increases in stimulus levels. Recall that a similartrend (decrease in CR with increase in stimulus level)was observed for the functions CRML (fc) and CRML.The peak at t01.3 ms is the dominant peak at L060
NL
NH
L = 20 dB SPL
freq
uenc
y (k
Hz)
0 20 40 600.0625
0.125
0.25
0.5
1
2
4
8
16
NL
NH
L = 30
0 20 40 600.0625
0.125
0.25
0.5
1
2
4
8
16
NL
NH
L = 40
0 20 40 600.0625
0.125
0.25
0.5
1
2
4
8
16
NL
NH
L = 50
time (ms)
freq
uenc
y (k
Hz)
0 20 40 600.0625
0.125
0.25
0.5
1
2
4
8
16
NL
NH
L = 60
time (ms)0 20 40 60
0.0625
0.125
0.25
0.5
1
2
4
8
16
NL
NH
L = 70
time (ms)0 20 40 60
0.0625
0.125
0.25
0.5
1
2
4
8
16
FIG. 5. Illustration of CR dependence on stimulus level (L) and frequency using gammatone spectrograms. CR can be observed at the fourlowest stimulus levels, and its magnitude decreases with increasing stimulus level. There is no evidence of CR at the highest level. CR persistslonger at lower stimulus levels than higher levels; there is more re-reflected energy near 30 ms at the lowest level.
A
B
FIG. 6. Individual CR magnitude (CRM) as a function of frequency,CRML (fc) for two subjects, for stimulus levels of 20–70 dB SPL. CRMhas spectral oscillations similar to those observed in CEOAE andSFOAE transfer functions by Kalluri and Shera (2007) and in CEOAEtransfer functions by Sisto and Moleti (2008). Individual variationbetween the two subjects can also be observed.
RASETSHWANE AND NEELY: Cochlear Reflectance in Humans 599

and 70 dB SPL. The peak at t04.2 ms, which is small atL060 and 70 dB SPL, becomes the dominant peakfrom L050 to 30 dB SPL. That is, the dominant peak,as well as the group delay, shifts to later times as thestimulus level decreases.
The latencies and non-normalized amplitudes ofthe CR envelopes of Figure 9 are depicted in Figure 10as functions of stimulus level. Only peaks with delaysof up to the maximum of the envelope delay plus 2 msare shown, to reduce clutter in the plot. Severalfeatures are noteworthy. The peaks at a given delay
persist across stimulus level (see left panel), with onlyminor shifts in their timings at the higher stimuluslevels. Superimposed on this panel are the envelopedelay (filled squares) and group delay, τCR (fc04)(filled circles). At L020 dB SPL, the peak with a delayof 5.3 ms (hour-glass symbol) is the dominant peak.From L030 to 50 dB SPL, the peak with a delay of4.2 ms (diamond symbol) is the dominant peak, andat L060 and 70 dB SPL, the peak with a delay of1.3 ms (square symbol) is now the dominant peak.The group delay, like the envelope delay, decreaseswith increasing stimulus level, but assumes differentvalues as explained later.
Another interesting observation is that the ampli-tude of the envelope peaks decrease with increases instimulus level and that the dynamic range of theamplitude of earlier peaks is less than the dynamicrange of the amplitude of later peaks. For example,the amplitude of the peak with a delay of 1.3 ms(square symbol) is −10.3 dB (largest value) at L070 dBand −22.6 dB (smallest value) at L060 dB, a dynamicrange of 12.3 dB. In comparison, peaks with delays of6.8 ms (picnic-table symbol) and 7.3 ms (upward-arrow symbol) have amplitudes with dynamic rangesof 33.3 and 35.8 dB, respectively. In addition to havinga wider dynamic range, the amplitudes of the lateroccurring delay peaks also have a lower thresholdcompared to the earlier occurring delay peaks; that is,low level stimulation produces large amplitude. Theshift in envelope delay with increasing stimulus levelscan also be observed in the right panel. At L020 dBSPL, the peak with a delay of 5.3 ms (hour-glasssymbol) has the largest amplitude. As the stimuluslevel increases (at L030 to 50 dB), the peak with adelay of 4.2 ms (diamond symbol) has the largestamplitude, and at L060 and 70 dB SPL, the peak witha delay of 1.3 ms (square symbol) has the largestamplitude.
An alternative analysis of the level series of the CRenvelopes of Figure 10 is presented in Figure 11A. Foreach level series, responses to the lowest stimulus levelwere normalized to 0 dB. Therefore, for each levelseries, stimulus level increases from the top to thebottom in the figure. The length of the lines indicatesamplitude growth. The following features that wereobserved in Figure 10 are also evident in this figure:(1) persistence of delay peak across level, (2) decreasein amplitude peaks with increasing level, and (3)amplitude peaks with a wider dynamic range for thelater occurring delay peaks.
Figure 11 also extends the level series analysis toeight other subjects. The qualitative analysis is consis-tent across subjects, although individual variability,more especially in the timings of the delay peaks,exists among subjects. The highly individual timingsof the delay peaks and total number of peaks in a
FIG. 7. Mean CR magnitude (CRM) as a function of frequency,CRML (fc), for stimulus levels of 20–70 dB SPL. CRM has a bandpasscharacteristic with energy concentrated between 1 and 2 kHz, at thelower stimulus levels. CRM is larger at lower stimulus levels andsaturates at high stimulus levels.
FIG. 8. CR magnitude as a function of stimulus level, CRML. CRML
for individual subjects (dashed lines with open circles) and mean forthe subjects (solid line with filled squares) are shown. Mean CRML
has slopes of −0.48 dB/dB at low levels (from L=20 to 30 dB SPL),−0.60 dB/dB at intermediate levels (from L=30 to 60 dB SPL) and−0.06 dB/dB at high levels (from L=60 to 70 dB SPL).
600 RASETSHWANE AND NEELY: Cochlear Reflectance in Humans

given time interval makes averaging results acrosssubjects difficult. However, an analysis that averagesthe individual group delays is possible and is used toderive the latency–frequency relation.
Latency–frequency relation
The dependence of latency on frequency and stimu-lus level is evaluated by considering scatter plots ofour estimates of group delay in the dimensionlessquantity NCR [cf. Eq. (8)], at different stimulus levelsin Figure 12. Loess trend lines (Cleveland 1979) arealso shown in the figure (solid lines) to guide the eye.A systematic variation in group delay with frequency
can be visualized. Except for stimulus levels of 60 and70 dB SPL, a breakpoint frequency, fa|b can beobserved. Below this frequency, NCR increases withincreasing frequency and above, NCR is near indepen-dent of frequency. The average value for the breakpoint frequency is fa|b01.5 kHz. This value wasdetermined by finding the intersection of power-lawfits to the steady-state low and high frequency portionsof each latency–frequency curve. The breakpoint, ortransition, frequency has been suggested to representa transition between a high frequency region (f9 fa|b)of more “basal-like” cochlea behavior and a low-frequency region (fG fa|b) of more “apical-like” cochleabehavior (Shera et al. 2010).
FIG. 9. Time-domain CR envelopes at4 kHz and stimulus levels of 20–70 dBSPL for a single subject. The ordinatelabel shows the stimulus level and not theamplitude of the CR envelopes. CR enve-lopes on the right panel are normalized tothe maximum peak for visual clarity. Thedashed vertical lines are the limits NL andNH. Superimposed on both panels are theenvelope delay (filled squares) and groupdelay, τCR (filled circles). Peaks persistacross level, and the amplitudes of thepeaks are largest at the lowest level.
FIG. 10. Latency (left panel) andamplitude (right panel) of peaks shownin Fig. 9, as functions of stimulus level.Superimposed on the left panel are theenvelope delay (filled squares) andgroup delay, τCR (filled circles). Onlypeaks with delays of up to themaximumof the envelope delay plus 2 ms areshown, to reduce clutter in the plot.Delay peaks persist across level. Theamplitude of the peaks decrease withincreasing stimulus level, with lateroccurring peaks having amplitudes witha wider dynamic range compared toearlier occurring peaks.
RASETSHWANE AND NEELY: Cochlear Reflectance in Humans 601

The Loess trend lines for the latency–frequencyfunctions NCR in the different panels of Figure 12,except for L060 and 70 dB SPL, are superimposed inFigure 13. The dependence of latency on stimuluslevel can be observed. For a given frequency, thelatency is shorter at higher stimulus levels comparedto lower levels. The slope of NCR above fa|b, but below8 kHz, is near zero at all stimulus levels and the slopebelow fa|b ranges from 0.42 to 0.74. There is an orderlydecrease in slope below fa|b with increase in level.These slopes, determined via power law fits to the NCR
trend lines, are presented in Table 3. The latencyfunctions of Figure 13 merge below 0.4 kHz wherethere is uncertainty in the latency estimation due areduction in CR energy at low frequencies (cf. Fig. 2).
The latency functions also converge at 16 kHz, whichis probably influenced by the short time intervalbetween the limits NL and NH at high frequencies.An equivalent plot of CR latency in millisecond versusfrequency τCR(fc) is shown in Figure 14.
DISCUSSION
A method has been developed for obtaining CR fromWBN-ECR measurements. CR constitutes mainly thenonlinear component of ECR and is equivalent to ameasure of OAE normalized by the stimulus. Themethod includes two stages: (1) a subtraction proce-dure that removes middle-ear reflectance and (2)
A D G
B E H
C F I
FIG. 11. Level series analysis for nine subjects. Stimulus levelincreases from top to bottom and the length of the lines indicatesamplitude growth. The following observations can be generalized tothe subjects (1) delay peaks persist across level, (2) amplitude of the
peaks decrease with increasing stimulus level (movement from top tobottom), and (3) later occurring peaks have amplitudes with a widerdynamic range than the earlier occurring peaks.
602 RASETSHWANE AND NEELY: Cochlear Reflectance in Humans

time–frequency analysis to remove residual middle-ear reflectance and measurement-system artifact.Analyses were performed to examine the level depen-dence of latencies of individual peaks of time-domainCR and to examine the global dependence of CR onfrequency and level. Use of noise to evoke OAEs has
previously been done by Maat et al. (2000). However,the purpose of their study was to demonstrate thatnoise-evoked OAEs are similar to CEOAEs, and assuch, their noise stimulus was band-limited to 0.8–5 kHz (which is less than the bandwidth of our CRmeasurements) to match the spectrum of a clickstimulus they used to evoke CEOAE. To the authors’knowledge, this is the only other study where noisewas used to evoke OAEs.
In plots of time-domain CR obtaining using thesubtraction procedure (cf. Fig. 1), high frequency-content temporally precedes low-frequency content,which is consistent with signals of cochlea origin.These time-domain CR plots are similar to time-domain plots of CEOAE (e.g., Maat et al. 2000; Avanet al. 2000). Our CR though has a wider bandwidth,
FIG. 12. NCR versus frequency at different stimulus levels. The group delay NCR at each center frequency for all the subjects (dots) are plottedtogether for a given stimulus level, together with Loess trend lines to guide the eye. A breakpoint frequency fa|b can be determined by inspectionof the Loess trend lines.
FIG. 13. Latency–frequency relation at stimulus levels of 20–50 dBSPL. The Loess trend lines for the latency functions NCR at differentstimuli levels are plotted together. Above the breakpoint frequency, fa|b=1.5 kHz, NCR has a near zero slope. The slopes of NCR below andabove fa|b are presented in Table 3. CR delay is longer at low levels,compared to high levels. The latency estimates merge below 0.4 kHz,where there is uncertainty about the estimates.
TABLE 3Slopes of the group delay function NCR below and above the
breakpoint frequency fa|b=1.5 kHz
Stimulus level (dB SPL) Slope below fa|b Slope above fa|b
20 0.74 0.0530 0.65 0.0240 0.55 0.0450 0.42 0.09
The slope of NCR was determine using data only up to 8 kHz. The slope ofNCR above fa|b is near zero. There seems to be an orderly decrease in slopebelow fa|b with increase in level. The slopes were determined via power lawfits to the NCR loess trend curves
RASETSHWANE AND NEELY: Cochlear Reflectance in Humans 603

when compared to CEOAEs measured in humansusing the commonly used nonlinear residual meth-od, which discards the short latency part of theresponse (e.g., Kemp et al. 1986). However, thedouble-evoked CEOAE paradigm described by Keefeet al. (2011) has a similarly wide bandwidth of up to16 kHz. The wide bandwidth of our time-domain CRallows for measurement of CR magnitude andlatency that represent more than 80 % of the lengthof the cochlea (Greenwood 1990).
Gammatone filterbanks were used in the time–frequency analysis to separate CR from residualmiddle-ear reflectance and measurement-system arti-fact. A gammatone filterbank has not been used forOAE analysis in previous studies. Other time–frequen-cy analysis techniques, such as the short-time Fouriertransform and wavelet transform, may also be usedinstead of the gammatone filterbank and will producesimilar results. The gammatone filterbank, like mostother filters, introduces dispersion to the reflectance;however, this effect is small.
The limits NL and NH [cf. Eqs. (3) and (4)] areimportant for separating middle-ear activity fromcochlea activity, and their settings were carefullyselected based on inspection of a large number ofgammatone spectrograms. These limits do not biasthe estimation of latency significantly because aninspection of a large number of gammatone spectro-grams showed that most of the CR is included withinthese limits. The residual activity in the CR beforeapplication of time–frequency is probably due tovariations in time caused by shifts in the position ofthe measurement probe between measurements. Thelimit NL provides a good separation between cochlear
contributions and middle-ear and measurement-sys-tem activity, except maybe at high frequencies (above8 kHz), where there are possible short delay contri-butions from the cochlear base. This ambiguity in theseparation of cochlear reflectance and residual activ-ity may have been responsible for the convergenceobserved in the CR latency estimates at 16 kHz.
The notches in the CRM of Figure 6 are not assharp as notches that have been observed in magni-tude spectra of OAEs and transfer functions of OAEs(e.g., Kalluri and Shera 2007; Norton and Neely 1987;Sisto and Moleti 2008) because our reflectancemagnitude computation method [cf. Eq. (10)]smoothes out the sharpness of the notches, asdemonstrated in Figure 3. However, the smoothedspectrum still reveals the dependence of CRM onstimulus level and frequency and facilitates compari-son of spectra across different stimulus levels. Thesharpness of the notches of CRM can be increasedeither by decreasing the bandwidth of the filters inthe filterbank analysis or using a time–frequencyanalysis method that offers perfect reconstruction,such as wavelets and the short-time Fourier transform.Mean CRM as a function of frequency (cf. Fig. 7) has apeak at 1.1 kHz that has been observed in previousOAE measurements (e.g., Sisto and Moleti 2008). Thispeak is probably the effect of round-trip transmissionthrough the middle ear as was previously demonstrat-ed by Puria (2003) and Sisto and Moleti (2008).
CRM as a function of stimulus level has a constantslope of −0.6 dB/dB for intermediate levels andsaturates at high levels (cf. Fig. 8). Gorga et al.(2011) observed a slope of about −0.6 dB/dB in theirestimation of cochlear-amplifier gain using tip-to-taildifferences of DPOAE suppression tuning curves. Thissimilarity suggests that CRM decreases with increasein level because the cochlear-amplifier gain decreases.CRM saturates at the higher stimulus levels andbecomes independent of stimulus level because atthese levels the cochlear-amplifier is not as active(e.g., Kemp 2002; Harte et al. 2009). The acousticreflex, which causes impedance mismatch in themiddle ear and decreases the transmission of energyto the cochlea, may also be responsible for thereduction in CRM at the higher levels. At low levels,the slope of the CRM becomes shallower (−0.48 dB/dB),suggesting onset of cochlear linearity. Additional meas-urements at levels below 20 dB SPL are required todetermine the low-level linear range of CR.
The level-series analysis of time-domain compo-nents of CR (cf. Figs. 9, 10 and 11) revealed that (1)delay peaks persist across level with timings un-changed, (2) amplitude of the peaks decrease withincreasing stimulus level, and (3) later occurringpeaks have amplitudes with a wider dynamic rangethan earlier occurring peaks. The persistence of the
FIG. 14. Comparison of cochlear reflectance delay in milliseconds(solid lines) to tone-burst ABR forward latency (dashed lines) atstimulus levels of 20–60 dB SPL. The decrease in CR latency perdecibel increase in level is similar to that of ABR forward latencybetween 2 and 8 kHz.
604 RASETSHWANE AND NEELY: Cochlear Reflectance in Humans
timings of the peaks can also be noted in Figure 1.Our last two observations may seem to contradictthose of Stover et al. (1996) and Goodman et al.(2011). In their temporal analysis of DPOAE, Stover etal. (1996) noted that the amplitudes of early occur-ring peaks had a wider dynamic range than those oflater occurring peaks and that amplitude of peaksgrow with stimulus level. Goodman et al. (2011) madesimilar observations in their time-domain analysis ofTEOAE. However, CR is a form of an otoacousticemission that is normalized by the stimulus. When thisis taken into consideration, our observations areconsistent with these earlier observations. We believethat the multiple delay peaks do not signify multiplesources of OAE generation along the BM, but are dueto interference and re-reflections of delayed signalscoming back from various points along the BM.
In the level-series analysis and in general, the groupdelay is different from the envelope delay because thegroup delay represents a weighted average delay of allthe peaks, not just the dominant peak. However, at thelower stimulus levels where the amplitude of thedominant peak is much greater than the amplitude ofthe other peaks, the group delay and envelope delay aresimilar. The similarities of the results of our level seriesanalysis to previous results indicate that our measure-ments are indeed of cochlear origin.
Our measurements of CR can be considered as asuperposition of multiple SFOAE measurements thathave been normalized by the stimulus. In terms of thetwo OAE generator mechanisms, CR can then beconsidered to be due to linear coherent reflection.However, an important difference between the CRand SFOAE exists. SFOAE is typically measured usinga pure tone at a single frequency, which, at lowstimulus levels, excites a spatially limited region of thecochlea. On the other hand, the wideband stimulusused to measure CR simultaneously excites an exten-sive region of the cochlea, perhaps the entire cochlea,at the same time. This brings up possibilities forintermodulation products generated by interactionbetween different frequency components of thestimulus, as was observed by Yates and Withnell(1999) for TEOAEs. Although this complicates thecomparison of our measurements to current measuresof OAE, the advantage of using a wideband noisestimulus is that it allows for the invocation of the EQ-NL theorem (de Boer 1997), which simplifies theinterpretation of CR. The EQ-NL theorem allows thenonlinear mechanics of the cochlea to be replaced byan equivalent linear system for each stimulus level.Linear systems are easier to analyze than nonlinearsystems because most analysis tools (e.g., transferfunction, Fourier analysis) assume linearity.
The dependence of CR latency on frequency andlevel is consistent with earlier estimates of OAE and
auditory brainstem response (ABR) latency (e.g.,Neely et al. 1988; Harte et al. 2009). A comparisonof CR latency to tone-burst ABR forward latency ofNeely and Gorga (1998) is shown in Figure 14. Thedecrease in ABR forward latency per decibel increasein level is 1.62 %, at all levels and frequencies. In thecurrent measurements, CR latency between 2 and8 kHz and for level below 50 dB SPL decreases by amean value of 1.65 % per dB increase in level, givingfurther support to our measurements being ofcochlear origin. However, the fact that CR latency isnot proportional to twice the ABR forward latency(except at approximately 1 kHz) brings into questionthe prevailing interpretation of OAE latency as beingtwice the travel time of a particular frequencycomponent from stimulus onset through the cochleato its characteristic place. Another distinct feature ofABR latencies is that they do not have any apparent“breakpoint frequency” as has been observed for CRand other OAE latencies. We do not yet have clearanswers to these questions.
The observed breakpoint in the latency (cf. Fig. 12)is also consistent with earlier studies of OAEs inhumans and other mammals (Shera and Guinan2003; Shera et al. 2010; Schairer et al. 2006; Bergevinet al. 2008; Dhar et al. 2011). Our breakpointfrequency of 1.5 kHz agrees exactly with recentestimates by Dhar et al. (2011) and Abdala and Dhar(2012) using DPOAE. Although there are differencein the breakpoint frequencies compared by the otherinvestigators, the breakpoint frequencies all occursnear the mid-point of the cochlea (Shera et al. 2010).In the current study, the observed breakpoint of1.5 kHz maps to a distance of 1.8 cm from the stapesaccording to the Greenwood frequency–place map(Greenwood 1990), which is the midpoint since atypical length of a human cochlea is about 3.5 cm.The breakpoint, or transition, frequency has beensuggested to represent a transition between a high-frequency region (f9fa|b) of more “basal-like” cochleabehavior and a low-frequency region (fGfa|b) of more“apical-like” cochlea behavior (Shera et al. 2010). Forfrequencies above the breakpoint fa|b, the slope of thelatency–frequency function NCR is near zero, suggest-ing that the cochlea has scaling symmetry (Shera et al.2000). However, scaling symmetry may still hold belowthe breakpoint frequency, despite a non-zero slope inthe delay if the reflection occurred at a basal tail of acochlear travelling wave with a scaling-symmetricexcitation pattern (Choi et al. 2008).
The slopes of the latency–frequency function belowthe breakpoint frequency decreases with increasingstimulus level (cf. Fig. 13 and Table 3). This decline inlatency slope with increasing level was also noted bySisto and Moleti (2007) for TEOAEs. However, it ispossible that the merging of the latency functions
RASETSHWANE AND NEELY: Cochlear Reflectance in Humans 605

below 0.4 kHz may have influenced the observeddecline in latency slope, and perhaps, the slopes atthe different levels are actually similar.
CONCLUSION
CR measured in this study has features that arecharacteristic of signals of cochlear origin. The CRmeasurements offer three advantages over other typesof otoacoustic emissions: (1) wider bandwidth, (2)minimal influence from the measurement system andmiddle-ear on the recorded emission, and (3) easierinterpretation due to the existence of an equivalentlinear model, which validates the application of linear-systems theory. CR provides an innovative and poten-tially informative means for assessing cochlear pro-cessing, compared to other noninvasive examinationsof the human cochlea.
ACKNOWLEDGMENTS
This research was supported by grants from NIH (grantsnos. R01 DC8318 and P30 DC4662). We would like to thankCori Birkholz, Alyson Gruhlke, and Judy Kopun for theirhelp in recruiting subjects and making measurements. Wewould like to thank Jonathan H. Siegel for providing us withthe sound-delivery equipment. Finally, we thank JoyceRodriquez, Michael P. Gorga, Christopher A. Shera, andthree anonymous reviewers for helpful suggestions onearlier versions of this manuscript.
Open Access
This article is distributed under the terms of theCreative Commons Attribution License which permitsany use, distribution, and reproduction in any medi-um, provided the original author(s) and the sourceare credited.
REFERENCES
ABDALA C, DHAR S (2012) Maturation and aging of the humancochlea: a view through the DPOAE looking glass. J Assoc ResOtolaryngol 13:403-421
ALLEN JB (1986) Measurement of eardrum acoustic impedance. In:ALLEN JB, HALL JL, HUBBARD A, NEELY ST, TUBIS A (eds) Peripheralauditory mechanisms. Springer, New York
ALLEN JB (1997) Derecruitment by multiband compression inhearing aids. In: JESTEADT W (ed) Modeling sensorineuralhearing loss. Lawrence Erlbaum Associates, Mahwah, pp 99–112
AMERICAN NATIONAL STANDARDS INSTITUTE (1996) Specifications foraudiometers. ANSI S3.6-1996, New York
AVAN P, WIT HP, GUITTON H, MOM T, BONFILS P (2000) On thespectral periodicity of transient-evoked otoacoustic emissionsfrom normal and damaged cochleas. J Acoust Soc Am 108:1117–1127
BERGEVIN C, FREEMAN DM, SAUNDERS JC, SHERA CA (2008) Otoacousticemissions in humans, birds, lizards, and frogs: evidence formultiple generation mechanisms. J Comp Physiol A 194:665–683
CHOI YS, LEE SY, PARHAM K, NEELY ST, KIM DO (2008) Stimulus-frequency otoacoustic emission: measurements in humans andsimulations with an active cochlear model. J Acoust Soc Am123:2651–2669
CLAERBOUT J (1985) Imaging the Earth’s interior. Blackwell Scientif-ic, Palo Alto, pp 287–289
CLEVELAND WS (1979) Robust locally weighted regression andsmoothing scatterplots. J Am Stat Assoc 74:829–836
DE BOER E (1997) Connecting frequency selectivity and nonlinearityfor models of the cochlea. Audit Neurosci 3:377–388
DHAR S, ROGERS A, ABDALA C (2011) Breaking away: violation ofdistortion emission phase-frequency invariance at low frequen-cies. J Acoust Soc Am 129:3115–3122
GOLDSTEIN JL, BAER T, KIANG NYS (1971) A theoretical treatment oflatency, group delay, and tuning characteristics of auditory-nerveresponses to clicks and tones. In: SACHS MB (ed) Physiology ofthe auditory system. National Educational Consultants, Balti-more, pp 133–141
GOODMAN SS, MERTES IB, SCHEPERLE RA (2011) Delay and growth rateof multiple TEOAE components. In: SHERA CA, OLSON E (ed)What fire is in mine ears: progress in auditory biomechanics. AmInst Phys, New York, pp 279–284
GORGA MP, NEELY ST, KOPUN J, TAN H (2011) Distortion-productotoacoustic emission suppression tuning curves in humans. JAcoust Soc Am 129:817–827
GREENWOOD DD (1990) A cochlear frequency-position function forseveral species—29 years later. J Acoust Soc Am 87:2592–2605
HÄRMÄ A (1999) Derivation of the complex-valued gammatone filters.http://www.acoustics.hut.fi/software/HUTear/Gammatone/Complex_gt.html. Accessed 2 Apr 2012
HARTE JM, PIGASSE G, DAU T (2009) Comparison of cochlear delayestimates using otoacoustic emissions and auditory brainstemresponses. J Acoust Soc Am 126:1291–1301
HOHMANN V (2002) Frequency analysis and synthesis using agammatone filterbank. Acustica 88:433–442
JEPSEN ML, EWERT SD, DAU T (2008) A computational model ofhuman auditory signal processing and perception. J Acoust SocAm 124:422–438
KALLURI R, SHERA CA (2007) Near equivalence of human click-evoked and stimulus-frequency otoacoustic emissions. J AcoustSoc Am 121:2097–2110
KEEFE DH, SCHAIRER KS (2011) Specification of absorbed-soundpower in the ear canal: application to suppression of stimulusfrequency otoacoustic emissions. J Acoust Soc Am 129:779–791
KEEFE DH, LING R, BULEN RC (1992) Method to measure acousticimpedance and reflection coefficient. J Acoust Soc Am 91:470–485
KEEFE DH, GOODMAN SS, ELLISON JC, FITZPATRICK DF, GORGA MP(2011) Detecting high-frequency hearing loss with click-evokedotoacoustic emissions. J Acoust Soc Am 129:245–261
KEMP DT (2002) Exploring cochlear status with otoacoustic emis-sions, the potential for new applications. In: ROBINETTE MS,GLATTKE TJ (eds) Otoacoustic emissions: clinical applications,2nd edn. Thieme Medical, New York, pp 1–47
KEMP DT, BRAY P, ALEXANDER L, BROWN AM (1986) Acousticemission cochleography—practical aspects. Scand AudiolSuppl 25:71–95
MAAT B, WIT HP, VAN DIJK P (2000) Noise-evoked otoacousticemissions in humans. J Acoust Soc Am 108:2272–2280
MEDDIS R, O’MARD LP, LOPEZ-POVEDA EA (2001) A computationalalgorithm for computing nonlinear auditory frequency selectiv-ity. J Acoust Soc Am 109:2852–2861
NEELY ST, GORGA MP (1998) Comparison between intensity andpressure as measures of sound level in the ear canal. J AcoustSoc Am 104:2925–2934
606 RASETSHWANE AND NEELY: Cochlear Reflectance in Humans
NEELY ST, LIU Z (1994) EMAV: otoacoustic emission average.Technical Memo No. 17. Boys Town National Research Hospital,Omaha
NEELY ST, NORTON S, GORGA MP, JESTEADT W (1988) Latency ofauditory brain-stem responses and otoacoustic emissions usingtone-burst stimuli. J Acoust Soc Am 83:652–656
NORTON SJ, NEELY ST (1987) Tone-burst-evoked otoacousticemissions from normal-hearing subjects. J Acoust Soc Am81:1860–1872
PATTERSON RD, HOLDSWORTH J (1996) A functional model of neuralactivity patterns and auditory images. In: AINSWORTH AW (ed)Advances in speech, hearing and language processing. JAI,London, pp 547–563
PURIA S (2003) Measurements of human middle ear forward andreverse acoustics: Implications for otoacoustic emissions. JAcoust Soc Am 113:2773–2789
RASETSHWANE DM, NEELY ST (2011) Inverse solution of ear-canalarea function from reflectance. J Acoust Soc Am 130:3873–3881
RHODE WS, ROBLES L (1974) Evidence from Mössbauer experimentsfor nonlinear vibration in the cochlea. J Acoust Soc Am 55:588–596
ROSOWSKI JJ, NAKAJIMA HH, HAMADE MA, MAHFOUD L, MERCHANT GR,HALPIN CF, MERCHANT SN (2012) Ear-canal reflectance, umbovelocity, and tympanometry in normal-hearing adults. Ear Hear33:19–34
SCHAIRER KS, ELLISON JC, FITZPATRICK D, KEEFE DH (2006) Use ofstimulus-frequency otoacoustic emission latency and level toinvestigate cochlear mechanics in humans. J Acoust Soc Am120:901–914
SCHEPERLE RA, GOODMAN SS, NEELY ST (2011) Further assessment offorward pressure level for in situ calibration. J Acoust Soc Am130:3882–3892
SHERA CA, GUINAN JJ (1999) Evoked otoacoustic emissions arise bytwo fundamentally different mechanisms: a taxonomy formammalian OAEs. J Acoust Soc Am 105:782–798
SHERA CA, GUINAN JJ (2003) Stimulus-frequency-emission groupdelay: a test of coherent reflection filtering and a window oncochlear tuning. J Acoust Soc Am 113:2762–2772
SHERA CA, TALMADGE CL, TUBIS A (2000) Interrelations amongdistortion-product phase-gradient delays: their connection toscaling symmetry and its breaking. J Acoust Soc Am 108:2933–2948
SHERA CA, TUBIS A, TALMADGE CL (2005) Coherent reflection in atwo-dimensional cochlea: short-wave versus long-wave scatteringin the generation of reflection-source otoacoustic emissions. JAcoust Soc Am 118:287–313
SHERA CA, TUBIS A, TALMADGE CL (2008) Testing coherent reflectionin chinchilla: auditory-nerve responses predict stimulus-frequen-cy emissions. J Acoust Soc Am 124:381–395
SHERA CA, GUINAN JJ, OXENHAM AJ (2010) Otoacoustic estimation ofcochlear tuning: validation in the chinchilla. J Assoc ResOtolaryngol 11:343–365
SIEGEL JH (1994) Ear-canal standing waves and high-frequencysound calibration using otoacoustic emission probes. J AcoustSoc Am 95:2589–2597
SIEGEL JH, CERKA AJ, RECIO-SPINOSO A, TEMCHIN AN, VAN DIJK P,RUGGERO MA (2005) Delays of stimulus-frequency otoacousticemissions and cochlear vibrations contradict the theory ofcoherent reflection filtering. J Acoust Soc Am 118:2434–2443
SISTO R, MOLETI A (2007) Transient evoked otoacoustic emissionlatency and cochlear tuning at different stimulus levels. J AcoustSoc Am 122:2183–2190
SISTO R, MOLETI A (2008) Transient evoked otoacoustic emissioninput/output function and the cochlear reflectivity: experimentand model. J Acoust Soc Am 124:2995–3008
STOVER LJ, NEELY ST, GORGA MP (1996) Latency of multiple sources ofdistortion product otoacoustic emissions. J Acoust Soc Am99:1016–1024
VOSS SE, ALLEN JB (1994) Measurement of acoustic impedance andreflectance in the human ear canal. J Acoust Soc Am 95:372–384
YATES GK, WITHNELL RH (1999) The role of intermodulation distortionin transient-evoked otoacoustic emissions. Hear Res 136:49–64
RASETSHWANE AND NEELY: Cochlear Reflectance in Humans 607