Embed Size (px)
Citation preview

7/27/2019 Jason-2 Satellite History
http://slidepdf.com/reader/full/jason-2-satellite-history 1/20
s c i e n c e
w r i t e r s ’ g u i d e
Ocean Surface Topography Mission/Jason-2
National Aeronautics and Space Administration
May 2008
7/27/2019 Jason-2 Satellite History
http://slidepdf.com/reader/full/jason-2-satellite-history 2/20
CONTACT INFORMATION & MEDIA RESOURCES
Please call the Public Aairs Oces at NASA, NOAA, CNES or EUMESAbeore contacting individual scientists at these organizations.
NASA Jet Propulsion Laboratory Alan Buis, 818-354-0474, [email protected]
NASA HeadquartersSteve Cole, 202-358-0918, [email protected]
NASA Kennedy Space Center George Diller, 321-867-2468, [email protected]
NOAA Environmental Satellite, Data and Inormation Service John Leslie, 301-713-2087, x174, [email protected]
CNESEliane Moreaux, 011-33-5-61-27-33-44, [email protected]
EUMESAClaudia Ritsert-Clark, 011-49-6151-807-609, [email protected]
NASA Web siteshttp://www.nasa.gov/ostmhttp://sealevel.jpl.nasa.gov/mission/ostm.html
NOAA Web sitehttp://www.osd.noaa.gov/ostm/index.htm
CNES Web sitehttp://www.aviso.oceanobs.com/en/missions/uture-missions/jason-2/index.html
EUMESA Web sitehttp://www.eumetsat.int/Home/Main/What_We_Do/Satellites/Jason/index.htm?l=en
Alan BuisGretchen Cook-Anderson
Kathryn HansenRosemary Sullivant
SCIENCE WRITERS’ GUIDE
OSTM/Jason-2
WRITERS
7/27/2019 Jason-2 Satellite History
http://slidepdf.com/reader/full/jason-2-satellite-history 3/20
Cover image credit: EUMETSAT
TABLE OF CONTENTS
Science Overview............................................................................
Instruments....................................................................................
Feature Stories
New Mission Helps Oshore Industries Dodge
Swirling Waters ..................................................................
NASA Mission to Be Crystal Ball Into Oceans’
Future, Mirror to the Past ..................................................
NASA Mission to Answer Lingering Questions
From Deep Blue Sea ..........................................................
Ocean Surace a Boon or Extreme Event
Forecasts, Warnings............................................................
NASA Mission Poised to Help Us Gauge Our
Rising Seas .........................................................................
OSM/Jason-2 Spokespersons.......................................................
Ocean Surace opography Science eam Members .......................
2
3
4
6
8
10
12
14
16
SCIENCE WRITERS’ GUIDE
OSTM/Jason-2
7/27/2019 Jason-2 Satellite History
http://slidepdf.com/reader/full/jason-2-satellite-history 4/20
SCIENCE WRITERS’ GUIDE
OSTM/Jason-2
2
Te Ocean Surace opography Mission (OSM)/Jason-2 isan international satellite mission that will extend into the nextdecade the continuous climate record o sea surace heightmeasurements begun in 1992 by the joint NASA/CentreNational d’Etudes Spatiales (CNES) opex/Poseidon missionand continued in 2001 by the NASA/CNES Jason-1 mission.Tis multi-decadal record has already helped scientists study global sea level rise and better understand how ocean circula-tion and climate change are related.
Developed and proven through the joint eorts o NASA andCNES, high-precision ocean altimetry measures the distancebetween a satellite and the ocean surace to within a ew
centimeters. Accurate observations o variations in sea suraceheight—also known as ocean topography—provide scientists
with inormation about the speed and direction o ocean cur-rents and heat stored in the ocean. Tis inormation, in turn,reveals global climate variations.
With OSM/Jason-2, ocean altimetry has come o age. Temission will serve as a bridge to transition collection o thesemeasurements to the world’s weather and climate orecasting agencies, which will use them or short- and seasonal-to-long-range weather and climate orecasting.
Sea level rise is one o the most important consequences and
indicators o global climate change. From opex/Poseidonand Jason-1 we know mean sea level has risen by about threemillimeters (0.12 inches) a year since 1993. Tis is abouttwice the estimates rom tide gauges or the previous century,indicating a possible recent acceleration. OSM/Jason-2 willurther monitor this trend and allow us to better understandyear-to-year variations.
Te speedup o ice melting in Greenland and Antarctica isa wild card in predicting uture sea level rise. Measurementsrom Jason-1 and OSM/Jason-2, coupled with inorma-tion rom NASA’s Gravity Recovery and Climate Experiment(Grace) mission, will provide crucial inormation on the rela-
tive contributions o glacier melting and ocean heating to sea level change.
Earth’s oceans are a thermostat or our planet, keeping it romheating up quickly. More than 80 percent o the heat romglobal warming over the past 50 years has been absorbed by the oceans. Scientists want to know how much more heat theoceans can absorb, and how the warmer water aects Earth’satmosphere. OSM/Jason-2 will help them better calculatethe oceans’ ability to store heat.
Te mission will also allow us to better understand large-scaleclimate phenomena like El Niño and La Niña, which canhave wide-reaching eects.
OSM/Jason-2 data will be used in applications as diverse as,or example, routing ships, improving the saety and eciency o oshore industry operations, managing sheries, orecast-ing hurricanes and monitoring river and lake levels.
OSM/Jason-2’s primary payload includes ve instrumentssimilar to those aboard Jason-1, along with three experimentalinstruments. Its main instrument is an altimeter that precisely measures the distance rom the satellite to the ocean surace.
Its radiometer measures the amount o water vapor in theatmosphere, which can distort the altimeter measurements.Tree location systems combine to measure the satellite’sprecise position in orbit. Instrument advances since Jason-1
will allow scientists to monitor the ocean in coastal regions with increased accuracy, almost 50 percent closer to coastlinesthat are home to nearly hal o Earth’s population than beore.OSM/Jason-2 is designed to last at least three years.
Ater its launch rom Caliornia’s Vandenberg Air Force Baseaboard a United Launch Alliance Delta II rocket, OSM/
Jason-2 will be placed in the same orbit (1,336 kilometers) as Jason-1 at an inclination o 66 degrees to the equator. It will
repeat its ground track every 10 days, covering 95 percent o the world’s ice-ree oceans. A tandem mission with Jason-1
will urther improve tide models in coastal and shallow seasand help scientists better understand the dynamics o oceancurrents and eddies.
OSM/Jason-2 is a collaboration between NASA; the Na-tional Oceanic and Atmospheric Administration (NOAA);CNES; and the European Organisation or the Exploitationo Meteorological Satellites (EUMESA). CNES is provid-ing the spacecrat, NASA and CNES are jointly providing thepayload instruments and NASA’s Launch Services Program atthe Kennedy Space Center is responsible or Delta II launch
management and countdown operations. Ater completing the on-orbit commissioning o the spacecrat, CNES willhand over its operation and control to NOAA. NOAA andEUMESA will generate the near-real-time products anddistribute them to users. NASA’s Jet Propulsion Laboratory,Pasadena, Cali., manages the mission or NASA’s ScienceMission Directorate in Washington.
SCIENCE OVERVIEW
7/27/2019 Jason-2 Satellite History
http://slidepdf.com/reader/full/jason-2-satellite-history 5/20
SCIENCE WRITERS’ GUIDE
OSTM/Jason-2
3
INSTRUMENTS
PRIMARY INSTRUMENTS:
• Te Poseidon-3 radar altimeter , provided by CentreNational d’Etudes Spatiales (CNES), is the mission’s maininstrument. It accurately measures the distance betweenthe satellite and the mean sea surace. Derived rom thePoseidon-2 altimeter on Jason-1, it emits pulses at two re-quencies (13.6 and 5.3 gigahertz) to the ocean surace andanalyzes very precisely the time it takes or the signals
to return.
• Te Advanced Microwave Radiometer (AMR), provided by NASA, is an advanced version o the microwave radiometerthat few on Jason-1. It measures radiation rom Earth’s sur-ace at three requencies (18, 21 and 37 gigahertz) to deter-mine the amount o water vapor present in the atmosphere.Tis water vapor aects the accuracy o altimeter measure-ments by delaying the time it takes or the altimeter’s signalsto make their round trip to the ocean surace and back.
• Te Doppler Orbitography and Radio-positioning Inte-grated by Satellite (DORIS), provided by CNES, deter-mines the satellite’s precise position in orbit to within a ew centimeters, inormation that is critical in interpreting altimetry data. It works by receiving signals in two requen-cies rom a ground network o 60 beacons all over the globe.Te relative motion o the satellite generates a shit in signalrequency, called the Doppler shit, which is measured todetermine the satellite’s velocity and position.
• Te Global Positioning System Payload (GPSP), providedby NASA, is a tracking system that enhances DORIS mea-surements by using triangulated data rom the U.S. GlobalPositioning System constellation o navigation satellites to
determine the satellite’s precise position in orbit. It is nearly identical to the urbo Rogue Space Receiver on Jason-1. Itsdata are used to continuously track the satellite’s trajectory.
• Te Laser Retroreector Array (LRA), provided by NASA,is an array o mirrors that allow the satellite to be tracked
with centimeter accuracy by 40 satellite laser ranging sta-tions on the ground. By analyzing the round-trip time o the laser beam, the satellite’s precise position in orbit can bedetermined. It is an exact copy o the LRA on Jason-1.
PASSENGER INSTRUMENTS:
• Te Environment Characterization and Modelisation-2(Carmen-2) instrument , provided by CNES, will study theeects o radiation in the satellite’s environment on ad-vanced components.
• Te ime ranser by Laser Link (2L2) instrument ,provided by CNES, will use a laser link to compare andsynchronize remote ground clocks with high accuracy.
• Te Light Particle elescope (LP), provided by Japan, willstudy radiation in the satellite’s environment.
In addition to their own scientic objectives, these passengerinstruments are expected to improve the perormanceo DORIS.
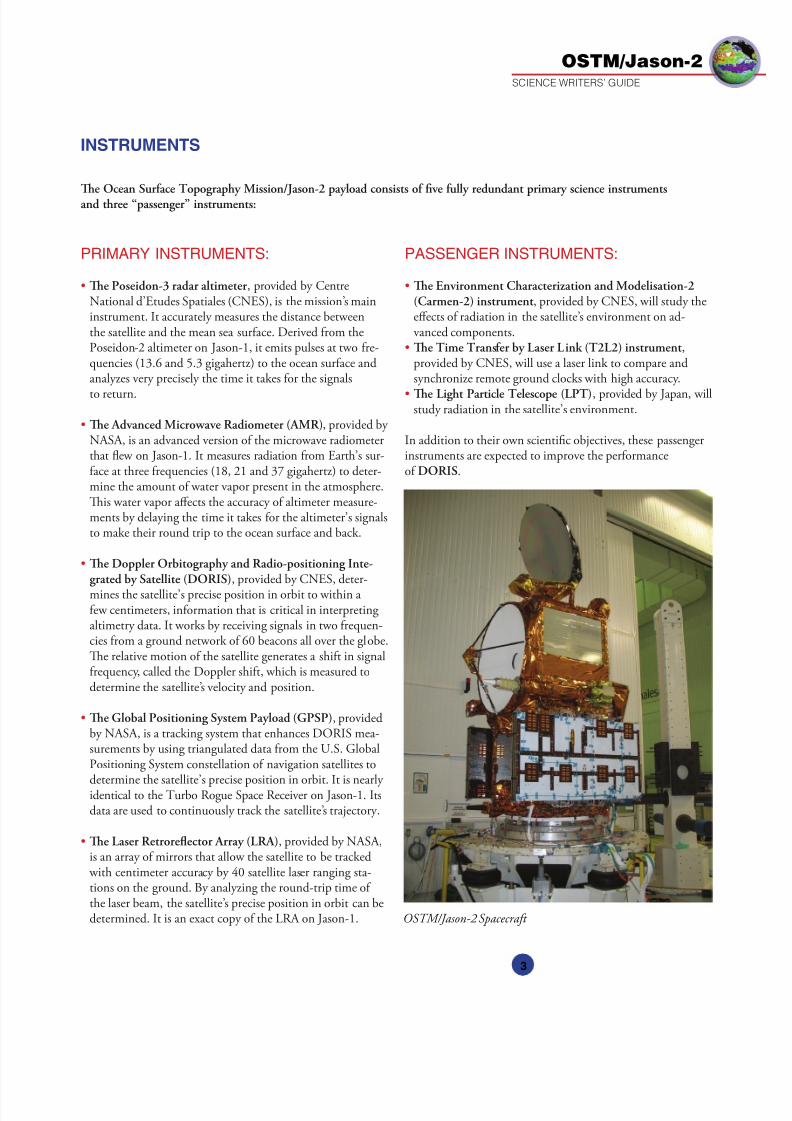
Te Ocean Surace opography Mission/Jason-2 payload consists o fve ully redundant primary science instrumentsand three “passenger” instruments:
OSM/Jason-2 Spacecrat

7/27/2019 Jason-2 Satellite History
http://slidepdf.com/reader/full/jason-2-satellite-history 6/20
SCIENCE WRITERS’ GUIDE
OSTM/Jason-2
4
NEW MISSION HELPS OFFSHORE INDUS-TRIES DODGE SWIRLING WATERS
Hurricanes aren’t the only hazards spinning up in the Gul o Mexico—they have a liquid counterpart in the waters below called ocean eddies. Oshore industries, such as oil and gascompanies, have to keep a weather eye on both. In a worst-case scenario, they could nd themselves caught between thetwo. Satellite altimetry is helping government and industry manage those risks.
Satellite ocean observations are a standard part o marineoperations around the world. Keeping track o local currents
is critical or daily operations. And in the Gul o Mexico,that means knowing the location o the Loop Current and itsdangerous eddies.
Part o the Gul Stream, the Loop Current begins as a largefow o warm water rom the Caribbean. It heads up intothe eastern part o the Gul o Mexico, then turns south andnally moves out through the Straits o Florida. Deep and astmoving, the Loop Current oten breaks o and orms strong,clockwise rotating eddies called anticyclones that travel west-
ward into the Gul. Te currents along the outer edges o theLoop Current, as well as these eddies, have been clocked at
speeds as high as three to our knots (three to ve miles perhour), comparable to the astest ocean currents ever observed.
Because the Loop Current and its eddies are warmer, andthus higher in surace elevation, than the surrounding waters,they are easily spotted by satellite altimeters, such as thoseaboard Jason-1 and the Ocean Surace opography Mis-sion/Jason-2. o see what the altimeters see, many oshoreoperators turn to Research Proessor Robert Leben and hiscolleagues at the University o Colorado’s Center or Astro-dynamics Research in Boulder. Tey use the latest satellitemeasurements o sea surace height rom Jason-1 and twoother satellite altimeters to create maps showing the location,
direction and speed o currents in the Gul o Mexico. Freeand available on the center’s Web site, these maps are used by a wide variety o people involved in marine operations, along
with scientists, shermen and sailors. As soon as measure-ments rom the Ocean Surace opography Mission/Jason-2are available, they will be included in the data sets as well.
For oil companies, knowing where the Loop Current andits eddies are and are likely to go is critical. “Te rate to renta drilling rig in deep water is about $300,000 a day,” saidGeorge Forristall, o Forristall Ocean Engineering, Inc.,Camden, Maine. “I you’ve planned an operation and the
FEATURE STORIES
An artist depicts the OSM/Jason-2 satellite. Credit: NASA
7/27/2019 Jason-2 Satellite History
http://slidepdf.com/reader/full/jason-2-satellite-history 7/20
SCIENCE WRITERS’ GUIDE
OSTM/Jason-2
5
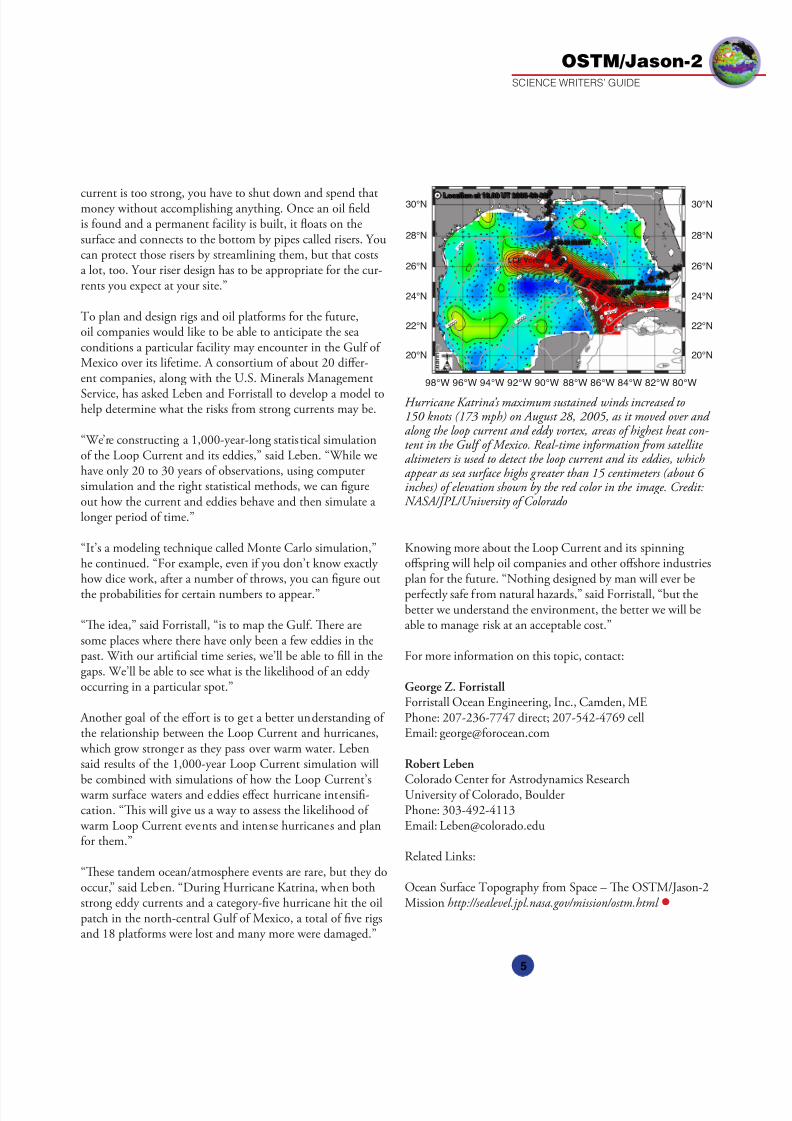
Hurricane Katrina’s maximum sustained winds increased to150 knots (173 mph) on August 28, 2005, as it moved over and along the loop current and eddy vortex, areas o highest heat con-tent in the Gul o Mexico. Real-time inormation rom satellite altimeters is used to detect the loop current and its eddies, whichappear as sea surace highs greater than 15 centimeters (about 6 inches) o elevation shown by the red color in the image. Credit:NASA/JPL/University o Colorado
98°W 96°W 94°W 92°W 90°W 88°W 86°W 84°W 82°W 80°W
20°N 20°N
22°N 22°N
24°N 24°N
26°N 26°N
28°N 28°N
30°N 30°N
- 2 0
- 2 0
- 2 0
- 1 0
- 1 0
- 1 0
- 1 0
0
0
00
1 0
1 0
2 0
2 0
30
3 0
4 0
4 0
5 0 6 0
2 0 0
2 0 0
2 0 0
2 0 0
2 0 0
2 0 0 0
2 0 0 0
2 0 0 0
2 0 0 0
2 0 0 0
08-27 03.00UT
08-28 03.00UT
08-29 03.00UT
1 0 4
1 1 0
1 1 5
1 1 5 1 1
5 1 1 5 1 1
5 1 4
4 1 4 4 1 6
1 1 7 3
1 7 5 1 6
7 1 6 0 1 6
1
1 5 0
1 3 5
1 2 7
1 0 5
8 8 1
7 0 7 5
7 5
9 8
Location at 18.00 UT 2005-08-28
Loop Current
LCE Vortex
current is too strong, you have to shut down and spend thatmoney without accomplishing anything. Once an oil eldis ound and a permanent acility is built, it foats on thesurace and connects to the bottom by pipes called risers. Youcan protect those risers by streamlining them, but that costsa lot, too. Your riser design has to be appropriate or the cur-rents you expect at your site.”
o plan and design rigs and oil platorms or the uture,oil companies would like to be able to anticipate the sea conditions a particular acility may encounter in the Gul o Mexico over its lietime. A consortium o about 20 dier-ent companies, along with the U.S. Minerals Management
Service, has asked Leben and Forristall to develop a model tohelp determine what the risks rom strong currents may be.
“We’re constructing a 1,000-year-long statistical simulationo the Loop Current and its eddies,” said Leben. “While wehave only 20 to 30 years o observations, using computersimulation and the right statistical methods, we can gureout how the current and eddies behave and then simulate a longer period o time.”
“It’s a modeling technique called Monte Carlo simulation,”he continued. “For example, even i you don’t know exactly how dice work, ater a number o throws, you can gure outthe probabilities or certain numbers to appear.”
“Te idea,” said Forristall, “is to map the Gul. Tere aresome places where there have only been a ew eddies in thepast. With our articial time series, we’ll be able to ll in thegaps. We’ll be able to see what is the likelihood o an eddy occurring in a particular spot.”
Another goal o the eort is to get a better understanding o the relationship between the Loop Current and hurricanes,
which grow stronger as they pass over warm water. Lebensaid results o the 1,000-year Loop Current simulation will
be combined with simulations o how the Loop Current’s warm surace waters and eddies eect hurricane intensi-cation. “Tis will give us a way to assess the likelihood o
warm Loop Current events and intense hurricanes and planor them.”
“Tese tandem ocean/atmosphere events are rare, but they dooccur,” said Leben. “During Hurricane Katrina, when bothstrong eddy currents and a category-ve hurricane hit the oilpatch in the north-central Gul o Mexico, a total o ve rigsand 18 platorms were lost and many more were damaged.”
Knowing more about the Loop Current and its spinning ospring will help oil companies and other oshore industriesplan or the uture. “Nothing designed by man will ever beperectly sae rom natural hazards,” said Forristall, “but thebetter we understand the environment, the better we will beable to manage risk at an acceptable cost.”
For more inormation on this topic, contact:
George Z. ForristallForristall Ocean Engineering, Inc., Camden, MEPhone: 207-236-7747 direct; 207-542-4769 cellEmail: [email protected]
Robert Leben
Colorado Center or Astrodynamics ResearchUniversity o Colorado, BoulderPhone: 303-492-4113Email: [email protected]
Related Links:
Ocean Surace opography rom Space – Te OSM/Jason-2Mission http://sealevel.jpl.nasa.gov/mission/ostm.html •
7/27/2019 Jason-2 Satellite History
http://slidepdf.com/reader/full/jason-2-satellite-history 8/20
SCIENCE WRITERS’ GUIDE
OSTM/Jason-2
6
FEATURE STORIES
NASA MISSION TO BE CRYSTAL BALLINTO OCEANS’ FUTURE, MIRROR TOTHE PAST
Imagine the lives that could be saved rom fash foods anddrought, the millions o dollars in uel costs that could beavoided or shing vessels, and the homes that could be sparedrom the eects o coastline erosion i only scientists couldmore accurately predict the dynamics o Earth’s oten unpre-dictable oceans. Armed with increasingly more accurate ore-casts, weather services in countries across the globe are improv-ing time-sensitive warnings o cyclones, fooding and high sea
winds, as well as inormation about when it’s sae to scuba dive,
sail, or sh 48 kilometers (30 miles) or more beyond coastlines.
NASA and several other international organizations have joined orces to launch into space a sort o “crystal ball” to givescientists an extended satellite data record. Te data can be usedto improve ocean orecasting and to test the accuracy o climateand weather models using knowledge o past ocean conditions.
Te Ocean Surace opography Mission/Jason-2 is made upo next-generation, state-o-the-art, satellite-based instrumentsthat will provide a global view o Earth’s sea surace height every 10 days. Scientists will use these data to create complex simula-
tions o what ocean currents, tides and eddies may do. Simi-larly, the data will also allow scientists to “hindcast”—that is, totest how accurate the simulations o past ocean orecasts were.
“o borrow rom an old saying, ‘it’s the motion o the ocean’that is o most interest to us as scientists, and our ability to ore-cast it and learn lessons rom it,” said one o the mission’s scienceteam members, Robert Leben, an associate research proessor atthe University o Colorado in Boulder. “Te urther we can look into the past with the record o ocean measurements, the better
we can predict uture events. Tat is to say, i one day we canlook back at a 20- or 30-year data record, we can more accurate-ly say what will happen in the next 10 or 15 years because we
will have a data record that indicates trends or correlations thatlead to specic or expected outcomes. OSM/Jason-2 is going to add to knowledge we’ve gained rom the opex/Poseidon and
Jason-1 missions and put us closer to this goal.”
o create the simulations, also called models, that predict oceanbehavior, scientists combine inormation about actors such as
wind speed, wave height, sea level pressure, temperature and airpressure with data gathered by satellite altimeters that measurethe height o the oceans’ surace (more commonly known as sea level). Radar altimeters, like those on OSM/Jason-2, measuresea level by sending a radar pulse to the sea surace and clocking the time it takes or the signal to refect back. All these data areed into a computer program, allowing scientists to see into theuture or to gain urther insight rom simulations o the past
when hindcasting.
OSM/Jason-2 is slated to orbit Earth and collect this importantdata set or at least three to ve years. It will provide scientists
with signicantly more data to test their models, and extend therecord o inormation available about ocean circulation and how the ocean aects global climate. During the mission’s lietime,scientists hope to add to what they currently understand about
weather phenomena like El Niño and La Niña. During an ElNiño, the eastern Pacic Ocean temperatures near the equator
are warmer than normal, while during La Niña the same watersare colder than normal. Tese fuctuations in the Pacic Oceantemperatures can wreak havoc on climate conditions around thePacic and beyond, leading to increased rainall or drought.
“A longer period o data rom the OSM/Jason-2 mission cantell scientists more about how El Niño and La Niña are couplednot only to seasonal or yearly changes but to decade-to-decadeoscillations o the Pacic Ocean,” said Leben. “Owing to data rom the mission’s orerunner opex/Poseidon and Jason-1 mis-sions, scientists have already determined that decadal fuctuations
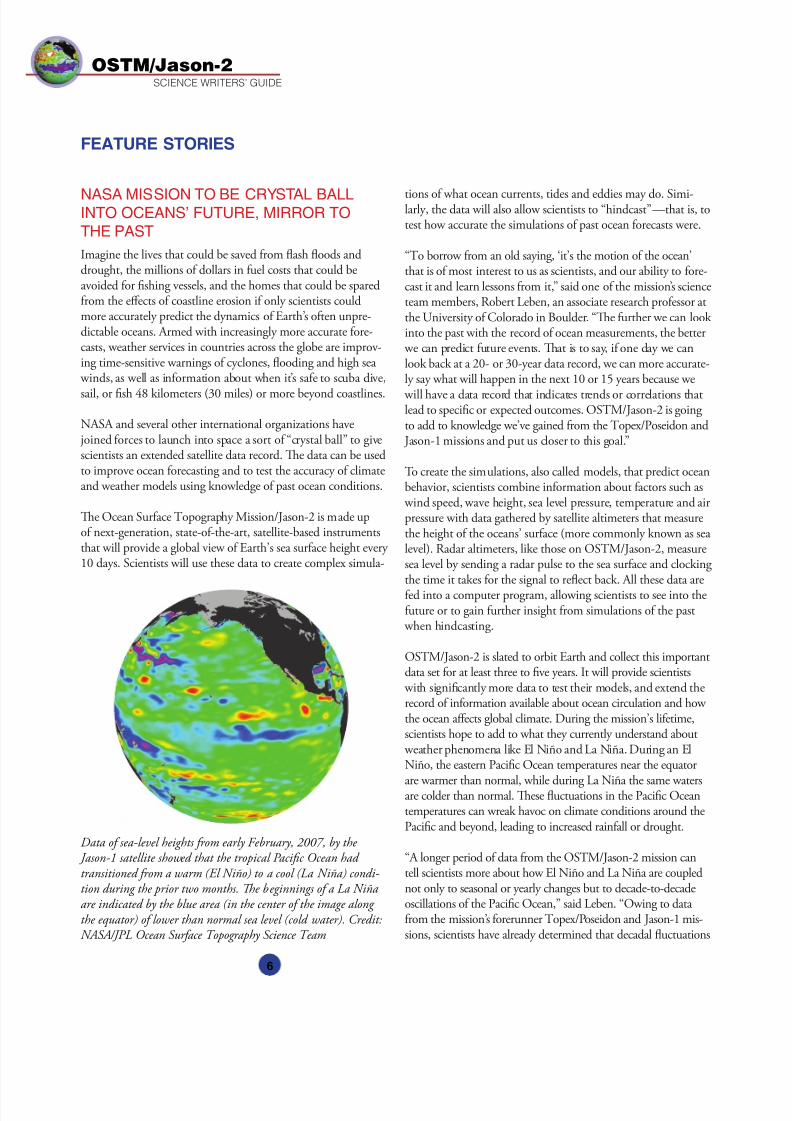
Data o sea-level heights rom early February, 2007, by the Jason-1 satellite showed that the tropical Pacifc Ocean had transitioned rom a warm (El Niño) to a cool (La Niña) condi-tion during the prior two months. Te beginnings o a La Niña are indicated by the blue area (in the center o the image along the equator) o lower than normal sea level (cold water). Credit:NASA/JPL Ocean Surace opography Science eam

7/27/2019 Jason-2 Satellite History
http://slidepdf.com/reader/full/jason-2-satellite-history 9/20
SCIENCE WRITERS’ GUIDE
OSTM/Jason-2
7
in the Pacic enhance the requency and intensity o shorter-termocean events such as El Niño and La Niña. Just think o whatmore we’ll learn as we collect uture data rom OSM/Jason-2.”
Knowing more about the oceans’ behavior, including what ElNiño and La Niña climate conditions may bring, will improveour quality o lie and benet industry. “For example, orecasts o ocean currents can predict the oceans’ salt balance, which can beused to study the global water cycle,” said science team member
Yi Chao, a satellite oceanographer at NASA’s Jet PropulsionLaboratory in Pasadena, Cali. “Water evaporates rom the oceansurace, and water rom rivers and land-runo cycle back into theocean, so more precise orecasts o these movements will boostour knowledge o and ability to manage our most precious natural
resource. Tis mission can help us determine the role o oceancirculation in completing the global water cycle.”
“On the commercial ront, oshore industries such as oil and gasexploration and production require accurate inormation aboutocean circulation to minimize the impacts rom strong currentsand eddies,” said Leben. (see “New Mission Helps OshoreIndustries Dodge Swirling Water,” page 4). “Search and rescue o-cials, marine operators, recreational boaters, and marine animalresearchers all benet rom increasingly more accessible nearreal-time data.”
Sea level associated with Hurricane Rita in the Gul o Mexicoduring September 2005, based on altimeter data rom our satel-lites including NASA’s opex/Poseidon and Jason-1. Red indicates a strong circulation o much warmer waters, which can eed energy to a hurricane. Te red area stands 35 to 60 centimeters (about 13 to 23 inches) higher than the surrounding waters.Te path o the hurricane is indicated by the black line. Credit:NASA/JPL/University o Colorado
98°W 96°W 94°W 92°W 90°W 88°W 86°W 84°W 82°W
20°N
22°N
24°N
26°N
28°N
30°N
32°N
20°N
22°N
24°N
26°N
28°N
30°N
32°N
“Te opex/Poseidon and Jason-1 missions got us o to a greatstart,” said Chao. “When the two missions operated together intandem, they doubled the coverage area and sharpness o the reso-lution o the sea level data so that we could ‘see’ more detail. Tishigher resolution is critical or extending the global sea level data into coastal zones, which o course are regions o great societalimportance. OSM/Jason-2 will provide another opportunity ora tandem mission with Jason-1.”
Leben pointed out that with this new mission, the ocus movesrom research objectives to practical ways to apply the data thatbenet society in tangible and essential ways.
For more inormation on this topic, contact:
Yi Chao NASA Jet Propulsion Laboratory, Pasadena, Cali.Phone: 818-354-8168Email: [email protected]
Gregg JacobsNaval Research Laboratory, Stennis Space Center, Miss.Phone: 228-688-4720Email: [email protected]
Robert LebenColorado Center or Astrodynamics ResearchUniversity o Colorado, BoulderPhone: 303-492-4113Email: [email protected]
Pierre Yves Le raonFrench Research Institute or Exploitation o the Sea Phone: 011-33-2-98-22-43-16Email: [email protected]
Related Links:
Ocean Surace opography rom Space – El Niño andLa Niña http://sealevel.jpl.nasa.gov/science/el-nino.html
Ocean Surace opography rom Space – Te OSM- Jason-2 Missionhttp://sealevel.jpl.nasa.gov/mission/ostm.html
NASA Satellites and Computer Models Contribute to OceanForecasting Systemhttp://www.nasa.gov/missions/earth/oceans3d.html •

7/27/2019 Jason-2 Satellite History
http://slidepdf.com/reader/full/jason-2-satellite-history 10/20
SCIENCE WRITERS’ GUIDE
OSTM/Jason-2
8
FEATURE STORIES
ter supply. Te Ocean Surace opography Mission/Jason-2is poised to help scientists answer these and other criticalscientic questions about ocean phenomena.
Te mission, OSM/Jason-2 or short, is set to oer a sea change in what we know about some o the prevailing
weather and climate patterns driven by changes in oceanictides and currents.
With opex/Poseidon and Jason-1, NASA has measured theheight o the ocean surace—more commonly known as sea level—with an accuracy o better than 2.5 centimeters (oneinch) rom an orbiting altitude o 1,336 kilometers (830
miles). Tis is comparable to measuring the thickness o a sheet o paper on the ground rom the altitude o a commer-cial airliner. Sea level varies greatly over the world’s oceans andis not a constant. Scientists want to learn more about how itsfuctuations are related to ocean circulation, climate change,marine weather, fooding, drought, hurricane intensity and
NASA MISSION TO ANSWER LINGERINGQUESTIONS FROM DEEP BLUE SEA
Ocean tides and currents across the globe still hold within their watery grasp the key to unanswered questions about our planet.
Scientists hope a new ollow-on mission to the Jason-1 andopex/Poseidon satellite missions, equipped with the latesthigh-tech instruments, will bring them closer to answering broad undamental questions: How does ocean circulationvary rom season to season, rom year to year and rom decadeto decade? How much can the ocean change rom natural andhuman-induced causes? In what ways does the ocean impact
human activities?
Te answers are essential when we consider that oceans cover70 percent o Earth’s surace. Teir contents eed billions o humans and animals alike, support whole industries, and arethe source o the rain and snow that eed the world’s reshwa-
Altimeter data rom satellites in space are applied in practical ways to beneft society. Credit: NASA
60°N
55°N
50°N160°E
Ocean-current data help shipcaptains determine routes
Wave height information is essential for safesailing in hazardous environments
-20 -16 -12 -8 -4 0
Sea-Surface Height Deviations from Average (centimeters)Data produced by Colorado Center for Astrodynamics Research
4 8 12 16 20
170°E 180°E 170°W
Bering Sea and Gulf of Alaska Sea-Surface Height Map of the Type Used by Marine Industry(Data obtained from the Topex/Poseidon and European Remote Sensing [ERS-2] Satellites)
160°W 150°W 140°W 130°W
p h o t o c r e d i t : I n d i v i d u o
p h o t o c r e d i t : N O A A
p h o t o c r e d i t : N O A A
7/27/2019 Jason-2 Satellite History
http://slidepdf.com/reader/full/jason-2-satellite-history 11/20
SCIENCE WRITERS’ GUIDE
OSTM/Jason-2
9
coastline erosion. Te more scientists learn about oceansurace topography, as they will with OSM/Jason-2, thebetter they can apply that knowledge to answer the remain-ing mysteries o the oceans.
Scientists know that Earth’s climate system has experiencedchanges throughout its history. A record o ocean surace to-pography observations refecting some o those changes existsor the last 15 years, thanks to opex/Poseidon and Jason-1.However, this period accounts or relatively ew moments inthe planet’s long history.
“Te scientic community desperately needs much longer
measurement records to begin to understand year-to-year anddecade-to-decade changes in the ocean system,” said OSM/
Jason-2 science team member Carl Wunsch, a proessor atthe Massachusetts Institute o echnology in Cambridge,Mass. “O course, ultimately, our descendants will need tounderstand century-to-century and longer variability.” Scientists expect the mission’s altimeters to oer addedinsight into ocean surace topography when combined withthe accomplishments o the previous two missions. Mean sea level is an indicator o the amount o heat contained in a col-umn o water rom the ocean surace to the ocean foor. Tat
heat is like the driver o a huge underwater truck that aectsocean currents as it goes. With the longer-term measure-ments to be captured by OSM/Jason-2, scientists will bemore in-tune with where the “driver” is going and why, how it interacts with other orces like wind and rain, and whatmay happen in the wake o changes in its route.
“OSM/Jason-2 will provide a unique data history o sea level rise that will allow us to answer questions about theeects o global warming,” said OSM/Jason-2 scienceteam member Dudley Chelton o Oregon State University in Corvalis, Ore. “Tis mission will also provide insight intothe reason why most o the climate models underestimate
the rate o sea level rise. Tis may be an indication thatthese models are underestimating other symptoms o global
warming as well.”
Less than our percent o ocean waters remain unaectedby humans. Trough shipping, shing, sewage and ertilizerrun-o, pollution, oil spills, and auto and actory emissions,human activities are changing the chemistry o our oceans.Some o that human-induced change is combined with natu-ral events that can also impact ocean temperatures, salinity,acidity and air pressure to infuence sea surace height.
Just as humans aect oceans, oceans and related sea level like- wise aect humans. Changes in sea level, like the incrementalrises reported in recent years, can cause erosion o populatedcoastal areas, reshwater shortages, and disruption o the salt-
water balance that can aect the seaood that eeds people allover the world.
With more thorough oresight into ocean circulation, speci-cally surace ocean currents, the shing industry can reduceuel costs by mapping more ecient sailing routes that con-sider the direction and speed o the oceans’ course. Cheltonbelieves that OSM/Jason-2 will also lead to improved under-standing o oceanic eddies and unexpected movements o jet-
like ocean currents. “Tere is substantial evidence that theseeddies play important roles in the fuctuation o the oceans’heat, momentum and various water properties,” he said.
“Without this next generation o altimeters, there’s almost nohope o ever understanding what is going on and what couldhappen,” said Wunsch. “Tis new ocean surace topography mis-sion is precisely what is needed as a next step in telling the oceans’story. With the technology this mission aords us and the inor-mation we can gain rom it, we can take more action to enhancequality o lie and protect the bodies o water that sustain us.”
For more inormation on this topic, contact:
Dudley CheltonOregon State University Phone: 541-737-4017Email: [email protected]
Carl WunschMassachusetts Institute o echnology Phone: 617-253-5937Email: [email protected]
Related Links:
Ocean Surace opography rom Space – Te OSM- Jason-2 Missionhttp://sealevel.jpl.nasa.gov/mission/ostm.html
Ocean Surace opography rom Space – opex/Poseidon Missionhttp://sealevel.jpl.nasa.gov/mission/topex.html
Jason Monitors Increasing Ocean Levelshttp://www.nasa.gov/missions/earth/jason_1.html •
7/27/2019 Jason-2 Satellite History
http://slidepdf.com/reader/full/jason-2-satellite-history 12/20
SCIENCE WRITERS’ GUIDE
OSTM/Jason-2
10
FEATURE STORIES
OCEAN SURFACE A BOON FOR EX-TREME EVENT FORECASTS, WARNINGS
For humans in the path o destructive hurricanes and tsuna-mis, an accurate warning o the pending event is critical ordamage control and survival. Such warnings, however, requirea solid base o scientic observations, and a new satellite isready or the job.
Te Ocean Surace opography Mission (OSM)/Jason-2adds to the number o eyes in the sky measuring sea suraceand wave heights across Earth’s oceans. Te increased coverage
will help researchers improve current models or practical use
in predicting hurricane intensity, while providing valuable data that can be used to improve tsunami warning models.
“When it comes to predicting hurricane intensity, the curve inthe last 40 years has been somewhat fat, with little advance inhow to reduce error in predicted intensity,” said Gustavo Goni,o the National Oceanic and Atmospheric Administration(NOAA) in Miami. Maps o sea surace height created romsatellites, however, could help change the curve.
Satellites that measure sea surace height have been running operationally nonstop since November 1992. But more thanone is needed to fy at the same time in order to identiy all theeatures that could be responsible or intensication o tropicalcyclones all over Earth. Te OSM/Jason-2 mission will helpmake the additional coverage possible.
NASA, university and NOAA investigators, including Goni, work to transorm sea surace height inormation obtainedrom satellites, such as OSM/Jason-2, into maps o oceanheat content. Te maps can be used to help orecasters in theirmodels to predict how hurricanes will strengthen.
Determining heat content rom sea surace height is possiblebecause warm water is less dense and hence sits higher than
cooler water. In some regions, such as inside and outside theGul Stream current, the temperature dierences result in morethan a one-meter (three-oot) dierence in sea surace height.Goni and colleagues use this established concept to estimaterom sea level variations how much heat is stored in the upperocean in areas where hurricanes typically develop and intensiy.
While sea surace height may not necessarily be the most sig-nicant parameter or hurricane intensity orecasts, researchers
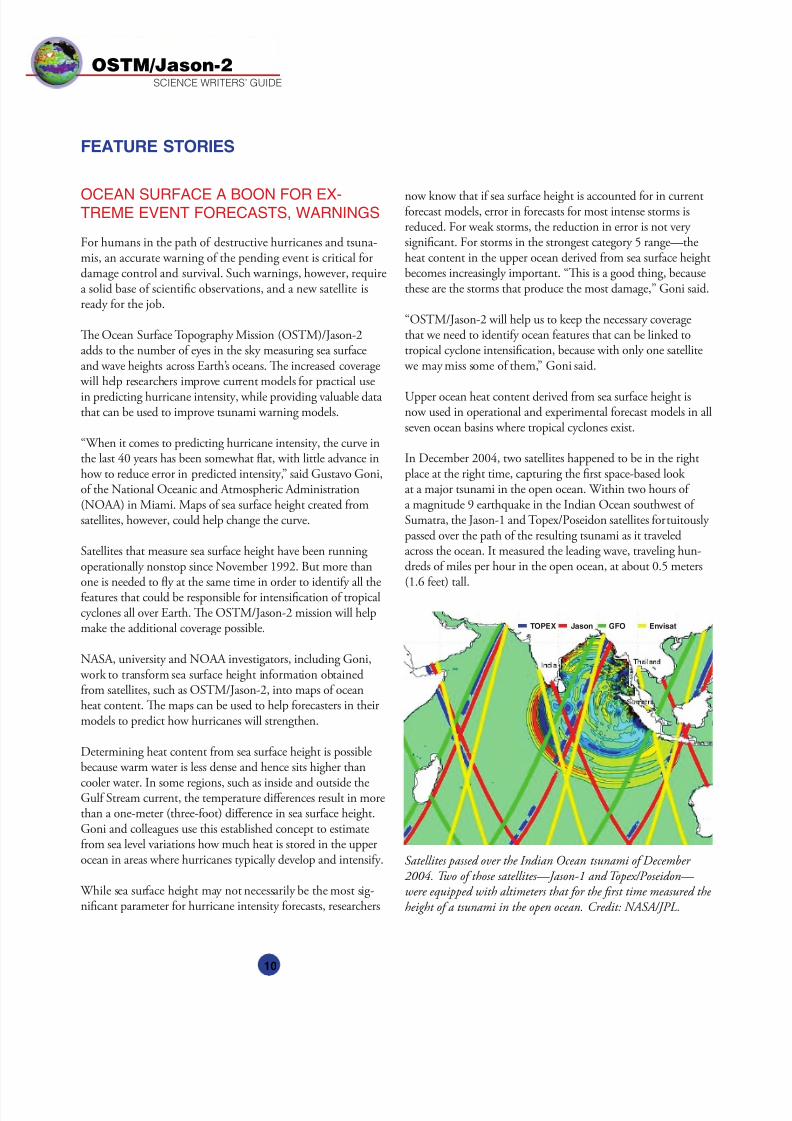
Satellites passed over the Indian Ocean tsunami o December 2004. wo o those satellites—Jason-1 and opex/Poseidon— were equipped with altimeters that or the frst time measured the height o a tsunami in the open ocean. Credit: NASA/JPL.
now know that i sea surace height is accounted or in currentorecast models, error in orecasts or most intense storms isreduced. For weak storms, the reduction in error is not very signicant. For storms in the strongest category 5 range—theheat content in the upper ocean derived rom sea surace heightbecomes increasingly important. “Tis is a good thing, becausethese are the storms that produce the most damage,” Goni said.
“OSM/Jason-2 will help us to keep the necessary coveragethat we need to identiy ocean eatures that can be linked totropical cyclone intensication, because with only one satellite
we may miss some o them,” Goni said.
Upper ocean heat content derived rom sea surace height isnow used in operational and experimental orecast models in allseven ocean basins where tropical cyclones exist.
In December 2004, two satellites happened to be in the rightplace at the right time, capturing the rst space-based look at a major tsunami in the open ocean. Within two hours o a magnitude 9 earthquake in the Indian Ocean southwest o Sumatra, the Jason-1 and opex/Poseidon satellites ortuitously passed over the path o the resulting tsunami as it traveledacross the ocean. It measured the leading wave, traveling hun-dreds o miles per hour in the open ocean, at about 0.5 meters(1.6 eet) tall.
TOPEX Jason GFO Envisat
7/27/2019 Jason-2 Satellite History
http://slidepdf.com/reader/full/jason-2-satellite-history 13/20
SCIENCE WRITERS’ GUIDE
OSTM/Jason-2
11
Wave height measurements like those o the Indian Oceantsunami do not provide an early warning because the inorma-tion is not relayed to ground stations in real time. Tat’s the jobo early warning systems operated by NOAA and other globalorganizations that currently employ a network o open-oceanbuoys and coastal tide gauges. Sea surace height measurementso tsunamis can, however, help scientists test and improveground-based models used or early warning. One such systemdeveloped at NASA’s Jet Propulsion Laboratory (JPL), Pasa-dena, Cali., and undergoing tests at NOAA’s Pacic sunami
Warning Center, Ewa Beach, Hawaii, could become opera-tional within about three years.
Most tsunamis are caused by undersea earthquakes. Using the JPL-developed system, when seismometers rst identiy and lo-cate a large earthquake, scientists can use GPS measurements tosearch around the earthquake’s source to see i land has shited,potentially spurring a tsunami. Scientists can then immediately compile the earthquake’s size, location, and land movementinto a computer program that generates a model tsunami todetermine the risk o a dangerous wave. Ater the wave passes,scientists can search through wave height data rom satellitesand veriy what the model predicted.
“Satellite data play the crucial role o veriying tsunamimodels by testing real tsunami events,” said JPL researchscientist ony Song. “I an earthquake generates a tsunami,does the satellite data match observations on the ground andmodel predictions?”
“One o the unique pieces o satellite observations is the large-scale perspective,” said JPL research scientist Philip Callahan.sunamis can have waves more than 161 kilometers (100miles) long. Such a wave would likely go unnoticed by anobserver in a boat on the ocean’s surace. But satellite altimeterslike OSM/Jason-2 can see this very long wave and measure itsheight to an accuracy o about 2.5 centimeters (one inch).
Scientists’ ability to test tsunami warning models will be aidedby the launch o OSM/Jason-2. With the opex/Poseidonmission now ended, the currently orbiting Jason-1 will soonbe joined and eventually replaced by OSM/Jason-2. Tis willhelp ensure that uture tsunamis will also be observed by satel-lites as well as by buoys and tide gauges.
“Te biggest value in satellite measurements o sea suraceheight is not in direct warning capability, but in improving models so when an earthquake is detected, you can make reli-able predictions and reduce damage to property and people,”Callahan said.
For more inormation on hurricane and tsunami research using satellite altimetry, contact:
ony Song NASA Jet Propulsion Laboratory Phone: 818-393-4876Email: [email protected]
Philip CallahanNASA Jet Propulsion Laboratory Phone: 818-354-4753Email: [email protected]
Gustavo GoniNational Oceanic and Atmospheric AdministrationPhone: 305-361-4339Email: [email protected]
Related Links:
NASA sunami Research Makes Waves in Science Community http://www.nasa.gov/topics/earth/eatures/tsunami-20080117.html
NASA/French Satellite Data Reveal New Details o sunamihttp://www.nasa.gov/centers/jpl/news/jason-011105.html
Ocean Surace opography rom Space – Te OSM- Jason-2 Missionhttp://sealevel.jpl.nasa.gov/mission/ostm.html
Ocean Surace opography rom Space – opex/Poseidon Mission
http://sealevel.jpl.nasa.gov/mission/topex.html •
7/27/2019 Jason-2 Satellite History
http://slidepdf.com/reader/full/jason-2-satellite-history 14/20
SCIENCE WRITERS’ GUIDE
OSTM/Jason-2
12
FEATURE STORIES
NASA MISSION POISED TO HELP USGAUGE OUR RISING SEAS
In economics, there’s a metaphor that says “a rising tide lits allboats,” meaning overall improvement in the economy benetseveryone. While that’s a good thing in economics, when it comesto our oceans, rising seas are a growing problem or all o us.
Global sea level has risen 20 centimeters (eight inches) in thepast 100 years, and the rate o rise is predicted to accelerate asEarth warms. One obvious threat is inundation, loss o landto rising water. Melting ice rom Greenland and Antarctica could raise sea level more than one meter (three eet) over
the next century. Other consequences are more complex, butequally problematic—a warmer ocean can uel more intensestorms; environmental changes can adversely aect ocean lie,such as coral rees and sheries; and alterations in ocean cur-rents can trigger radical changes in Earth’s climate.
Te best hope or anticipating the uture is to understandthe past and present. For global sea level, the rst step hasbeen to measure it accurately, a challenge in itsel. Recordso global sea level in the past come rom averaging tidegauge readings rom many locations. But since the launcho the ocean altimeter opex/Poseidon in 1992, ollowed by
Jason-1 in 2001, scientists have had a precise measuremento the height o the global ocean every 10 days. Now theOcean Surace opography Mission/Jason-2 will continuethis critical task.
“Without this data record, we would have no basis orevaluating change,” said the new mission’s project scientist,Lee-Lueng Fu, o NASA’s Jet Propulsion Laboratory (JPL),Pasadena, Cali. He compares the global sea level recordstarted by opex/Poseidon to the continuous measurementso atmospheric carbon dioxide begun in the 1950s at theMauna Loa Observatory in Hawaii. “Te Mauna Loa data proved that carbon dioxide levels were indeed rising as had
been predicted, and they were the basis or our understanding o the greenhouse eect,” Fu said. “Te height o the oceanis another undamental measurement o our climate. Te key is to have rigorous, well-calibrated data collected over a long period o time.”
Satellite altimeter measurements o sea surace height domuch more than document and quantiy change. Tey’re a
primary tool or understanding how the change is occurring and what the results or the planet may be.
“Sea level is showing the proound consequences o global warming,” said Fu. “More than 80 percent o the heat romglobal warming has been absorbed by the ocean with therest o it warming the atmosphere, land and melting ice.”
Warming water and melting ice are the two major actors thatcontribute to global sea level rise. Warm water expands andtakes up more space than cold water. Melting glaciers and icesheets add resh water to the ocean, increasing its volume. “opredict what is going to happen in the uture, you have to beable to separate the dierent contributors,” Fu said.
Satellite altimetry is one o three key ocean-observing systemsbeing used in combination to identiy the individual sources
o sea level change. Te other two are the gravity-sensing twinGravity Recovery and Climate Experiment (Grace) satellitesand a global array o Argo foats operated by the NationalOceanic and Atmospheric Administration, commonly knownas NOAA.
“Te altimeter measures the total sea level, which includesany changes due to heating or cooling, water coming in or
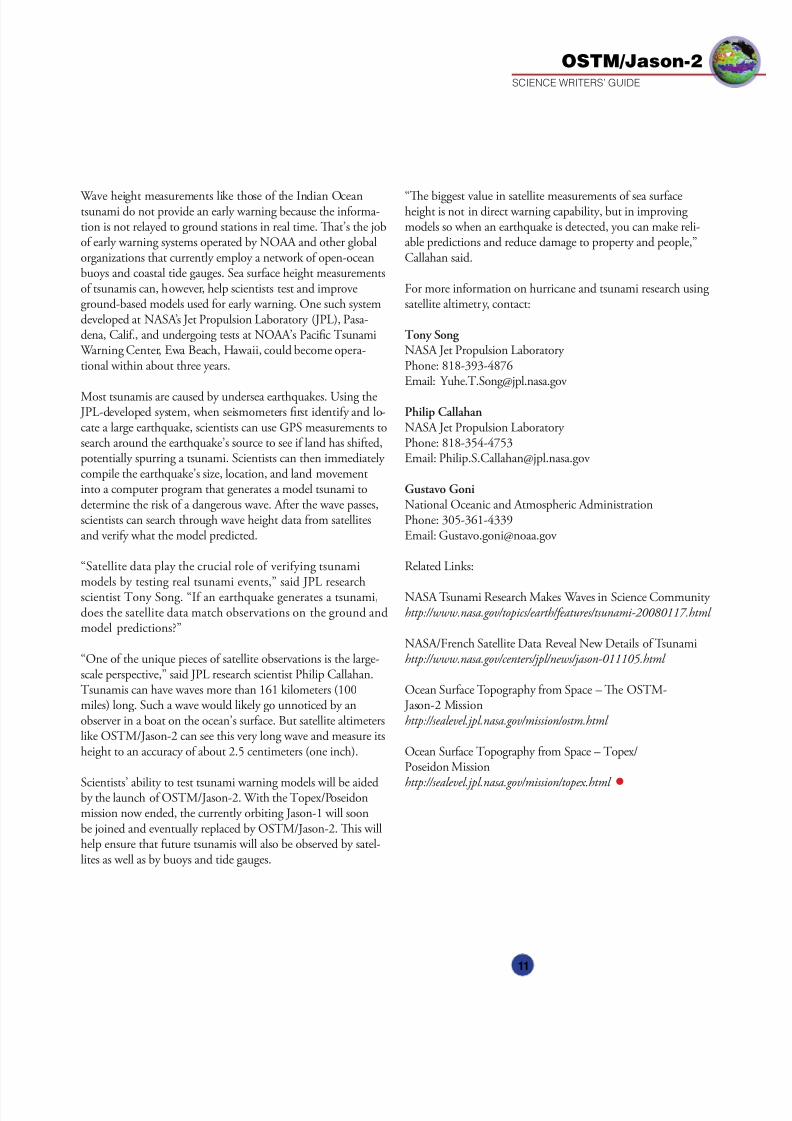
Global sea level has risen about 3 millimeters (0.1 inch) a year since opex/Poseidon (on the let) began its precise measurement o sea surace height in 1993 and was ollowed by Jason-1 in 2001. In this graph, the vertical scale represents globally averaged sea level. Seasonal variations in sea level have been removed toshow the underlying trend. Credit: University o Colorado
1993 1995 1997 1999 2002 2004 2006 2008
0
20
30
40
50
10
-10
7/27/2019 Jason-2 Satellite History
http://slidepdf.com/reader/full/jason-2-satellite-history 15/20
SCIENCE WRITERS’ GUIDE
OSTM/Jason-2
13
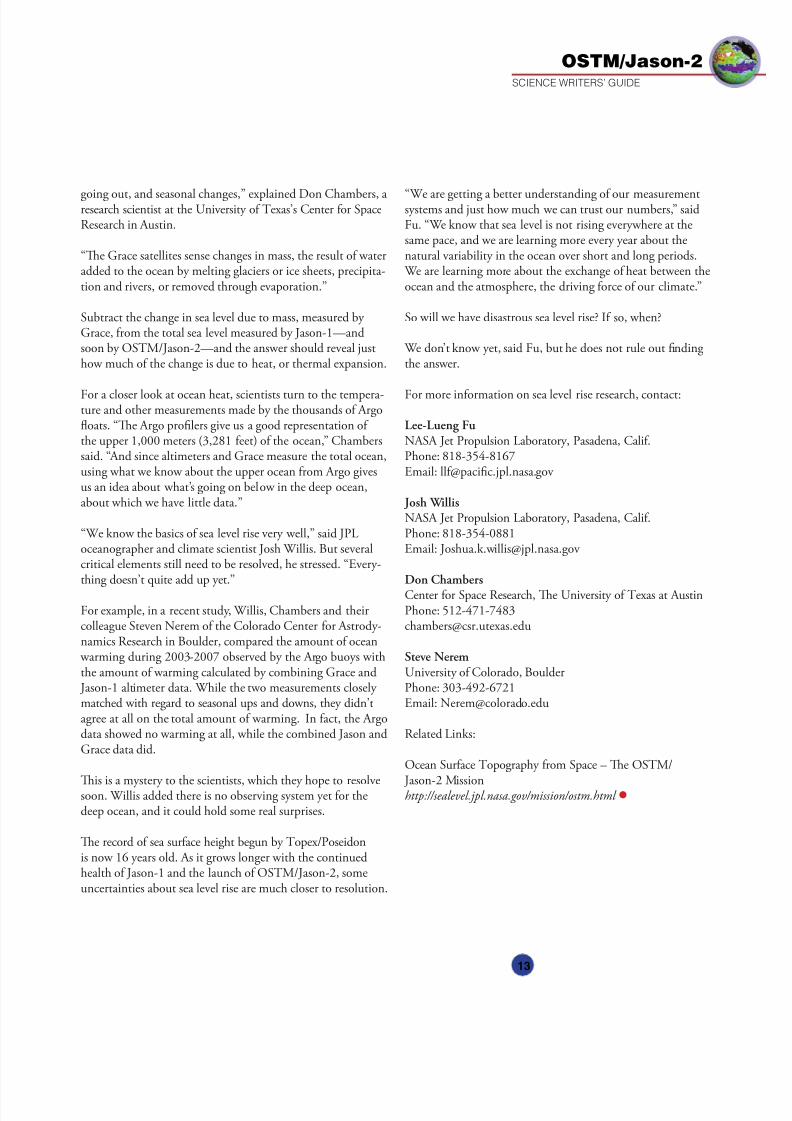
going out, and seasonal changes,” explained Don Chambers, a research scientist at the University o exas’s Center or SpaceResearch in Austin.
“Te Grace satellites sense changes in mass, the result o wateradded to the ocean by melting glaciers or ice sheets, precipita-tion and rivers, or removed through evaporation.”
Subtract the change in sea level due to mass, measured by Grace, rom the total sea level measured by Jason-1—andsoon by OSM/Jason-2—and the answer should reveal justhow much o the change is due to heat, or thermal expansion.
For a closer look at ocean heat, scientists turn to the tempera-ture and other measurements made by the thousands o Argofoats. “Te Argo prolers give us a good representation o the upper 1,000 meters (3,281 eet) o the ocean,” Chamberssaid. “And since altimeters and Grace measure the total ocean,using what we know about the upper ocean rom Argo givesus an idea about what’s going on below in the deep ocean,about which we have little data.”
“We know the basics o sea level rise very well,” said JPLoceanographer and climate scientist Josh Willis. But severalcritical elements still need to be resolved, he stressed. “Every-thing doesn’t quite add up yet.”
For example, in a recent study, Willis, Chambers and theircolleague Steven Nerem o the Colorado Center or Astrody-namics Research in Boulder, compared the amount o ocean
warming during 2003-2007 observed by the Argo buoys withthe amount o warming calculated by combining Grace and
Jason-1 altimeter data. While the two measurements closely matched with regard to seasonal ups and downs, they didn’tagree at all on the total amount o warming. In act, the Argodata showed no warming at all, while the combined Jason andGrace data did.
Tis is a mystery to the scientists, which they hope to resolvesoon. Willis added there is no observing system yet or thedeep ocean, and it could hold some real surprises.
Te record o sea surace height begun by opex/Poseidonis now 16 years old. As it grows longer with the continuedhealth o Jason-1 and the launch o OSM/Jason-2, someuncertainties about sea level rise are much closer to resolution.
“We are getting a better understanding o our measurementsystems and just how much we can trust our numbers,” saidFu. “We know that sea level is not rising everywhere at thesame pace, and we are learning more every year about thenatural variability in the ocean over short and long periods.
We are learning more about the exchange o heat between theocean and the atmosphere, the driving orce o our climate.”
So will we have disastrous sea level rise? I so, when?
We don’t know yet, said Fu, but he does not rule out nding the answer.
For more inormation on sea level rise research, contact:
Lee-Lueng Fu NASA Jet Propulsion Laboratory, Pasadena, Cali.Phone: 818-354-8167Email: [email protected]
Josh WillisNASA Jet Propulsion Laboratory, Pasadena, Cali.Phone: 818-354-0881Email: [email protected]
Don ChambersCenter or Space Research, Te University o exas at AustinPhone: [email protected]
Steve NeremUniversity o Colorado, BoulderPhone: 303-492-6721Email: [email protected]
Related Links:
Ocean Surace opography rom Space – Te OSM/
Jason-2 Missionhttp://sealevel.jpl.nasa.gov/mission/ostm.html •

7/27/2019 Jason-2 Satellite History
http://slidepdf.com/reader/full/jason-2-satellite-history 16/20
SCIENCE WRITERS’ GUIDE
OSTM/Jason-2
14
level rise and climate change, Church is a co-investigator onthe OSM/Jason-2 mission. He will ocus on sea-level rise.
Lee-Lueng Fu is a senior research scientist at NASA’s Jet Pro-pulsion Laboratory in Pasadena, Cali. His research interestis physical oceanography. As the NASA project scientist orOSM/Jason-2, Fu has collaborated with the partner agenciesto develop the science requirements or the mission and hasparticipated in the selection o the principal investigators orthe mission’s science team. He will coordinate the calibrationand validation o the mission’s measurements and acilitatepublication o the mission’s science results in open literature.He also serves as a science spokesperson or the mission.
Gustavo Jorge Goni is an oceanographer at the NationalOceanic and Atmospheric Administration’s Atlantic Oceano-graphic and Meteorological Laboratory in Miami. Hisresearch ocus is physical oceanography. Goni’s OSM/Ja-son-2 role will include transitioning science derived rom thealtimetry missions into practical, operational applications.
Gregg Jacobs is the Ocean Dynamics and Prediction Branchhead at the Naval Research Laboratory at NASA’s StennisSpace Center, Miss. His research interests are physical ocean-ography, mesoscale circulation, assimilation, and ocean envi-ronment prediction. Jacobs’ science group will be working to
process the OSM/Jason-2 sea surace height observations toreduce latency to a minimum while maintaining accuracy orocean circulation prediction. Te data will be integrated intoglobal ocean models to represent the general wide-ranging ront and eddy eld. Jacobs expects resulting orecast ecien-cy to provide benet to commercial and research activities.
Bob Leben is a research proessor at the University o Colorado’s Colorado Center or Astrodynamics Research inBoulder. His research specialty is operational oceanography and outreach, with a ocus on Gul o Mexico and mesoscaleoceanography. As part o the OSM/Jason-2 science team,Leben will work on a project called Operational Ocean Circu-lation Monitoring or the Study o Mesoscale Dynamics.
Fabien Leevre is a researcher at Collecte Localisation Satel-lites, Direction Océanographie Spatiale in Ramonville-St-
Agne, France. His research ocus is physical oceanography. As part o the OSM/Jason-2 science team, Leevre will work on the development and marketing o oceanographicapplications or oshore needs, using satellite data (altimetry in particular).
Charon Birkett is an associate research scientist with theEarth System Science Interdisciplinary Center at the Univer-sity o Maryland College Park. Her specialty is applying satel-lite radar altimetry to study continental surace waters. As a principal investigator on the Ocean Surace opography Mis-sion/Jason-2 science team, she will use the data to improvethe understanding o the hydraulics and dynamics o riverbasins and monitor lake and reservoir water levels aroundthe world or use in agricultural and climate investigations.Trough collaborative eorts, OSM/Jason-2 data will alsobe combined with gravity data rom NASA’s Gravity Recov-ery and Climate Experiment to test the ability to predict theonset o river basin fooding.
Hans Bonekamp is an ocean mission scientist and OSM/ Jason-2 project scientist at the European Organisation or theExploitation o Meteorological Satellites, more commonly known as EUMESA, in Darmstadt, Germany. His researchinterest is operational satellite oceanography.
Anny Cazenave is a senior scientist at the Laboratoired’Etudes en Géophysique et Océanographie Spatiale andCentre National d’Etudes Spatiales in oulouse, France. Herresearch interests are satellite geodesy and geosciences applica-tions (gravity eld, Earth rotation, precise positioning romspace, temporal changes in gravity, sea level variations at re-
gional and global scales, and land hydrology rom space). Sheis a principal investigator or sea level change on the OSM/
Jason-2 mission. On the mission, she will explore present-day sea level variability and trends at global and regional scales, as
well as natural and human-caused mechanisms that “orce”climate to change.
Yi Chao is a principal scientist at NASA’s Jet Propulsion Lab-oratory in Pasadena, Cali. Chao’s research interest is physicaloceanography. As part o the OSM/Jason-2 science team,Chao will explore ocean modeling and data assimilation, andapplications o satellite altimeter data in coastal oceans.
Dudley Chelton is a distinguished proessor o oceanic andatmospheric sciences at Oregon State University in Corvallis,Ore. His research specialty is physical oceanography, and he isa principal investigator or the OSM/Jason-2 mission.
John A. Church is a principal research scientist at the Centreor Australian Weather and Climate Research, a partnershipbetween Australia’s Commonwealth Scientic and IndustrialResearch Organisation and the Bureau o Meteorology, inHobart, asmania, Australia. With a research ocus on sea-
OSTM/JASON-2 SPOKESPERSONS
7/27/2019 Jason-2 Satellite History
http://slidepdf.com/reader/full/jason-2-satellite-history 17/20
SCIENCE WRITERS’ GUIDE
OSTM/Jason-2
15
Pierre Yves Le raon is a researcher at the French ResearchInstitute or Exploitation o the Sea in Brest, France. His re-search specialty is physical oceanography, satellite and in-situobserving systems, operational oceanography. His role withthe OSM/Jason-2 mission is to research mesoscale and sub-mesoscale dynamics, joint use o OSM/Jason-2 and Argoin-situ data in operational oceanography systems, otherwiseknown as ocean orecasting.
John Lillibridge is a physical oceanographer at the NationalOceanic and Atmospheric Administration’s Laboratory orSatellite Altimetry in Silver Spring, Md. His research inter-ests are physical oceanography and climate change. He is the
NOAA project scientist or OSM/Jason-2.
Eric Lindstrom is program scientist or oceanography inthe Science Mission Directorate at NASA Headquarters in
Washington. He is a program scientist or the OSM/Ja-son-2 mission.
Yves Menard is the OSM/Jason-2 project scientist at theCentre National d’Etudes Spatiales, the French space agency,in oulouse, France. His research interests are physicaloceanography, satellite altimetry and in-situ calibration andvalidation o satellite observations.
Laury Miller, a physical oceanographer, is chie o the Na-tional Oceanic and Atmospheric Administration’s Center orSatellite Applications and Research Lab or satellite altim-etry in Silver Spring, Md. His research interests are satellitealtimeter measurements to study equatorial dynamics, climatechange and sea level rise. Miller is a member o the OSM/
Jason-2 science team.
Steve Nerem is a proessor at the University o Colorado inBoulder. His research interests are physical oceanography,atmospheric chemistry, long-term sea level change and varia-tions in the global water cycle. Nerem is a principal investiga-tor on OSM/Jason-2.
Tierry Pendu is a research scientist at the Centre Nationalde la Recherche Scientique in Grenoble, France. His researchinterest is physical oceanography.
Bob Stewart is a proessor o oceanography at exas A&MUniversity in College Station, exas. As part o the OSM/
Jason-2 mission, Stewart will oversee outreach and improve-ment o teaching oceanography at all levels.
Stan Wilson is a senior scientist at the National Oceanic and Atmospheric Administration’s Satellite & Inormation Servicein Silver Spring, Md. His research interests are physical ocean-ography, satellite oceanography and operational oceanogra-phy. Wilson is an advisor to NOAA on the OSM/Jason-2mission to help ensure that the joint NOAA/EUMESA
Jason-3 initiative is ready or launch in late 2012, enabling a six-month overlap with OSM/Jason-2 during the last six months o its planned ve-year lie.
Carl Wunsch is the Cecil and Ida Green Proessor o PhysicalOceanography at the Massachusetts Institute o echnology inCambridge, Mass. His research specialties are physical ocean-
ography, climate and paleo-climate. His role with the OSM/ Jason-2 mission is to use observations rom the satellite’sinstruments to determine ocean circulation and its variability in combination with general circulation models.
7/27/2019 Jason-2 Satellite History
http://slidepdf.com/reader/full/jason-2-satellite-history 18/20
SCIENCE WRITERS’ GUIDE
OSTM/Jason-2
16
Andersen, Ole B., National Survey and Cadastre o Denmark (Kort and Matrikelstyrelsen),Copenhagen, Denmark
Arnault, Sabine, Laboratoired’Océanographie Dynamique et deClimatologie (LODYC), Paris, France
Ayoub, Nadia, Laboratoire d’Etudes enGeophysique et Oceanographie Spatiale(LEGOS)/UMR 5566,oulouse, France
Bahurel, Pierre, Mercator Océan,Ramonville St. Agne, France
Bertiger, William I., NASA JetPropulsion Laboratory, Pasadena,Cali., U.S.
Birkett, Charon M., University o Maryland, College Park, U.S.
Bonjean, Fabrice, Earth & SpaceResearch, Seattle, U.S.
Bonneond, Pascal, Observatoire de la Côte d’Azur, Grasse, France
Bosch, W., Deutsches GeodatischesForschungsinstitut (DGFI),Munich, Germany
Busalacchi, Antonio J., University o Maryland College Park, U.S.
Byrne, Deirdre A., University o Maine, Orono, U.S.
Callahan, Philip S., NASA JetPropulsion Laboratory, U.S.
Calmant, Stéphane, Laboratoired’Etudes en Geophysique etOceanographie Spatiale (LEGOS)/Observatoire Midi-Pyrénées,oulouse, France
Carton, James, University o Maryland,College Park, U.S.
OCEAN SURFACE TOPOGRAPHY SCIENCE TEAM MEMBERS
Cazenave, Anny, Laboratoire d’Etudesen Geophysique et OceanographieSpatiale (LEGOS), oulouse, France
Chao, Benjamin F., National CentralUniversity, aiwan
Chao, Yi., NASA Jet PropulsionLaboratory, Pasadena, Cali., U.S.
Chelton, Dudley B., Oregon StateUniversity, Corvallis, U.S.
Chen, Dake, Columbia University,New York, U.S.
Church, John A., CommonwealthScientic and Industrial ResearchOrganisation (CSIRO)Marine Research,Clayton South, Australia
De Mey, Pierre, Laboratoire d’Etudesen Geophysique et OceanographieSpatiale (LEGOS)/UMR 5566,oulouse, France
Desai, Shailen D., NASA JetPropulsion Laboratory, Pasadena,Cali., U.S.
Dorandeu, Joël, Collecte LocalisationSatellites (CLS), Ramonville Saint-
Agne, France
Emery, William, University o Colorado, Boulder, U.S.
Eymard, Laurence, Centre d’étudedes Environnements errestre etPlanétaires (CEP/IPSL/CNRS),
Saint Maur, France
Frew, Nelson M., Woods HoleOceanographic Institution, WoodsHole, Mass., U.S.
Fukumori, Ichiro, NASA JetPropulsion Laboratory, Pasadena,Cali., U.S.
Gille, Sarah ., University o Caliornia, San Diego, U.S.
Goni, Gustavo J., NOAA/AOML,Miami, U.S.
Haines, Bruce J., NASA JetPropulsion Laboratory, Pasadena,Cali., U.S.
Hoyer, Jacob L., DanishMeteorological Institute,Copenhagen, Denmark
Ichikawa, Kaoru, Kyushu University,Fukuoka City, Japan
Jacobs, Gregg A., Naval ResearchLaboratory, Stennis Space Center,Miss., U.S.
Kelly, Kathryn A., University o Washington, Seattle, U.S.
Kerléguer, Laurent, SHOM/CMO,oulouse, France
Knudsen, Per, National Survey andCadastre o Denmark (Kort andMatrikelstyrelsen), Copenhagen,Denmark
Lazar, Alban, Laboratoired’Océanographie Dynamique et deClimatologie, Paris, France
Le raon, Pierre-Yves, CollecteLocalisation Satellites (CLS),Ramonville Saint-Agne, France
Leèvre, Jean-Michel, Météo France,France
Luthcke, Scott B., NASA GoddardSpace Flight Center, Greenbelt,Md., U.S.
Lyard, Florent, Laboratoire d’Etudesen Geophysique et OceanographieSpatiale (LEGOS)/UMR 5566,oulouse, France
7/27/2019 Jason-2 Satellite History
http://slidepdf.com/reader/full/jason-2-satellite-history 19/20
SCIENCE WRITERS’ GUIDE
OSTM/Jason-2
Maes, Christophe, Laboratoired’Etudes en Geophysique etOceanographie Spatiale (LEGOS)/IRD, France
Marin, Frédéric, Laboratoired’Etudes en Geophysique etOceanographie Spatiale (LEGOS)/UMR 5566, oulouse, France
Merrifeld, Mark A., University o Hawaii, Manoa, U.S.
Miller, Laury, NOAA, Silver Spring,Md., U.S.
Moore, Philip, University O Newcastle, U.K.
Morrow, Rosemary, Laboratoired’Etudes en Geophysique etOceanographie Spatiale (LEGOS)/UMR 5566, oulouse, France
Nerem, R. Steven, University o Colorado, Boulder, U.S.
Niiler, Pearn Peter, ScrippsInstitution o Oceanography, SanDiego, Cali., U.S.
Park, Young-Hyang, MuséumNational d’Histoire Naturelle,Paris, France
Pavlis, Erricos C., JCE/University o Maryland Baltimore County,Baltimore, U.S.
Pendu, Tierry, Laboratoire Des
Ecoulements Géophysiques EtIndustriels (LEGI), Grenoble, France
Perigaud, Claire M., NASA JetPropulsion Laboratory, Pasadena,Cali., U.S.
Ponte, Rui M., Atmospheric &Environmental Research, Inc.,Lexington, Mass., U.S.
Provost, Christine, Laboratoired’Océanographie Dynamique et deClimatologie, Paris, France
Qiu, Bo, University o Hawaii atManoa, U.S.
Quilen, Yves, French ResearchInstitute or Exploitation o the Sea (Iremer), Brest, France
Radenac, Marie-Hélène, Laboratoired’Etudes en Geophysique etOceanographie Spatiale (LEGOS)/UMR 5566, oulouse, France
Ray, Richard D., Goddard SpaceFlight Center, Greenbelt, Md., U.S.
Rhines, Peter B., University o Washington, Seattle, U.S.
Ries, John C., University o exas at Austin, U.S.
Roemmich, Dean, University o Caliornia, San Diego, U.S.
Rogel, Philippe, EuropeanCentre or Research and Advancedraining in Scientic Computation(CERFACS), oulouse, France
Rosmorduc, Vinca, CollecteLocalisation Satellites (CLS),Ramonville Saint-Agne, France
Ru, Christopher S., University o Michigan, Ann Arbor, U.S.
Saskia, GeoForschungsZentrum,Potsdam, Germany
Schrama, Ernst J. O., DeltUniversity o echnology, Delt,Te Netherlands
Schröter, Jens, Alred- Wegener-Institut ür Polar undMeeresorschung, Bremerhaven,Germany
Shum, C. K., Ohio State University,Columbus, U.S.
Srokosz, Meric, Graham Quartly,Peter Challenor: SouthamptonOceanography Centre, U.K.
Stewart, Robert H., exas A&MUniversity, College Station, U.S.
Strub, P. ed, Oregon StateUniversity, Corvallis, U.S.
ailleux, Rémi, University O Capeown, South Arica
estut, Laurent, Laboratoired’Etudes en Geophysique etOceanographie Spatiale (LEGOS)/UMR 5566, oulouse, France
Vandemark, Douglas C., University o New Hampshire, Durham, U.S.
Verron, Jacques, Laboratoire DesEcoulements Géophysiques EtIndustriels (LEGI), Brest, France
Vigo, Isabel, University o Alicante, Spain
Vivier, Frédéric, Laboratoired’Océanographie Dynamique et deClimatologie (LODYC), Paris, France
Woodworth, Ph. L., ProudmanOceanographic Laboratory,Liverpool, U.K.
Wunsch, Carl I., Massachusetts
Institute o echnology, Boston, U.S.
Ziebart, Marek, University CollegeLondon (UCL), U.K.

7/27/2019 Jason-2 Satellite History
http://slidepdf.com/reader/full/jason-2-satellite-history 20/20
National Aeronautics and Space Administration
Jet Propulsion Laboratory
California Institute of Technology
4800 Oak Grove Drive
Pasadena, Calif. 91109-8099
http://www.jpl.nasa.gov
http://www.nasa.gov/ostm
http://sealevel.jpl.nasa.gov/mission/ostm.html
www.nasa.gov