Embed Size (px)
Citation preview
© 2006, 2016 Zumasys, Inc.
jBASE Debugger
iv
Contents
Documentation Conventions ................................................................................ 1
JBASE DEBUGGER .................................................................................................. 3
Entering the Debugger ..........................................................................................3
Debug Arguments at Run-time............................................................................. 4
Debugger Commands ........................................................................................... 6
Command List ...................................................................................................... 6
EXPLANATION OF COMPLEX COMMANDS ................................................................ 15
Modifying Trace and Breakpoint Tables ............................................................ 15
Execution History ............................................................................................... 16
Locating Strings ................................................................................................. 16
Debugger Symbol Tables ...................................................................................21
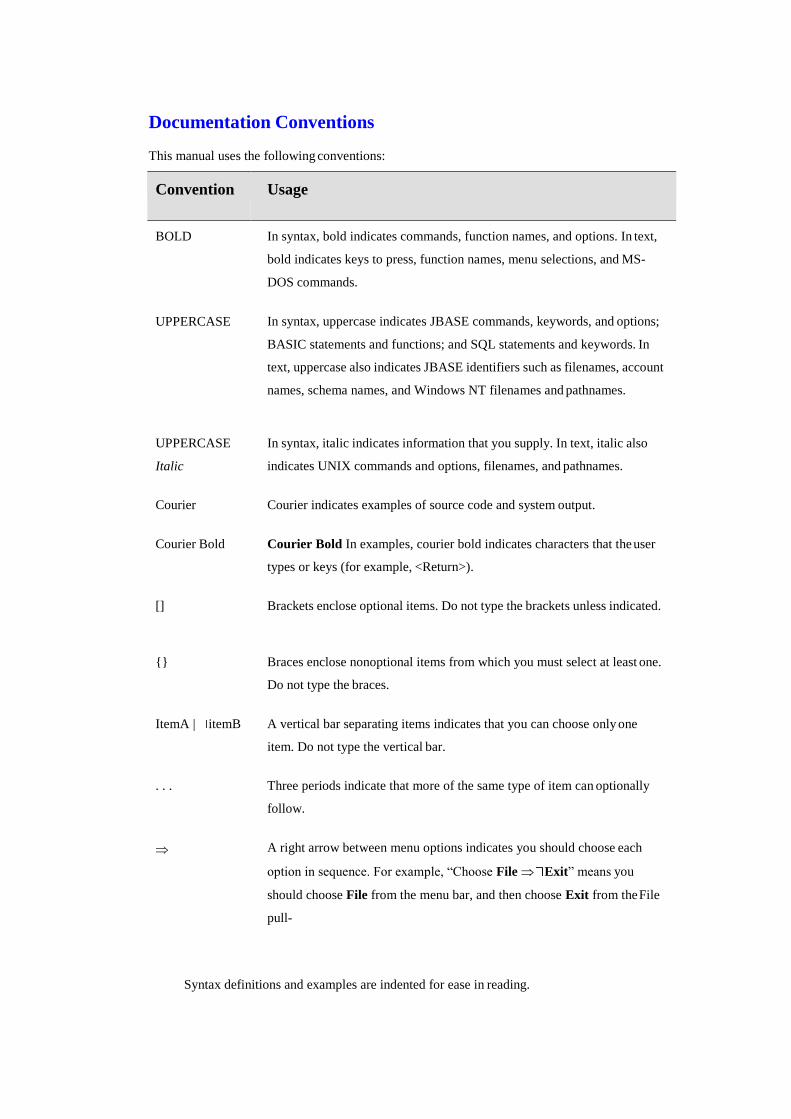
Documentation Conventions
This manual uses the following conventions:
Convention Usage
BOLD In syntax, bold indicates commands, function names, and options. In text,
bold indicates keys to press, function names, menu selections, and MS-
DOS commands.
UPPERCASE In syntax, uppercase indicates JBASE commands, keywords, and options;
BASIC statements and functions; and SQL statements and keywords. In
text, uppercase also indicates JBASE identifiers such as filenames, account
names, schema names, and Windows NT filenames and pathnames.
UPPERCASE
Italic
In syntax, italic indicates information that you supply. In text, italic also
indicates UNIX commands and options, filenames, and pathnames.
Courier Courier indicates examples of source code and system output.
Courier Bold Courier Bold In examples, courier bold indicates characters that the user
types or keys (for example, <Return>).
[] Brackets enclose optional items. Do not type the brackets unless indicated.
{}
Braces enclose nonoptional items from which you must select at least one.
Do not type the braces.
ItemA | itemB A vertical bar separating items indicates that you can choose only one
item. Do not type the vertical bar.
. . . Three periods indicate that more of the same type of item can optionally
follow.
A right arrow between menu options indicates you should choose each
option in sequence. For example, “Choose File Exit” means you
should choose File from the menu bar, and then choose Exit from the File
pull-
down menu.
Syntax definitions and examples are indented for ease in reading.
2
All punctuation marks included in the syntax—for example, commas, parentheses, or
quotation marks—are required unless otherwise indicated.
Syntax lines that do not fit on one line in this manual are continued on subsequent lines.
The continuation lines are indented. When entering syntax, type the entire syntax entry,
including the continuation lines, on the same input line.
3
JBASE DEBUGGER
The jBASIC debugger is a fully featured, interactive diagnostic utility that gives the
programmer full access to the program variables and files. It will allow examination
of source code, save and restore of debug settings and full access to system commands
from within the debug shell. As such, it is a powerful tool for detecting and fixing
errors within jBASIC source programs. The main features of the debugger are:
Set and delete breakpoints to halt program execution. These can be simple line number breaks or
based upon the result of an evaluated expression.
Set and delete the tracking and display of variable contents.
Display any number of lines from within the current source.
Locate text in the current source.
Examine and set breakpoints in source files other than the current one.
Display and modify the contents of any variable.
Execute a chosen number of source program lines before re-entering debug.
Redirect debugger interaction to another device or terminal.
Save debugger status to a file and execute debugger commands held in a file.
Execute system commands and return to debug.
Entering the Debugger
The jBASIC debugger will be entered a number of ways:
1. After invoking a program with the -Jd or -JD options
2. After the detection of a run-time error
3. After the user sends the intr signal to the program from the terminal
4. After the application is sent, kill -16 signals by another process.
5. After the execution of a DEBUG statement in the jBASIC code
6. After coming to a debug breakpoint previously entered from debug
7. Once the debugger is entered, an identification message is displayed and the debug shell
prompt is displayed.
4
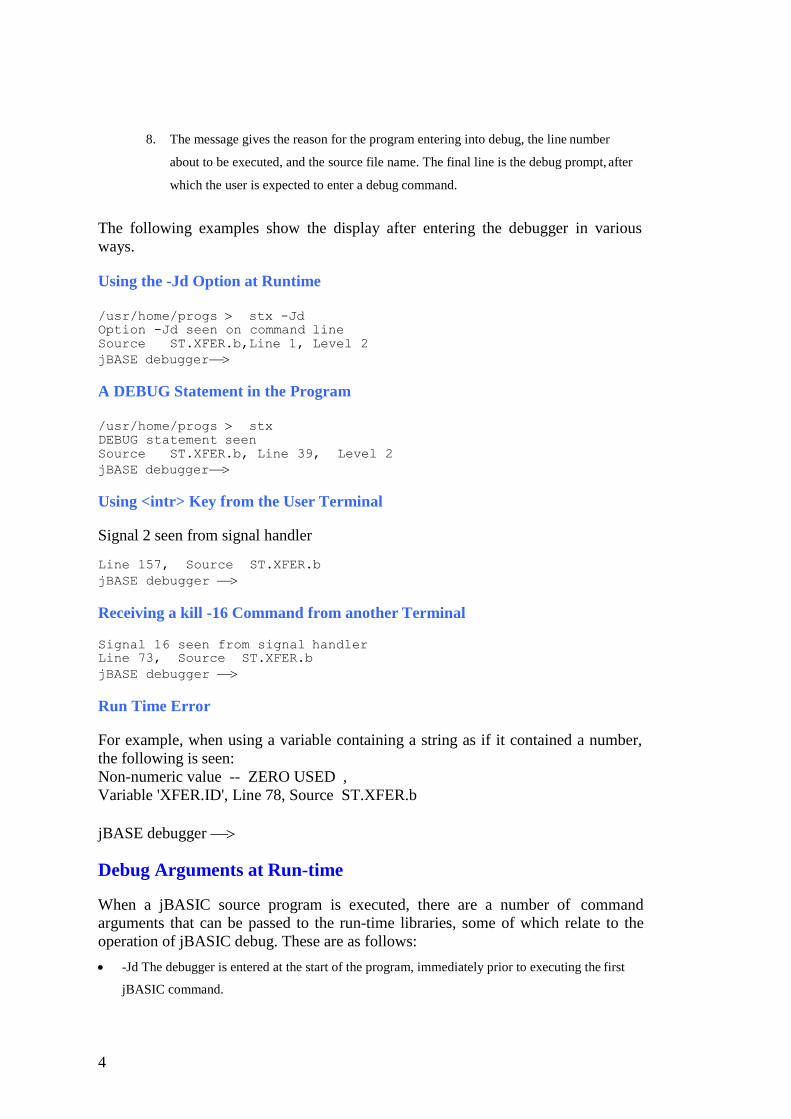
8. The message gives the reason for the program entering into debug, the line number
about to be executed, and the source file name. The final line is the debug prompt, after
which the user is expected to enter a debug command.
The following examples show the display after entering the debugger in various
ways.
Using the -Jd Option at Runtime /usr/home/progs stx -Jd
Option -Jd seen on command line
Source ST.XFER.b,Line 1, Level 2
jBASE debugger
A DEBUG Statement in the Program /usr/home/progs stx
DEBUG statement seen
Source ST.XFER.b, Line 39, Level 2
jBASE debugger
Using <intr> Key from the User Terminal
Signal 2 seen from signal handler
Line 157, Source ST.XFER.b
jBASE debugger
Receiving a kill -16 Command from another Terminal Signal 16 seen from signal handler
Line 73, Source ST.XFER.b
jBASE debugger
Run Time Error
For example, when using a variable containing a string as if it contained a number,
the following is seen:
Non-numeric value -- ZERO USED ,
Variable 'XFER.ID', Line 78, Source ST.XFER.b
jBASE debugger
Debug Arguments at Run-time
When a jBASIC source program is executed, there are a number of command
arguments that can be passed to the run-time libraries, some of which relate to the
operation of jBASIC debug. These are as follows:
-Jd The debugger is entered at the start of the program, immediately prior to executing the first
jBASIC command.
5
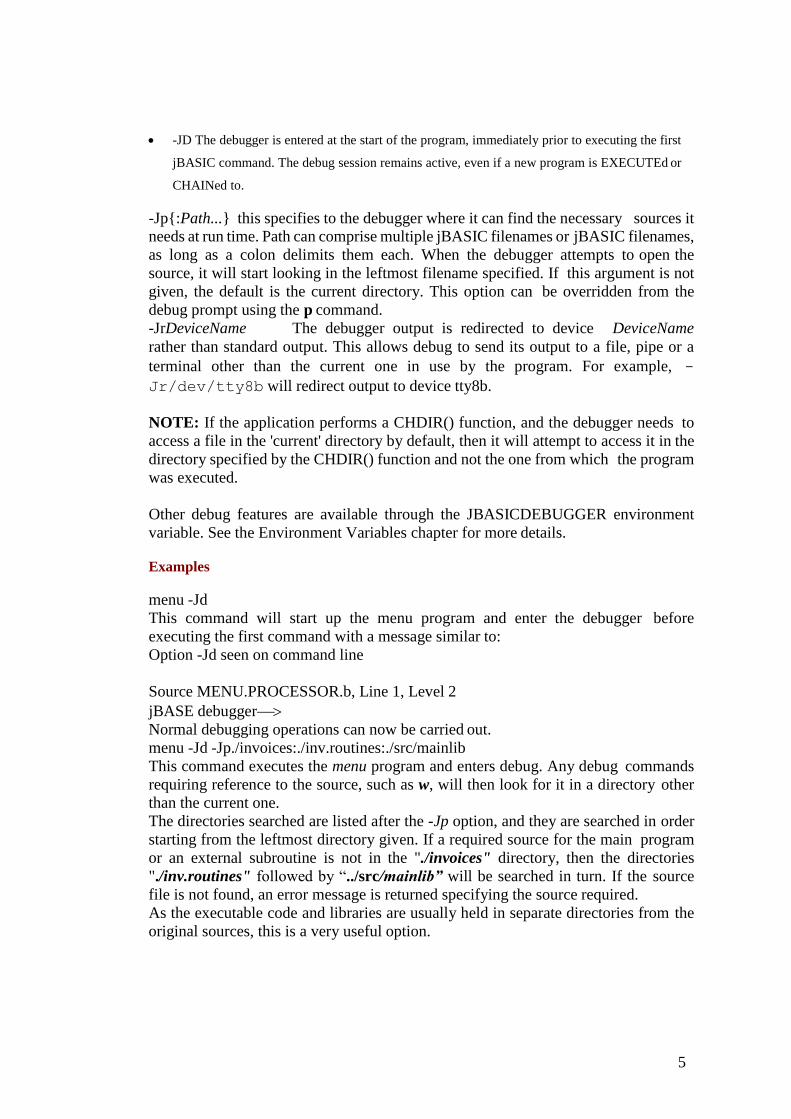
-JD The debugger is entered at the start of the program, immediately prior to executing the first
jBASIC command. The debug session remains active, even if a new program is EXECUTEd or
CHAINed to.
-Jp{:Path...} this specifies to the debugger where it can find the necessary sources it
needs at run time. Path can comprise multiple jBASIC filenames or jBASIC filenames,
as long as a colon delimits them each. When the debugger attempts to open the
source, it will start looking in the leftmost filename specified. If this argument is not
given, the default is the current directory. This option can be overridden from the
debug prompt using the p command.
-JrDeviceName The debugger output is redirected to device DeviceName
rather than standard output. This allows debug to send its output to a file, pipe or a
terminal other than the current one in use by the program. For example, -
Jr/dev/tty8b will redirect output to device tty8b.
NOTE: If the application performs a CHDIR() function, and the debugger needs to
access a file in the 'current' directory by default, then it will attempt to access it in the
directory specified by the CHDIR() function and not the one from which the program
was executed.
Other debug features are available through the JBASICDEBUGGER environment
variable. See the Environment Variables chapter for more details.
Examples
menu -Jd
This command will start up the menu program and enter the debugger before
executing the first command with a message similar to:
Option -Jd seen on command line
Source MENU.PROCESSOR.b, Line 1, Level 2
jBASE debugger
Normal debugging operations can now be carried out.
menu -Jd -Jp./invoices:./inv.routines:./src/mainlib
This command executes the menu program and enters debug. Any debug commands
requiring reference to the source, such as w, will then look for it in a directory other
than the current one.
The directories searched are listed after the -Jp option, and they are searched in order
starting from the leftmost directory given. If a required source for the main program
or an external subroutine is not in the "./invoices" directory, then the directories
"./inv.routines" followed by “../src/mainlib” will be searched in turn. If the source
file is not found, an error message is returned specifying the source required.
As the executable code and libraries are usually held in separate directories from the
original sources, this is a very useful option.
6
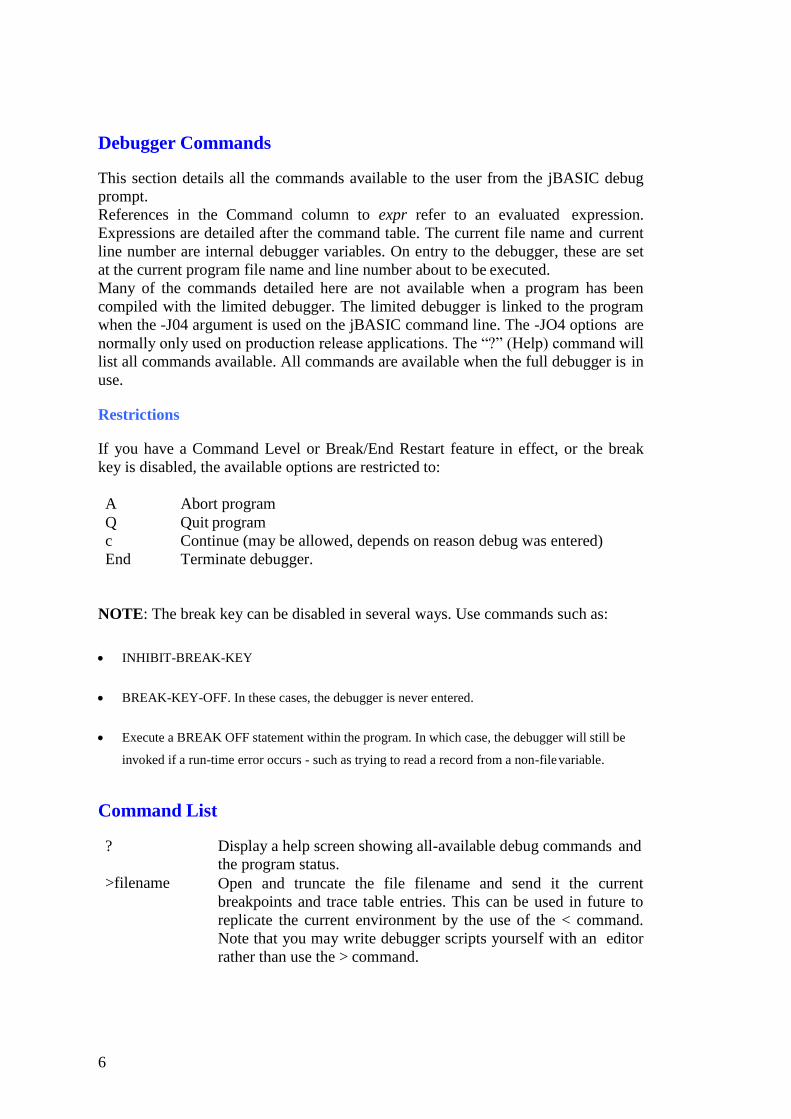
Debugger Commands
This section details all the commands available to the user from the jBASIC debug
prompt.
References in the Command column to expr refer to an evaluated expression.
Expressions are detailed after the command table. The current file name and current
line number are internal debugger variables. On entry to the debugger, these are set
at the current program file name and line number about to be executed.
Many of the commands detailed here are not available when a program has been
compiled with the limited debugger. The limited debugger is linked to the program
when the -J04 argument is used on the jBASIC command line. The -JO4 options are
normally only used on production release applications. The “?” (Help) command will
list all commands available. All commands are available when the full debugger is in
use.
Restrictions
If you have a Command Level or Break/End Restart feature in effect, or the break
key is disabled, the available options are restricted to:
A Abort program
Q Quit program
c Continue (may be allowed, depends on reason debug was entered)
End Terminate debugger.
NOTE: The break key can be disabled in several ways. Use commands such as:
INHIBIT-BREAK-KEY
BREAK-KEY-OFF. In these cases, the debugger is never entered.
Execute a BREAK OFF statement within the program. In which case, the debugger will still be
invoked if a run-time error occurs - such as trying to read a record from a non-file variable.
Command List
? Display a help screen showing all-available debug commands and
the program status.
>filename Open and truncate the file filename and send it the current
breakpoints and trace table entries. This can be used in future to
replicate the current environment by the use of the < command.
Note that you may write debugger scripts yourself with an editor
rather than use the > command.
7
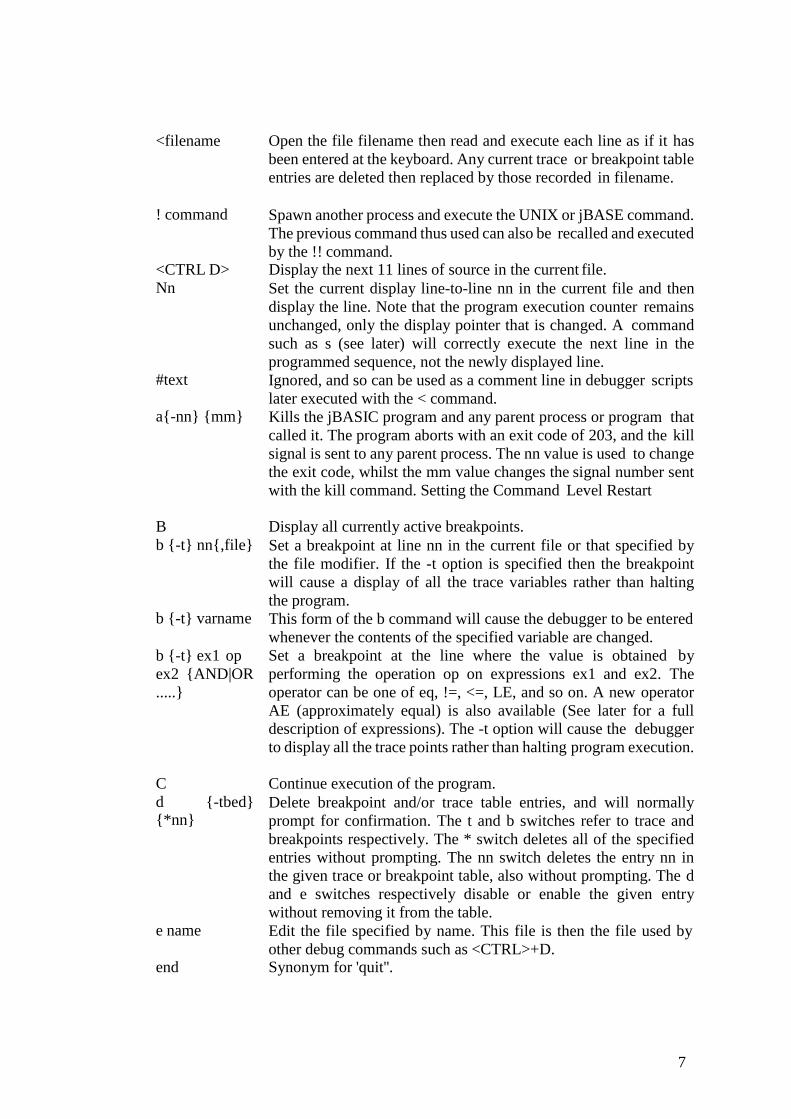
<filename Open the file filename then read and execute each line as if it has
been entered at the keyboard. Any current trace or breakpoint table
entries are deleted then replaced by those recorded in filename.
! command Spawn another process and execute the UNIX or jBASE command.
The previous command thus used can also be recalled and executed
by the !! command. <CTRL D> Display the next 11 lines of source in the current file.
Nn Set the current display line-to-line nn in the current file and then
display the line. Note that the program execution counter remains
unchanged, only the display pointer that is changed. A command
such as s (see later) will correctly execute the next line in the
programmed sequence, not the newly displayed line. #text Ignored, and so can be used as a comment line in debugger scripts
later executed with the < command. a{-nn} {mm} Kills the jBASIC program and any parent process or program that
called it. The program aborts with an exit code of 203, and the kill
signal is sent to any parent process. The nn value is used to change
the exit code, whilst the mm value changes the signal number sent
with the kill command. Setting the Command Level Restart
B Display all currently active breakpoints.
b {-t} nn{,file} Set a breakpoint at line nn in the current file or that specified by
the file modifier. If the -t option is specified then the breakpoint
will cause a display of all the trace variables rather than halting
the program. b {-t} varname This form of the b command will cause the debugger to be entered
whenever the contents of the specified variable are changed.
b {-t} ex1 op
ex2 {AND|OR
.....}
Set a breakpoint at the line where the value is obtained by
performing the operation op on expressions ex1 and ex2. The
operator can be one of eq, !=, <=, LE, and so on. A new operator
AE (approximately equal) is also available (See later for a full
description of expressions). The -t option will cause the debugger
to display all the trace points rather than halting program execution.
C Continue execution of the program.
d {-tbed} {*nn}
Delete breakpoint and/or trace table entries, and will normally
prompt for confirmation. The t and b switches refer to trace and
breakpoints respectively. The * switch deletes all of the specified
entries without prompting. The nn switch deletes the entry nn in
the given trace or breakpoint table, also without prompting. The d
and e switches respectively disable or enable the given entry
without removing it from the table. e name Edit the file specified by name. This file is then the file used by
other debug commands such as <CTRL>+D. end Synonym for 'quit''.
8
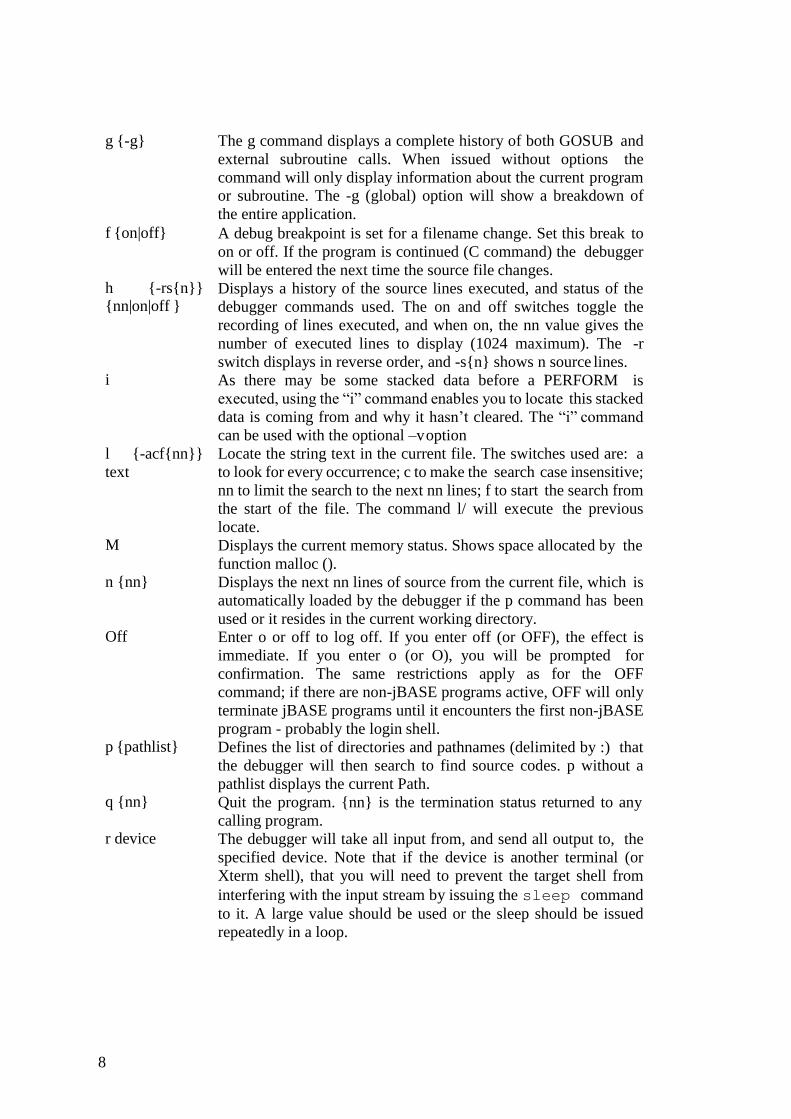
g {-g} The g command displays a complete history of both GOSUB and
external subroutine calls. When issued without options the
command will only display information about the current program
or subroutine. The -g (global) option will show a breakdown of
the entire application.
f {on|off} A debug breakpoint is set for a filename change. Set this break to
on or off. If the program is continued (C command) the debugger
will be entered the next time the source file changes. h {-rs{n}} {nn|on|off }
Displays a history of the source lines executed, and status of the
debugger commands used. The on and off switches toggle the
recording of lines executed, and when on, the nn value gives the
number of executed lines to display (1024 maximum). The -r
switch displays in reverse order, and -s{n} shows n source lines. i As there may be some stacked data before a PERFORM is
executed, using the “i” command enables you to locate this stacked
data is coming from and why it hasn’t cleared. The “i” command
can be used with the optional –v option
l {-acf{nn}}
text
Locate the string text in the current file. The switches used are: a
to look for every occurrence; c to make the search case insensitive;
nn to limit the search to the next nn lines; f to start the search from
the start of the file. The command l/ will execute the previous
locate. M Displays the current memory status. Shows space allocated by the
function malloc (). n {nn} Displays the next nn lines of source from the current file, which is
automatically loaded by the debugger if the p command has been
used or it resides in the current working directory. Off Enter o or off to log off. If you enter off (or OFF), the effect is
immediate. If you enter o (or O), you will be prompted for
confirmation. The same restrictions apply as for the OFF
command; if there are non-jBASE programs active, OFF will only
terminate jBASE programs until it encounters the first non-jBASE
program - probably the login shell. p {pathlist} Defines the list of directories and pathnames (delimited by :) that
the debugger will then search to find source codes. p without a
pathlist displays the current Path. q {nn} Quit the program. {nn} is the termination status returned to any
calling program. r device The debugger will take all input from, and send all output to, the
specified device. Note that if the device is another terminal (or
Xterm shell), that you will need to prevent the target shell from
interfering with the input stream by issuing the sleep command
to it. A large value should be used or the sleep should be issued
repeatedly in a loop.
9
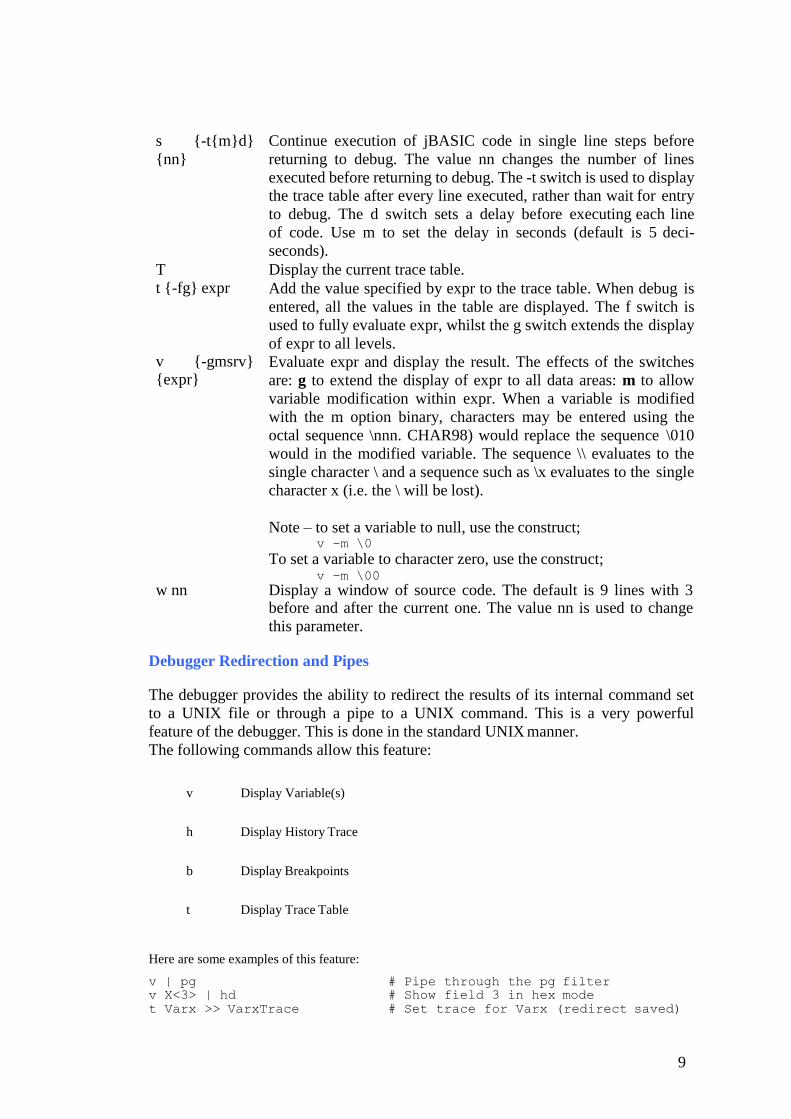
s {-t{m}d}
{nn}
Continue execution of jBASIC code in single line steps before
returning to debug. The value nn changes the number of lines
executed before returning to debug. The -t switch is used to display
the trace table after every line executed, rather than wait for entry
to debug. The d switch sets a delay before executing each line
of code. Use m to set the delay in seconds (default is 5 deci-
seconds).
T Display the current trace table.
t {-fg} expr Add the value specified by expr to the trace table. When debug is
entered, all the values in the table are displayed. The f switch is
used to fully evaluate expr, whilst the g switch extends the display
of expr to all levels. v {-gmsrv} {expr}
Evaluate expr and display the result. The effects of the switches
are: g to extend the display of expr to all data areas: m to allow
variable modification within expr. When a variable is modified
with the m option binary, characters may be entered using the
octal sequence \nnn. CHAR98) would replace the sequence \010
would in the modified variable. The sequence \\ evaluates to the
single character \ and a sequence such as \x evaluates to the single
character x (i.e. the \ will be lost).
Note – to set a variable to null, use the construct; v –m \0
To set a variable to character zero, use the construct; v –m \00
w nn Display a window of source code. The default is 9 lines with 3 before and after the current one. The value nn is used to change
this parameter.
Debugger Redirection and Pipes
The debugger provides the ability to redirect the results of its internal command set
to a UNIX file or through a pipe to a UNIX command. This is a very powerful
feature of the debugger. This is done in the standard UNIX manner.
The following commands allow this feature:
v Display Variable(s)
h Display History Trace
b Display Breakpoints
t Display Trace Table
Here are some examples of this feature:
v | pg # Pipe through the pg filter
v X<3> | hd # Show field 3 in hex mode
t Varx >> VarxTrace # Set trace for Varx (redirect saved)
10
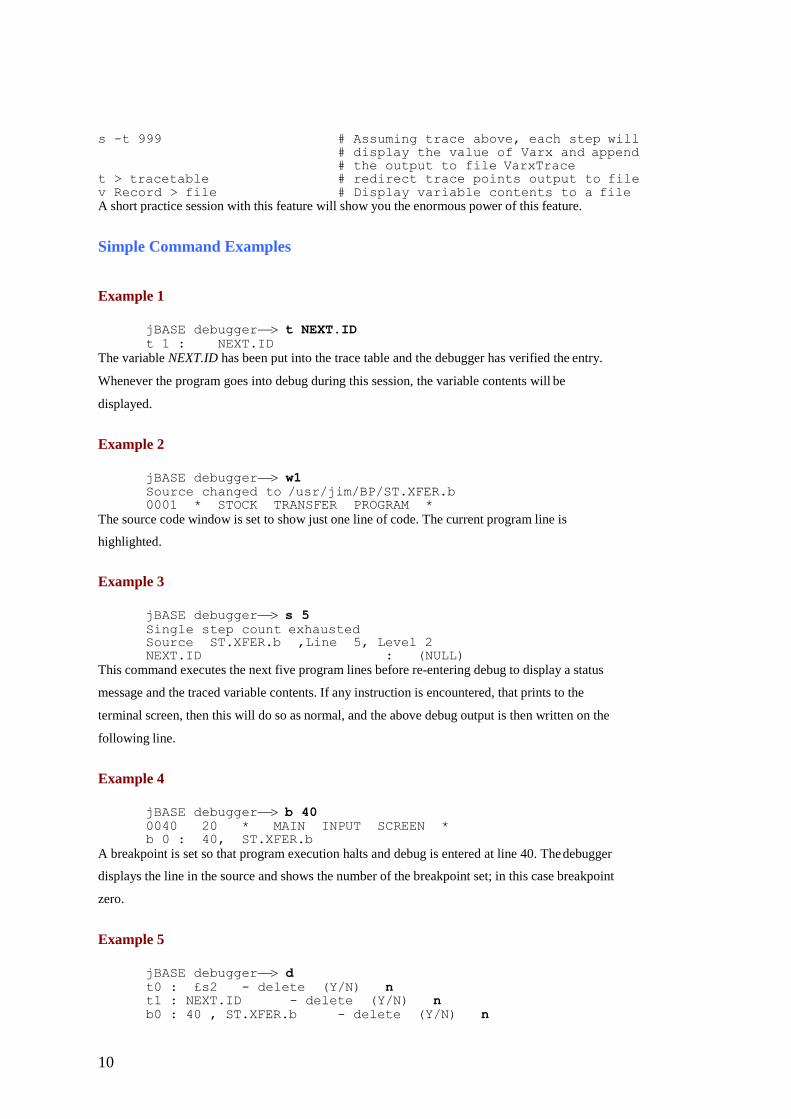
s -t 999 # Assuming trace above, each step will
# display the value of Varx and append # the output to file VarxTrace
t > tracetable # redirect trace points output to file
v Record > file # Display variable contents to a file
A short practice session with this feature will show you the enormous power of this feature.
Simple Command Examples
Example 1
jBASE debuggert NEXT.ID t 1 : NEXT.ID
The variable NEXT.ID has been put into the trace table and the debugger has verified the entry.
Whenever the program goes into debug during this session, the variable contents will be
displayed.
Example 2
jBASE debuggerw1 Source changed to /usr/jim/BP/ST.XFER.b 0001 * STOCK TRANSFER PROGRAM *
The source code window is set to show just one line of code. The current program line is
highlighted.
Example 3
jBASE debuggers 5 Single step count exhausted Source ST.XFER.b ,Line 5, Level 2 NEXT.ID : (NULL)
This command executes the next five program lines before re-entering debug to display a status
message and the traced variable contents. If any instruction is encountered, that prints to the
terminal screen, then this will do so as normal, and the above debug output is then written on the
following line.
Example 4
jBASE debuggerb 40 0040 20 * MAIN INPUT SCREEN * b 0 : 40, ST.XFER.b
A breakpoint is set so that program execution halts and debug is entered at line 40. The debugger
displays the line in the source and shows the number of the breakpoint set; in this case breakpoint
zero.
Example 5
jBASE debuggerd t0 : £s2 - delete (Y/N) n t1 : NEXT.ID - delete (Y/N) n b0 : 40 , ST.XFER.b - delete (Y/N) n
11
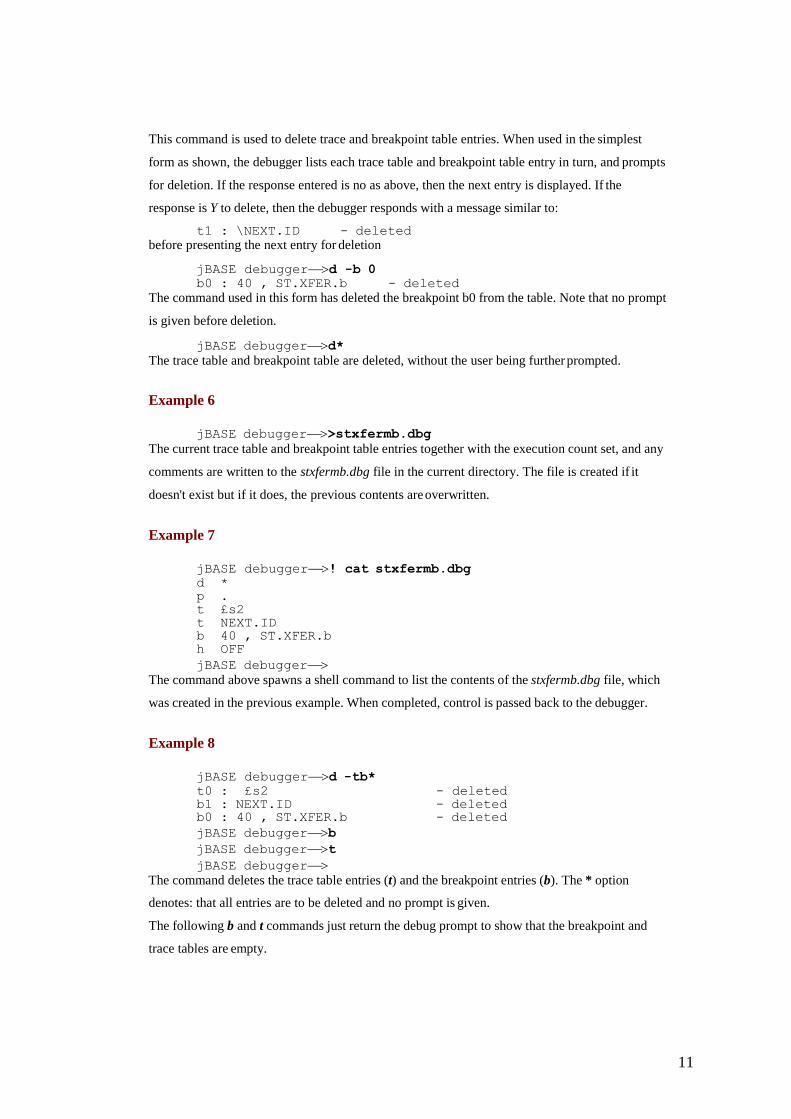
This command is used to delete trace and breakpoint table entries. When used in the simplest
form as shown, the debugger lists each trace table and breakpoint table entry in turn, and prompts
for deletion. If the response entered is no as above, then the next entry is displayed. If the
response is Y to delete, then the debugger responds with a message similar to:
t1 : \NEXT.ID - deleted
before presenting the next entry for deletion
jBASE debuggerd -b 0 b0 : 40 , ST.XFER.b - deleted
The command used in this form has deleted the breakpoint b0 from the table. Note that no prompt
is given before deletion.
jBASE debuggerd*
The trace table and breakpoint table are deleted, without the user being further prompted.
Example 6
jBASE debugger>stxfermb.dbg
The current trace table and breakpoint table entries together with the execution count set, and any
comments are written to the stxfermb.dbg file in the current directory. The file is created if it
doesn't exist but if it does, the previous contents are overwritten.
Example 7
jBASE debugger! cat stxfermb.dbg d *
p . t £s2 t NEXT.ID b 40 , ST.XFER.b h OFF
jBASE debugger
The command above spawns a shell command to list the contents of the stxfermb.dbg file, which
was created in the previous example. When completed, control is passed back to the debugger.
Example 8
jBASE debuggerd -tb* t0 : £s2 - deleted
b1 : NEXT.ID - deleted b0 : 40 , ST.XFER.b - deleted
jBASE debuggerb
jBASE debuggert
jBASE debuggerThe command deletes the trace table entries (t) and the breakpoint entries (b). The * option
denotes: that all entries are to be deleted and no prompt is given.
The following b and t commands just return the debug prompt to show that the breakpoint and
trace tables are empty.
12
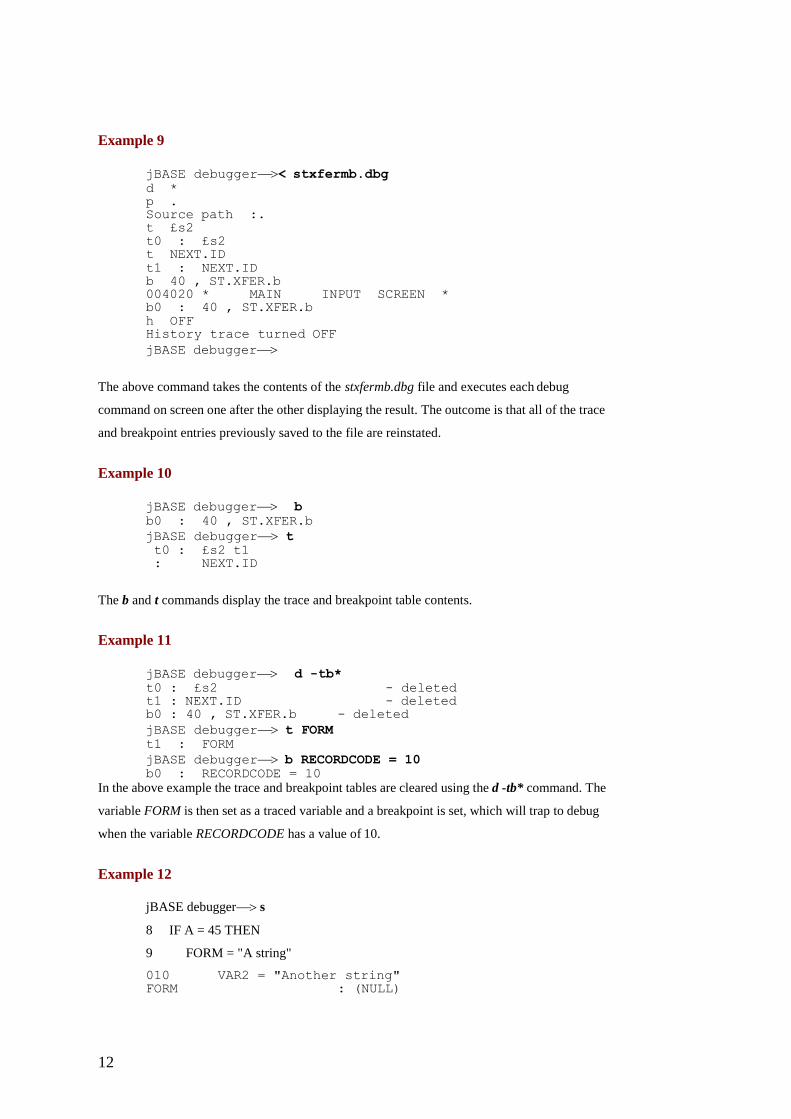
Example 9
jBASE debugger< stxfermb.dbg d * p . Source path :. t £s2
t0 : £s2 t NEXT.ID
t1 : NEXT.ID b 40 , ST.XFER.b 0040 20 * MAIN INPUT SCREEN * b0 : 40 , ST.XFER.b
h OFF History trace turned OFF
jBASE debugger
The above command takes the contents of the stxfermb.dbg file and executes each debug
command on screen one after the other displaying the result. The outcome is that all of the trace
and breakpoint entries previously saved to the file are reinstated.
Example 10
jBASE debugger b
b0 : 40 , ST.XFER.b
jBASE debuggert t0 : £s2 t1 : NEXT.ID
The b and t commands display the trace and breakpoint table contents.
Example 11
jBASE debugger d -tb*
t0 : £s2 - deleted t1 : NEXT.ID - deleted b0 : 40 , ST.XFER.b - deleted
jBASE debuggert FORM t1 : FORM
jBASE debuggerb RECORDCODE = 10 b0 : RECORDCODE = 10
In the above example the trace and breakpoint tables are cleared using the d -tb* command. The
variable FORM is then set as a traced variable and a breakpoint is set, which will trap to debug
when the variable RECORDCODE has a value of 10.
Example 12
jBASE debuggers
8 IF A = 45 THEN
9 FORM = "A string"
010 VAR2 = "Another string" FORM : (NULL)
13
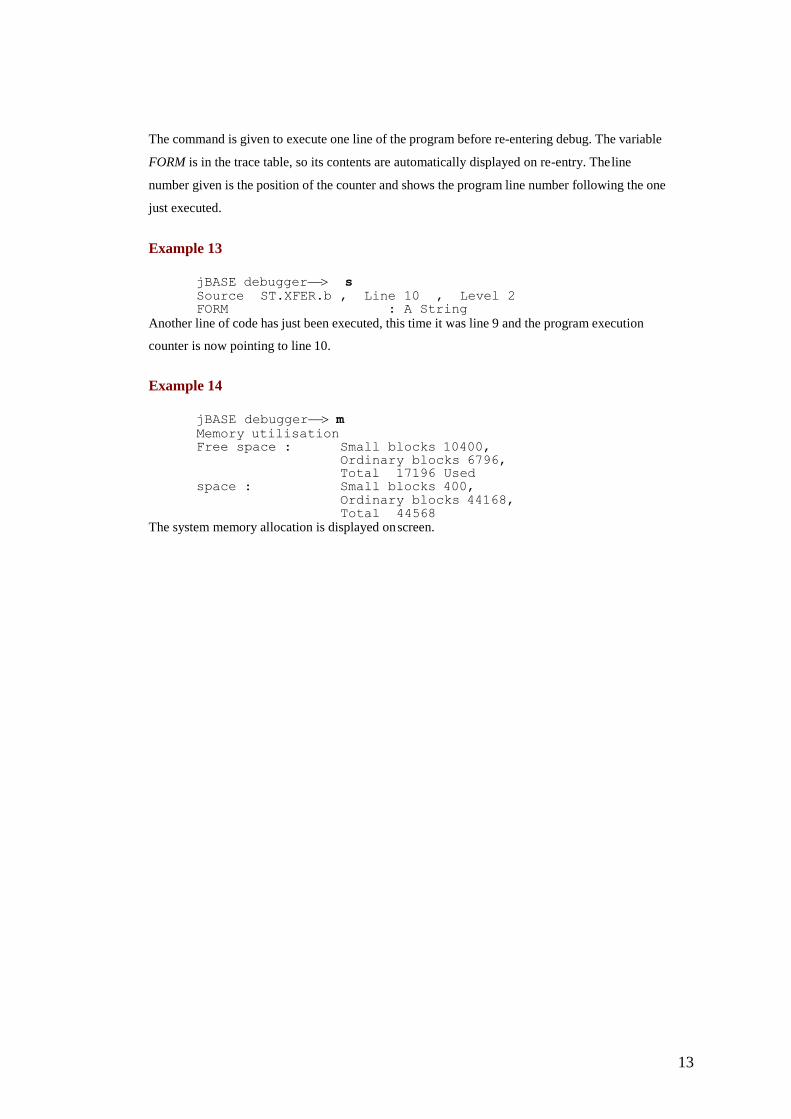
The command is given to execute one line of the program before re-entering debug. The variable
FORM is in the trace table, so its contents are automatically displayed on re-entry. The line
number given is the position of the counter and shows the program line number following the one
just executed.
Example 13
jBASE debugger s Source ST.XFER.b , Line 10 , Level 2 FORM : A String
Another line of code has just been executed, this time it was line 9 and the program execution
counter is now pointing to line 10.
Example 14
jBASE debuggerm Memory utilisation Free space : Small blocks 10400,
Ordinary blocks 6796, Total 17196 Used
space : Small blocks 400,
Ordinary blocks 44168,
Total 44568
The system memory allocation is displayed on screen.
14
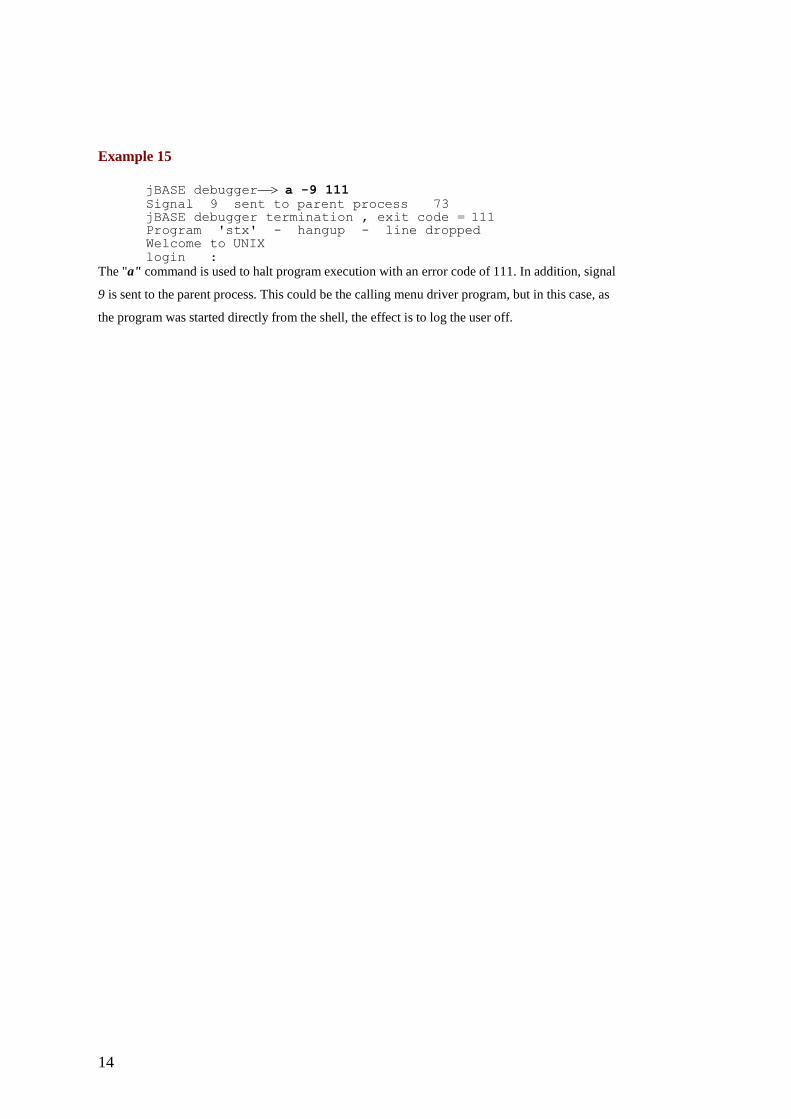
Example 15
jBASE debuggera -9 111 Signal 9 sent to parent process 73 jBASE debugger termination , exit code = 111 Program 'stx' - hangup - line dropped Welcome to UNIX
login :
The "a" command is used to halt program execution with an error code of 111. In addition, signal
9 is sent to the parent process. This could be the calling menu driver program, but in this case, as
the program was started directly from the shell, the effect is to log the user off.
15
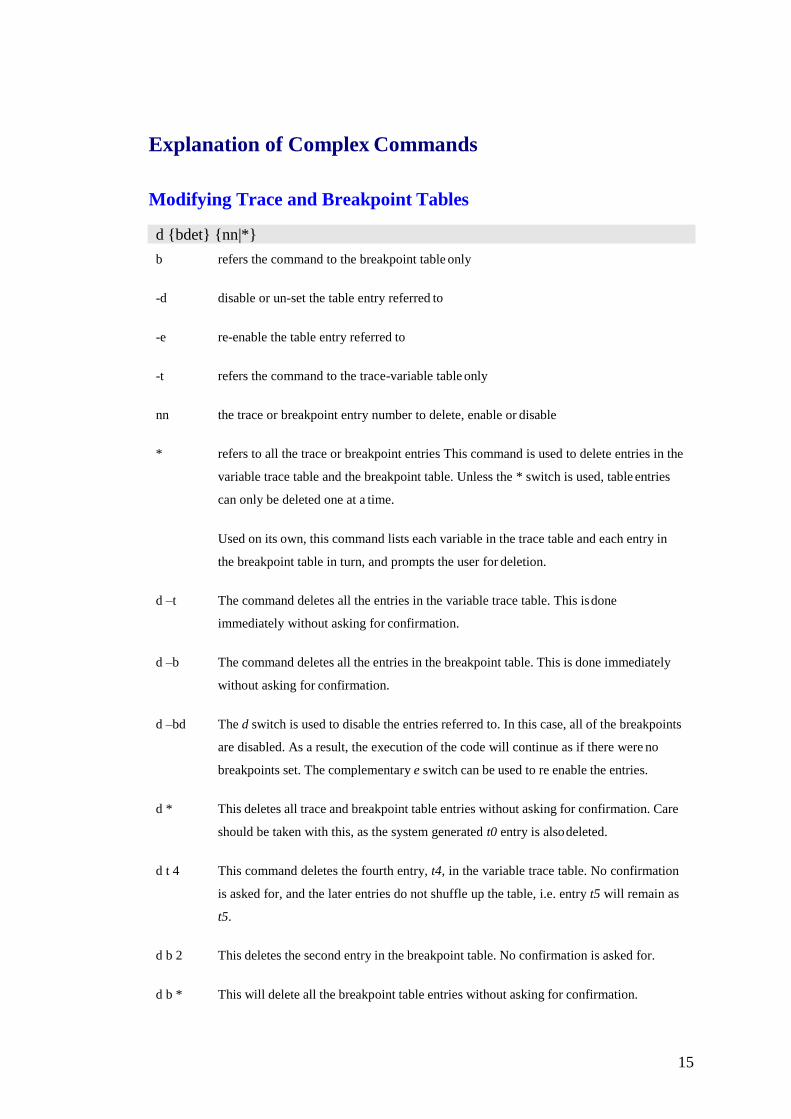
Explanation of Complex Commands
Modifying Trace and Breakpoint Tables
d {bdet} {nn|*}
b refers the command to the breakpoint table only
-d disable or un-set the table entry referred to
-e re-enable the table entry referred to
-t refers the command to the trace-variable table only
nn the trace or breakpoint entry number to delete, enable or disable
* refers to all the trace or breakpoint entries This command is used to delete entries in the
variable trace table and the breakpoint table. Unless the * switch is used, table entries
can only be deleted one at a time.
Used on its own, this command lists each variable in the trace table and each entry in
the breakpoint table in turn, and prompts the user for deletion.
d –t The command deletes all the entries in the variable trace table. This is done
immediately without asking for confirmation.
d –b The command deletes all the entries in the breakpoint table. This is done immediately
without asking for confirmation.
d –bd The d switch is used to disable the entries referred to. In this case, all of the breakpoints
are disabled. As a result, the execution of the code will continue as if there were no
breakpoints set. The complementary e switch can be used to re enable the entries.
d * This deletes all trace and breakpoint table entries without asking for confirmation. Care
should be taken with this, as the system generated t0 entry is also deleted.
d t 4 This command deletes the fourth entry, t4, in the variable trace table. No confirmation
is asked for, and the later entries do not shuffle up the table, i.e. entry t5 will remain as
t5.
d b 2 This deletes the second entry in the breakpoint table. No confirmation is asked for.
d b * This will delete all the breakpoint table entries without asking for confirmation.
16
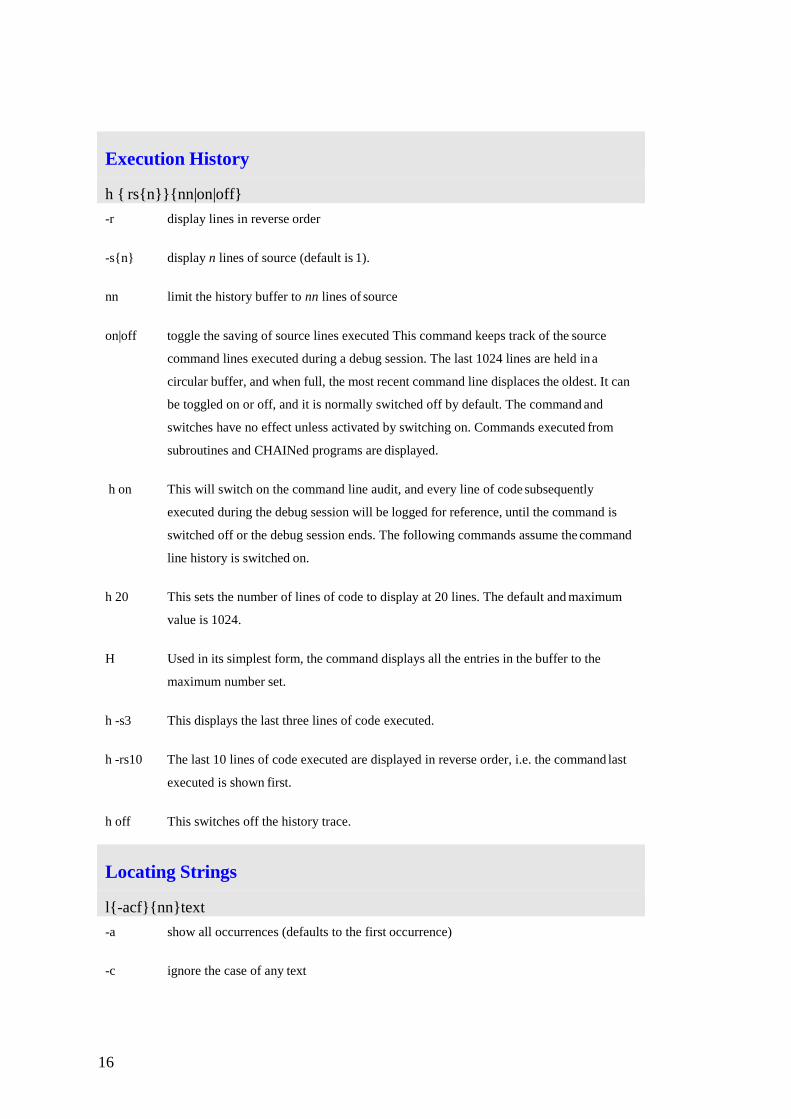
Execution History
h { rs{n}}{nn|on|off}
-r display lines in reverse order
-s{n} display n lines of source (default is 1).
nn limit the history buffer to nn lines of source
on|off toggle the saving of source lines executed This command keeps track of the source
command lines executed during a debug session. The last 1024 lines are held in a
circular buffer, and when full, the most recent command line displaces the oldest. It can
be toggled on or off, and it is normally switched off by default. The command and
switches have no effect unless activated by switching on. Commands executed from
subroutines and CHAINed programs are displayed.
h on This will switch on the command line audit, and every line of code subsequently
executed during the debug session will be logged for reference, until the command is
switched off or the debug session ends. The following commands assume the command
line history is switched on.
h 20 This sets the number of lines of code to display at 20 lines. The default and maximum
value is 1024.
H Used in its simplest form, the command displays all the entries in the buffer to the
maximum number set.
h -s3 This displays the last three lines of code executed.
h -rs10 The last 10 lines of code executed are displayed in reverse order, i.e. the command last
executed is shown first.
h off This switches off the history trace.
Locating Strings
l{-acf}{nn}text
-a show all occurrences (defaults to the first occurrence)
-c ignore the case of any text
17
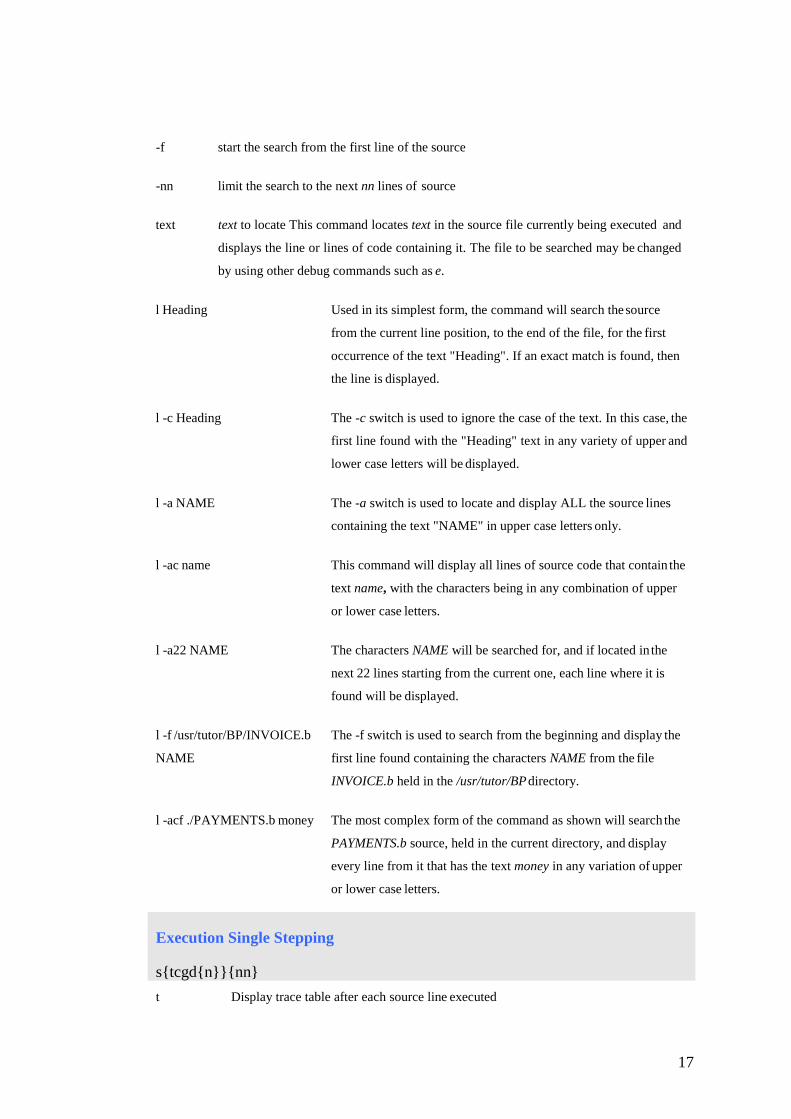
-f start the search from the first line of the source
-nn limit the search to the next nn lines of source
text text to locate This command locates text in the source file currently being executed and
displays the line or lines of code containing it. The file to be searched may be changed
by using other debug commands such as e.
l Heading Used in its simplest form, the command will search the source
from the current line position, to the end of the file, for the first
occurrence of the text "Heading". If an exact match is found, then
the line is displayed.
l -c Heading The -c switch is used to ignore the case of the text. In this case, the
first line found with the "Heading" text in any variety of upper and
lower case letters will be displayed.
l -a NAME The -a switch is used to locate and display ALL the source lines
containing the text "NAME" in upper case letters only.
l -ac name This command will display all lines of source code that contain the
text name, with the characters being in any combination of upper
or lower case letters.
l -a22 NAME The characters NAME will be searched for, and if located in the
next 22 lines starting from the current one, each line where it is
found will be displayed.
l -f /usr/tutor/BP/INVOICE.b
NAME
The -f switch is used to search from the beginning and display the
first line found containing the characters NAME from the file
INVOICE.b held in the /usr/tutor/BP directory.
l -acf ./PAYMENTS.b money The most complex form of the command as shown will search the
PAYMENTS.b source, held in the current directory, and display
every line from it that has the text money in any variation of upper
or lower case letters.
t Display trace table after each source line executed
Execution Single Stepping
s{tcgd{n}}{nn}
18
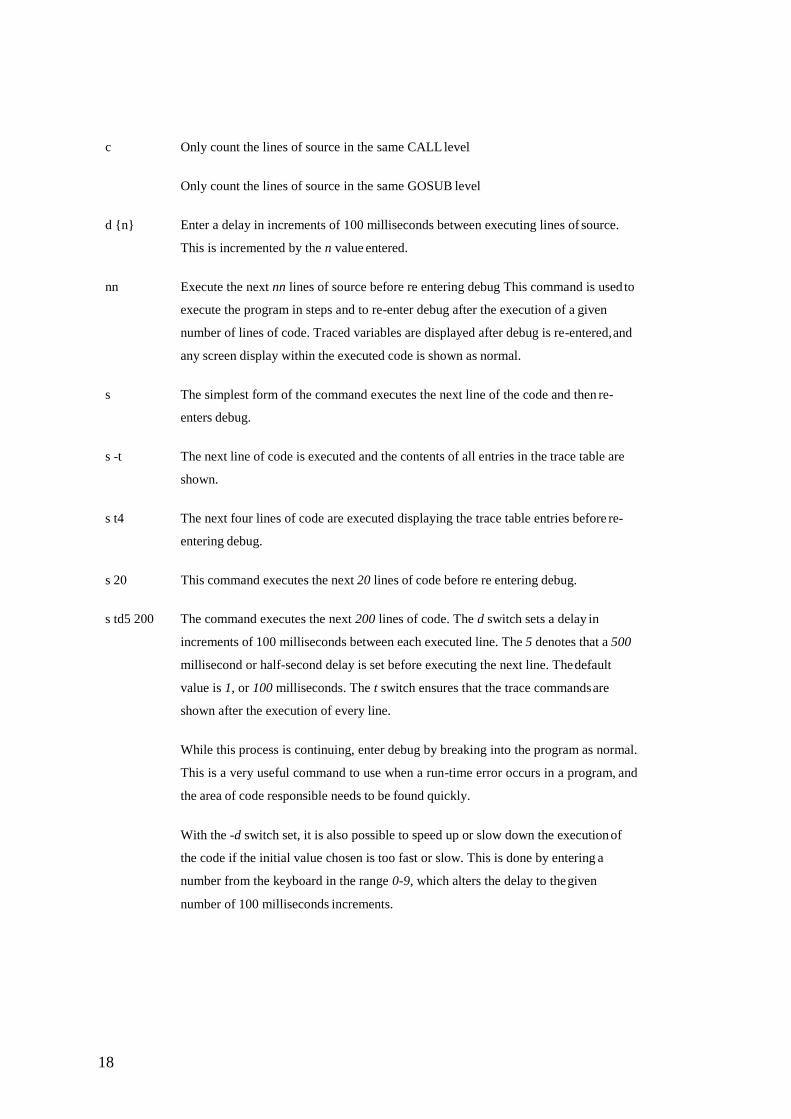
c Only count the lines of source in the same CALL level
Only count the lines of source in the same GOSUB level
d {n} Enter a delay in increments of 100 milliseconds between executing lines of source.
This is incremented by the n value entered.
nn Execute the next nn lines of source before re entering debug This command is used to
execute the program in steps and to re-enter debug after the execution of a given
number of lines of code. Traced variables are displayed after debug is re-entered, and
any screen display within the executed code is shown as normal.
s The simplest form of the command executes the next line of the code and then re-
enters debug.
s -t The next line of code is executed and the contents of all entries in the trace table are
shown.
s t4 The next four lines of code are executed displaying the trace table entries before re-
entering debug.
s 20 This command executes the next 20 lines of code before re entering debug.
s td5 200 The command executes the next 200 lines of code. The d switch sets a delay in
increments of 100 milliseconds between each executed line. The 5 denotes that a 500
millisecond or half-second delay is set before executing the next line. The default
value is 1, or 100 milliseconds. The t switch ensures that the trace commands are
shown after the execution of every line.
While this process is continuing, enter debug by breaking into the program as normal.
This is a very useful command to use when a run-time error occurs in a program, and
the area of code responsible needs to be found quickly.
With the -d switch set, it is also possible to speed up or slow down the execution of
the code if the initial value chosen is too fast or slow. This is done by entering a
number from the keyboard in the range 0-9, which alters the delay to the given
number of 100 milliseconds increments.
19
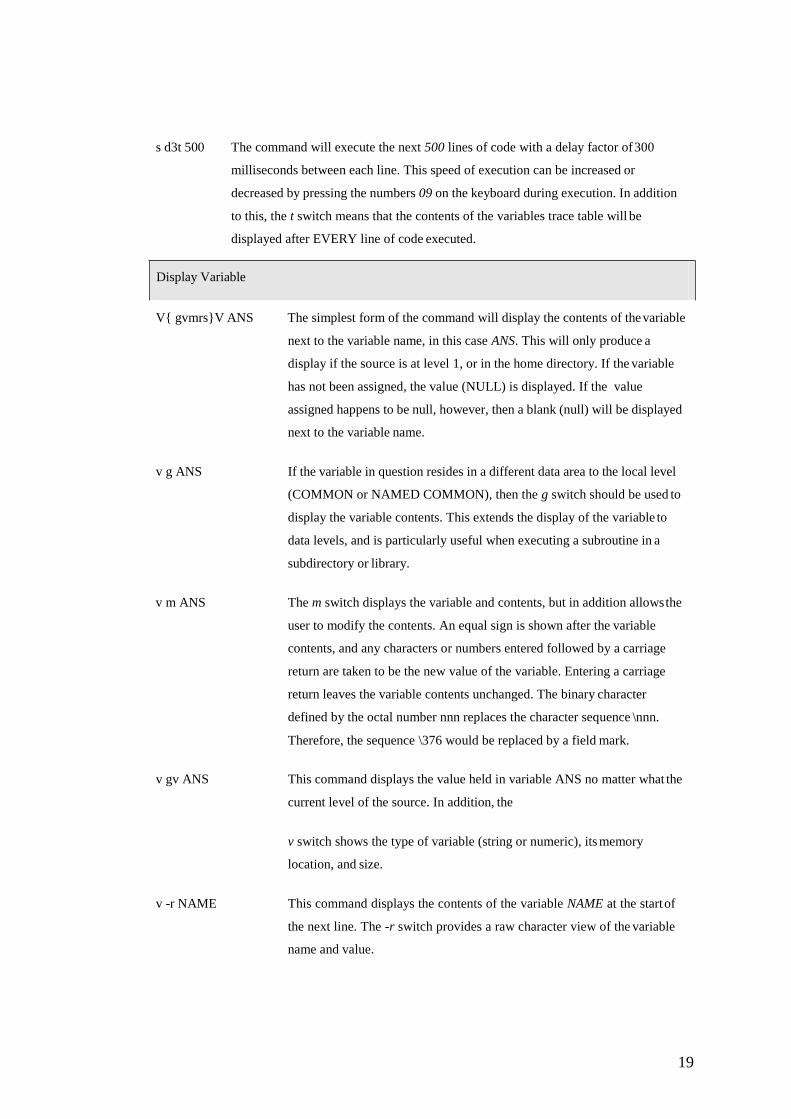
s d3t 500 The command will execute the next 500 lines of code with a delay factor of 300
milliseconds between each line. This speed of execution can be increased or
decreased by pressing the numbers 09 on the keyboard during execution. In addition
to this, the t switch means that the contents of the variables trace table will be
displayed after EVERY line of code executed.
V{ gvmrs}V ANS The simplest form of the command will display the contents of the variable
next to the variable name, in this case ANS. This will only produce a
display if the source is at level 1, or in the home directory. If the variable
has not been assigned, the value (NULL) is displayed. If the value
assigned happens to be null, however, then a blank (null) will be displayed
next to the variable name.
v g ANS If the variable in question resides in a different data area to the local level
(COMMON or NAMED COMMON), then the g switch should be used to
display the variable contents. This extends the display of the variable to
data levels, and is particularly useful when executing a subroutine in a
subdirectory or library.
v m ANS The m switch displays the variable and contents, but in addition allows the
user to modify the contents. An equal sign is shown after the variable
contents, and any characters or numbers entered followed by a carriage
return are taken to be the new value of the variable. Entering a carriage
return leaves the variable contents unchanged. The binary character
defined by the octal number nnn replaces the character sequence \nnn.
Therefore, the sequence \376 would be replaced by a field mark.
v gv ANS This command displays the value held in variable ANS no matter what the
current level of the source. In addition, the
v switch shows the type of variable (string or numeric), its memory
location, and size.
v -r NAME This command displays the contents of the variable NAME at the start of
the next line. The -r switch provides a raw character view of the variable
name and value.
Display Variable
20
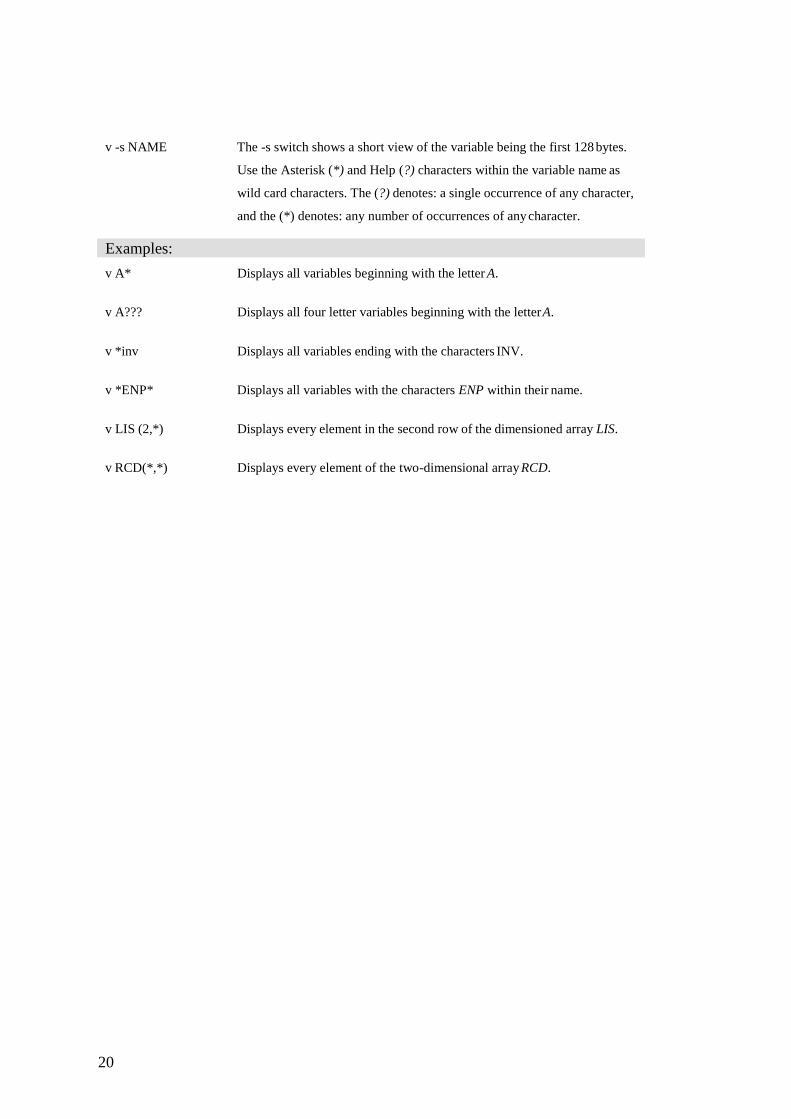
v -s NAME The -s switch shows a short view of the variable being the first 128 bytes.
Use the Asterisk (*) and Help (?) characters within the variable name as
wild card characters. The (?) denotes: a single occurrence of any character,
and the (*) denotes: any number of occurrences of any character.
Examples:
v A* Displays all variables beginning with the letter A.
v A??? Displays all four letter variables beginning with the letter A.
v *inv Displays all variables ending with the characters INV.
v *ENP* Displays all variables with the characters ENP within their name.
v LIS (2,*) Displays every element in the second row of the dimensioned array LIS.
v RCD(*,*) Displays every element of the two-dimensional array RCD.
21
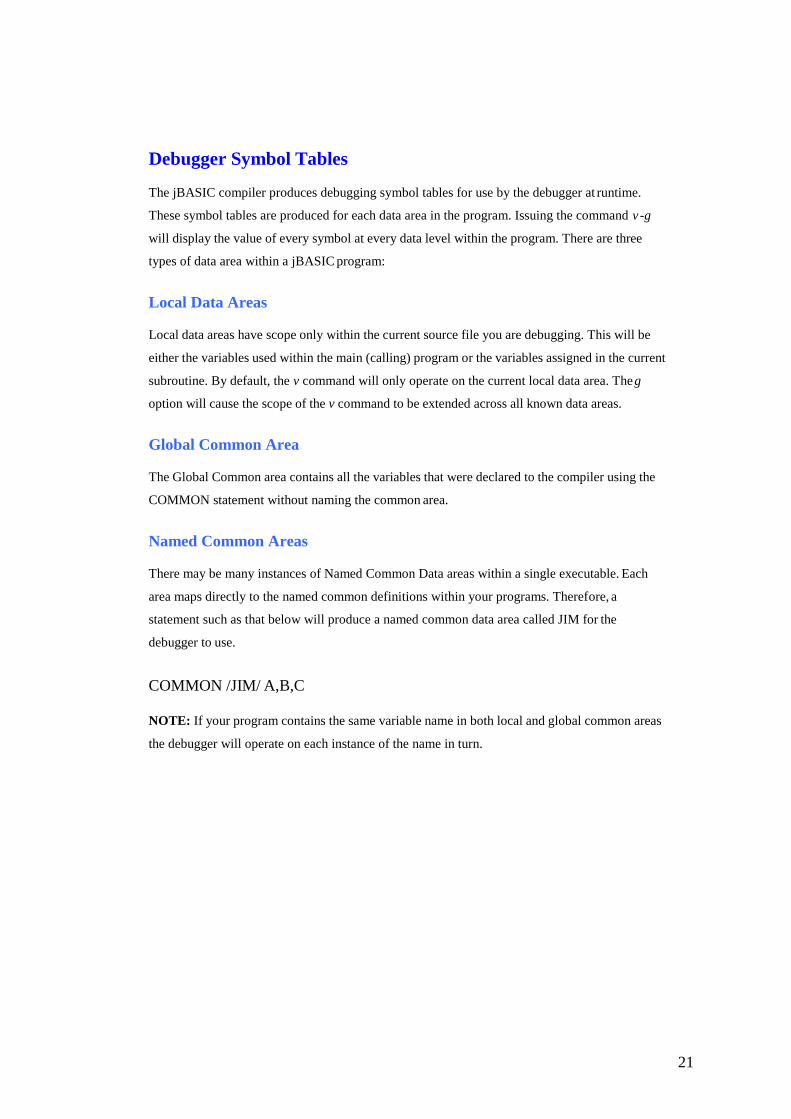
Debugger Symbol Tables
The jBASIC compiler produces debugging symbol tables for use by the debugger at runtime.
These symbol tables are produced for each data area in the program. Issuing the command v -g
will display the value of every symbol at every data level within the program. There are three
types of data area within a jBASIC program:
Local Data Areas
Local data areas have scope only within the current source file you are debugging. This will be
either the variables used within the main (calling) program or the variables assigned in the current
subroutine. By default, the v command will only operate on the current local data area. The g
option will cause the scope of the v command to be extended across all known data areas.
Global Common Area
The Global Common area contains all the variables that were declared to the compiler using the
COMMON statement without naming the common area.
Named Common Areas
There may be many instances of Named Common Data areas within a single executable. Each
area maps directly to the named common definitions within your programs. Therefore, a
statement such as that below will produce a named common data area called JIM for the
debugger to use.
COMMON /JIM/ A,B,C
NOTE: If your program contains the same variable name in both local and global common areas
the debugger will operate on each instance of the name in turn.

Comment Sheet
Please give page number and description for any errors found:
Page Error
Please use the box below to describe any material you think is missing; describe any material
which is not easily understood; enter any suggestions for improvement; provide any specific
examples of how you use your system which you think would be useful to readers of this manual.
Continue on a separate sheet if necessary.
Copy and paste this page to a word document and include your name address and telephone
number. Email to [email protected]