Embed Size (px)
Citation preview
JBoost Optimization of Color Detectors forAutonomous Underwater Vehicle Navigation
Christopher Barngrover, Serge Belongie, and Ryan Kastner
University of California San Diego,Department of Computer Science
Abstract. In the world of autonomous underwater vehicles (AUV) theprominent form of sensing is sonar due to cloudy water conditions anddispersion of light. Although underwater conditions are highly suitablefor sonar, this does not mean that optical sensors should be completelyignored. There are situations where visibility is high, such as in calmwaters, and where light dispersion is not significant, such as in shallowwater or near the surface. In addition, even when visibility is low, oncea certain proximity to an object exists, visibility can increase. The fo-cus of this paper is this gap in capability for AUVs, with an emphasison computer-aided detection through classifier optimization via machinelearning. This paper describes the development of color-based classifi-cation algorithm and its application as a cost-sensitive alternative fornavigation on the small Stingray AUV.
Keywords: Stingray ; AUV ; object detection ; color ; boosting
1 Introduction
The goal of this paper is to use the Stingray platform to investigate object de-tection and classification as a basis for navigation. Reliable navigation on smallAUVs is challenging in the absence of large and expensive sensors for estimatingposition. Using vision to detect and classify objects in the environment can bea source for estimating relative position. The target object can be used as adestination or could act as a path for the vehicle to follow [1]. The focus of thisresearch is on developing robust object classifiers for specific targets based oncolor. The movement of the water and changes in lighting due to refraction andlight dispersion cause colors to blur and change. In order to overcome these diffi-culties, we use a boosting algorithm to optimize the color classifier and improvethe detector capability.
The target destination objects are three different colored buoys, anchoredwith relatively close proximity and varying depth. The buoy colors, chosen fortheir contrast with an underwater environment, are orange, yellow, and greenin decreasing order of contrast. The green buoy should be more difficult to de-tect since it is most similar in color to the background. Once the algorithmcan correctly detect and classify the target buoy, the vehicle demonstrates the
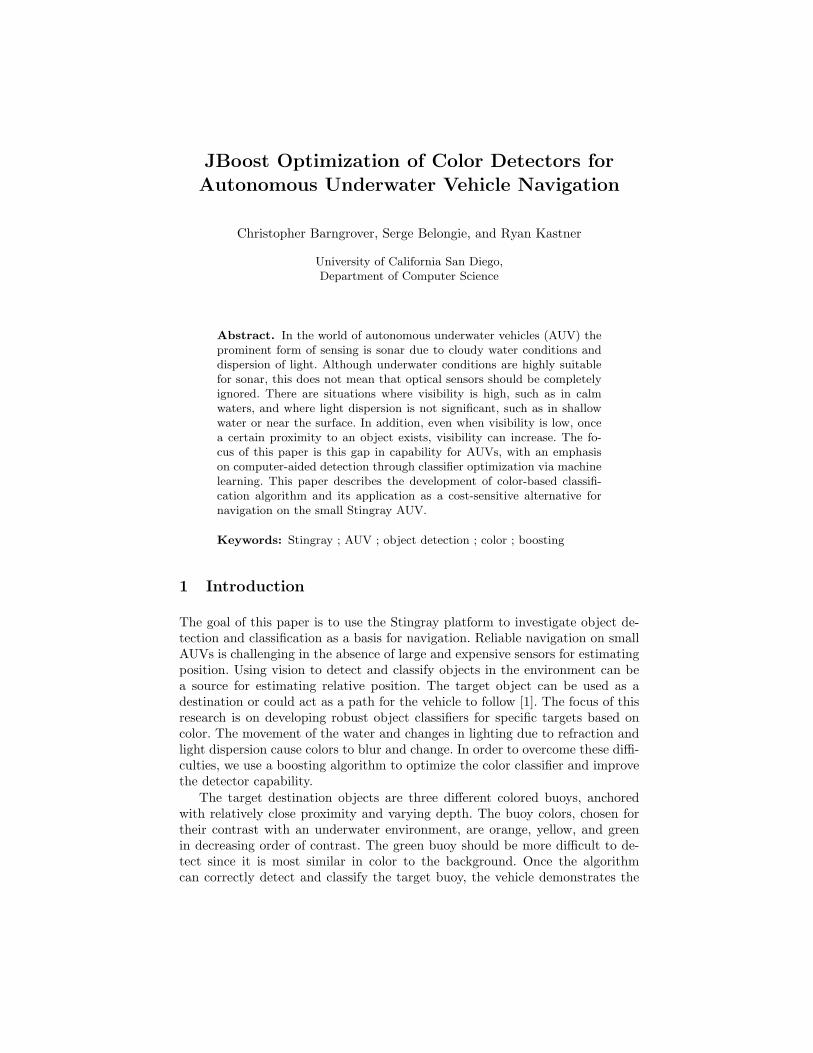
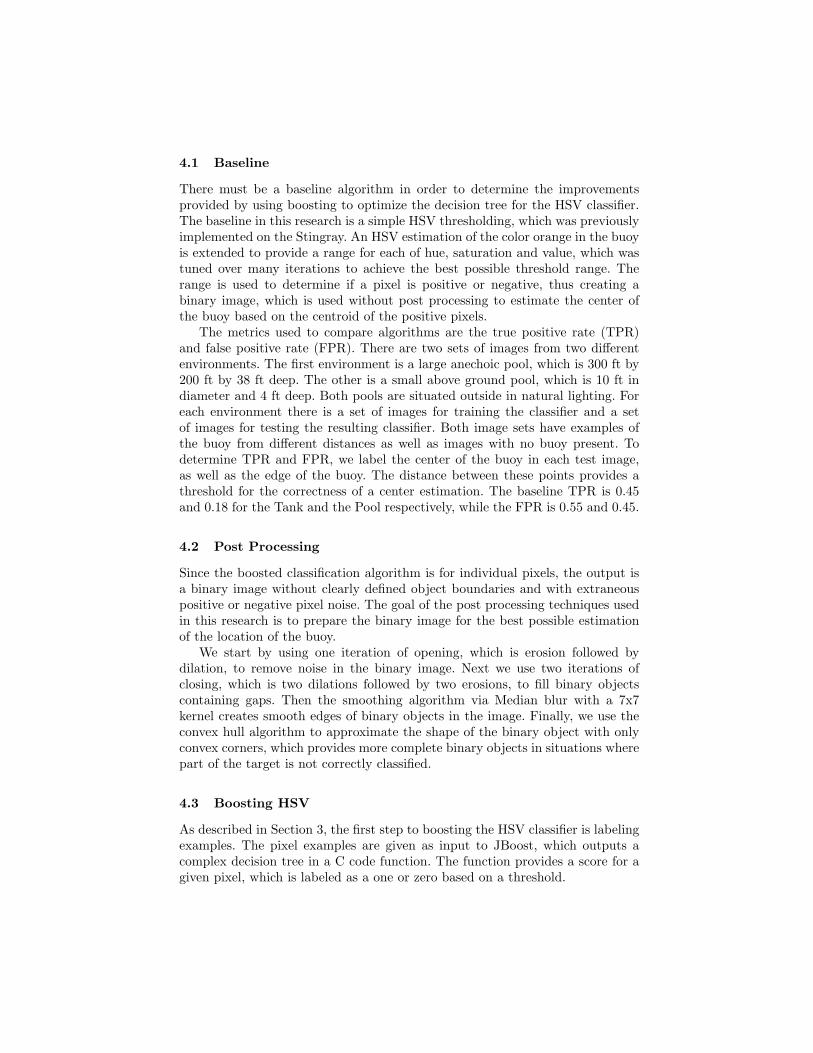
navigation capability by approaching and touching the buoy. The path or bear-ing objects are orange pipes, which are anchored to the bottom. In some casesthere are two pipes with different orientations in the same location. The visionalgorithms detect and classify the pipe and then estimate the orientation. Thevehicle demonstrates the vision-based navigation capability by centering over thepipe and altering its heading based on the estimated orientation. When thereare multiple pipes, the vehicle must decide which direction to navigate. The twotarget types are shown in Figure 1 below.
(a) (b) (c)
Fig. 1. (a) Stingray AUV. (b) Destination buoy objects. (c) Bearing pipe objects.
It turns out that the boosting of the classifiers for the buoys and pipes greatlyimproves the detectors. For the pipe, we show that the bearing estimation be-comes extremely accurate as well. We implement the optimized detectors andbearing estimator on the Stingray, which is able to navigate to the correct buoyand change bearing based on the pipe with high reliability.
The remainder of this paper is organized as follows. In Section 2 we discussrelated work, while in Section 3 we describe our process for developing a clas-sification algorithm. In Sections 4 and 5 we focus on the specific targets of thebuoy and pipe, providing results from the final algorithms for each. Finally, inSection 6 we conclude by discussing the aspects of this research that are noveland the promising directions for future work.
2 Related Work
There has been an increase of research in vision-based navigation for underwatervehicles in recent years. Most of the research focuses on avenues that do notparallel the work in this paper, but there are some similar efforts.
The papers that use landmarks as reference points for underwater navigationare most similar. The work of Yu et al. [7] uses yellow markers and coloredcables for AUV navigation by thresholding the UV components of the YUV colorspace, which is similar to the baseline methods for this paper. Another methodthresholds on the RG components of the RGB color space to detect yellow sensornodes, as presented by Dunbabin et al. [3]. In the research by Soriano et al. [6]
an average histogram is created for each target, which is compared to a regionof interest for classification.
Cable or pipe tracking is another task, which is heavily researched in termsof vision-based systems. The work of Balasuriya et al. [1] shows a method ofusing Laplacian of Gaussian (LoG) filters to detect the edges of the pipe. Forestiet al. [4] use a trained neural network to recognize the pipeline borders, whileZingaretti and Zanoli [8] use vertical edge detection in horizontal strips andcontour density within the strips to detect the pipe.
These papers avoid much of the underwater difficulties, which cause colorsto change based on light absorption, by attaining proximity to the target. Weshow that without boosting, a simple color classifier is not sufficient on our testdata set, which includes images of the targets at substantial distances and undervarying lighting conditions.
3 Developing a Classification Algorithm
The process of developing the classification algorithm generally starts with choos-ing a feature set to describe the target. The feature chosen for these targets iscolor. The Hue-Saturation-Value (HSV) color model is used for its separationof brightness from the hue and saturation pair. Because of this isolation of thebrightness element of a color, a single object is more reliably detectable underdifferent lighting conditions. The more common Red-Green-Blue (RGB) colormodel is an additive model, which makes it difficult to identify the same colorunder different lighting conditions [2].
The boosting algorithm requires a large number of examples in order tooptimize the decision tree. For the HSV color classifier, we labeled individualpixels as positive or negative in terms of the target. The examples, which numberin the hundreds of thousands, are then inputs into the boosting algorithm.
For this research, the LogitBoost form of boosting is used via the JBoostsoftware package. The JBoost application expects the input examples in a stan-dard format with classifier data and a label. JBoost can output the resultingdecision tree visually as well as in Java or C code.
4 Buoy Detection
The buoy targets have the same size and shape, only differing by color. Todevelop the algorithm, we focus first on the orange buoy. Once an algorithm isdeveloped, including the pixel level optimized decision tree and post processing,we can train the classifier for the other buoys. The final algorithm will have apixel decision tree for each color to create a binary image. The binary imagewill be post processed in the same way for each color. The goal is to accuratelyestimate the location of the designated buoy in the image and use the distancefrom the buoy to the center of the image as a heading offset for the Stingrayvehicle.
4.1 Baseline
There must be a baseline algorithm in order to determine the improvementsprovided by using boosting to optimize the decision tree for the HSV classifier.The baseline in this research is a simple HSV thresholding, which was previouslyimplemented on the Stingray. An HSV estimation of the color orange in the buoyis extended to provide a range for each of hue, saturation and value, which wastuned over many iterations to achieve the best possible threshold range. Therange is used to determine if a pixel is positive or negative, thus creating abinary image, which is used without post processing to estimate the center ofthe buoy based on the centroid of the positive pixels.
The metrics used to compare algorithms are the true positive rate (TPR)and false positive rate (FPR). There are two sets of images from two differentenvironments. The first environment is a large anechoic pool, which is 300 ft by200 ft by 38 ft deep. The other is a small above ground pool, which is 10 ft indiameter and 4 ft deep. Both pools are situated outside in natural lighting. Foreach environment there is a set of images for training the classifier and a setof images for testing the resulting classifier. Both image sets have examples ofthe buoy from different distances as well as images with no buoy present. Todetermine TPR and FPR, we label the center of the buoy in each test image,as well as the edge of the buoy. The distance between these points provides athreshold for the correctness of a center estimation. The baseline TPR is 0.45and 0.18 for the Tank and the Pool respectively, while the FPR is 0.55 and 0.45.
4.2 Post Processing
Since the boosted classification algorithm is for individual pixels, the output isa binary image without clearly defined object boundaries and with extraneouspositive or negative pixel noise. The goal of the post processing techniques usedin this research is to prepare the binary image for the best possible estimationof the location of the buoy.
We start by using one iteration of opening, which is erosion followed bydilation, to remove noise in the binary image. Next we use two iterations ofclosing, which is two dilations followed by two erosions, to fill binary objectscontaining gaps. Then the smoothing algorithm via Median blur with a 7x7kernel creates smooth edges of binary objects in the image. Finally, we use theconvex hull algorithm to approximate the shape of the binary object with onlyconvex corners, which provides more complete binary objects in situations wherepart of the target is not correctly classified.
4.3 Boosting HSV
As described in Section 3, the first step to boosting the HSV classifier is labelingexamples. The pixel examples are given as input to JBoost, which outputs acomplex decision tree in a C code function. The function provides a score for agiven pixel, which is labeled as a one or zero based on a threshold.
(a) (b)
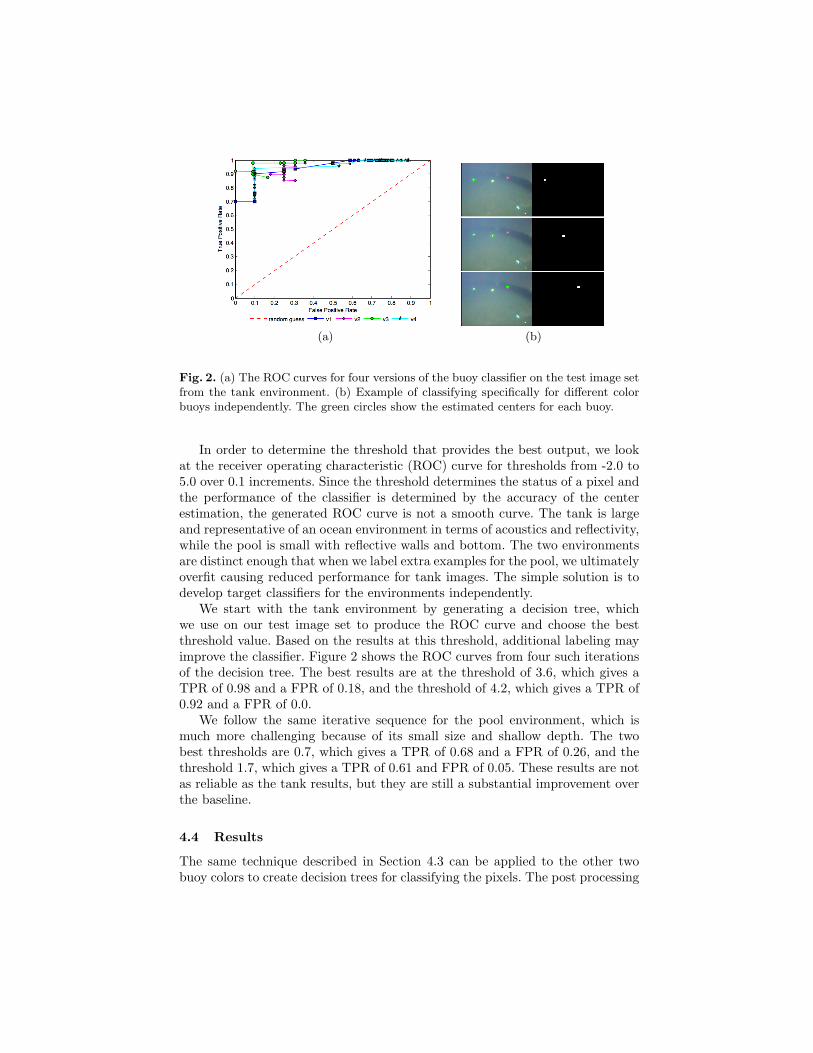
Fig. 2. (a) The ROC curves for four versions of the buoy classifier on the test image setfrom the tank environment. (b) Example of classifying specifically for different colorbuoys independently. The green circles show the estimated centers for each buoy.
In order to determine the threshold that provides the best output, we lookat the receiver operating characteristic (ROC) curve for thresholds from -2.0 to5.0 over 0.1 increments. Since the threshold determines the status of a pixel andthe performance of the classifier is determined by the accuracy of the centerestimation, the generated ROC curve is not a smooth curve. The tank is largeand representative of an ocean environment in terms of acoustics and reflectivity,while the pool is small with reflective walls and bottom. The two environmentsare distinct enough that when we label extra examples for the pool, we ultimatelyoverfit causing reduced performance for tank images. The simple solution is todevelop target classifiers for the environments independently.
We start with the tank environment by generating a decision tree, whichwe use on our test image set to produce the ROC curve and choose the bestthreshold value. Based on the results at this threshold, additional labeling mayimprove the classifier. Figure 2 shows the ROC curves from four such iterationsof the decision tree. The best results are at the threshold of 3.6, which gives aTPR of 0.98 and a FPR of 0.18, and the threshold of 4.2, which gives a TPR of0.92 and a FPR of 0.0.
We follow the same iterative sequence for the pool environment, which ismuch more challenging because of its small size and shallow depth. The twobest thresholds are 0.7, which gives a TPR of 0.68 and a FPR of 0.26, and thethreshold 1.7, which gives a TPR of 0.61 and FPR of 0.05. These results are notas reliable as the tank results, but they are still a substantial improvement overthe baseline.
4.4 Results
The same technique described in Section 4.3 can be applied to the other twobuoy colors to create decision trees for classifying the pixels. The post processing
techniques are the same for each color buoy. This means that the algorithm willswitch between the decision trees based on the target buoy. Figure 2 shows theprocessing of the same image while looking for each of the different color buoys.
When combining the results of the three buoy classification algorithms on thetest image set, we can calculate the total TPR and FPR for the overall algorithmas 0.84 and 0.16 respectively. The relatively low quality of the classifier for thegreen buoy reduces the overall result.
In practice the Stingray is able to reliably detect the designated target buoyat approximately six frames per second and the detection becomes more reliableas the Stingray approaches the buoy.
5 Pipe Detection
The pipe is an interesting target because it provides a bearing for navigation.There can be two pipes leading to different destinations, as shown in Figure1, which means the algorithm needs to be able to classify multiple pipes in asingle image. After determining that a binary object is a pipe, the algorithmmust calculate the orientation. The goal is to use the orientation of the pipe asa target heading for the Stingray vehicle.
5.1 Baseline
The baseline for the pipe, similar to the buoy, is a simple HSV threshold usedto create a binary image on which a custom algorithm, using least squares es-timation, attempts to determine the orientation. This orientation estimationtechnique is not dependable and is only used in the baseline algorithm.
The same metrics are used for the pipe results as are used for the buoys. Themain difference is that there are no examples from a secondary environment.This makes the classification problem slightly easier, so that the problem ofestimating orientation can take focus. The baseline for the Tank is a TPR of0.74 and a FPR of 0.16.
5.2 Classification
The pipe, like the buoy, has a unique color which makes for a useful classifier.The same process of labeling images and inputting the examples into JBoostto optimize a decision tree ultimately outputs a function for scoring individualpixels of the image. The same post processing techniques from Section 4.2 areapplied to the pipe binary images to create smooth and closed binary objects.
The version of the decision tree that produces the best ROC results has twothresholds with a trade off between TPR and FPR. Both of these thresholdsprovide very reliable rates, -0.3 give a TPR of 0.97 and a FPR of 0.02, while thethreshold 0.7 gives a TPR of 0.95 and a FPR of 0.01.
5.3 Bearing Estimation
The overall goal of the pipe detection is to determine the orientation of the pipeto be used as a bearing for navigation purposes. Therefore, with a binary objectfound, only the edges of the object are actually pertinent. The Canny edgedetector, with threshold values of 50 and 150 pixels, is applied to the binaryimage and the output contains only the edges of all binary objects.
With only edges remaining, the Hough Transform can be used to easily esti-mate the straight lines in the image. We use the Probabilistic Hough Transform(PHT) due to its ability to combine similar lines with a gap between them [5].We use a ρ of one pixel and a θ of π
120 or 1.5 degrees. Our threshold is set at30 pixels, with an acceptable line segment length of 20 pixels and an acceptablegap of 20 pixels.
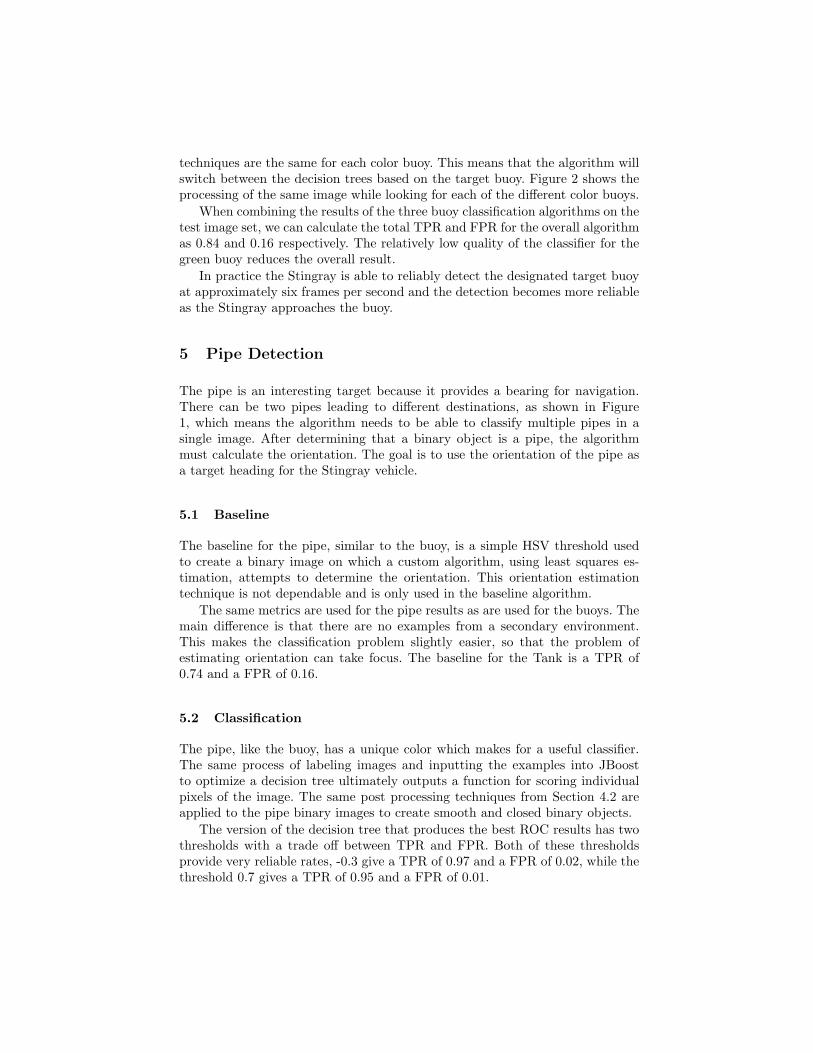
Often times the output from the PHT has extraneous line segments. The goalof the pruning portion of the algorithm is to reduce all the line segments fromthe Hough Transform down to the two per pipe that represent the long edges ofthe pipe. This is broken into two steps, starting with merging all line segmentsthat are close to collinear. The next step is using the property of parallelism toremove extraneous line segments. Figure 3 shows three scenarios where differenttests of parallelism remove extraneous line segments.
Fig. 3. Examples of the three algorithms of the pruning stage. The blue and red circleswith lines show the estimated centers and orientations of the pipes.
5.4 Results
The important result of the pipe detection is the ability to estimate the orienta-tion of the pipe with great precision, in order to provide the vehicle with usefulbearing. Of course, detecting the location of the pipe is necessary to allow forthe bearing estimation, which we have shown to be very reliable.
In order to quantify the accuracy of the bearing estimation, the edges of thepipes are labeled in the test image set and then compared to the algorithm’sestimate. The average error with standard deviation for the baseline algorithmis 9.0◦±14.6◦ compared to 0.7◦±0.8◦ for the hough transform based algorithm.
In practice the Stingray is able to process the images at five frames persecond, allowing the vehicle to center itself over the pipe and estimate the ori-entation. The vehicle then rotates to match its heading with the orientation ofthe pipe, and navigates in that direction.
6 Conclusion
This paper presents a method for using object detection and classification oftarget objects to aid in navigation for AUVs. The color classifier is one uniqueelement of this research, as it is not common in underwater applications. Also,the use of boosting algorithms to optimize the classifier greatly improves onprevious work. We incorporated the use of post processing techniques to makeidentifying the center of the target objects more reliable. We also showed atechnique for calculating the orientation of up to two pipes simultaneously, andwith high precision.
The result is two classification algorithms that are more efficient than thebaseline algorithms of simple thresholding. We demonstrated these algorithmson the Stingray AUV, which navigates towards and touches a specific color ofbuoy and changes heading based on the pipe.
The process we presented for creating an optimized classifier via boosting canbe applied to other targets and with classifiers other than color. The complexand dynamic properties of underwater environments cause these classifiers to bevery specialized, which naturally leads this research towards efforts in adaptivelearning to improve a classifier in real time for changing environments.
References
1. Balasuriya, B.A.A.P., Takai, M., Lam, W.C., Ura, T., Kuroda, Y.: Vision basedautonomous underwater vehicle navigation: underwater cable tracking. In: OCEANSProceedings, pp. 1418–1424 (1997)
2. Cheng, H. D., Jiang, X. H., Sun, Y., Wang, J. L.: Color image segmentation: Ad-vances and prospects. Pattern Recognition 34, 2259–2281 (2001)
3. Dunbabin, M., Corke, P., Vasilescu, I., Rus, D.: Data muling over underwater wire-less sensor networks using an autonomous underwater vehicle. In: IEEE Int. Conf.on Robotics and Automation, pp. 2091–2098 (2006)
4. Foresti, G.L., Gentili, S., Zampato, M.: A vision-based system for autonomous un-derwater vehicle navigation. In: OCEANS Proceedings, pp. 195–199 (1998)
5. Kiryati, N., Eldar, Y., Bruckstein, A. M.: A probabilistic Hough transform. PatternRecognition 24, 303–316 (1991)
6. Soriano, M. and Marcos, S. and Saloma, C. and Quibilan, M. and Alino, P.: Imageclassification of coral reef components from underwater color video. In: OCEANSProceedings, pp. 1008–1013 (2001)
7. Yu, S.C., Ura, T., Fujii, T., Kondo, H.: Navigation of autonomous underwater vehi-cles based on artificial underwater landmarks. In: OCEANS Proceedings, pp. 409–416(2001)
8. Zingaretti, P., Zanoli, S.M.: Robust real-time detection of an underwater pipeline.Engineering Applications of Artificial Intelligence 11, 257–268 (1998)


![1 Sensor-based Formation Control of Autonomous Underwater Vehicles · Sensor-based Formation Control of Autonomous Underwater Vehicles ... optimization-based methods [5], the virtual](https://img.pdfslide.net/doc/110x75/5b913f4309d3f28a7e8dd63e/1-sensor-based-formation-control-of-autonomous-underwater-vehicles-sensor-based.jpg)