Embed Size (px)
Citation preview
JCSDA SSC Meeting, UMBC May 30-31 2007
JCSDA, May 2006 to May 2007
Lars Peter RiishojgaardActing Director
JCSDA SSC Meeting, UMBC May 30-31 2007
The year in review
• JCSDA context and partners• Management and budget• Sensors and impact experiments• Radiative transfer modeling• System development• OSSE capability
JCSDA SSC Meeting, UMBC May 30-31 2007
JCSDA partners
• NASA– GSFC (GMAO and HSB)
• NOAA– EMC– STAR– ESRL
• DoD– AFWA– NRL/Monterey
JCSDA SSC Meeting, UMBC May 30-31 2007
Management• Leadership transition
– New acting director– Two new deputies (Fuzhong Weng, Michele
Rienecker)– NESDIS senior scientist assigned to JCSDA for
ocean DA planning activities (Eric Bayler)• Memorandum of Agreement appears close to
signing• First JCSDA Executive Retreat June 2007
JCSDA SSC Meeting, UMBC May 30-31 2007
JCSDA SSC Meeting, UMBC May 30-31 2007
JCSDA budget
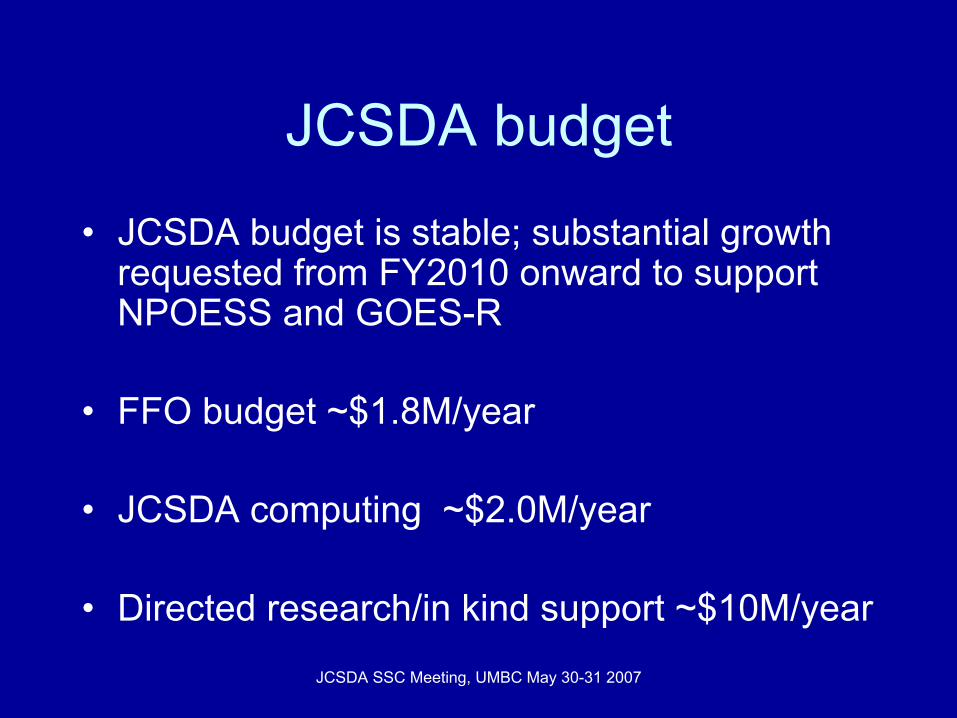
• JCSDA budget is stable; substantial growth requested from FY2010 onward to support NPOESS and GOES-R
• FFO budget ~$1.8M/year
• JCSDA computing ~$2.0M/year
• Directed research/in kind support ~$10M/year
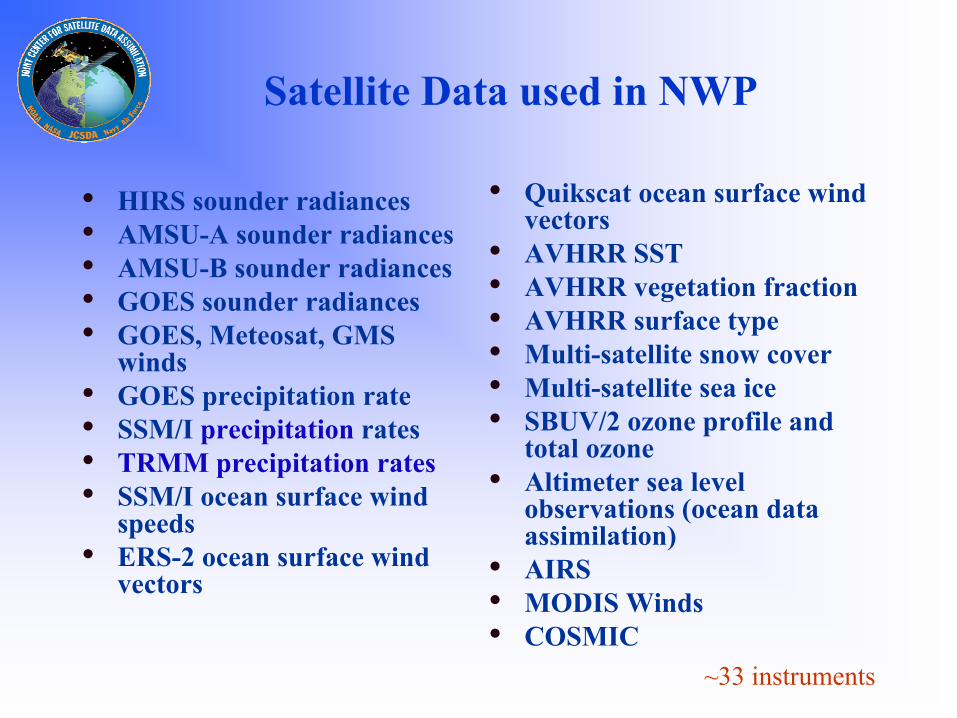
Satellite Data used in NWP
• HIRS sounder radiances• AMSU-A sounder radiances• AMSU-B sounder radiances• GOES sounder radiances• GOES, Meteosat, GMS
winds• GOES precipitation rate• SSM/I precipitation rates• TRMM precipitation rates• SSM/I ocean surface wind
speeds• ERS-2 ocean surface wind
vectors
• Quikscat ocean surface wind vectors
• AVHRR SST• AVHRR vegetation fraction• AVHRR surface type• Multi-satellite snow cover• Multi-satellite sea ice• SBUV/2 ozone profile and
total ozone• Altimeter sea level
observations (ocean data assimilation)
• AIRS• MODIS Winds• COSMIC
~33 instruments
JCSDA SSC Meeting, UMBC May 30-31 2007
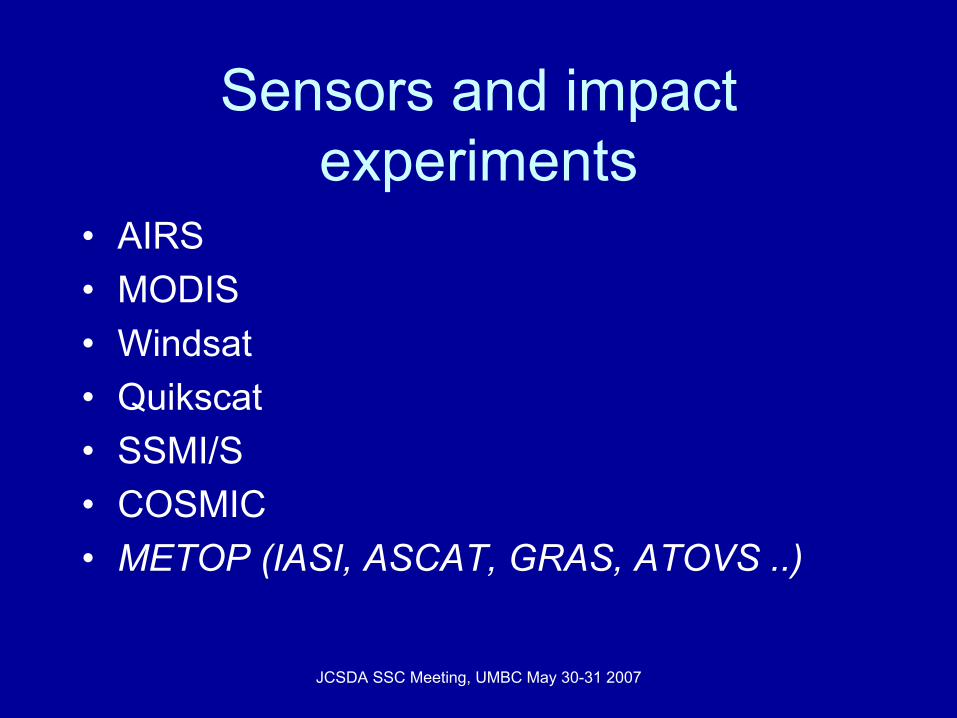
Sensors and impact experiments
• AIRS• MODIS• Windsat• Quikscat• SSMI/S• COSMIC• METOP (IASI, ASCAT, GRAS, ATOVS ..)

Table 2: AIRS Data Usage per Six Hourly Analysis Cycle
~200x106 radiances (channels) ~2.1x10⁶ radiances (channels)~0.85x10⁶ radiances (channels)
Total Data Input to AnalysisData Selected for Possible UseData Used in 3D VAR Analysis(Clear Radiances)
Number of AIRS ChannelsData Category
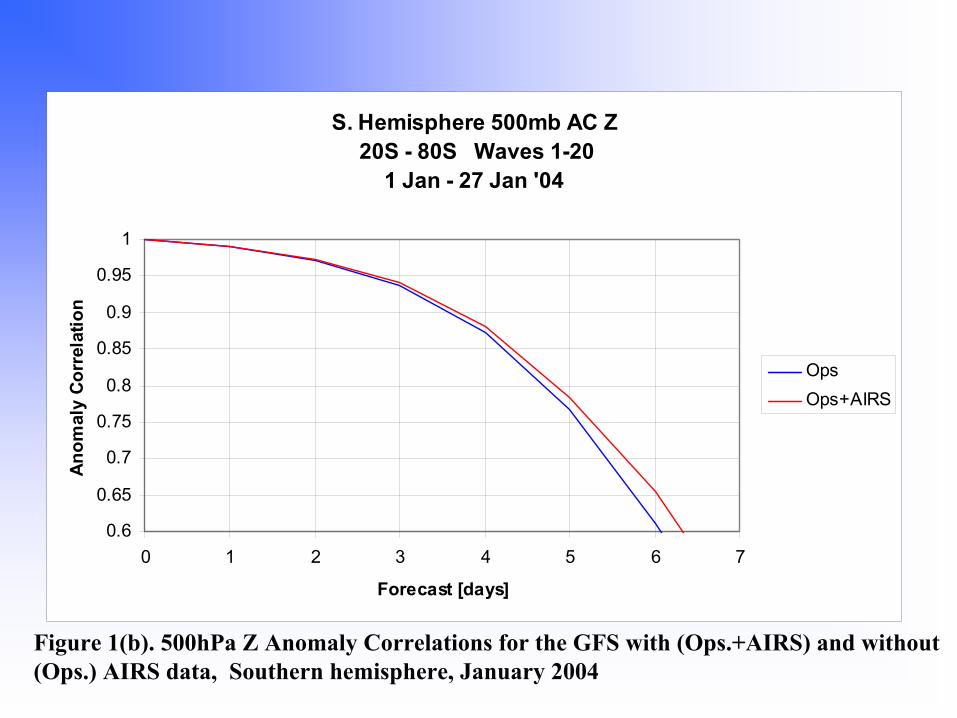
Figure 1(b). 500hPa Z Anomaly Correlations for the GFS with (Ops.+AIRS) and without (Ops.) AIRS data, Southern hemisphere, January 2004
S. Hemisphere 500mb AC Z 20S - 80S Waves 1-20
1 Jan - 27 Jan '04
0.6
0.65
0.7
0.75
0.8
0.85
0.9
0.95
1
0 1 2 3 4 5 6 7
Forecast [days]
Anom
aly
Corr
elat
ion
OpsOps+AIRS

Figure 3(b). 500hPa Z Anomaly Correlations for the GFS with (Ops.+AIRS) and without (Ops.) AIRS data, Northern hemisphere, January 2004
N. Hemisphere 500 mb AC Z 20N - 80N Waves 1-20
1 Jan - 27 Jan '04
0.6
0.65
0.7
0.75
0.8
0.85
0.9
0.95
1
0 1 2 3 4 5 6 7
Forecast [days]
Ano
mal
y C
orre
latio
n
OpsOps+AIRS
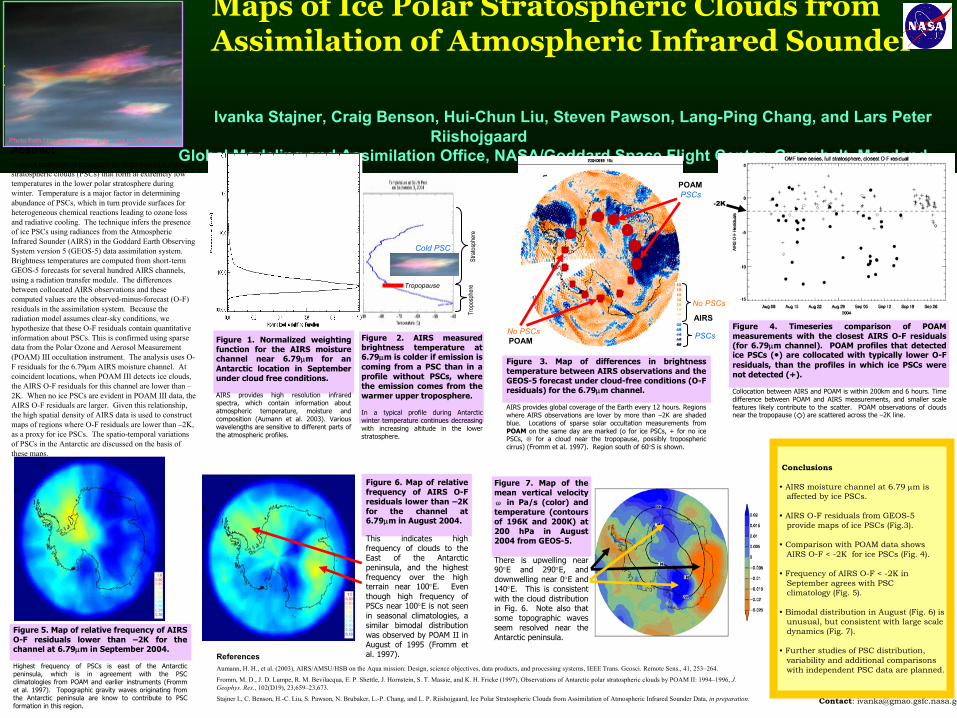
Figure 1. Normalized weighting function for the AIRS moisture channel near 6.79µm for an Antarctic location in September under cloud free conditions.
AIRS provides high resolution infrared spectra, which contain information about atmospheric temperature, moisture and composition (Aumann et al. 2003). Various wavelengths are sensitive to different parts of the atmospheric profiles.
Maps of Ice Polar Stratospheric Clouds from Assimilation of Atmospheric Infrared Sounder
DataIvanka Stajner, Craig Benson, Hui-Chun Liu, Steven Pawson, Lang-Ping Chang, and Lars Peter
RiishojgaardGlobal Modeling and Assimilation Office, NASA/Goddard Space Flight Center, Greenbelt, MarylandAbstract
A novel technique is presented for detection of ice polar stratospheric clouds (PSCs) that form at extremely low temperatures in the lower polar stratosphere during winter. Temperature is a major factor in determining abundance of PSCs, which in turn provide surfaces for heterogeneous chemical reactions leading to ozone loss and radiative cooling. The technique infers the presence of ice PSCs using radiances from the Atmospheric Infrared Sounder (AIRS) in the Goddard Earth Observing System version 5 (GEOS-5) data assimilation system. Brightness temperatures are computed from short-term GEOS-5 forecasts for several hundred AIRS channels, using a radiation transfer module. The differences between collocated AIRS observations and these computed values are the observed-minus-forecast (O-F) residuals in the assimilation system. Because the radiation model assumes clear-sky conditions, we hypothesize that these O-F residuals contain quantitative information about PSCs. This is confirmed using sparse data from the Polar Ozone and Aerosol Measurement (POAM) III occultation instrument. The analysis uses O-F residuals for the 6.79µm AIRS moisture channel. At coincident locations, when POAM III detects ice clouds, the AIRS O-F residuals for this channel are lower than –2K. When no ice PSCs are evident in POAM III data, the AIRS O-F residuals are larger. Given this relationship, the high spatial density of AIRS data is used to construct maps of regions where O-F residuals are lower than –2K, as a proxy for ice PSCs. The spatio-temporal variations of PSCs in the Antarctic are discussed on the basis of these maps.
Cold PSC
Figure 2. AIRS measured brightness temperature at 6.79µm is colder if emission is coming from a PSC than in a profile without PSCs, where the emission comes from the warmer upper troposphere.
In a typical profile during Antarctic winter temperature continues decreasing with increasing altitude in the lower stratosphere.
Figure 3. Map of differences in brightness temperature between AIRS observations and the GEOS-5 forecast under cloud-free conditions (O-F residuals) for the 6.79µm channel.
AIRS provides global coverage of the Earth every 12 hours. Regions where AIRS observations are lover by more than –2K are shaded blue. Locations of sparse solar occultation measurements from POAM on the same day are marked (o for ice PSCs, + for no ice PSCs, ⊕ for a cloud near the tropopause, possibly tropospheric cirrus) (Fromm et al. 1997). Region south of 60°S is shown.
Figure 4. Timeseries comparison of POAM measurements with the closest AIRS O-F residuals (for 6.79µm channel). POAM profiles that detected ice PSCs (●) are collocated with typically lower O-F residuals, than the profiles in which ice PSCs were not detected (+).
Collocation between AIRS and POAM is within 200km and 6 hours. Time difference between POAM and AIRS measurements, and smaller scalefeatures likely contribute to the scatter. POAM observations of clouds near the tropopause (⃟) are scattered across the –2K line.
PSCs
No PSCs
-2K
Figure 6. Map of relative frequency of AIRS O-F residuals lower than –2K for the channel at 6.79µm in August 2004.
This indicates high frequency of clouds to the East of the Antarctic peninsula, and the highest frequency over the high terrain near 100°E. Even though high frequency of PSCs near 100°E is not seen in seasonal climatologies, a similar bimodal distribution was observed by POAM II in August of 1995 (Fromm et al. 1997).
Figure 5. Map of relative frequency of AIRS O-F residuals lower than –2K for the channel at 6.79µm in September 2004.
Highest frequency of PSCs is east of the Antarctic peninsula, which is in agreement with the PSC climatologies from POAM and earlier instruments (Fromm et al. 1997). Topographic gravity waves originating from the Antarctic peninsula are know to contribute to PSC formation in this region.
Figure 7. Map of the mean vertical velocity ω in Pa/s (color) and temperature (contours of 196K and 200K) at 200 hPa in August 2004 from GEOS-5.
There is upwelling near 90°E and 290°E, and downwelling near 0°E and 140°E. This is consistent with the cloud distribution in Fig. 6. Note also that some topographic waves seem resolved near the Antarctic peninsula.
Tropopause
Trop
osph
ere
Stra
tosph
ere
ReferencesAumann, H. H., et al. (2003), AIRS/AMSU/HSB on the Aqua mission: Design, science objectives, data products, and processing systems, IEEE Trans. Geosci. Remote Sens., 41, 253–264.
Fromm, M. D., J. D. Lumpe, R. M. Bevilacqua, E. P. Shettle, J. Hornstein, S. T. Massie, and K. H. Fricke (1997), Observations of Antarctic polar stratospheric clouds by POAM II: 1994–1996, J. Geophys. Res., 102(D19), 23,659–23,673.
Stajner I., C. Benson, H.-C. Liu, S. Pawson, N. Brubaker, L.-P. Chang, and L. P. Riishojgaard, Ice Polar Stratospheric Clouds from Assimilation of Atmospheric Infrared Sounder Data, in preparation. Contact: [email protected]
Photo from http://ozonewatch.gsfc.nasa.gov/facts/hole.html
PSCs
No PSCs
AIRS
POAM
POAM
Conclusions
• AIRS moisture channel at 6.79 µm isaffected by ice PSCs.
• AIRS O-F residuals from GEOS-5 provide maps of ice PSCs (Fig.3).
• Comparison with POAM data shows AIRS O-F < -2K for ice PSCs (Fig. 4).
• Frequency of AIRS O-F < -2K in September agrees with PSC climatology (Fig. 5).
• Bimodal distribution in August (Fig. 6) is unusual, but consistent with large scale dynamics (Fig. 7).
• Further studies of PSC distribution, variability and additional comparisons with independent PSC data are planned.
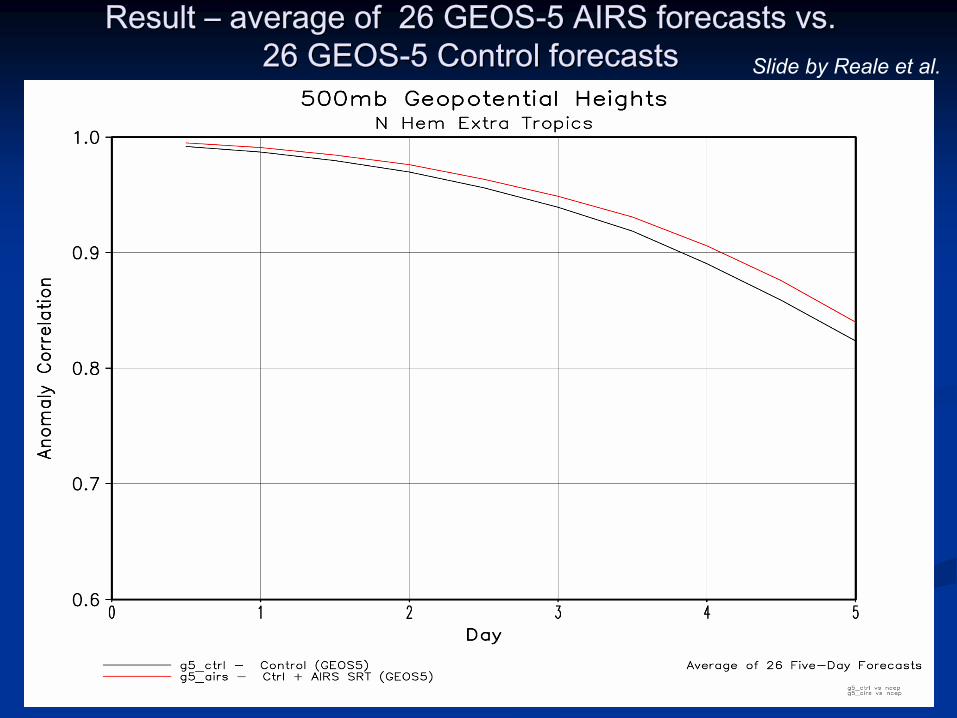
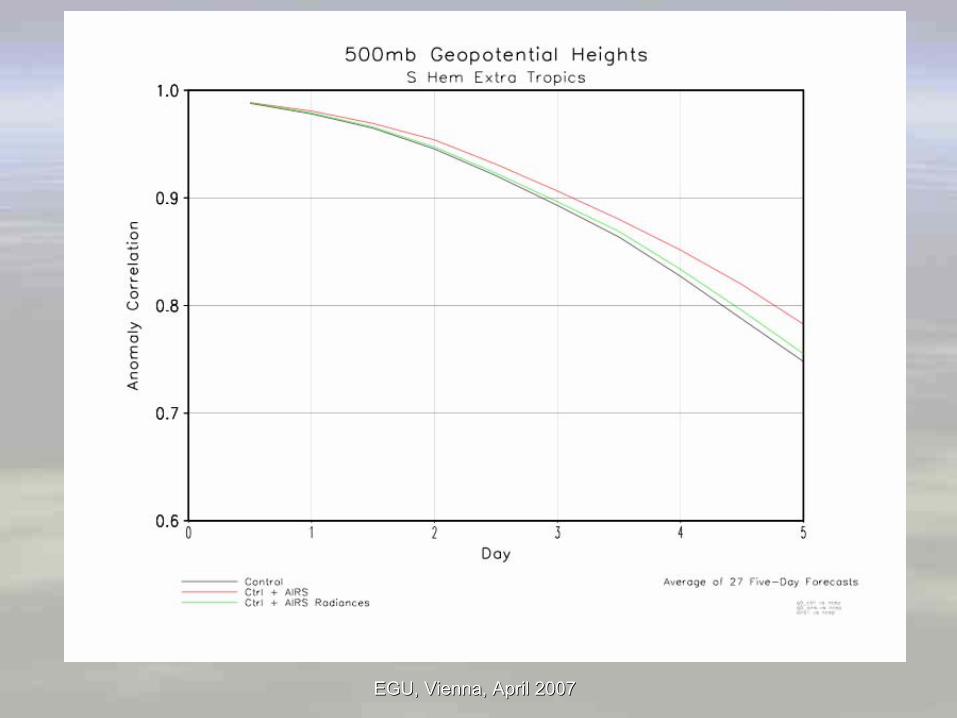
Result Result –– average of 26 GEOSaverage of 26 GEOS--5 AIRS forecasts vs. 5 AIRS forecasts vs. 26 GEOS26 GEOS--5 Control forecasts 5 Control forecasts Slide by Reale et al.
EGU, Vienna, April 2007EGU, Vienna, April 2007
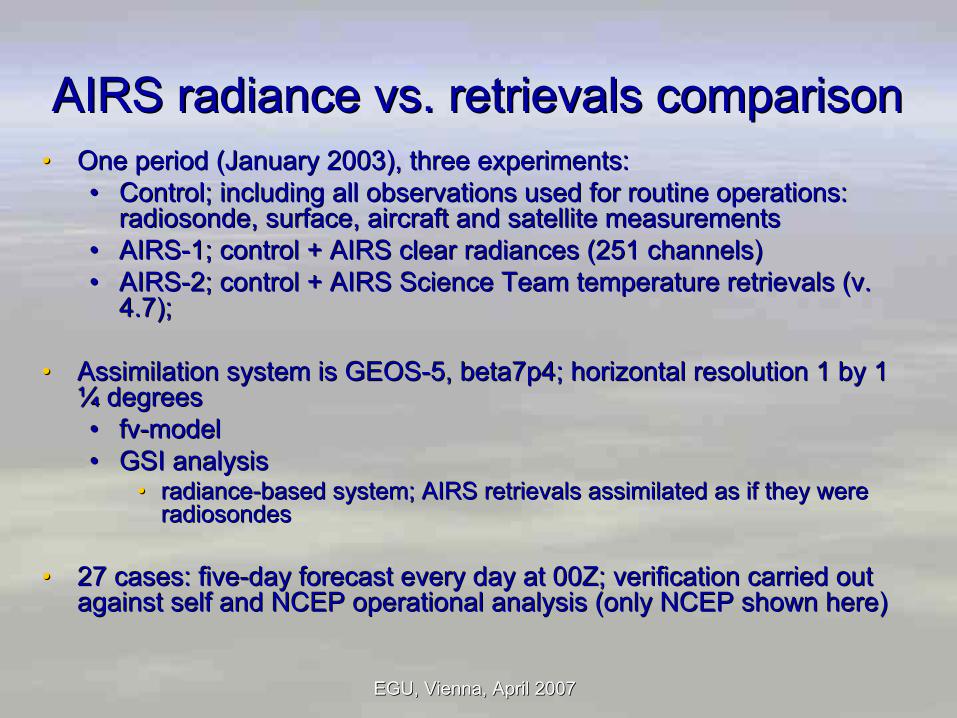
AIRS radiance vs. retrievals comparisonAIRS radiance vs. retrievals comparison•• One period (January 2003), three experiments:One period (January 2003), three experiments:
•• Control; including all observations used for routine operations:Control; including all observations used for routine operations:radiosonderadiosonde, surface, aircraft and satellite measurements, surface, aircraft and satellite measurements
•• AIRSAIRS--1; control + AIRS clear radiances (251 channels)1; control + AIRS clear radiances (251 channels)•• AIRSAIRS--2; control + AIRS Science Team temperature retrievals (v. 2; control + AIRS Science Team temperature retrievals (v.
4.7);4.7);
•• Assimilation system is GEOSAssimilation system is GEOS--5, beta7p4; horizontal resolution 1 by 1 5, beta7p4; horizontal resolution 1 by 1 ¼¼ degreesdegrees•• fvfv--modelmodel•• GSI analysis GSI analysis
•• radianceradiance--based system; AIRS retrievals assimilated as if they were based system; AIRS retrievals assimilated as if they were radiosondesradiosondes
•• 27 cases: five27 cases: five--day forecast every day at 00Z; vday forecast every day at 00Z; verification carried out erification carried out against self and NCEP operational analysis (only NCEP shown hereagainst self and NCEP operational analysis (only NCEP shown here))
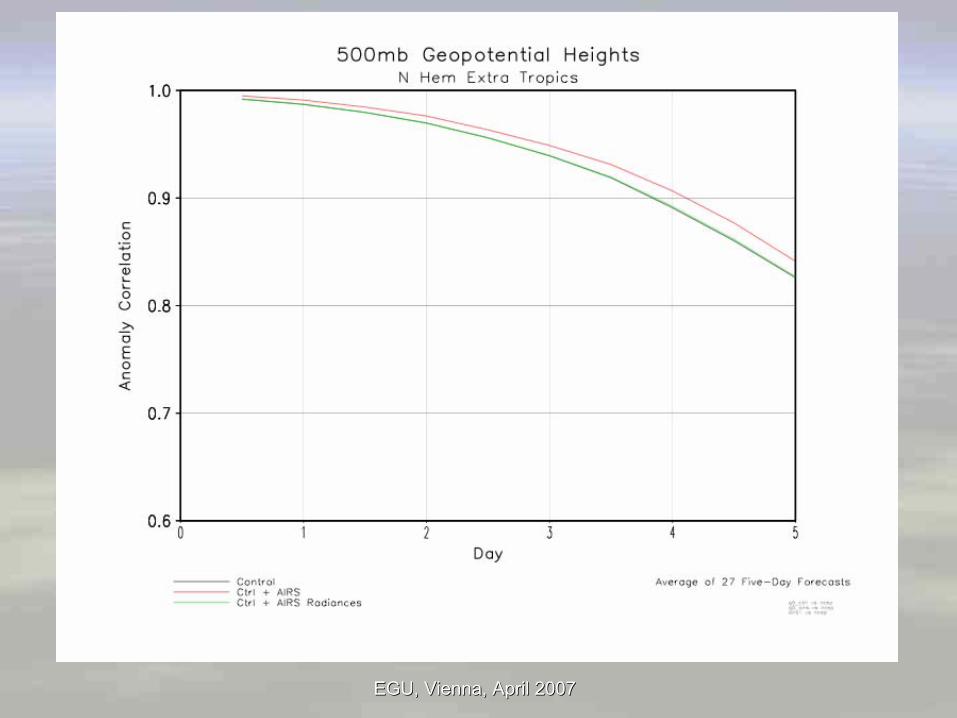
EGU, Vienna, April 2007EGU, Vienna, April 2007
EGU, Vienna, April 2007EGU, Vienna, April 2007
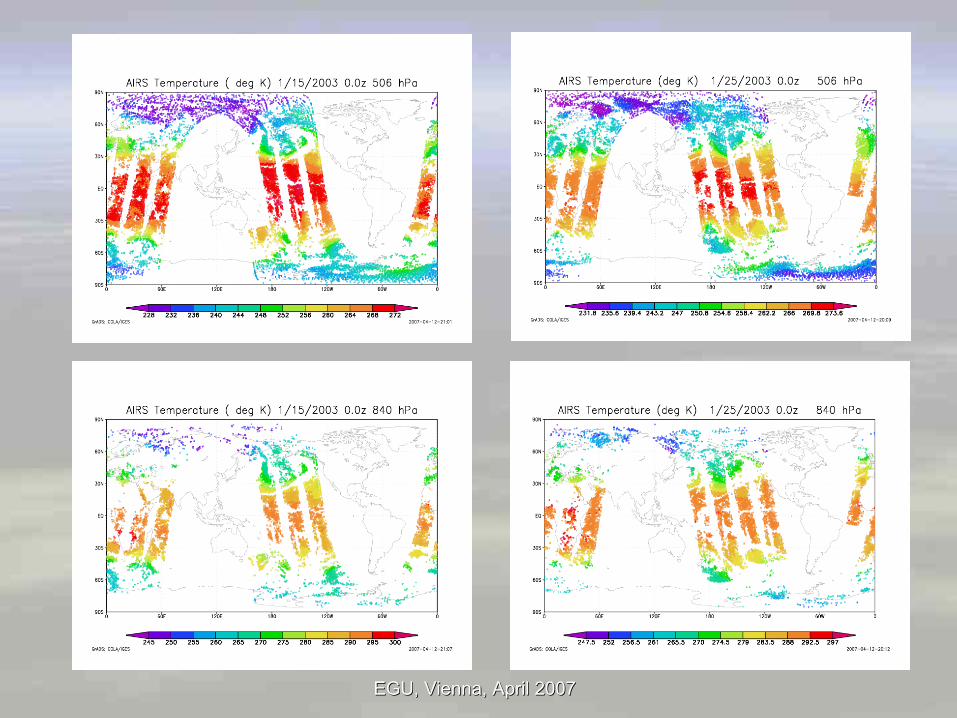
EGU, Vienna, April 2007EGU, Vienna, April 2007
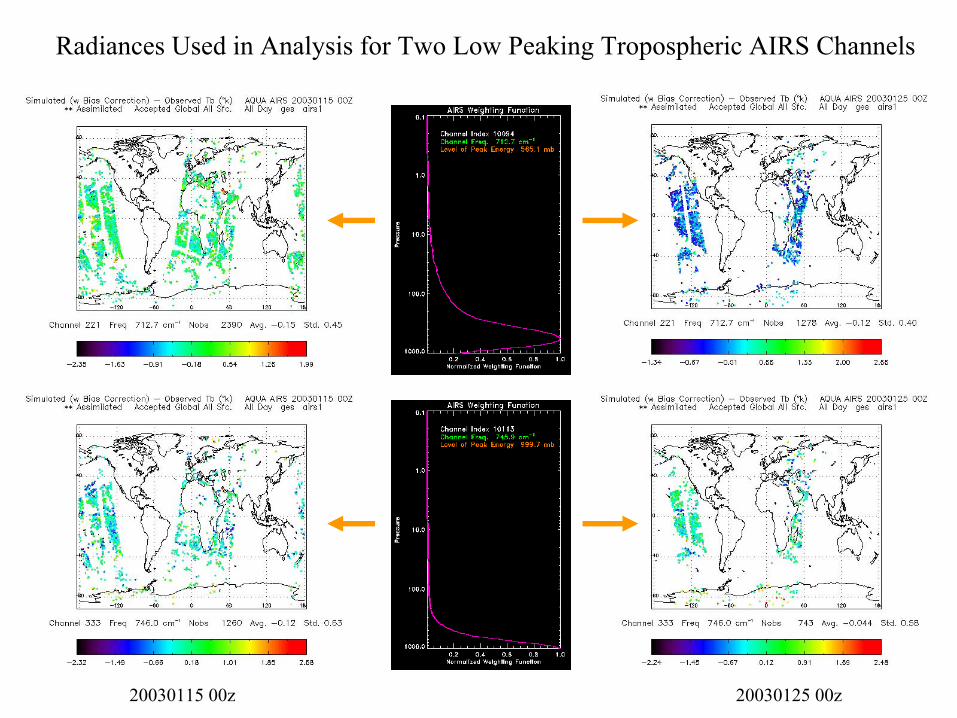
Radiances Used in Analysis for Two Low Peaking Tropospheric AIRS Channels
20030115 00z 20030125 00z
-30
-25
-20
-15
-10
-5
0
5
10
15
20
25
amsu
aam
sub
airs
hirsgoes
eos_
amsu
amsurao
bssa
twinds
spss
miair
craft
surfa
ceqks
wnd
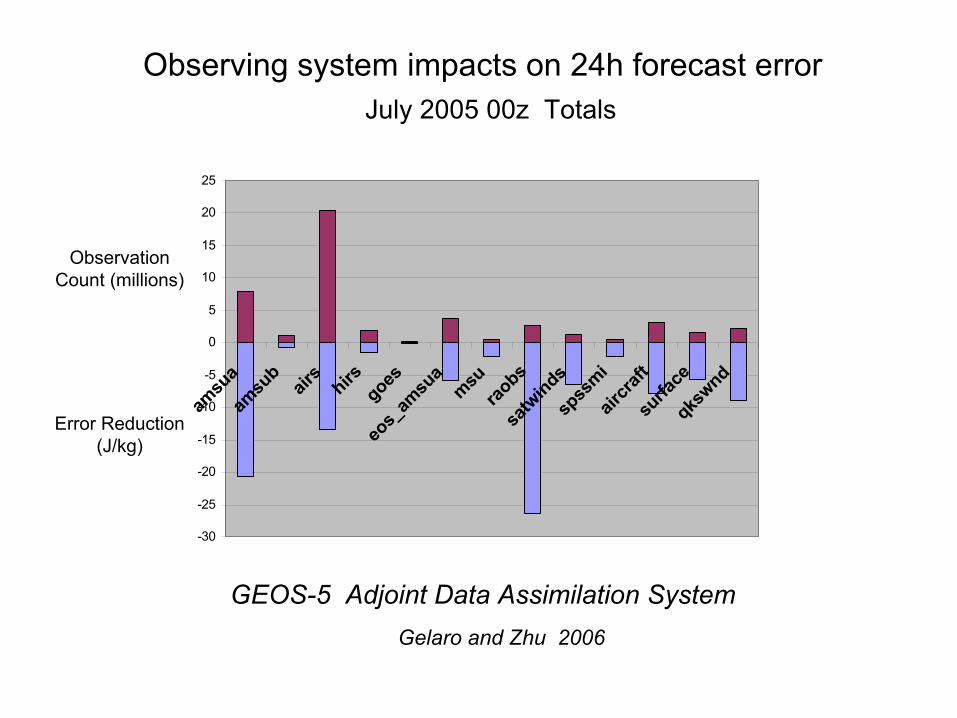
Observing system impacts on 24h forecast error
GEOS-5 Adjoint Data Assimilation System
Observation Count (millions)
Error Reduction (J/kg)
July 2005 00z Totals
Gelaro and Zhu 2006
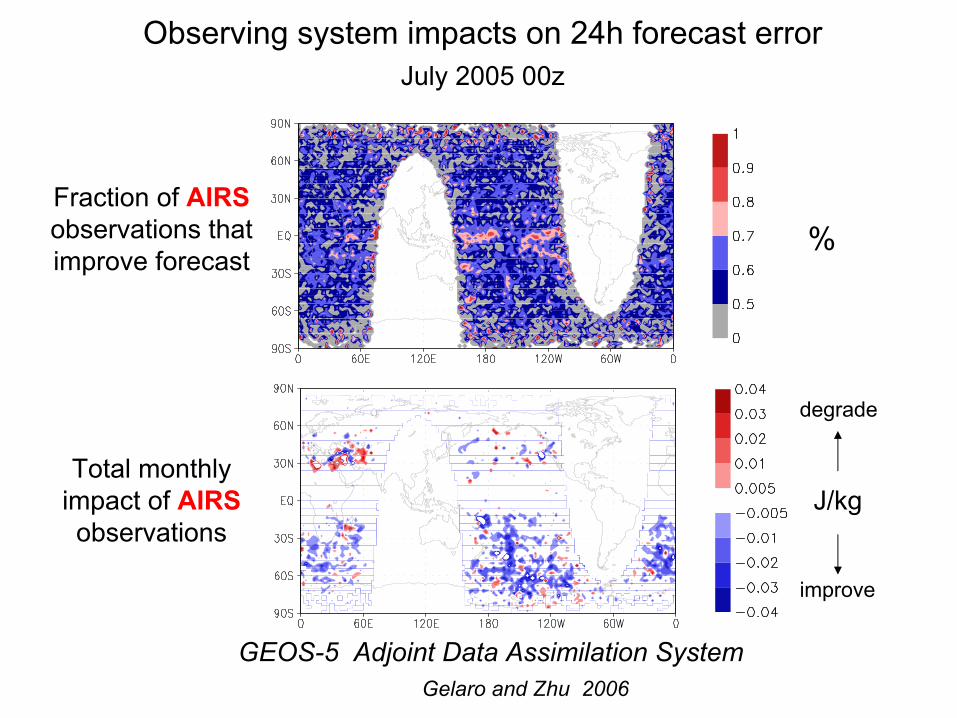
Observing system impacts on 24h forecast error
GEOS-5 Adjoint Data Assimilation System
July 2005 00z
Fraction of AIRSobservations that improve forecast
Total monthly impact of AIRSobservations
%
J/kg
improve
degrade
Gelaro and Zhu 2006
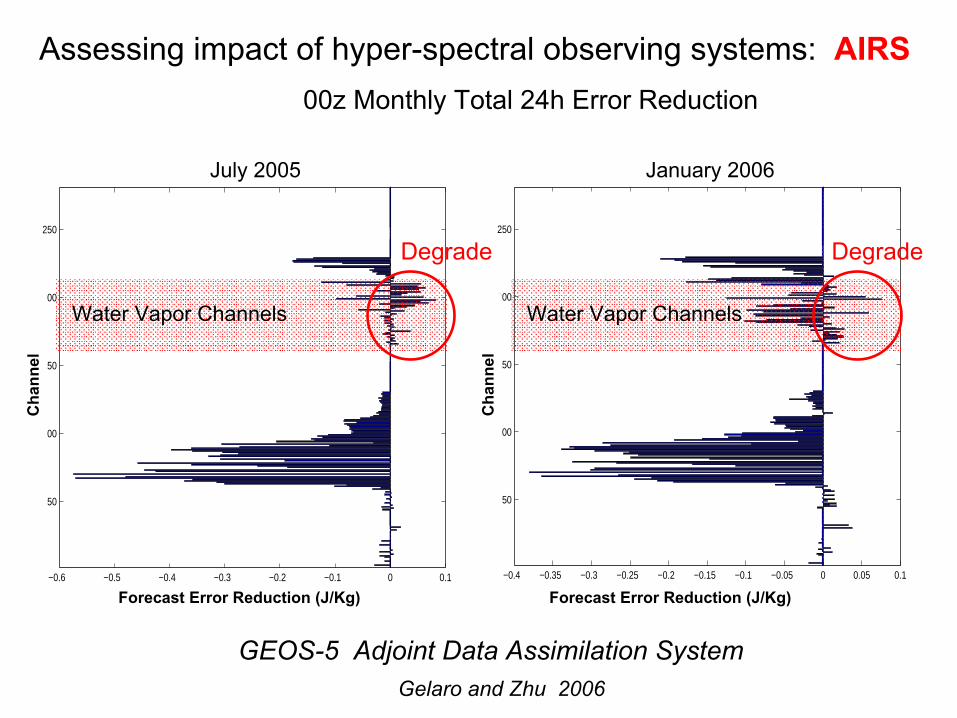
−0.6 −0.5 −0.4 −0.3 −0.2 −0.1 0 0.1
50
100
150
200
250
Ch
an
ne
ls
Forecast Error Reduction (J/kg) −0.4 −0.35 −0.3 −0.25 −0.2 −0.15 −0.1 −0.05 0 0.05 0.1
50
100
150
200
250
Ch
an
ne
ls
Forecast Error Reduction (J/kg)
Assessing impact of hyper-spectral observing systems: AIRS
July 2005 January 2006
Water Vapor Channels Water Vapor Channels
Forecast Error Reduction (J/Kg) Forecast Error Reduction (J/Kg)
Cha
nnel
Cha
nnel
00z Monthly Total 24h Error Reduction
GEOS-5 Adjoint Data Assimilation System
Degrade Degrade
Gelaro and Zhu 2006
JCSDA SSC Meeting, UMBC May 30-31 2007
JCSDA SSC Meeting, UMBC May 30-31 2007
EGU, Vienna, April 2007EGU, Vienna, April 2007
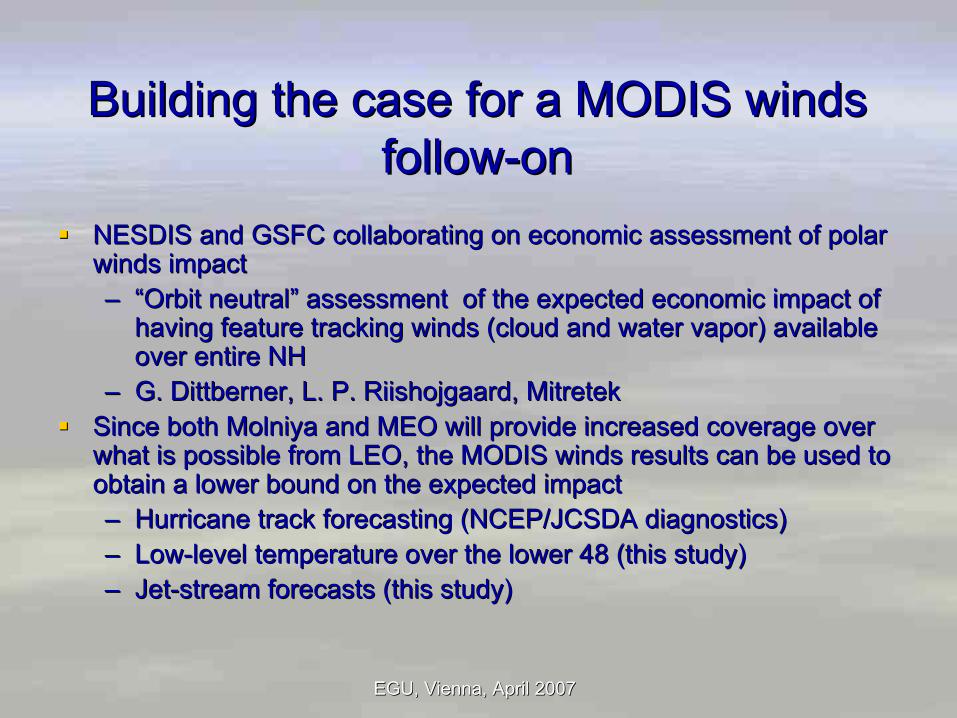
Building the case for a MODIS winds Building the case for a MODIS winds followfollow--onon
NESDIS and GSFC collaborating on economic assessment of polar NESDIS and GSFC collaborating on economic assessment of polar winds impactwinds impact–– ““Orbit neutralOrbit neutral”” assessment of the expected economic impact of assessment of the expected economic impact of
having feature tracking winds (cloud and water vapor) available having feature tracking winds (cloud and water vapor) available over entire NHover entire NH
–– G. G. DittbernerDittberner, L. P. , L. P. RiishojgaardRiishojgaard, , MitretekMitretekSince both Since both MolniyaMolniya and MEO will provide increased coverage over and MEO will provide increased coverage over what is possible from LEO, the MODIS winds results can be used twhat is possible from LEO, the MODIS winds results can be used to o obtain a lower bound on the expected impactobtain a lower bound on the expected impact–– Hurricane track forecasting (NCEP/JCSDA diagnostics)Hurricane track forecasting (NCEP/JCSDA diagnostics)–– LowLow--level temperature over the lower 48 (this study)level temperature over the lower 48 (this study)–– JetJet--stream forecasts (this study)stream forecasts (this study)
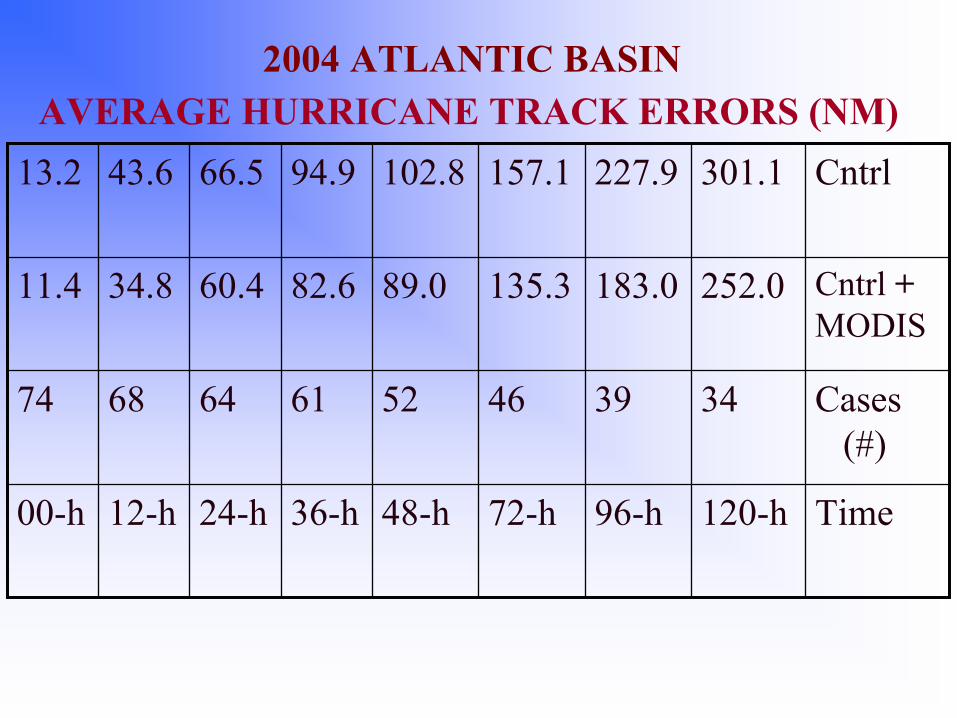
Time120-h96-h72-h48-h36-h24-h12-h00-h
Cases(#)
3439465261646874
Cntrl +MODIS
252.0183.0135.389.082.660.434.811.4
Cntrl301.1227.9157.1102.894.966.543.613.2AVERAGE HURRICANE TRACK ERRORS (NM)
2004 ATLANTIC BASIN
EGU, Vienna, April 2007EGU, Vienna, April 2007
EGU, Vienna, April 2007EGU, Vienna, April 2007
JCSDA SSC Meeting, UMBC May 30-31 2007
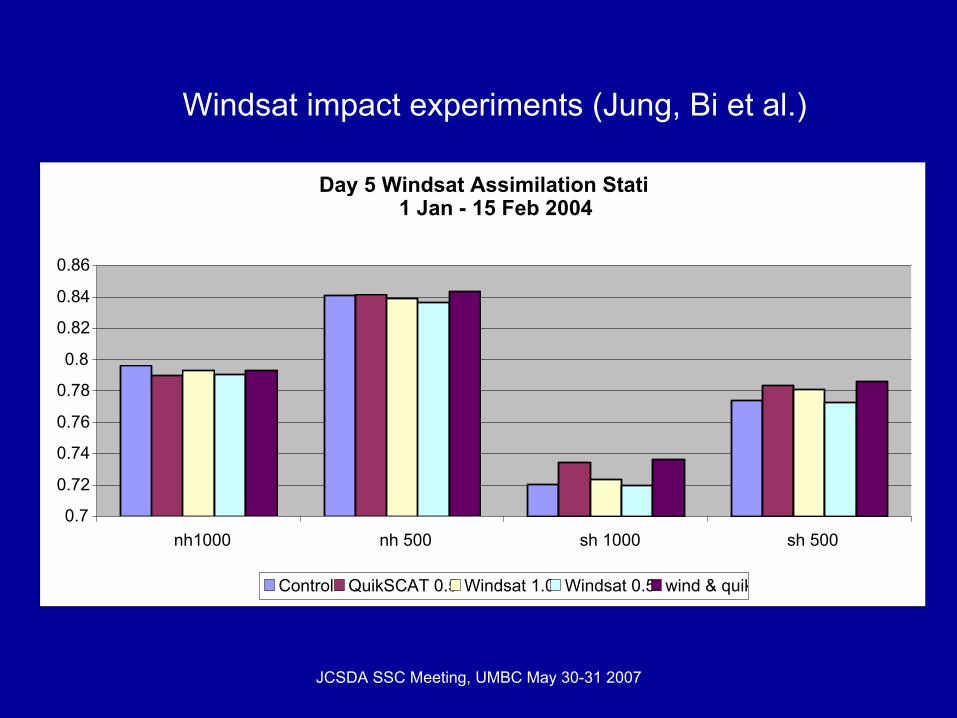
Day 5 Windsat Assimilation Statis1 Jan - 15 Feb 2004
0.7
0.72
0.74
0.76
0.78
0.8
0.82
0.84
0.86
nh1000 nh 500 sh 1000 sh 500
Control QuikSCAT 0.5 Windsat 1.0 Windsat 0.5 wind & quik
Windsat impact experiments (Jung, Bi et al.)
JCSDA SSC Meeting, UMBC May 30-31 2007

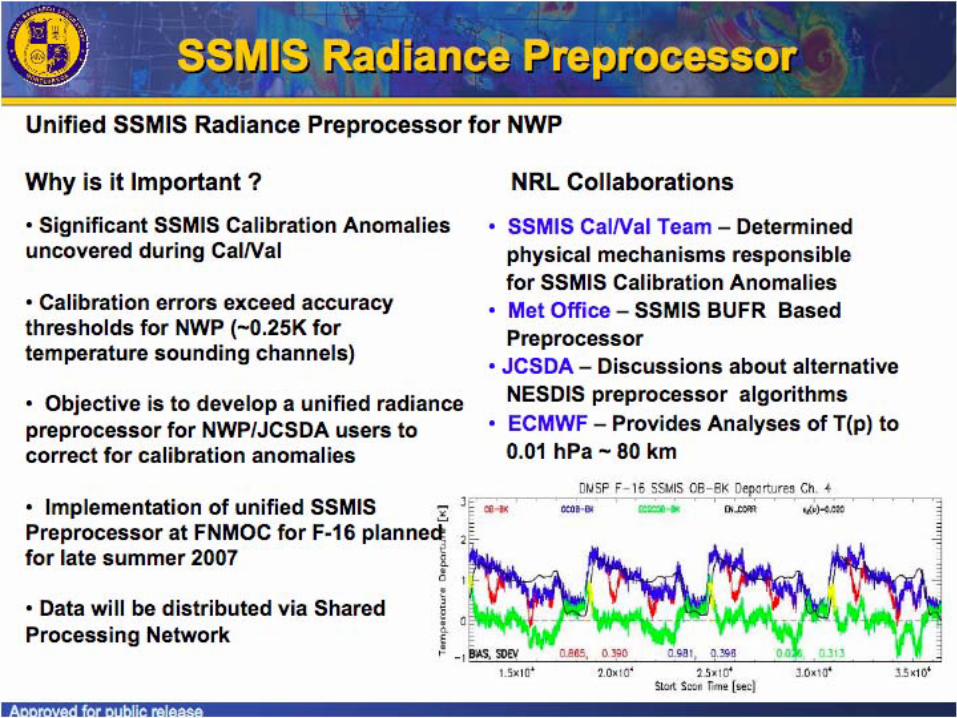
SSM/IS radiance assimilation in GSI
Period:00z 10 Aug.-00z 10Sep. 2006 Assimilation System:
GSI 3D-Var
Forecast model:
NCEP Operational global model (Sep.2006)
Resolution:
T382L64
Data:
EXPC: Operational
EXPS: Operational + UKMO SSMIS data
(removed flagged data)
Preliminary Results:
Improved A.C. 500 hPa height in the S.H.
Required further investigation on data quality
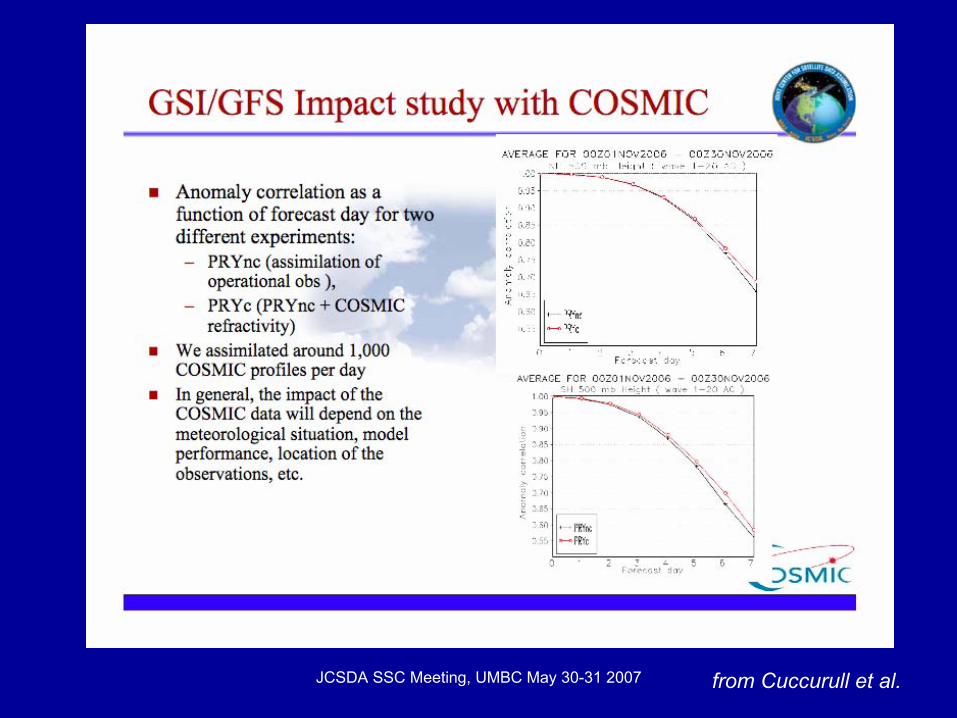
JCSDA SSC Meeting, UMBC May 30-31 2007 from Cuccurull et al.
JCSDA SSC Meeting, UMBC May 30-31 2007
System development
• GSI now operational at NCEP (May 1, 2007)
• GMAO validating GSI-based system for reanalysis; operations will follow shortly
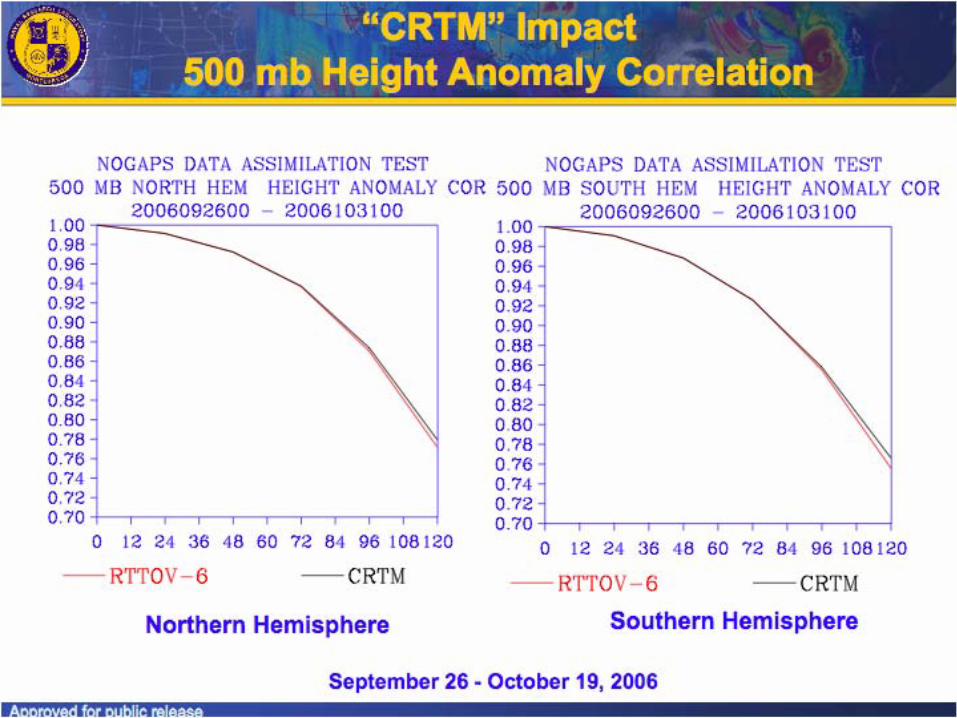
• CRTM used by both EMC and GMAO; tested at NRL/Monterey
JCSDA SSC Meeting, UMBC May 30-31 2007
JCSDA SSC Meeting, UMBC May 30-31 2007
What about the future?
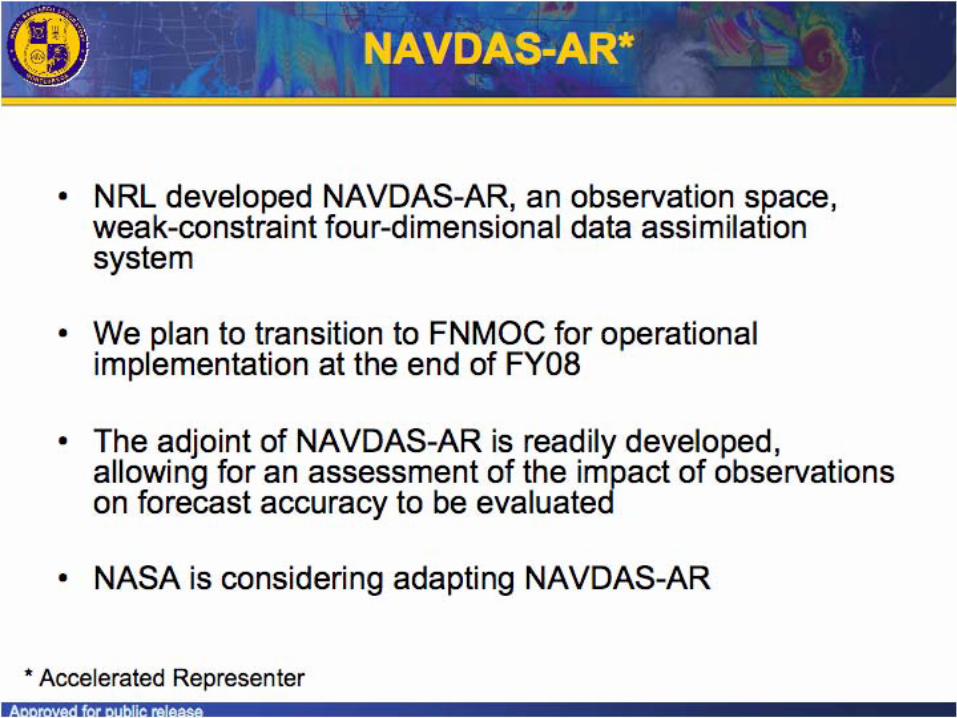
• NRL/Monterey: NAVDAS-AR
• GMAO developing “classical” 4D-VAR based on GEOS-5 model adjoint
• NCEP/EMC “simplified 4D-VAR”
• Unclear what can and what cannot be merged
JCSDA SSC Meeting, UMBC May 30-31 2007
JCSDA SSC Meeting, UMBC May 30-31 2007
Summary
• JCSDA is growing by almost any applicable measure– more than 100 participants in 2007 Workshop
• The number of satellite sensors being tested and studied is growing
• Collaboration expected to be formalized shortly– realization is work in progress