Embed Size (px)
Citation preview
JDNfinancial report
CONTENT
2
6
FINANCIAL KEY FIGURES
BALANCE SHEET & KEY RATIOS
4
8
10
15
51
PROFIT & LOSS ACCOUNT
ORDER BOOK
INVESTMENTS
CONSOLIDATED AUDIT REPORT
SPECIAL PURPOSE CONSOLIDATED ACCOUNTS
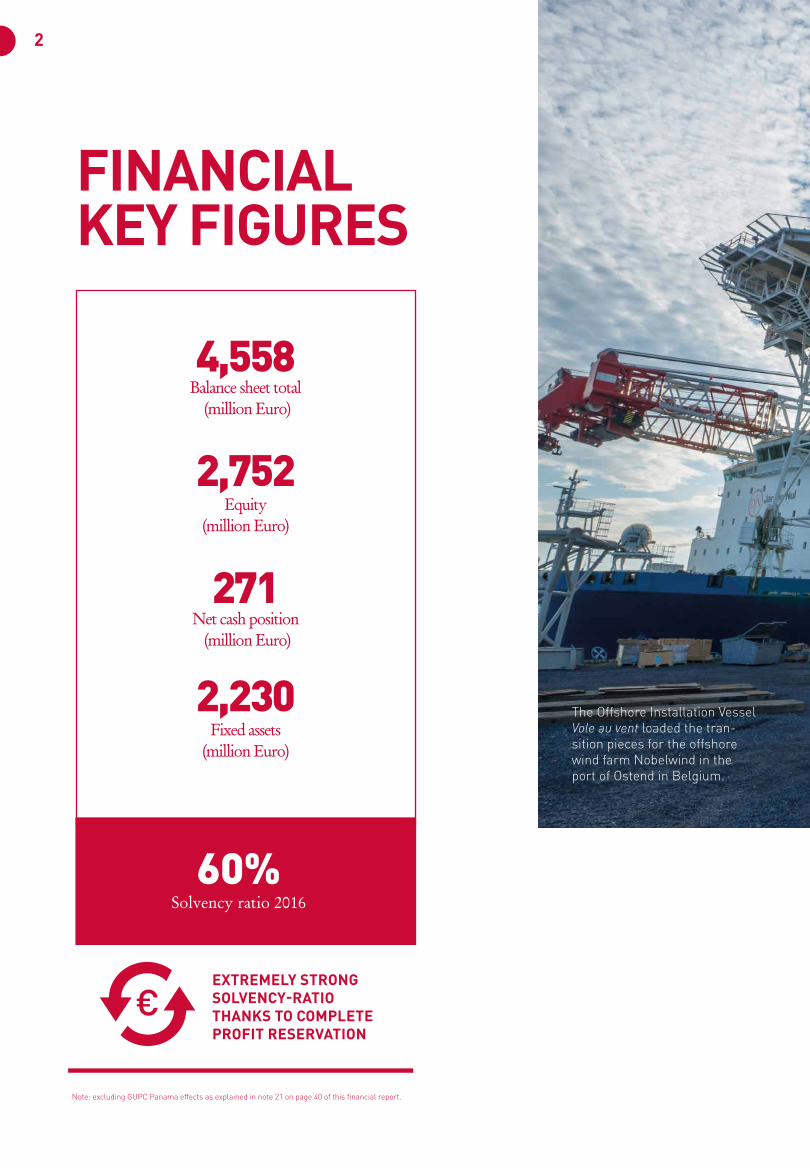
The Offshore Installation Vessel Vole au vent loaded the tran-sition pieces for the offshore wind farm Nobelwind in the port of Ostend in Belgium.
EXTREMELY STRONG SOLVENCY-RATIO THANKS TO COMPLETE PROFIT RESERVATION
2
FINANCIALKEY FIGURES
Note: excluding GUPC Panama effects as explained in note 21 on page 40 of this financial report.
4,558 Balance sheet total
(million Euro) 2,752
Equity (million Euro)
271 Net cash position (million Euro)
2,230 Fixed assets
(million Euro)
60% Solvency ratio 2016
€
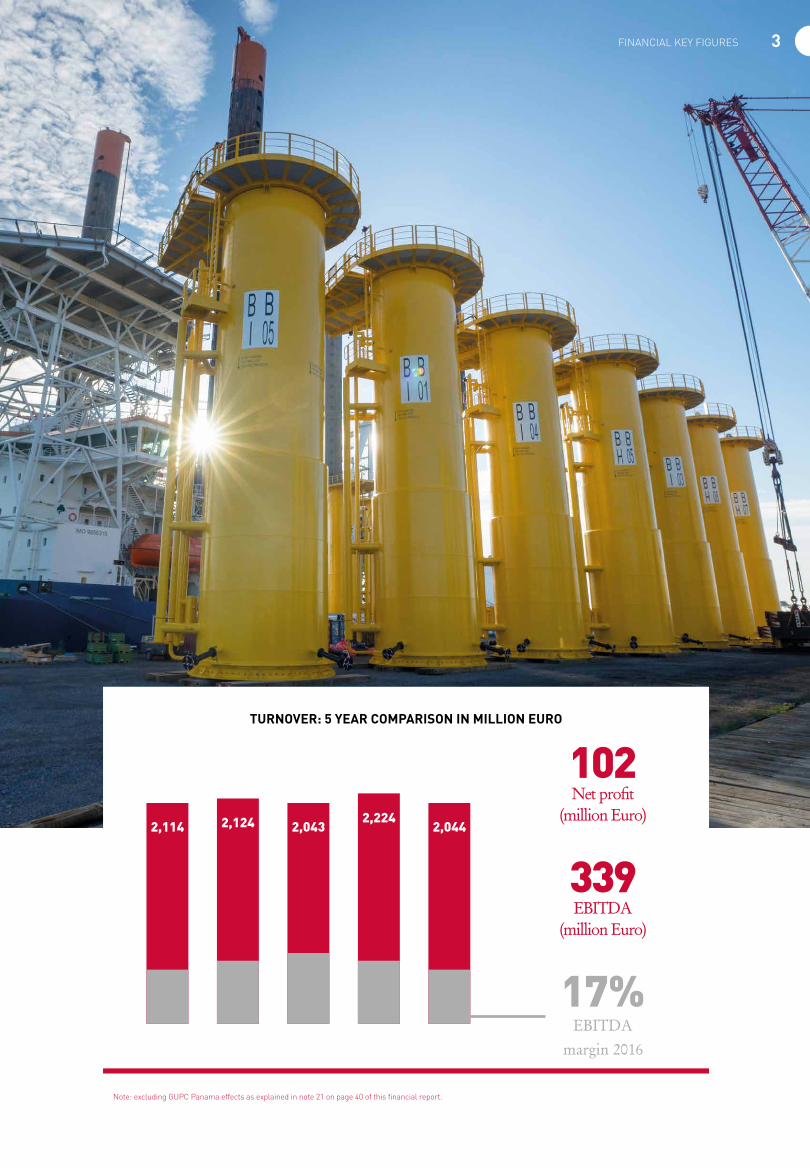
TURNOVER: 5 YEAR COMPARISON IN MILLION EURO
2,114 2,124 2,0432,224
2,044
3FINANCIAL KEY FIGURES
FINANCIALKEY FIGURES
102 Net profit
(million Euro)
339EBITDA
(million Euro) 17%
EBITDA margin 2016
Note: excluding GUPC Panama effects as explained in note 21 on page 40 of this financial report.
4
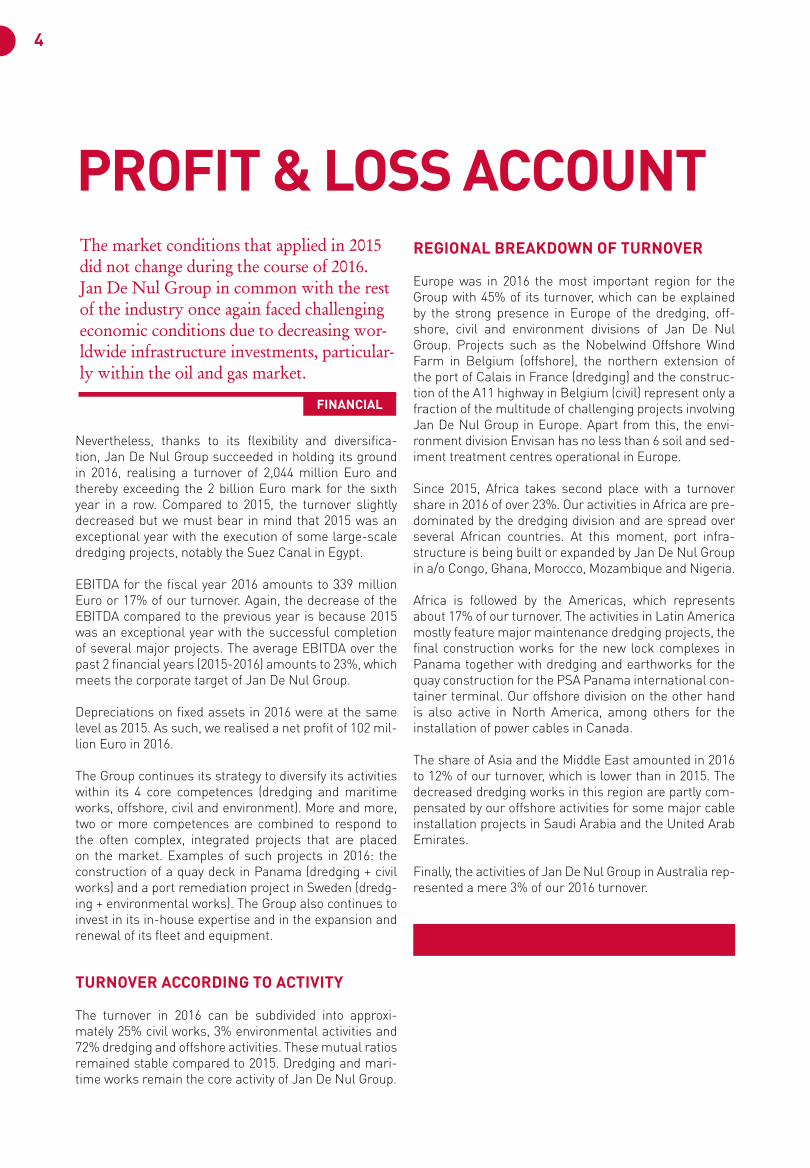
PROFIT & LOSS ACCOUNTThe market conditions that applied in 2015 did not change during the course of 2016. Jan De Nul Group in common with the rest of the industry once again faced challenging economic conditions due to decreasing wor-ldwide infrastructure investments, particular-ly within the oil and gas market.
Nevertheless, thanks to its flexibility and diversifica-tion, Jan De Nul Group succeeded in holding its ground in 2016, realising a turnover of 2,044 million Euro and thereby exceeding the 2 billion Euro mark for the sixth year in a row. Compared to 2015, the turnover slightly decreased but we must bear in mind that 2015 was an exceptional year with the execution of some large-scale dredging projects, notably the Suez Canal in Egypt.
EBITDA for the fiscal year 2016 amounts to 339 million Euro or 17% of our turnover. Again, the decrease of the EBITDA compared to the previous year is because 2015 was an exceptional year with the successful completion of several major projects. The average EBITDA over the past 2 financial years (2015-2016) amounts to 23%, which meets the corporate target of Jan De Nul Group.
Depreciations on fixed assets in 2016 were at the same level as 2015. As such, we realised a net profit of 102 mil-lion Euro in 2016.
The Group continues its strategy to diversify its activities within its 4 core competences (dredging and maritime works, offshore, civil and environment). More and more, two or more competences are combined to respond to the often complex, integrated projects that are placed on the market. Examples of such projects in 2016: the construction of a quay deck in Panama (dredging + civil works) and a port remediation project in Sweden (dredg-ing + environmental works). The Group also continues to invest in its in-house expertise and in the expansion and renewal of its fleet and equipment.
TURNOVER ACCORDING TO ACTIVITY
The turnover in 2016 can be subdivided into approxi-mately 25% civil works, 3% environmental activities and 72% dredging and offshore activities. These mutual ratios remained stable compared to 2015. Dredging and mari-time works remain the core activity of Jan De Nul Group.
REGIONAL BREAKDOWN OF TURNOVER
Europe was in 2016 the most important region for the Group with 45% of its turnover, which can be explained by the strong presence in Europe of the dredging, off-shore, civil and environment divisions of Jan De Nul Group. Projects such as the Nobelwind Offshore Wind Farm in Belgium (offshore), the northern extension of the port of Calais in France (dredging) and the construc-tion of the A11 highway in Belgium (civil) represent only a fraction of the multitude of challenging projects involving Jan De Nul Group in Europe. Apart from this, the envi-ronment division Envisan has no less than 6 soil and sed-iment treatment centres operational in Europe.
Since 2015, Africa takes second place with a turnover share in 2016 of over 23%. Our activities in Africa are pre-dominated by the dredging division and are spread over several African countries. At this moment, port infra-structure is being built or expanded by Jan De Nul Group in a/o Congo, Ghana, Morocco, Mozambique and Nigeria.
Africa is followed by the Americas, which represents about 17% of our turnover. The activities in Latin America mostly feature major maintenance dredging projects, the final construction works for the new lock complexes in Panama together with dredging and earthworks for the quay construction for the PSA Panama international con-tainer terminal. Our offshore division on the other hand is also active in North America, among others for the installation of power cables in Canada.
The share of Asia and the Middle East amounted in 2016 to 12% of our turnover, which is lower than in 2015. The decreased dredging works in this region are partly com-pensated by our offshore activities for some major cable installation projects in Saudi Arabia and the United Arab Emirates.
Finally, the activities of Jan De Nul Group in Australia rep-resented a mere 3% of our 2016 turnover.
FINANCIAL
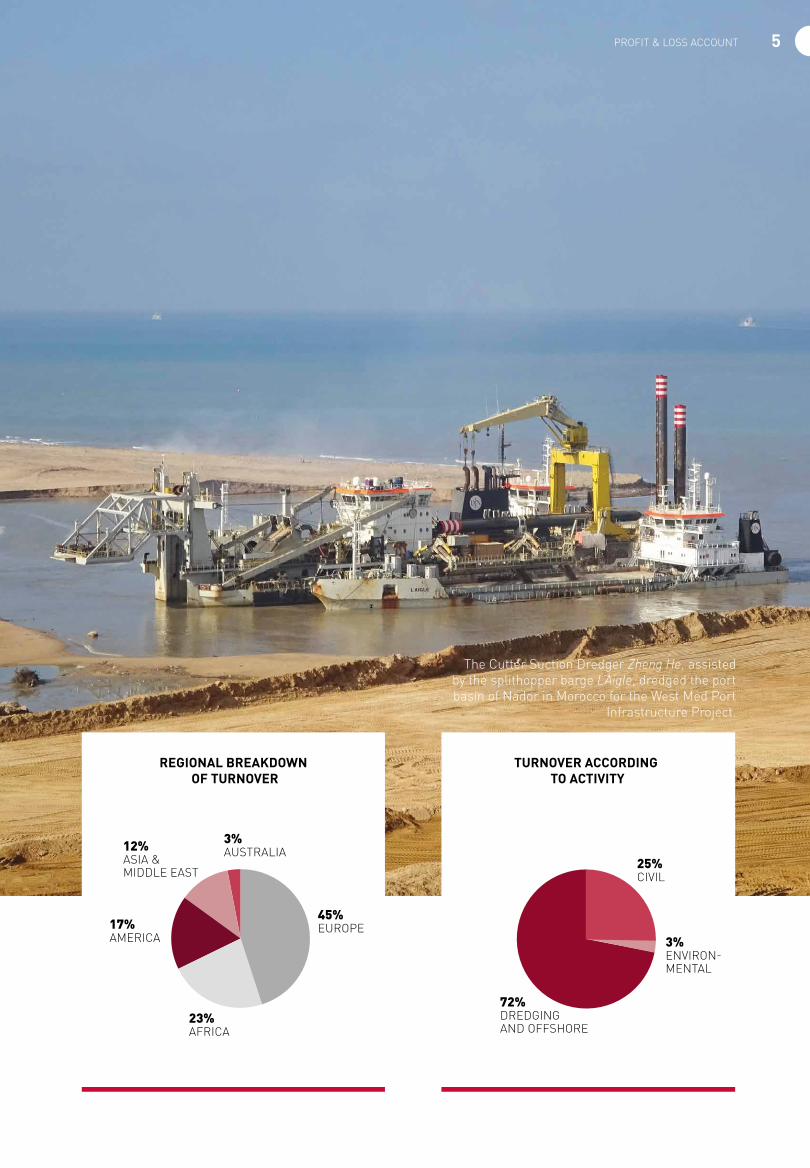
The Cutter Suction Dredger Zheng He, assisted by the splithopper barge L’Aigle, dredged the port basin of Nador in Morocco for the West Med Port
Infrastructure Project.
5PROFIT & LOSS ACCOUNT
PROFIT & LOSS ACCOUNT
72%DREDGING AND OFFSHORE
23%AFRICA
3%AUSTRALIA
17%AMERICA
12%ASIA & MIDDLE EAST
25%CIVIL
45%EUROPE
3%ENVIRON-MENTAL
TURNOVER ACCORDING TO ACTIVITY
REGIONAL BREAKDOWN OF TURNOVER
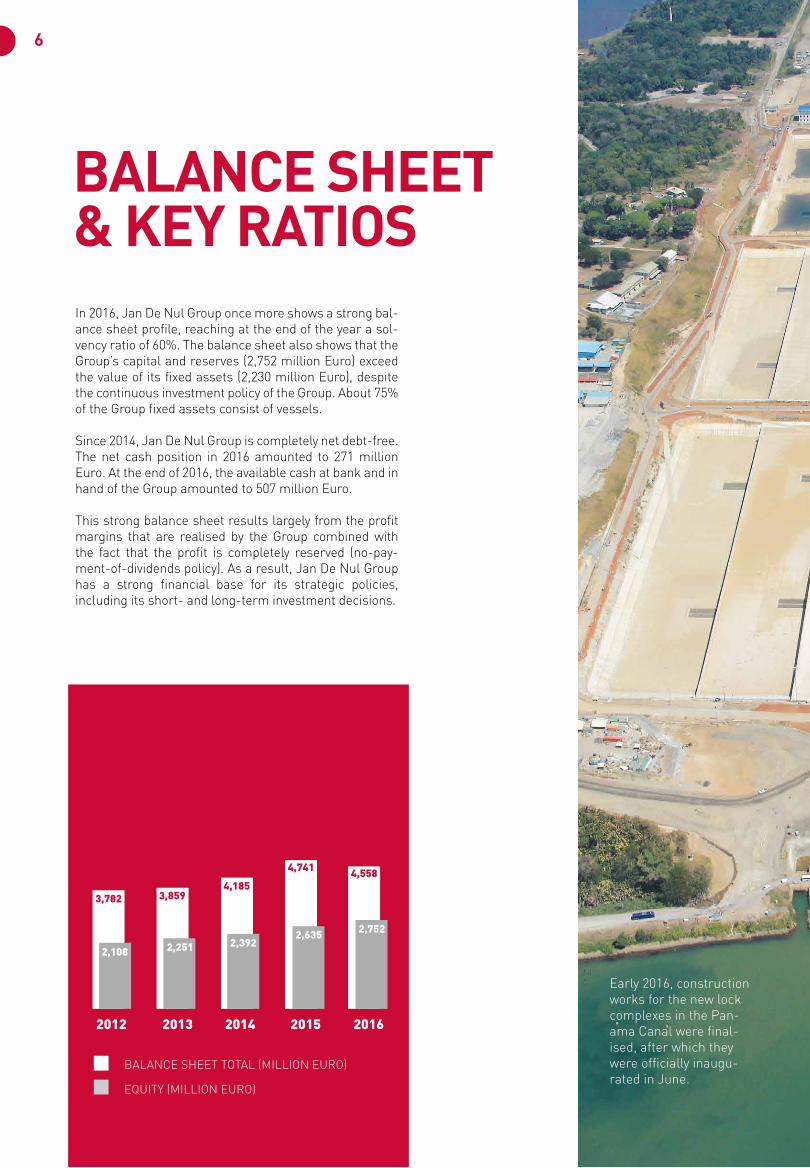
Early 2016, construction works for the new lock complexes in the Pan-ama Canal were final-ised, after which they were officially inaugu-rated in June.
BALANCE SHEET& KEY RATIOSIn 2016, Jan De Nul Group once more shows a strong bal-ance sheet profile, reaching at the end of the year a sol-vency ratio of 60%. The balance sheet also shows that the Group’s capital and reserves (2,752 million Euro) exceed the value of its fixed assets (2,230 million Euro), despite the continuous investment policy of the Group. About 75% of the Group fixed assets consist of vessels.
Since 2014, Jan De Nul Group is completely net debt-free. The net cash position in 2016 amounted to 271 million Euro. At the end of 2016, the available cash at bank and in hand of the Group amounted to 507 million Euro.
This strong balance sheet results largely from the profit margins that are realised by the Group combined with the fact that the profit is completely reserved (no-pay-ment-of-dividends policy). As a result, Jan De Nul Group has a strong financial base for its strategic policies, including its short- and long-term investment decisions.
3,782
2,108 2,251 2,3922,635 2,752
3,8594,185
4,741 4,558
2012 2013 2014 2015 2016
BALANCE SHEET TOTAL (MILLION EURO)
EQUITY (MILLION EURO)
6
BALANCE SHEET& KEY RATIOS
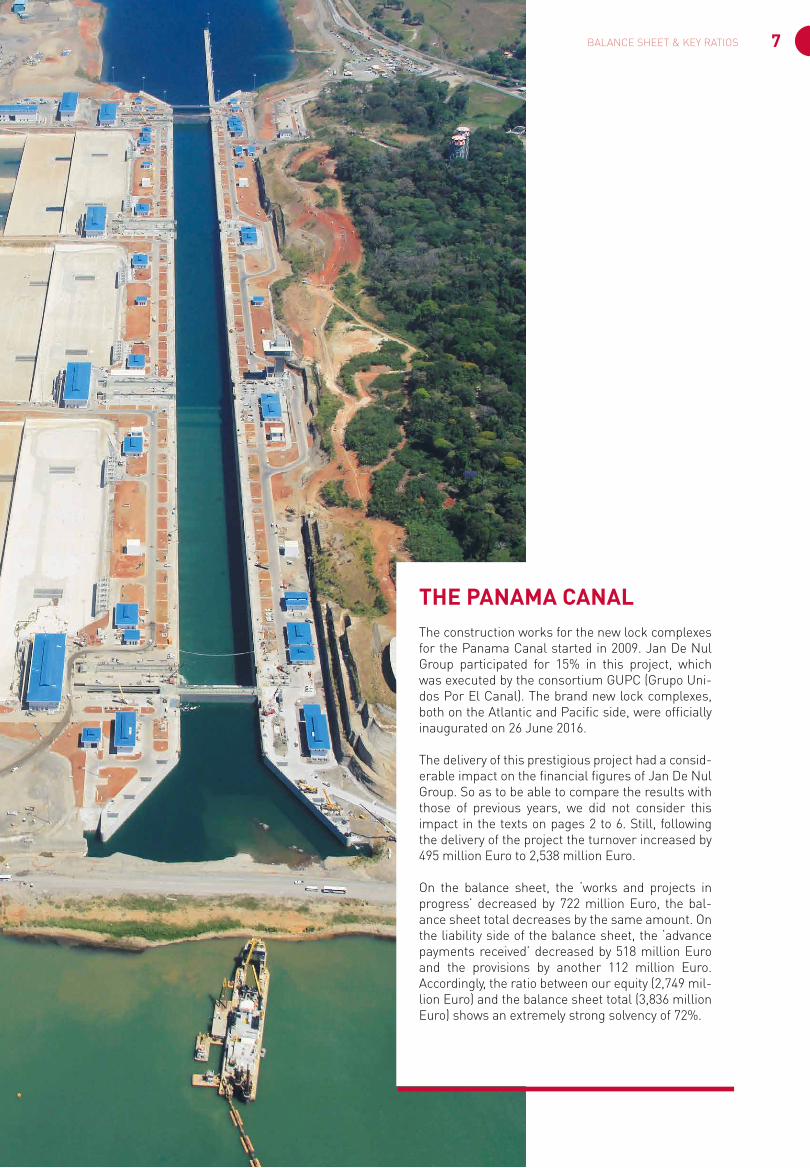
THE PANAMA CANAL The construction works for the new lock complexes for the Panama Canal started in 2009. Jan De Nul Group participated for 15% in this project, which was executed by the consortium GUPC (Grupo Uni-dos Por El Canal). The brand new lock complexes, both on the Atlantic and Pacific side, were officially inaugurated on 26 June 2016.
The delivery of this prestigious project had a consid-erable impact on the financial figures of Jan De Nul Group. So as to be able to compare the results with those of previous years, we did not consider this impact in the texts on pages 2 to 6. Still, following the delivery of the project the turnover increased by 495 million Euro to 2,538 million Euro.
On the balance sheet, the ‘works and projects in progress’ decreased by 722 million Euro, the bal-ance sheet total decreases by the same amount. On the liability side of the balance sheet, the ‘advance payments received’ decreased by 518 million Euro and the provisions by another 112 million Euro. Accordingly, the ratio between our equity (2,749 mil-lion Euro) and the balance sheet total (3,836 million Euro) shows an extremely strong solvency of 72%.
7BALANCE SHEET & KEY RATIOS
ORDER BOOK
8
STABLE ORDER BOOK
At the end of 2016, Jan De Nul Group’s order book amounted to 2.55 billion Euro, which is comparable to the situation at the end of last year (2.71 billion Euro). Despite difficult market conditions, (particularly in the maritime industry) and reduced or even deferred invest-ments worldwide, the Group has been able to maintain its orders thanks to its continuous innovation and diver-sification efforts.
THE RIGHT COMPETENCES
Jan De Nul Group continuously develops and invests so as to be able to anticipate the ever changing market con-ditions. These efforts are made in each of its four core activities:
• dredging and maritime works,
• offshore services,
• civil construction works and
• environmental activities and brownfield development
The Group’s comprehensive competence convinces cli-ents to award contracts to Jan De Nul. Jan De Nul Group has the in-house knowledge that is required to offer cli-ents an overall solution fulfilling all their needs. An addi-tional asset here is the Group’s financial strength and knowledge, which enables it to set up export credit struc-tures and other financing proposals for its clients. On the other hand, and equally important, Jan De Nul Group always shows the right attitude towards clients, society, neighbouring communities and the environment. Jan De Nul Group greatly values to respectful entrepreneurship.
CHALLENGING FUTURE
The order book of Jan De Nul Group includes some very challenging future projects:
• In Monaco, the world’s smallest country but one, the dredging division of the Group will expand the territory of the Monegasque state by reclaiming almost 15 acres from the sea. The civil division will build the foundations for the caissons. The environment division Envisan will also be involved in this project, treating no less than
60,000 m³ of sediments. This project is a brilliant exam-ple for the Group’s integrated project approach and syn-ergies.
• The cable-laying vessel Isaac Newton will be used to install 200 km of cable for the construction of the NASR offshore oil platform about 131 km northwest of Abu Dhabi in the Arabian Gulf. Furthermore our new multi-purpose vessel, Daniel Bernoulli, will be used for, among other things, installing rocks on the seabed to protect the cables.
• For DONG Energy, Jan De Nul Group will execute the foundation works as well as the installation of 32 mono-piles for the 450 MW Borkum Riffgrund 2 Wind Farm Project in the German part of the North Sea. For these works, the world’s largest rock installation vessel, Simon Stevin, will be used as will the Vole au vent for installing the monopiles. In addition, Jan De Nul Group will supply and install the interconnector cables for both this wind farm and the adjacent Trianel Wind Farm Borkum.
The biggest infrastructure project currently being exe-cuted in Belgium, the A11 highway between Bruges and Westkapelle, will be completed exactly according to schedule in 2017. The project includes a number of technically complex engineering structures such as a semi-integral viaduct and a double movable bridge. The acceptance of the works will be followed by a 30-year maintenance stage.
AN ORDER BOOK IN MOTION
In early 2017, we signed some other major contracts such as the construction of a submarine 4,000-metre breakwater in Benin (Africa), the construction of a port in Mumbai (India) and the deepening of the Port of Veracruz in Mexico.
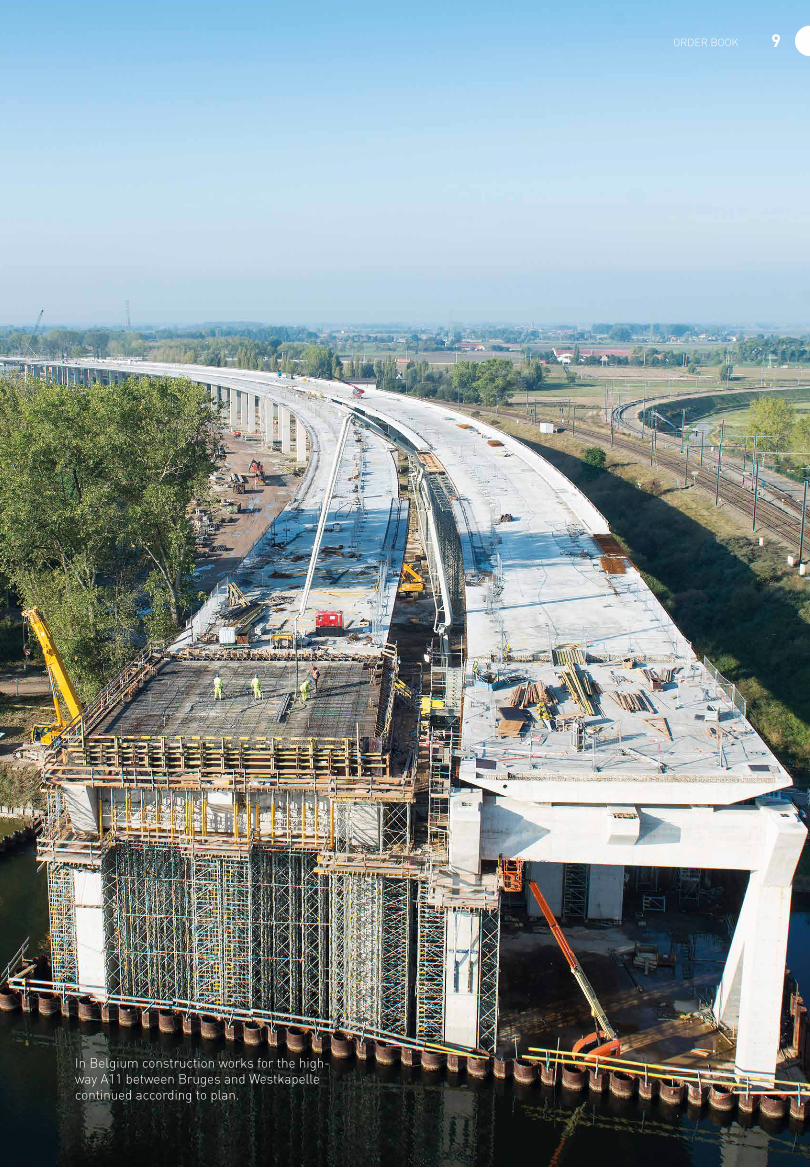
In Belgium construction works for the high-way A11 between Bruges and Westkapelle continued according to plan.
9ORDER BOOK
INVESTMENTS
10
FLEET
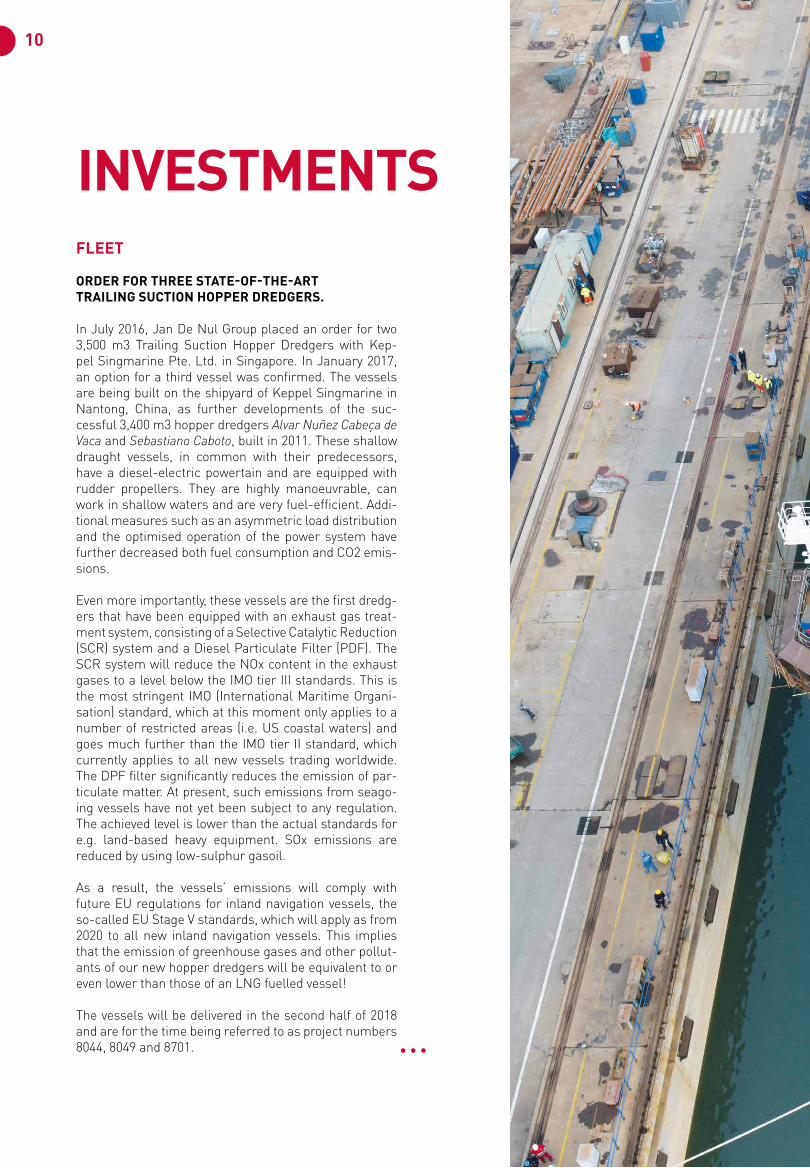
ORDER FOR THREE STATE-OF-THE-ART TRAILING SUCTION HOPPER DREDGERS. In July 2016, Jan De Nul Group placed an order for two 3,500 m3 Trailing Suction Hopper Dredgers with Kep-pel Singmarine Pte. Ltd. in Singapore. In January 2017, an option for a third vessel was confirmed. The vessels are being built on the shipyard of Keppel Singmarine in Nantong, China, as further developments of the suc-cessful 3,400 m3 hopper dredgers Alvar Nuñez Cabeça de Vaca and Sebastiano Caboto, built in 2011. These shallow draught vessels, in common with their predecessors, have a diesel-electric powertain and are equipped with rudder propellers. They are highly manoeuvrable, can work in shallow waters and are very fuel-efficient. Addi-tional measures such as an asymmetric load distribution and the optimised operation of the power system have further decreased both fuel consumption and CO2 emis-sions.
Even more importantly, these vessels are the first dredg-ers that have been equipped with an exhaust gas treat-ment system, consisting of a Selective Catalytic Reduction (SCR) system and a Diesel Particulate Filter (PDF). The SCR system will reduce the NOx content in the exhaust gases to a level below the IMO tier III standards. This is the most stringent IMO (International Maritime Organi-sation) standard, which at this moment only applies to a number of restricted areas (i.e. US coastal waters) and goes much further than the IMO tier II standard, which currently applies to all new vessels trading worldwide. The DPF filter significantly reduces the emission of par-ticulate matter. At present, such emissions from seago-ing vessels have not yet been subject to any regulation. The achieved level is lower than the actual standards for e.g. land-based heavy equipment. SOx emissions are reduced by using low-sulphur gasoil.
As a result, the vessels’ emissions will comply with future EU regulations for inland navigation vessels, the so-called EU Stage V standards, which will apply as from 2020 to all new inland navigation vessels. This implies that the emission of greenhouse gases and other pollut-ants of our new hopper dredgers will be equivalent to or even lower than those of an LNG fuelled vessel!
The vessels will be delivered in the second half of 2018 and are for the time being referred to as project numbers 8044, 8049 and 8701.
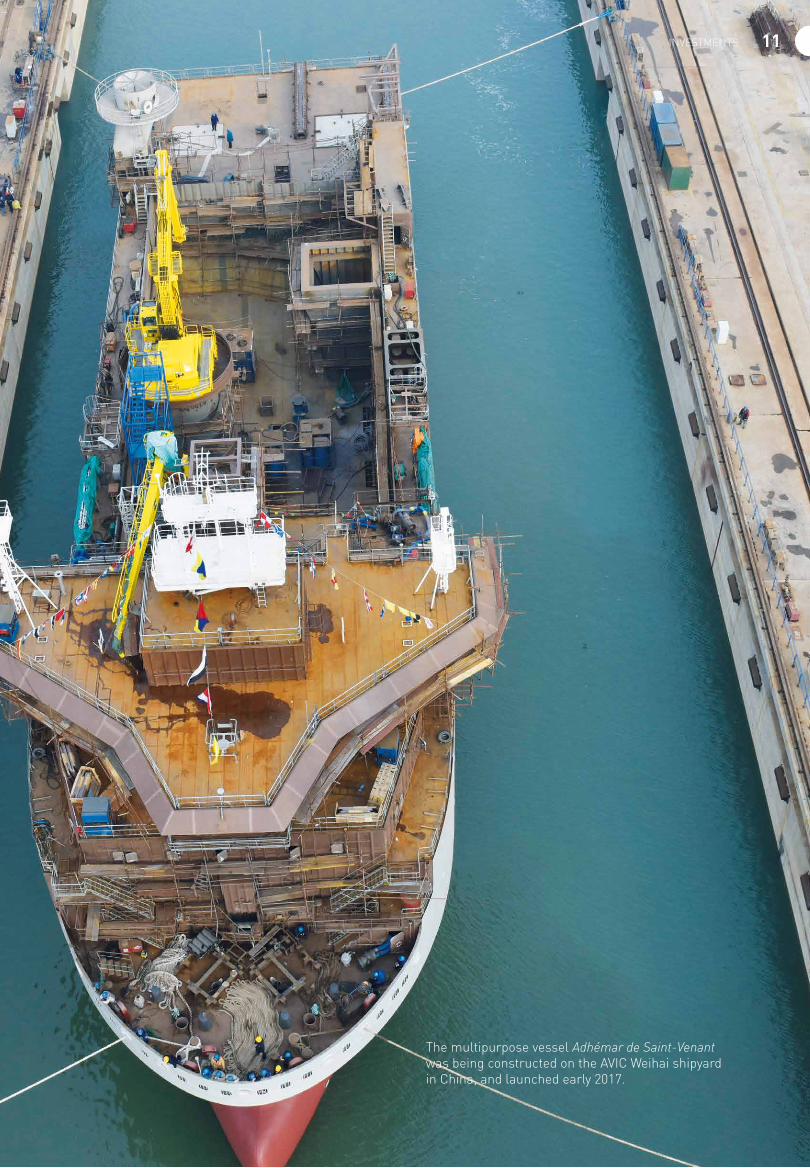
The multipurpose vessel Adhémar de Saint-Venant was being constructed on the AVIC Weihai shipyard in China, and launched early 2017.
11INVESTMENTS
12
ONGOING PROJECTS
The Uljanik shipyard in Pula, Croatia, is currently building the large seagoing cutter suction dredger 8069, which is to be launched during the middle of this year.
In China, on the AVIC Weihai shipyard, the multipurpose vessels Adhémar de Saint-Venant and Daniel Bernoulli are currently being outfitted and commissioned. Delivery is to be made during the summer, after which both vessels will immediately sail to their first jobs: one will perform subsea rock installation works in Denmark and the other will operate as mother ship for a trenching system and install protective mattresses on the seabed in the Persian Gulf. These jobs illustrate the versatility of these vessels.
LAND EQUIPMENT
Jan De Nul Group continuously invests in extending and renewing its equipment for supporting its worldwide operations. In doing so, Jan De Nul Group always goes for the most recent technologies meeting the most strin-gent environmental requirements. We look for the most suitable machine for every application.
PROJECT-SPECIFIC EQUIPMENT
In 2016, Jan De Nul invested in 7 new wheel loaders for loading contaminated dredge spoil in its soil treatment centres in Belgium and on environmental projects world-wide. All loaders have been equipped with a weighing system and a pressurised cabin to protect the health and safety of the operators.
For the PSA Panama project, Jan De Nul purchased 2 new telescopic cranes and 3 new bulldozers of type D6.
7 new telescopic handlers must support logistic opera-tions worldwide.
Investments in excavators, gensets and trucks are mainly intended for our earthworks and for strengthening our site infrastructure.
To support the activities of its daughter company Soetaert, Jan De Nul invested in a new foundation rig (type Liebherr LB355) and a new anchor-drilling machine (type Liebherr 895), equipped with a fully automatic com-paction system for dynamic underwater compaction operations.
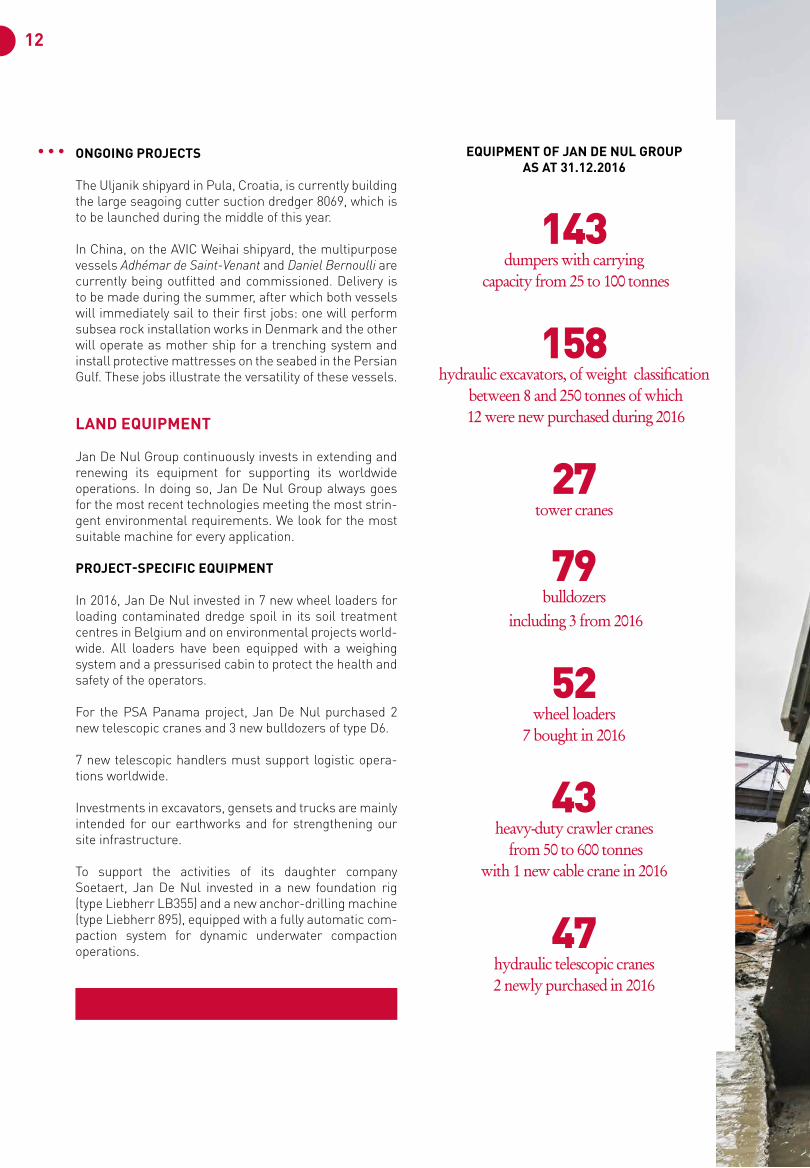
EQUIPMENT OF JAN DE NUL GROUP AS AT 31.12.2016 143
dumpers with carrying capacity from 25 to 100 tonnes
158
hydraulic excavators, of weight classification between 8 and 250 tonnes of which 12 were new purchased during 2016
27 tower cranes
79bulldozers
including 3 from 2016
52wheel loaders
7 bought in 2016
43 heavy-duty crawler cranes
from 50 to 600 tonneswith 1 new cable crane in 2016
47hydraulic telescopic cranes 2 newly purchased in 2016
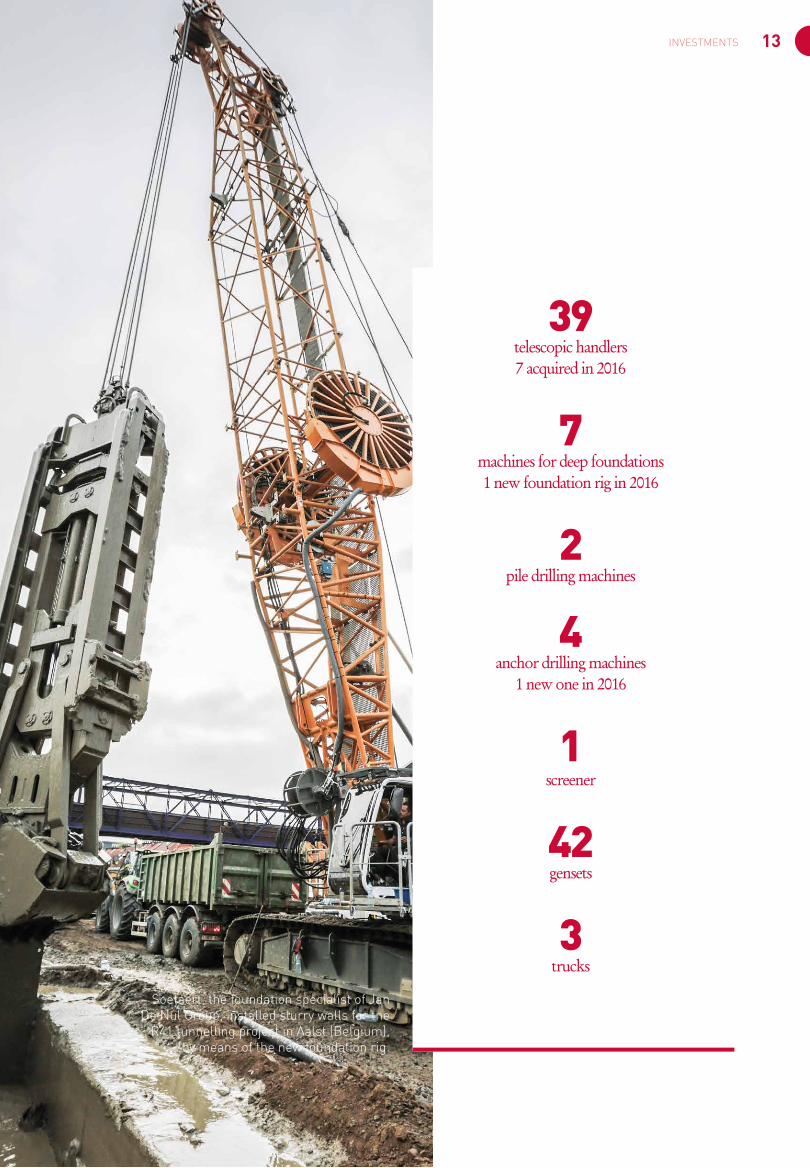
Soetaert, the foundation specialist of Jan De Nul Group, installed slurry walls for the
R41 tunnelling project in Aalst (Belgium), by means of the new foundation rig.
13INVESTMENTS
39 telescopic handlers 7 acquired in 2016
7
machines for deep foundations1 new foundation rig in 2016
2 pile drilling machines
4anchor drilling machines
1 new one in 2016 1
screener
42gensets
3 trucks
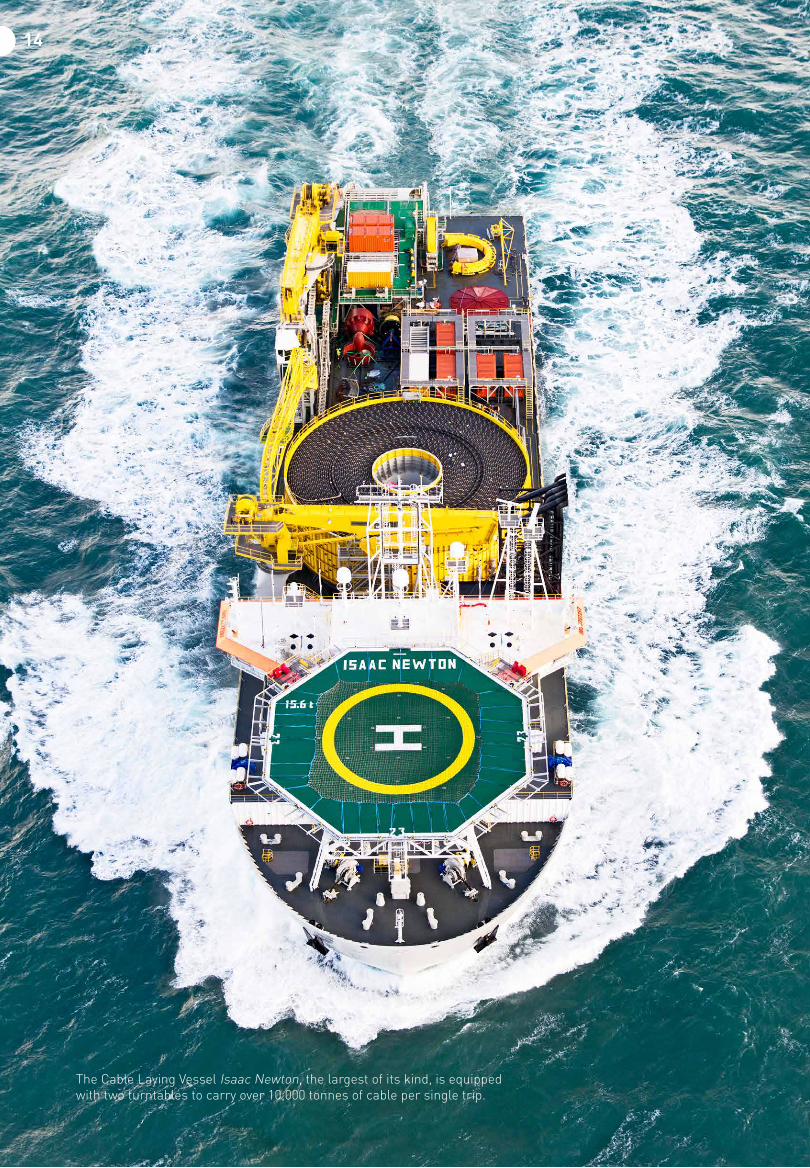
The Cable Laying Vessel Isaac Newton, the largest of its kind, is equipped with two turntables to carry over 10,000 tonnes of cable per single trip.
14
15CONSOLIDATED AUDIT REPORT
CONSOLIDATED AUDIT REPORTREPORT ON THE CONSOLIDATED ANNUAL ACCOUNTS
Following our appointment by the General Meeting of the Shareholders, we have audited the accompanying consolidated annual accounts of JAN DE NUL GROUP*, which comprise the balance sheet as at December 31, 2016 and the profit and loss account for the year then ended and a summary of significant accounting policies and other explanatory information.
THE BOARD OF DIRECTORS’ RESPONSI-BILITY FOR THE CONSOLIDATED ANNUAL ACCOUNTS
The Board of Directors is responsible for the prepara-tion and fair presentation of these consolidated annual accounts in accordance with Luxembourg legal and regulatory requirements as apoted by the European Union and for such internal control as the Board of Direc-tors determines is necessary to enable the preparation of the consolidated annual accounts that are free from material misstatement, whether due to fraud or error.
RESPONSIBILITY OF THE RÉVISEUR D’ENTREPRISES AGRÉÉ
Our responsibility is to express an opinion on these consolidated annual accounts based on our audit. We conducted our audit in accor dance with International Standards on Auditing as adopted for Luxembourg by the Commission de Surveillance du Secteur Finan cier. Those standards require that we comply with ethical requirements and plan and perform the audit to obtain reasonable assu-rance whether the consolidated annual accounts are free from material misstatement.
An audit involves performing procedures to obtain audit evidence about the amounts and disclosures in the con-solidated annual accounts. The procedures selected depend on the Réviseur d’Entreprises Agréé’s judgement, including the assessment of the risks of material mis-statement of the consolidated annual accounts, whether due to fraud or error. In making those risk assessments, the Réviseur d’Entreprises Agréé considers internal
control relevant to the entity’s preparation and fair pres-entation of the consolidated annual accounts in order to design audit procedures that are appropriate in the cir-cumstances, but not for the purpose of expressing an opinion on the effectiveness of the entity’s internal con-trol.
An audit also includes evaluating the appropriateness of accounting policies used and the reasonableness of accounting estimates made by the Board of Directors, as well as evaluating the overall presentation of the consol-idated annual accounts.
We believe that the audit evidence we have obtained is sufficient and appropriate to provide a basis for our audit opinion.
OPINION
In our opinion, the consolidated annual accounts give a true and fair view of the financial position of JAN DE NUL GROUP* as of December 31, 2016, and of the results of its operations for the year then ended in accordance with the Luxembourg legal and regulatory requirements relating to the preparation of the consolidated annual accounts.
REPORT ON OTHER LEGAL AND REGULATORY REQUIREMENTS
The management report, which is the responsibility of the Board of Directors, is consistent with the consoli-dated annual accounts.
Luxembourg, May 5, 2017
Thierry REMACLE Réviseur d’Entreprises Agréé
Grant Thornton Lux Audit S.A. | 89A, Pafebruch | L-8308 Capellen Luxembourg | Tel.: +352 40 12 991 | Fax: +352 40 05 98 | www.grantthornton.lu
16
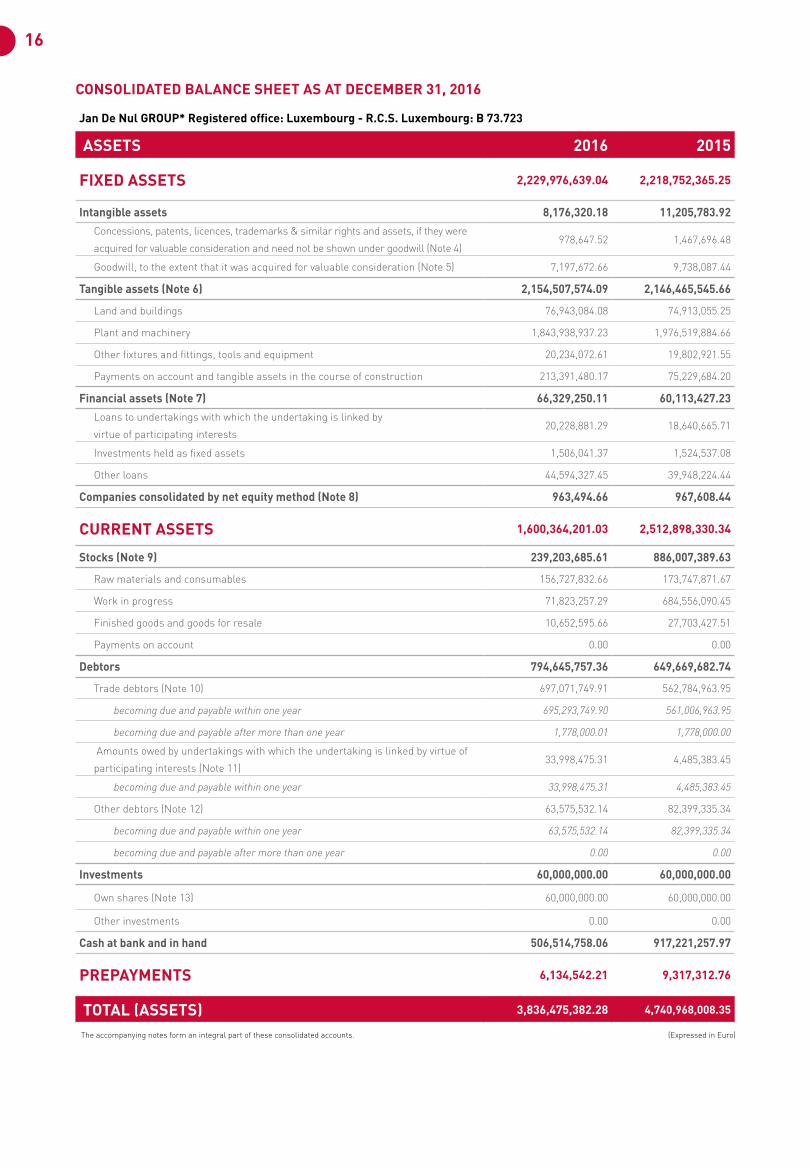
CONSOLIDATED BALANCE SHEET AS AT DECEMBER 31, 2016
Jan De Nul GROUP* Registered office: Luxembourg - R.C.S. Luxembourg: B 73.723
ASSETS 2016 2015
FIXED ASSETS 2,229,976,639.04 2,218,752,365.25
Intangible assets 8,176,320.18 11,205,783.92Concessions, patents, licences, trademarks & similar rights and assets, if they were
acquired for valuable consideration and need not be shown under goodwill (Note 4)978,647.52 1,467,696.48
Goodwill, to the extent that it was acquired for valuable consideration (Note 5) 7,197,672.66 9,738,087.44
Tangible assets (Note 6) 2,154,507,574.09 2,146,465,545.66
Land and buildings 76,943,084.08 74,913,055.25
Plant and machinery 1,843,938,937.23 1,976,519,884.66
Other fixtures and fittings, tools and equipment 20,234,072.61 19,802,921.55
Payments on account and tangible assets in the course of construction 213,391,480.17 75,229,684.20
Financial assets (Note 7) 66,329,250.11 60,113,427.23Loans to undertakings with which the undertaking is linked by
virtue of participating interests20,228,881.29 18,640,665.71
Investments held as fixed assets 1,506,041.37 1,524,537.08
Other loans 44,594,327.45 39,948,224.44
Companies consolidated by net equity method (Note 8) 963,494.66 967,608.44
CURRENT ASSETS 1,600,364,201.03 2,512,898,330.34
Stocks (Note 9) 239,203,685.61 886,007,389.63
Raw materials and consumables 156,727,832.66 173,747,871.67
Work in progress 71,823,257.29 684,556,090.45
Finished goods and goods for resale 10,652,595.66 27,703,427.51
Payments on account 0.00 0.00
Debtors 794,645,757.36 649,669,682.74
Trade debtors (Note 10) 697,071,749.91 562,784,963.95
becoming due and payable within one year 695,293,749.90 561,006,963.95
becoming due and payable after more than one year 1,778,000.01 1,778,000.00
Amounts owed by undertakings with which the undertaking is linked by virtue of
participating interests (Note 11)33,998,475.31 4,485,383.45
becoming due and payable within one year 33,998,475.31 4,485,383.45
Other debtors (Note 12) 63,575,532.14 82,399,335.34
becoming due and payable within one year 63,575,532.14 82,399,335.34
becoming due and payable after more than one year 0.00 0.00
Investments 60,000,000.00 60,000,000.00
Own shares (Note 13) 60,000,000.00 60,000,000.00
Other investments 0.00 0.00
Cash at bank and in hand 506,514,758.06 917,221,257.97
PREPAYMENTS 6,134,542.21 9,317,312.76
TOTAL (ASSETS) 3,836,475,382.28 4,740,968,008.35
The accompanying notes form an integral part of these consolidated accounts. (Expressed in Euro)
17CONSOLIDATED AUDIT REPORT
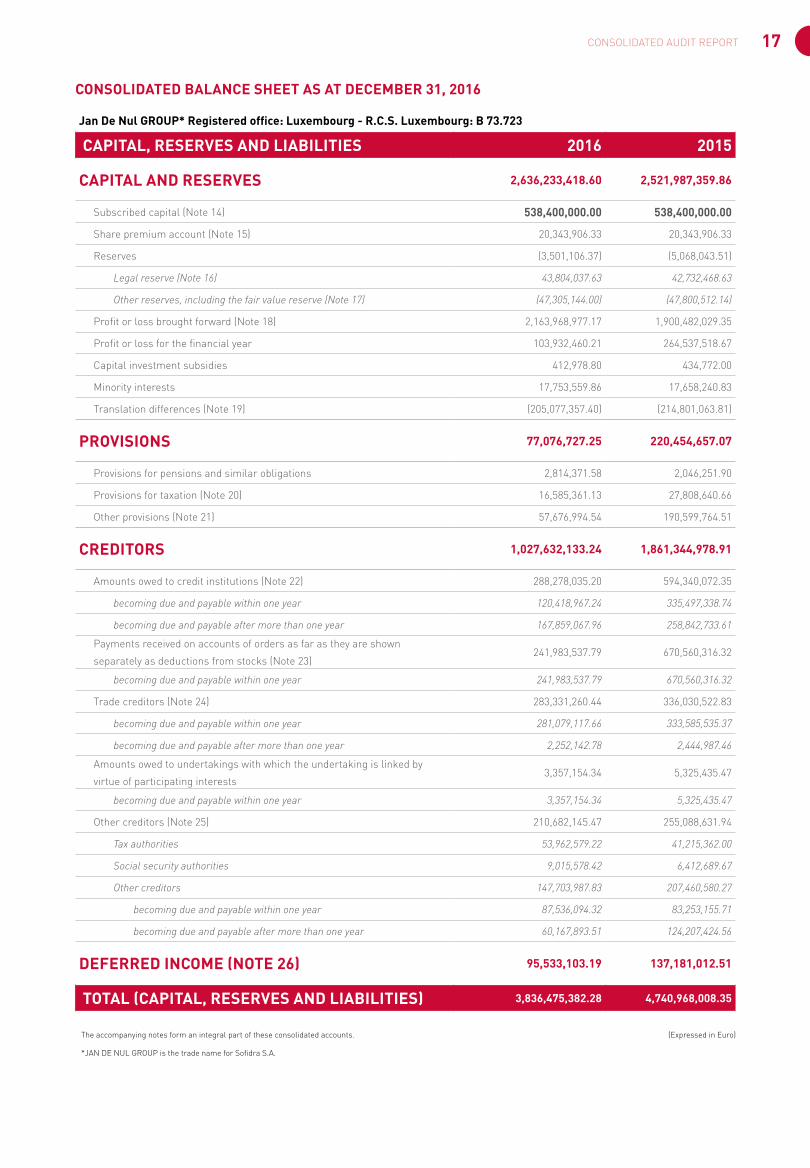
CONSOLIDATED BALANCE SHEET AS AT DECEMBER 31, 2016
Jan De Nul GROUP* Registered office: Luxembourg - R.C.S. Luxembourg: B 73.723
CAPITAL, RESERVES AND LIABILITIES 2016 2015
CAPITAL AND RESERVES 2,636,233,418.60 2,521,987,359.86
Subscribed capital (Note 14) 538,400,000.00 538,400,000.00
Share premium account (Note 15) 20,343,906.33 20,343,906.33
Reserves (3,501,106.37) (5,068,043.51)
Legal reserve (Note 16) 43,804,037.63 42,732,468.63
Other reserves, including the fair value reserve (Note 17) (47,305,144.00) (47,800,512.14)
Profit or loss brought forward (Note 18) 2,163,968,977.17 1,900,482,029.35
Profit or loss for the financial year 103,932,460.21 264,537,518.67
Capital investment subsidies 412,978.80 434,772.00
Minority interests 17,753,559.86 17,658,240.83
Translation differences (Note 19) (205,077,357.40) (214,801,063.81)
PROVISIONS 77,076,727.25 220,454,657.07
Provisions for pensions and similar obligations 2,814,371.58 2,046,251.90
Provisions for taxation (Note 20) 16,585,361.13 27,808,640.66
Other provisions (Note 21) 57,676,994.54 190,599,764.51
CREDITORS 1,027,632,133.24 1,861,344,978.91
Amounts owed to credit institutions (Note 22) 288,278,035.20 594,340,072.35
becoming due and payable within one year 120,418,967.24 335,497,338.74
becoming due and payable after more than one year 167,859,067.96 258,842,733.61
Payments received on accounts of orders as far as they are shown
separately as deductions from stocks (Note 23)241,983,537.79 670,560,316.32
becoming due and payable within one year 241,983,537.79 670,560,316.32
Trade creditors (Note 24) 283,331,260.44 336,030,522.83
becoming due and payable within one year 281,079,117.66 333,585,535.37
becoming due and payable after more than one year 2,252,142.78 2,444,987.46
Amounts owed to undertakings with which the undertaking is linked by
virtue of participating interests3,357,154.34 5,325,435.47
becoming due and payable within one year 3,357,154.34 5,325,435.47
Other creditors (Note 25) 210,682,145.47 255,088,631.94
Tax authorities 53,962,579.22 41,215,362.00
Social security authorities 9,015,578.42 6,412,689.67
Other creditors 147,703,987.83 207,460,580.27
becoming due and payable within one year 87,536,094.32 83,253,155.71
becoming due and payable after more than one year 60,167,893.51 124,207,424.56
DEFERRED INCOME (NOTE 26) 95,533,103.19 137,181,012.51
TOTAL (CAPITAL, RESERVES AND LIABILITIES) 3,836,475,382.28 4,740,968,008.35
The accompanying notes form an integral part of these consolidated accounts. (Expressed in Euro)
*JAN DE NUL GROUP is the trade name for Sofidra S.A.
18
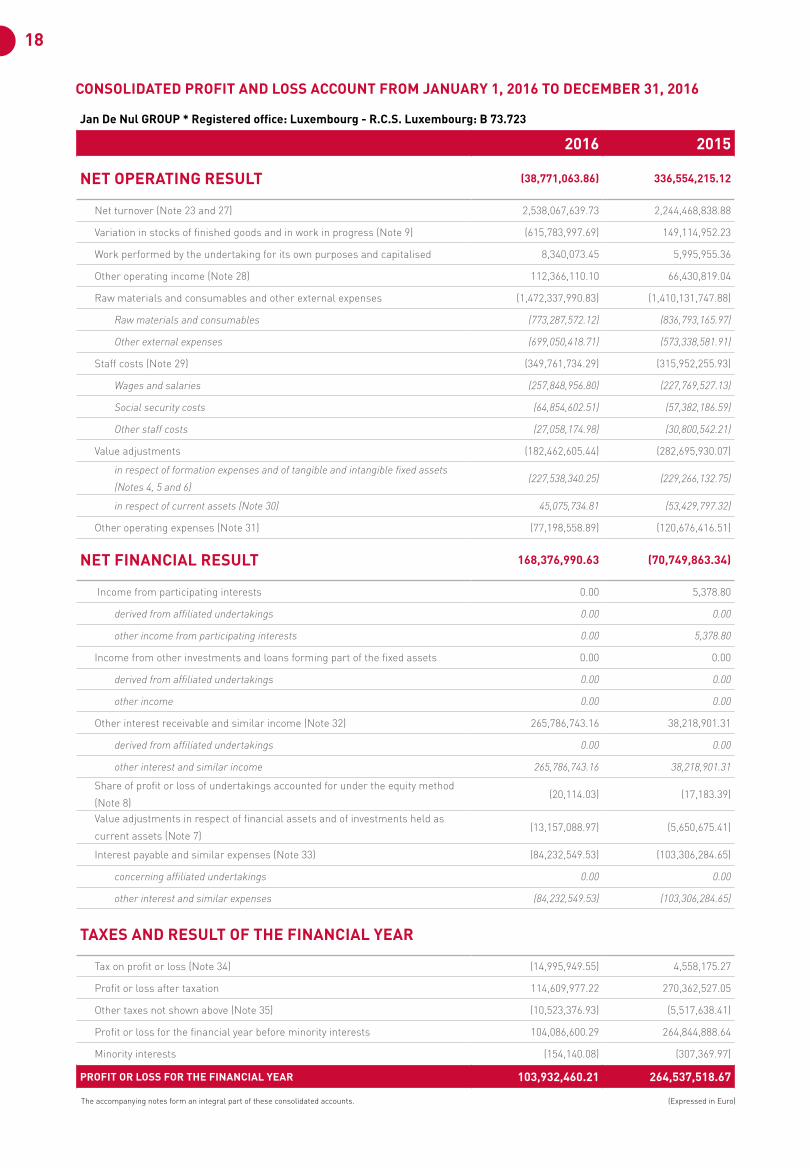
Jan De Nul GROUP * Registered office: Luxembourg - R.C.S. Luxembourg: B 73.723
2016 2015
NET OPERATING RESULT (38,771,063.86) 336,554,215.12
Net turnover (Note 23 and 27) 2,538,067,639.73 2,244,468,838.88
Variation in stocks of finished goods and in work in progress (Note 9) (615,783,997.69) 149,114,952.23
Work performed by the undertaking for its own purposes and capitalised 8,340,073.45 5,995,955.36
Other operating income (Note 28) 112,366,110.10 66,430,819.04
Raw materials and consumables and other external expenses (1,472,337,990.83) (1,410,131,747.88)
Raw materials and consumables (773,287,572.12) (836,793,165.97)
Other external expenses (699,050,418.71) (573,338,581.91)
Staff costs (Note 29) (349,761,734.29) (315,952,255.93)
Wages and salaries (257,848,956.80) (227,769,527.13)
Social security costs (64,854,602.51) (57,382,186.59)
Other staff costs (27,058,174.98) (30,800,542.21)
Value adjustments (182,462,605.44) (282,695,930.07)
in respect of formation expenses and of tangible and intangible fixed assets
(Notes 4, 5 and 6)(227,538,340.25) (229,266,132.75)
in respect of current assets (Note 30) 45,075,734.81 (53,429,797.32)
Other operating expenses (Note 31) (77,198,558.89) (120,676,416.51)
NET FINANCIAL RESULT 168,376,990.63 (70,749,863.34)
Income from participating interests 0.00 5,378.80
derived from affiliated undertakings 0.00 0.00
other income from participating interests 0.00 5,378.80
Income from other investments and loans forming part of the fixed assets 0.00 0.00
derived from affiliated undertakings 0.00 0.00
other income 0.00 0.00
Other interest receivable and similar income (Note 32) 265,786,743.16 38,218,901.31
derived from affiliated undertakings 0.00 0.00
other interest and similar income 265,786,743.16 38,218,901.31
Share of profit or loss of undertakings accounted for under the equity method
(Note 8)(20,114.03) (17,183.39)
Value adjustments in respect of financial assets and of investments held as
current assets (Note 7)(13,157,088.97) (5,650,675.41)
Interest payable and similar expenses (Note 33) (84,232,549.53) (103,306,284.65)
concerning affiliated undertakings 0.00 0.00
other interest and similar expenses (84,232,549.53) (103,306,284.65)
TAXES AND RESULT OF THE FINANCIAL YEAR
Tax on profit or loss (Note 34) (14,995,949.55) 4,558,175.27
Profit or loss after taxation 114,609,977.22 270,362,527.05
Other taxes not shown above (Note 35) (10,523,376.93) (5,517,638.41)
Profit or loss for the financial year before minority interests 104,086,600.29 264,844,888.64
Minority interests (154,140.08) (307,369.97)
PROFIT OR LOSS FOR THE FINANCIAL YEAR 103,932,460.21 264,537,518.67
CONSOLIDATED PROFIT AND LOSS ACCOUNT FROM JANUARY 1, 2016 TO DECEMBER 31, 2016
The accompanying notes form an integral part of these consolidated accounts. (Expressed in Euro)
19CONSOLIDATED AUDIT REPORT
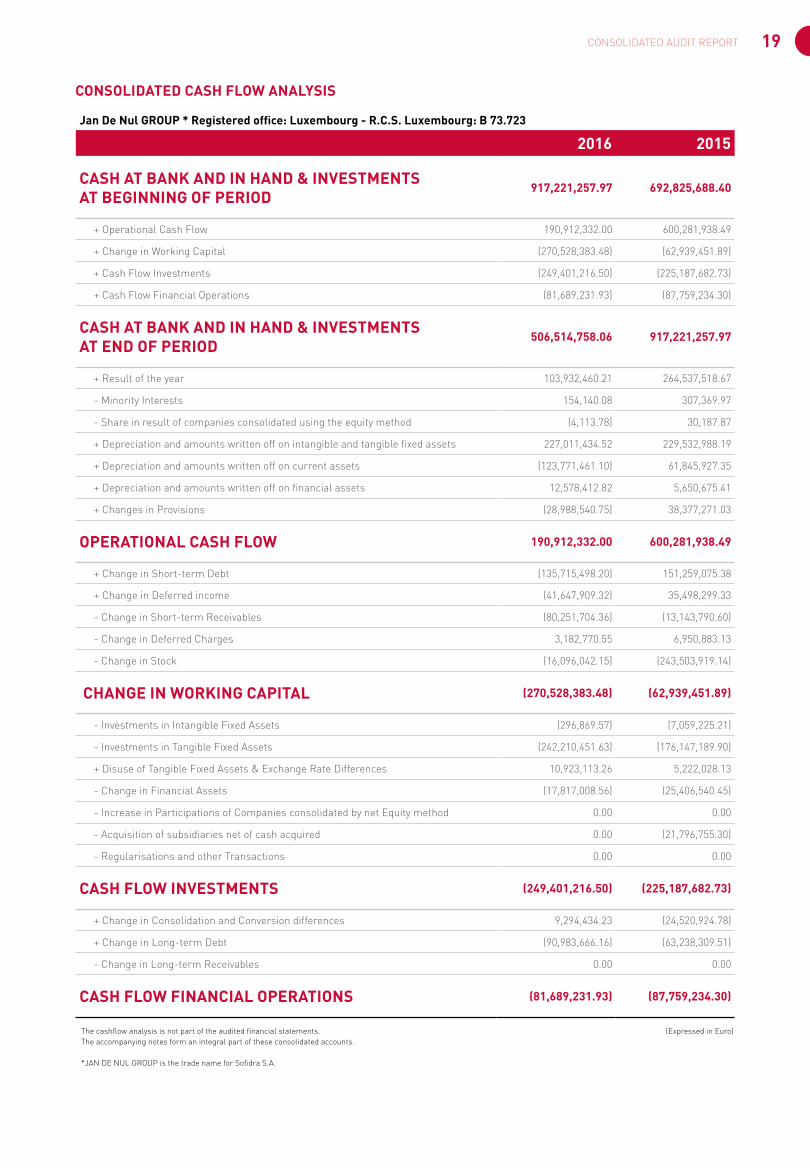
Jan De Nul GROUP * Registered office: Luxembourg - R.C.S. Luxembourg: B 73.723
2016 2015
CASH AT BANK AND IN HAND & INVESTMENTS AT BEGINNING OF PERIOD
917,221,257.97 692,825,688.40
+ Operational Cash Flow 190,912,332.00 600,281,938.49
+ Change in Working Capital (270,528,383.48) (62,939,451.89)
+ Cash Flow Investments (249,401,216.50) (225,187,682.73)
+ Cash Flow Financial Operations (81,689,231.93) (87,759,234.30)
CASH AT BANK AND IN HAND & INVESTMENTS AT END OF PERIOD
506,514,758.06 917,221,257.97
+ Result of the year 103,932,460.21 264,537,518.67
- Minority Interests 154,140.08 307,369.97
- Share in result of companies consolidated using the equity method (4,113.78) 30,187.87
+ Depreciation and amounts written off on intangible and tangible fixed assets 227,011,434.52 229,532,988.19
+ Depreciation and amounts written off on current assets (123,771,461.10) 61,845,927.35
+ Depreciation and amounts written off on financial assets 12,578,412.82 5,650,675.41
+ Changes in Provisions (28,988,540.75) 38,377,271.03
OPERATIONAL CASH FLOW 190,912,332.00 600,281,938.49
+ Change in Short-term Debt (135,715,498.20) 151,259,075.38
+ Change in Deferred income (41,647,909.32) 35,498,299.33
- Change in Short-term Receivables (80,251,704.36) (13,143,790.60)
- Change in Deferred Charges 3,182,770.55 6,950,883.13
- Change in Stock (16,096,042.15) (243,503,919.14)
CHANGE IN WORKING CAPITAL (270,528,383.48) (62,939,451.89)
- Investments in Intangible Fixed Assets (296,869.57) (7,059,225.21)
- Investments in Tangible Fixed Assets (242,210,451.63) (176,147,189.90)
+ Disuse of Tangible Fixed Assets & Exchange Rate Differences 10,923,113.26 5,222,028.13
- Change in Financial Assets (17,817,008.56) (25,406,540.45)
- Increase in Participations of Companies consolidated by net Equity method 0.00 0.00
- Acquisition of subsidiaries net of cash acquired 0.00 (21,796,755.30)
- Regularisations and other Transactions 0.00 0.00
CASH FLOW INVESTMENTS (249,401,216.50) (225,187,682.73)
+ Change in Consolidation and Conversion differences 9,294,434.23 (24,520,924.78)
+ Change in Long-term Debt (90,983,666.16) (63,238,309.51)
- Change in Long-term Receivables 0.00 0.00
CASH FLOW FINANCIAL OPERATIONS (81,689,231.93) (87,759,234.30)
CONSOLIDATED CASH FLOW ANALYSIS
The cashflow analysis is not part of the audited financial statements. (Expressed in Euro) The accompanying notes form an integral part of these consolidated accounts. *JAN DE NUL GROUP is the trade name for Sofidra S.A.
20
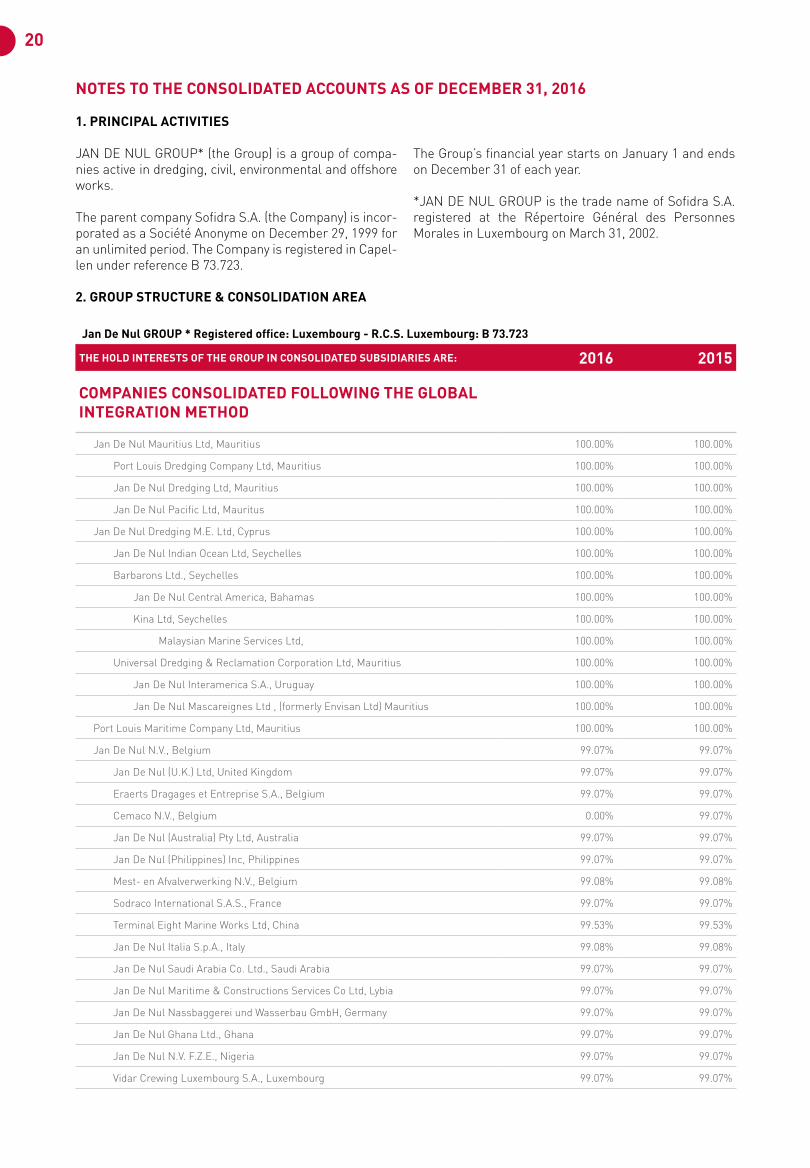
NOTES TO THE CONSOLIDATED ACCOUNTS AS OF DECEMBER 31, 2016
1. PRINCIPAL ACTIVITIES
JAN DE NUL GROUP* (the Group) is a group of compa-nies active in dredging, civil, environmental and offshore works.
The parent company Sofidra S.A. (the Company) is incor-porated as a Société Anonyme on December 29, 1999 for an unlimited period. The Company is registered in Capel-len under reference B 73.723.
The Group’s financial year starts on January 1 and ends on December 31 of each year.
*JAN DE NUL GROUP is the trade name of Sofidra S.A. registered at the Répertoire Général des Personnes Morales in Luxembourg on March 31, 2002.
2. GROUP STRUCTURE & CONSOLIDATION AREA
Jan De Nul GROUP * Registered office: Luxembourg - R.C.S. Luxembourg: B 73.723
THE HOLD INTERESTS OF THE GROUP IN CONSOLIDATED SUBSIDIARIES ARE: 2016 2015
COMPANIES CONSOLIDATED FOLLOWING THE GLOBAL INTEGRATION METHOD
Jan De Nul Mauritius Ltd, Mauritius 100.00% 100.00%
Port Louis Dredging Company Ltd, Mauritius 100.00% 100.00%
Jan De Nul Dredging Ltd, Mauritius 100.00% 100.00%
Jan De Nul Pacific Ltd, Mauritus 100.00% 100.00%
Jan De Nul Dredging M.E. Ltd, Cyprus 100.00% 100.00%
Jan De Nul Indian Ocean Ltd, Seychelles 100.00% 100.00%
Barbarons Ltd., Seychelles 100.00% 100.00%
Jan De Nul Central America, Bahamas 100.00% 100.00%
Kina Ltd, Seychelles 100.00% 100.00%
Malaysian Marine Services Ltd, 100.00% 100.00%
Universal Dredging & Reclamation Corporation Ltd, Mauritius 100.00% 100.00%
Jan De Nul Interamerica S.A., Uruguay 100.00% 100.00%
Jan De Nul Mascareignes Ltd , (formerly Envisan Ltd) Mauritius 100.00% 100.00%
Port Louis Maritime Company Ltd, Mauritius 100.00% 100.00%
Jan De Nul N.V., Belgium 99.07% 99.07%
Jan De Nul (U.K.) Ltd, United Kingdom 99.07% 99.07%
Eraerts Dragages et Entreprise S.A., Belgium 99.07% 99.07%
Cemaco N.V., Belgium 0.00% 99.07%
Jan De Nul (Australia) Pty Ltd, Australia 99.07% 99.07%
Jan De Nul (Philippines) Inc, Philippines 99.07% 99.07%
Mest- en Afvalverwerking N.V., Belgium 99.08% 99.08%
Sodraco International S.A.S., France 99.07% 99.07%
Terminal Eight Marine Works Ltd, China 99.53% 99.53%
Jan De Nul Italia S.p.A., Italy 99.08% 99.08%
Jan De Nul Saudi Arabia Co. Ltd., Saudi Arabia 99.07% 99.07%
Jan De Nul Maritime & Constructions Services Co Ltd, Lybia 99.07% 99.07%
Jan De Nul Nassbaggerei und Wasserbau GmbH, Germany 99.07% 99.07%
Jan De Nul Ghana Ltd., Ghana 99.07% 99.07%
Jan De Nul N.V. F.Z.E., Nigeria 99.07% 99.07%
Vidar Crewing Luxembourg S.A., Luxembourg 99.07% 99.07%
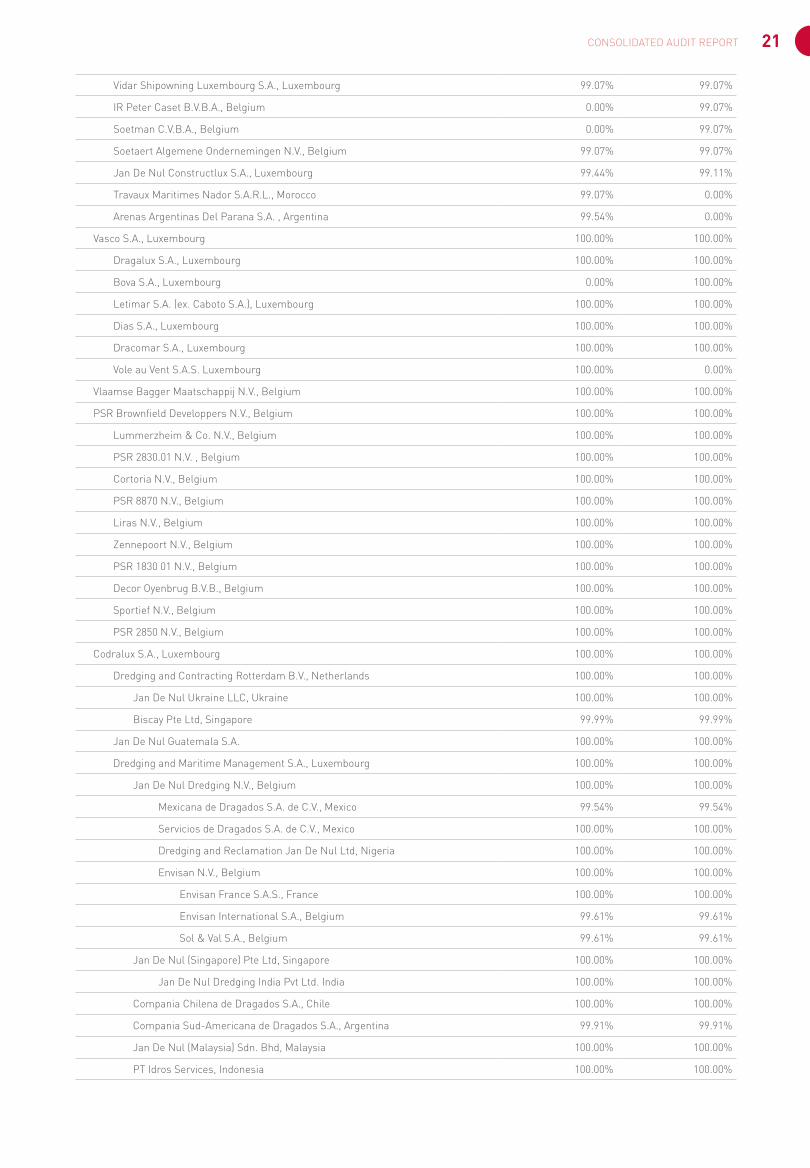
21CONSOLIDATED AUDIT REPORT
Vidar Shipowning Luxembourg S.A., Luxembourg 99.07% 99.07%
IR Peter Caset B.V.B.A., Belgium 0.00% 99.07%
Soetman C.V.B.A., Belgium 0.00% 99.07%
Soetaert Algemene Ondernemingen N.V., Belgium 99.07% 99.07%
Jan De Nul Constructlux S.A., Luxembourg 99.44% 99.11%
Travaux Maritimes Nador S.A.R.L., Morocco 99.07% 0.00%
Arenas Argentinas Del Parana S.A. , Argentina 99.54% 0.00%
Vasco S.A., Luxembourg 100.00% 100.00%
Dragalux S.A., Luxembourg 100.00% 100.00%
Bova S.A., Luxembourg 0.00% 100.00%
Letimar S.A. (ex. Caboto S.A.), Luxembourg 100.00% 100.00%
Dias S.A., Luxembourg 100.00% 100.00%
Dracomar S.A., Luxembourg 100.00% 100.00%
Vole au Vent S.A.S. Luxembourg 100.00% 0.00%
Vlaamse Bagger Maatschappij N.V., Belgium 100.00% 100.00%
PSR Brownfield Developpers N.V., Belgium 100.00% 100.00%
Lummerzheim & Co. N.V., Belgium 100.00% 100.00%
PSR 2830.01 N.V. , Belgium 100.00% 100.00%
Cortoria N.V., Belgium 100.00% 100.00%
PSR 8870 N.V., Belgium 100.00% 100.00%
Liras N.V., Belgium 100.00% 100.00%
Zennepoort N.V., Belgium 100.00% 100.00%
PSR 1830 01 N.V., Belgium 100.00% 100.00%
Decor Oyenbrug B.V.B., Belgium 100.00% 100.00%
Sportief N.V., Belgium 100.00% 100.00%
PSR 2850 N.V., Belgium 100.00% 100.00%
Codralux S.A., Luxembourg 100.00% 100.00%
Dredging and Contracting Rotterdam B.V., Netherlands 100.00% 100.00%
Jan De Nul Ukraine LLC, Ukraine 100.00% 100.00%
Biscay Pte Ltd, Singapore 99.99% 99.99%
Jan De Nul Guatemala S.A. 100.00% 100.00%
Dredging and Maritime Management S.A., Luxembourg 100.00% 100.00%
Jan De Nul Dredging N.V., Belgium 100.00% 100.00%
Mexicana de Dragados S.A. de C.V., Mexico 99.54% 99.54%
Servicios de Dragados S.A. de C.V., Mexico 100.00% 100.00%
Dredging and Reclamation Jan De Nul Ltd, Nigeria 100.00% 100.00%
Envisan N.V., Belgium 100.00% 100.00%
Envisan France S.A.S., France 100.00% 100.00%
Envisan International S.A., Belgium 99.61% 99.61%
Sol & Val S.A., Belgium 99.61% 99.61%
Jan De Nul (Singapore) Pte Ltd, Singapore 100.00% 100.00%
Jan De Nul Dredging India Pvt Ltd. India 100.00% 100.00%
Compania Chilena de Dragados S.A., Chile 100.00% 100.00%
Compania Sud-Americana de Dragados S.A., Argentina 99.91% 99.91%
Jan De Nul (Malaysia) Sdn. Bhd, Malaysia 100.00% 100.00%
PT Idros Services, Indonesia 100.00% 100.00%
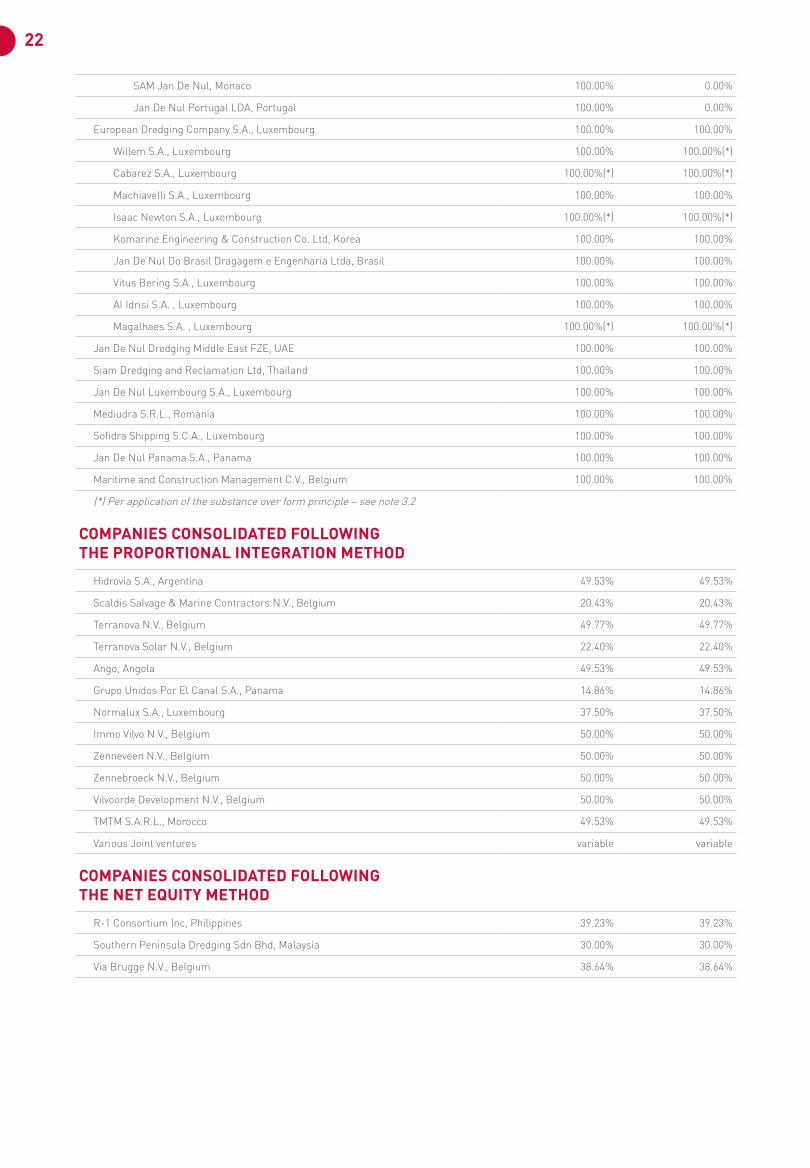
22
SAM Jan De Nul, Monaco 100.00% 0.00%
Jan De Nul Portugal LDA, Portugal 100.00% 0.00%
European Dredging Company S.A., Luxembourg 100.00% 100.00%
Willem S.A., Luxembourg 100.00% 100.00%(*)
Cabarez S.A., Luxembourg 100.00%(*) 100.00%(*)
Machiavelli S.A., Luxembourg 100.00% 100.00%
Isaac Newton S.A., Luxembourg 100.00%(*) 100.00%(*)
Komarine Engineering & Construction Co. Ltd, Korea 100.00% 100.00%
Jan De Nul Do Brasil Dragagem e Engenharia Ltda, Brasil 100.00% 100.00%
Vitus Bering S.A., Luxembourg 100.00% 100.00%
Al Idrisi S.A. , Luxembourg 100.00% 100.00%
Magalhaes S.A. , Luxembourg 100.00%(*) 100.00%(*)
Jan De Nul Dredging Middle East FZE, UAE 100.00% 100.00%
Siam Dredging and Reclamation Ltd, Thaïland 100.00% 100.00%
Jan De Nul Luxembourg S.A., Luxembourg 100.00% 100.00%
Mediudra S.R.L., Romania 100.00% 100.00%
Sofidra Shipping S.C.A., Luxembourg 100.00% 100.00%
Jan De Nul Panama S.A., Panama 100.00% 100.00%
Maritime and Construction Management C.V., Belgium 100.00% 100.00%
(*) Per application of the substance over form principle – see note 3.2
COMPANIES CONSOLIDATED FOLLOWING THE PROPORTIONAL INTEGRATION METHOD
Hidrovia S.A., Argentina 49.53% 49.53%
Scaldis Salvage & Marine Contractors N.V., Belgium 20.43% 20.43%
Terranova N.V., Belgium 49.77% 49.77%
Terranova Solar N.V., Belgium 22.40% 22.40%
Ango, Angola 49.53% 49.53%
Grupo Unidos Por El Canal S.A., Panama 14.86% 14.86%
Normalux S.A., Luxembourg 37.50% 37.50%
Immo Vilvo N.V., Belgium 50.00% 50.00%
Zenneveen N.V., Belgium 50.00% 50.00%
Zennebroeck N.V., Belgium 50.00% 50.00%
Vilvoorde Development N.V., Belgium 50.00% 50.00%
TMTM S.A.R.L., Morocco 49.53% 49.53%
Various Joint ventures variable variable
COMPANIES CONSOLIDATED FOLLOWING THE NET EQUITY METHOD
R-1 Consortium Inc, Philippines 39.23% 39.23%
Southern Peninsula Dredging Sdn Bhd, Malaysia 30.00% 30.00%
Via Brugge N.V., Belgium 38.64% 38.64%
23CONSOLIDATED AUDIT REPORT
COMPANIES EXCLUDED FROM THE CONSOLIDATION AREA
One company has been excluded from the consolidation area as
the Management considers that it does not exert nor control nor
significant influence while it owns more than 20% of the voting
shares of this subsidiary.
This subsidiary has been kept at historical cost, less impairment. In
application of article 338.b) of the Luxembourg Law on Commercial
Companies, the information required by article 337.2.b) have been
omitted.
MODIFICATION IN THE CONSOLIDATION AREA – CURRENT YEAR
During the year 2016, the following modifications have been performed:
• Cemaco N.V., Belgium, IR Peter Caset B.V.B.A., Belgium and Soetman C.V.B.A., Belgium have been absorbed by Jan De Nul N.V.,
Belgium ;
• Travaux Maritimes Nador S.A.R.L., Morocco, Arenas Argentinas Del Parana S.A., Argentina, Vole au Vent S.A.S., Luxembourg, SAM
Jan De Nul, Monaco and Jan De Nul Portugal LDA, Portugal have been incorporated by a subsidiary of the Group ;
• Bova S.A., Luxembourg has been liquidated during the year. This company is no more consolidated.
MODIFICATION IN THE CONSOLIDATION AREA – PRIOR YEAR
During the year 2015, the following modifications have been performed:
• Dracomar S.A., Luxembourg, Jan De Nul Constructlux S.A., Luxembourg and Jan De Nul N.V. F.Z.E., Nigeria have been incorporated
by subsidiaries of the Group ;
• Jan De Nul Mozambique Ltda, Mozambique, Isaac Newton S.A., Luxembourg, Vidar Shipowning S.A., Luxembourg, Vidar Crewing
Luxembourg S.A., Luxembourg, IR Peter Caset B.V.B.A., Belgium, Soetman C.V.B.A., Belgium and Soetaert Algemeen Ondernemingen
N.V., Belgium, have been acquired from third parties ;
• Trivisa S.A, Luxembourg, Zheng S.A., Luxembourg, Astrolabe S.A., Luxembourg and Comarlux S.A., Luxembourg have been
liquidated. These companies are no more consolidated.
24
3. SUMMARY OF SIGNIFICANT ACCOUNTING POLICIES 3.1. Principles of consolidation
The consolidated accounts are prepared in accordance with the Section XVI of the amended Luxembourg law on commercial companies dated August 10, 1915 (the Law). The Group applied the prescriptions of article 319 (5) of the Law for the presentation of certain transactions (see Note 3.4 for further details).
Date of first consolidation
The Company acquired in 2000 Jan De Nul Mauritius Ltd and subsidiaries and in 2001 Jan De Nul N.V., Bel-gium and subsidiaries. In both operations, ships included under fixed assets were revaluated. The revaluation was based on a valuation report issued by an independent expert. No deferred taxes were accounted for on this reevaluation of assets. These operations restructured the initial Group Jan De Nul N.V. and subsidiairies, Bel-gium. Date of the first consolidation is fixed at the fiscal year starting January 1st, 2001. The revaluations have been fully depreciated as of December 31, 2016 and 2015.
Companies consolidated following the global integration method
Subsidiaries are in principle all entities (including spe-cial purpose entities) over which the Group has the power to govern the financial and operating policies generally accompanying a shareholding of more than one half of voting rights. The existence and effect of potential voting rights currently exercisable or convertible are considered when assessing whether the Group controls another entity.
Subsidiaries are consolidated using the global integra-tion method. Subsidiaries are consolidated from the date on which control is transferred to the Group. They are deconsolidated from the date control ceases.
Intercompany transactions, balances and unrealized gains on transactions between Group companies are eliminated. Accounting policies of subsidiaries have been exchanged where necessary to ensure consistency with the policies adopted by the Group.
Minority interests are that portion of the profit or loss and net assets of a subsidiary attributable to equity interests that are not owned, directly or indirectly through subsid-iaries, by the parent. Equity attributable to the interest of minority shareholder interests in subsidiaries is shown separately in the consolidated financial statements.
Companies consolidated following the proportional integra-tion method
Joint ventures are those entities over whose activities the Group has joint control, established by contractual agreement. Joint Ventures and Jointly controlled entities are accounted for using the proportional consolidation method.
Unrealized gains on transactions between the Group and its Joint Ventures and jointly controlled entities are eliminated to the extent of the Group’s interest in these entities. Unrealized losses are also eliminated unless the transaction provides evidence of an impairment of the asset transferred. Accounting policies of Joint Ven-tures and jointly controlled entities have been changed where necessary to ensure consistency with the policies adopted by the Group.
Companies consolidated following the net equity method
Associates are all entities over which the Group has sig-nificant influence but not control, generally accompany-ing a shareholding of between 20% and 50% of the voting rights. Investments in associates are accounted for using the equity method of accounting and are initially recog-nized at cost.
The Group’s share of its associates’ post acquisition prof-its is recognized in the profit and loss account under the caption Share of profit or loss of undertakings accounted for under the equity method. The cumulative post-acquisition movements are adjusted against the carrying amount of the investment. When the Group’s share of losses in an associate equals or exceeds its interest in the associate, the Group recognizes further losses under the caption Other provisions.
Unrealized gains on transactions between the Group and its associates are eliminated to the extent of the Group’s interest in the associates. Unrealized losses are also eliminated unless the transaction provides evidence of an impairment of the asset transferred. Accounting pol-icies of associates have been changed where necessary to ensure consistency with the policies adopted by the Group.
25CONSOLIDATED AUDIT REPORT
3.2. Accounting methods
Foreign currencies
• The Company’s accounts are kept in Euro (EUR) and the consolidated accounts are expressed in this currency. Transactions in any currency other than the EUR are translated at exchange rates fixed monthly by the Group. At balance sheet date, the translation is done based on the following methods:
- Banks are translated at exchange rates prevailing at the balance sheet date ;
- For Debtors and Creditors, realized exchange gains and losses are recorded in the profit and loss account as well as the unrealized exchange losses; unrealized exchange gains are booked in a balance sheet account presented under Other creditors;
- Other accounts are translated at the historical exchange rate.
• The annual accounts of the subsidiaries kept in another currency than EUR are translated – in order to include those in the consolidated financial statements - as follows:
- Assets and liabilities other than Capital and reserves are translated at the exchange rates prevailing at the balance sheet date ;
- Capital and reserves are translated at rates prevailing at the first consolidation or at historical rates ;
- Income and charges are translated at the average exchange rate of the year.
Gains and losses resulting from the translation of capital, reserves, income and charges into EUR are accumulated in a separate account under shareholders’ equity called Translation differences.
Exchange gains and exchange losses resulting from the elimination of intercompany debtors and creditors accounts are recorded in the Other interest and similar expenses or Other interest and similar income captions respectively.
Acquisition differences
Up to 2012, positive and negative acquisition differences related to the acquisition of subsidiaries are recorded under Other reserves in the Capital and reserves. Start-ing from 2013, positive acquisition differences related to the acquisition of subsidiaries are allocated to certain assets and/or liabilities, and for the unallocated portion to Goodwill (within the Intangible assets caption); negative acquisition differences are recorded under Other reserves in the Capital and reserves caption. The Goodwill is depre-ciated over a 5 years period.
Formation expenses
Formation expenses are entirely depreciated during the year of their acquisition.
Intangible and tangible assets
Vessels that were brought in during the first year of con-solidation (2001) are recognized at the revaluated acqui-sition cost, while ships acquired since then are recog-nized at acquisition cost.
Intangible and other tangible assets are recognized at acquisition cost. Replacement spare parts for vessels, which are constantly being replaced and whose overall value is of secondary importance to the Group are shown under Plant and machinery at a fixed quantity and value, as the quantity, value and composition thereof do not vary materially.
Vessels are depreciated on a linear or degressive method over their expected lifetime or a period of 12 years to 20 years, whichever is the shortest. Intangible and other tangible fixed assets are depreciated using a linear or degressive method over their expected lifetime. Land and assets under construction are not depreciated.
Where the Group considers that an intangible or tangi-ble asset has suffered a durable depreciation in value, an additional write-down is recorded in order to reflect this loss. These value adjustments are not continued if the reasons for which the value adjustments were made have ceased to apply.
Financial assets
Financial assets represent participations in non-con-solidated companies, guarantees and long-term loans. Shares in participating interests are recognized at pur-chase price. Guarantees and long-term loans are recog-nized at nominal value including the expenses incidental thereto.
In case of a durable depreciation in value according to the opinion of the Board of Directors, value adjustments are made in respect of fixed assets, so that they are valued at the lower figure to be attributed to them at the balance sheet date. These value adjustments are not continued if the reasons for which the value adjustments were made have ceased to apply.
Stocks
Stocks represent raw materials, heavy material held for resale, work in progress, finished goods and merchan-dise.
Stocks of Raw materials and consumables are valued at the lower of purchase price calculated on the basis of the “first in, first out” (FIFO) method or market value. A value adjustment is recorded where the economic value
26
is below the purchase price. These value adjustments are not continued if the reasons for which the value adjust-ments were made have ceased to apply.
Heavy material held for resale represent on-shore heavy equipment and steel pipes that are not allocated to a par-ticular site at year end and are available for sale, within or out of the Group. Heavy material held for resale is included under the Raw materials and consumables caption. Heavy material held for resale is recognized at the net book value valid at the date of transfer from tangible assets (or stock) to stock. A value adjustment is recorded where the economic value is below the purchase price. These value adjustments are not continued if the reasons for which the value adjustments were made have ceased to apply.
Finished goods and goods for resale represent mainly brownfields pieces of land acquired and the related cost for their rehabilitation. The gross book value includes the initial acquisition price paid and the costs directly attrib-utable to the rehabilitation of the land. A value adjust-ment is recorded where the economic value is below the net book value. These value adjustments are not contin-ued if the reasons for which the value adjustments were made have ceased to apply.
Work and contracts in progress is valued at the lower of production cost including the purchase price of the raw materials and consumables, the costs directly attributa-ble to the project in question and a proportion of the costs indirectly attributable to the product in question, and market value. A value adjustment is recorded where the expected realization value is below the production cost. These value adjustments are not continued if the reasons for which the value adjustments were made have ceased to apply.
Debtors
Debtors are recognized at their nominal value. They are subject to value adjustments where their recovery is compromised. These value adjustments are not contin-ued if the reasons for which the value adjustments were made have ceased to apply.
Transferable securities
Transferable securities are valued at the lower of purchase cost, including expenses incidental thereto and calcu-lated on the basis of weighted average prices method, expressed in the currency in which the annual accounts are prepared and market value. A value adjustment is recorded where the market value is lower than the pur-chase cost. These value adjustments are not continued if the reasons for which the value adjustments were made have ceased to apply.
The market value corresponds to:
• the last available quote on the valuation day for trans-ferable securities listed on a stock exchange or dealt in on another regulated market;
• the probable realisation value estimated with care and in good faith by the Board of Directors
• for transferable securities not listed on a stock exchange or not dealt in on another regulated market and for transferable securities listed on a stock exchange or dealt in on another regulated market where the latest quote is not representative.
Prepayments
This asset item includes expenditure incurred during the financial year but relating to a subsequent financial year.
Provisions
Provisions are intended to cover losses or debts the nature of which is clearly defined and which, at the date of the balance sheet are either likely to be incurred or certain to be incurred but uncertain as to their amount or as to the date on which they will arise.
Deferred taxes
Deferred taxes are recognized for temporary differences due to consolidation retreatments that will result in deductible or taxable amounts or from tax losses carried forward. Deferred tax assets are fully impaired except if they can be offset against statutory tax accruals and/or deferred tax liabilities.
Debts
Debts are valued at their nominal value. See also Note 3.4.
Deferred income
This liability item includes income received during the financial year or previous years but relating to a sub-sequent financial year. Among these, Group’s techni-cal contribution to some vessels invoiced by the Group to the shipyard in charge of the ship’s construction are retreated from the revenues to the deferred income and amortized at the same rate as the related tangible asset.
Deferred income also includes profit on intercompany disposals on Heavy material held for resale which can-not be individually identified. These positions are recog-nized in revenues over a 2.5 years period. This method is intended to deal appropriately with profits on intercom-pany disposals of fixed assets or inventory items that are whether fungible whether difficult to retreat individually over their remaining useful lifetime (among others the stock of pipes).
27CONSOLIDATED AUDIT REPORT
Net turnover
The Net turnover comprises the amounts derived from the sale of products and the provision of services falling within the Group’s ordinary activities, after deductions of sales rebates and of value added tax and other taxes directly linked to the turnover.
Derivatives
Unrealized losses and gains on derivatives subscribed for hedging of assets or liabilities that are present in the bal-ance sheet at year end (example: Forex deals hedging trade debtors in foreign currency that are booked at year end and will be collected on next year) are recognized in the profit and loss account concommitently with the revenue/loss recognition of the hedged asset or liability. Unrealized losses and gains on derivatives subscribed for hedging of transactions occurring in the future and – as such - not present in the balance sheet at year end (example: Energy swaps in relation with next year’s fuel purchases – Forex deals hedging trade debtors not yet booked at year end but expected to be recognized on next year) are not accrued but are mentioned in off balance sheet commitments.
Unrealized losses on derivatives not subscribed for hedg-ing purpose are accrued for and recognized in profit and loss at year end.
Realized losses and gains on derivatives are recognized in profit and loss account during the year of their realiza-tion.
Substance over form
The presentation of the amounts recorded on the con-solidated balance sheet and consolidated profit and loss account should refer to the substance of the operation rather than its legal form.
This principle has been applied to the consolidation method applied to certain subsidiaries which are – based on the voting rights - controlled by a third party but whose effective control is exercised by the Group.
This principle has been applied to some receivables, term deposits and liabilities in relation with financing struc-tures of some of the fleet’s vessels to reflect the actual financial position and delayed income recognition gener-ated by these structures. In 2015, per the application of this principle, the Other receivables had been decreased with an amount of 179,174,965.94 EUR, the Cash at bank had been decreased with an amount of 99,286,454.65 EUR, the Amounts owed to credit institutions had been decreased with an amount of 284,423,817.87 EUR and a Deferred income position created for an amount of 30,241,515.59 EUR. The Deferred income generated by this retreatment represented the income from interests differential to be recognized as a financial income over time. In 2016, this financing structure has been termi-nated; as a consequence, no retreatment has been per-formed in the 2016 balance sheet.
3.3 Comparative figures
The provisions of the law dated December 18, 2015 on annual accounts and consolidated accounts and the Règlement Grand-Ducal dated December 18, 2015 on the layout of balance sheet and profit and loss accounts, amending the law of December 19, 2002, have been transposed in these consolidated annual accounts. The layouts and the headings of certain balance sheet and profit and loss captions have been modified accordingly.
In order to satisfy to the principle of comparability with prior year figures and as a consequence of the above, comparative figures have been reclassified. The main changes to comparative figures are as follows:
• the content of the 2015 caption Subordinated debts has been allocated to the captions Amounts owed to credit institutions and Other creditors with amounts of respec-tively 52,500,000.00 EUR and 60,167,884.00 EUR ;
• the content of the 2015 captions Tax and social secu-rity debts - Tax and Tax and social security debts - Social security has been allocated to the captions Tax authorities and Social security authorities with amounts of respec-tively 41,215,362.00 EUR and 6,412,689.67 EUR ;
• the amount of 11,884,487.74 EUR representing the 2015 reversal of value corrections on current assets (stocks and receivables) has been transferred from the caption Other operating income to the caption Value adjustments – in respect of current assets ;
• the amount of 4,275,324.33 EUR has been trans-ferred from the caption Extraordinary income to the cap-tion Other operating income ;
• the amount of 5,247,045.72 EUR has been trans-ferred from the caption Extraordinary charges to the cap-tion Other operating charges.
3.4 Application of article 319 (5)
For the consolidated financial statements of the year ended December 31, 2016, the Group applied the pre-scriptions of article 319 (5) of the Law for the presenta-tion of certain transactions described hereunder. Per this rule, in the extraordinary situation where the strict appli-cation of the accounting principles of the Law would not provide a true and fair view of its financial position and of the results of its operations, the Group can derogate to these accounting principles in order to restore a proper presentation.
In application of the article 332 (1) of the Law, article 63 (1) of the amended Luxembourg law on annual accounts dated December 19, 2002 and the accounting methods described in Note 3.2, the debts should be presented at their nominal value. However, the captions Trade credi-tors and Other creditors include debts due to Group’s partners in the GUPC project that are repayable only if sufficient claims will be awarded to the Group and its partners as part of the arbitration process currently in
28
course (see Note 21). As these consolidated financial statements have been consistently prepared under the assumption that no claims will be awarded to GUPC and its shareholders (the related provisions for risks were based on the same assumption during previous years), these debts have not been valued using their nominal value but – instead – using the future reimbursement value which is actually nil under the same assump-tion. For the same reason, the Group has fully impaired its related receivables shown under Financial assets. Would the claims awarded in the future be above the threshold where amounts in relation with these debts would have to be reimbursed to partners, an equiva-lent amount would be received by the Group in relation with its fully impaired receivable so that the future profit and loss impact of these operations would be neutral. The impact of the above described modifications on the consolidated financial statements of the year ended December 31, 2016 are as follows:
• Debts shown under the captions Trade creditors becoming due and payable within one year and Other creditors becoming due and payable after more than one year amounting respectively to 10,473,748.19 EUR and 78,999,625.86 EUR have been booked as an income in the profit and loss for an amount of 85,493,829.30 EUR through the caption Other interest receivable and similar income – other interest and similar income;
• The difference between amounts booked from the balance sheet and those booked to the profit and loss are due to translation differences; the impact of the whole operation on the Profit for the financial year and on the Translation differences amounts to 85,493,829.30 EUR and 3,979,544.75 EUR respectively for a global positive net impact on the Group’s net equity of 89,473,374.05 EUR.
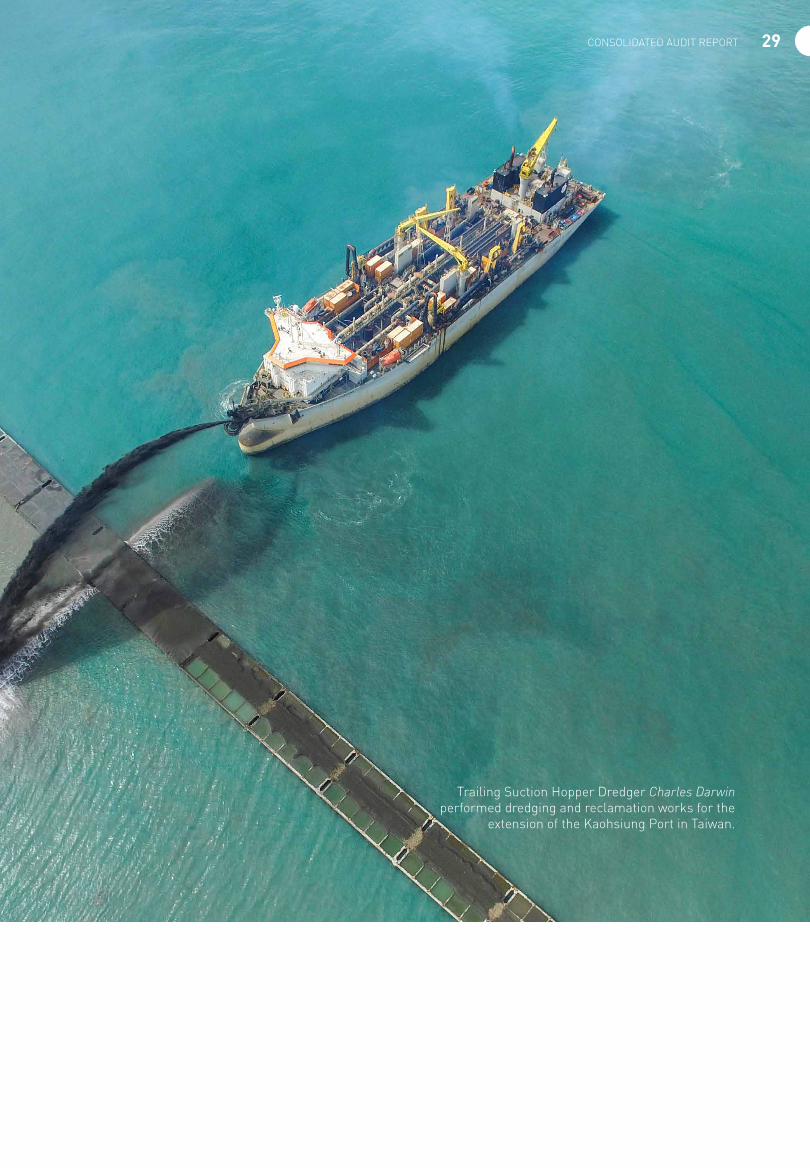
Trailing Suction Hopper Dredger Charles Darwin performed dredging and reclamation works for the
extension of the Kaohsiung Port in Taiwan.
29CONSOLIDATED AUDIT REPORT
30
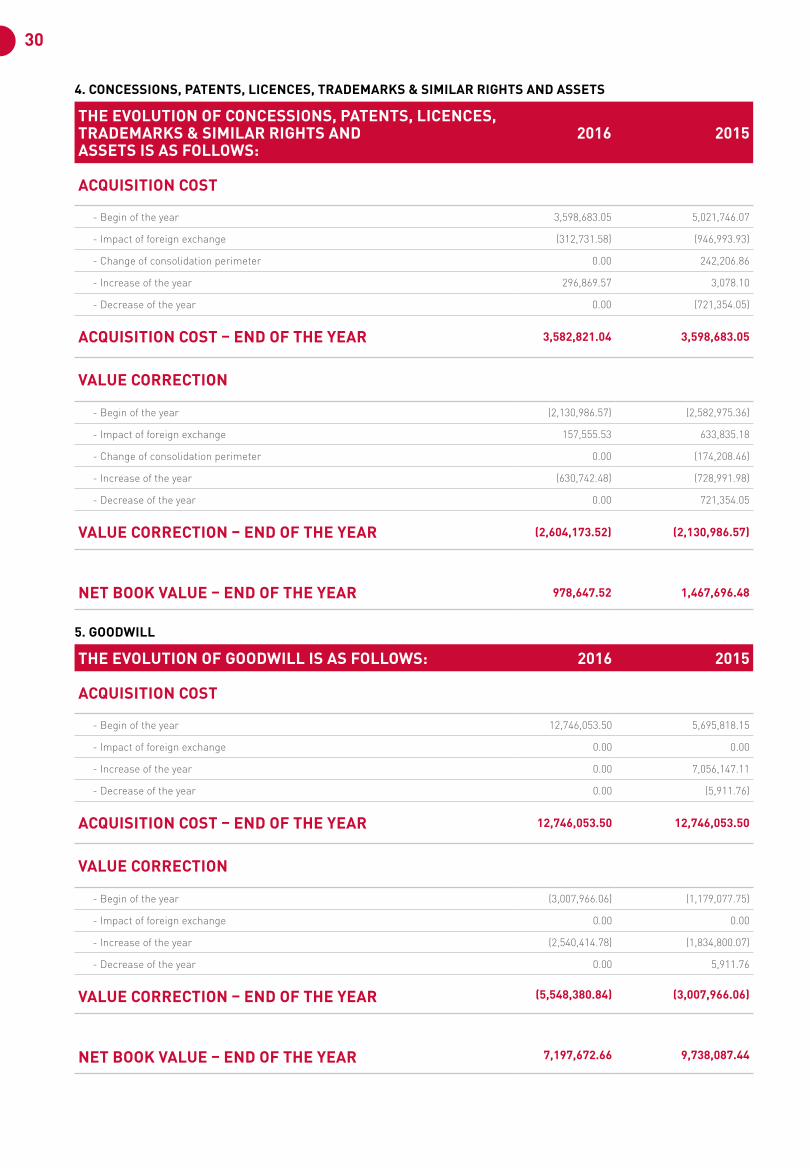
4. CONCESSIONS, PATENTS, LICENCES, TRADEMARKS & SIMILAR RIGHTS AND ASSETS
THE EVOLUTION OF CONCESSIONS, PATENTS, LICENCES, TRADEMARKS & SIMILAR RIGHTS AND ASSETS IS AS FOLLOWS:
2016 2015
ACQUISITION COST
- Begin of the year 3,598,683.05 5,021,746.07
- Impact of foreign exchange (312,731.58) (946,993.93)
- Change of consolidation perimeter 0.00 242,206.86
- Increase of the year 296,869.57 3,078.10
- Decrease of the year 0.00 (721,354.05)
ACQUISITION COST – END OF THE YEAR 3,582,821.04 3,598,683.05
VALUE CORRECTION
- Begin of the year (2,130,986.57) (2,582,975.36)
- Impact of foreign exchange 157,555.53 633,835.18
- Change of consolidation perimeter 0.00 (174,208.46)
- Increase of the year (630,742.48) (728,991.98)
- Decrease of the year 0.00 721,354.05
VALUE CORRECTION – END OF THE YEAR (2,604,173.52) (2,130,986.57)
NET BOOK VALUE – END OF THE YEAR 978,647.52 1,467,696.48
5. GOODWILL
THE EVOLUTION OF GOODWILL IS AS FOLLOWS: 2016 2015
ACQUISITION COST
- Begin of the year 12,746,053.50 5,695,818.15
- Impact of foreign exchange 0.00 0.00
- Increase of the year 0.00 7,056,147.11
- Decrease of the year 0.00 (5,911.76)
ACQUISITION COST – END OF THE YEAR 12,746,053.50 12,746,053.50
VALUE CORRECTION
- Begin of the year (3,007,966.06) (1,179,077.75)
- Impact of foreign exchange 0.00 0.00
- Increase of the year (2,540,414.78) (1,834,800.07)
- Decrease of the year 0.00 5,911.76
VALUE CORRECTION – END OF THE YEAR (5,548,380.84) (3,007,966.06)
NET BOOK VALUE – END OF THE YEAR 7,197,672.66 9,738,087.44
31CONSOLIDATED AUDIT REPORT
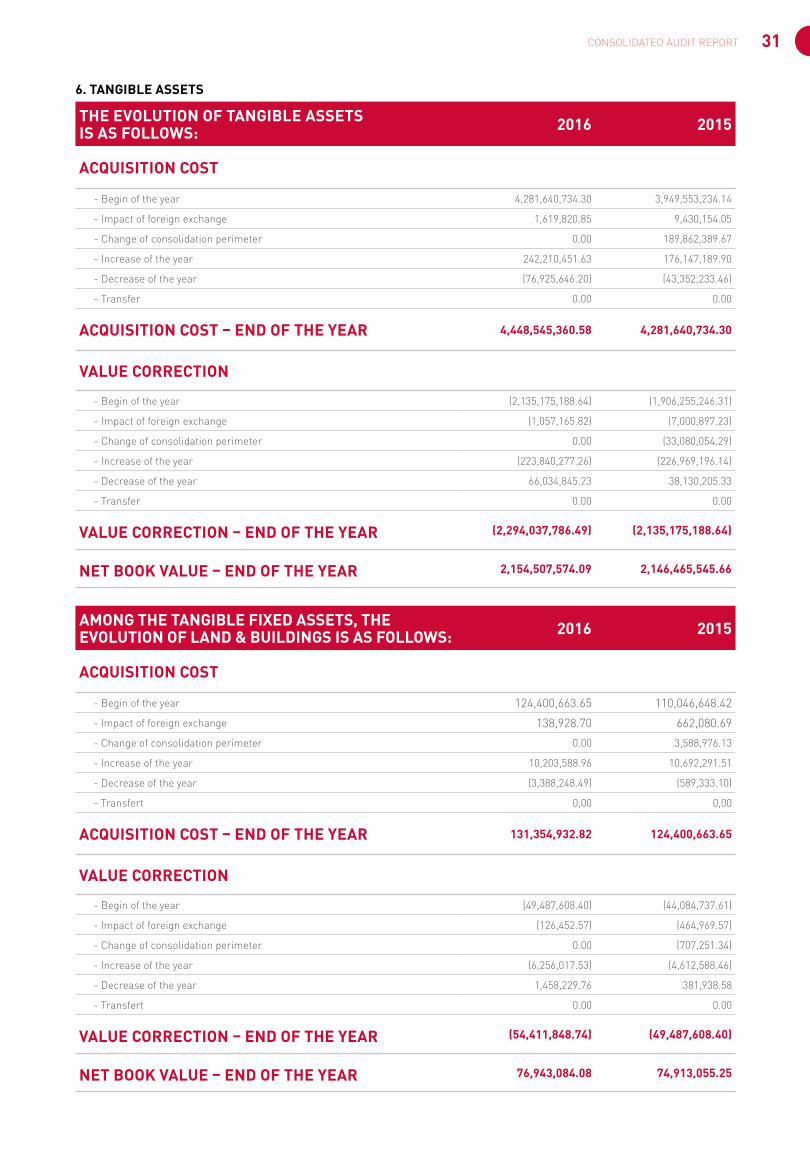
6. TANGIBLE ASSETS
THE EVOLUTION OF TANGIBLE ASSETS IS AS FOLLOWS: 2016 2015
ACQUISITION COST
- Begin of the year 4,281,640,734.30 3,949,553,234.14
- Impact of foreign exchange 1,619,820.85 9,430,154.05
- Change of consolidation perimeter 0.00 189,862,389.67
- Increase of the year 242,210,451.63 176,147,189.90
- Decrease of the year (76,925,646.20) (43,352,233.46)
- Transfer 0.00 0.00
ACQUISITION COST – END OF THE YEAR 4,448,545,360.58 4,281,640,734.30
VALUE CORRECTION
- Begin of the year (2,135,175,188.64) (1,906,255,246.31)
- Impact of foreign exchange (1,057,165.82) (7,000,897.23)
- Change of consolidation perimeter 0.00 (33,080,054.29)
- Increase of the year (223,840,277.26) (226,969,196.14)
- Decrease of the year 66,034,845.23 38,130,205.33
- Transfer 0.00 0.00
VALUE CORRECTION – END OF THE YEAR (2,294,037,786.49) (2,135,175,188.64)
NET BOOK VALUE – END OF THE YEAR 2,154,507,574.09 2,146,465,545.66
AMONG THE TANGIBLE FIXED ASSETS, THE EVOLUTION OF LAND & BUILDINGS IS AS FOLLOWS: 2016 2015
ACQUISITION COST
- Begin of the year 124,400,663.65 110,046,648.42
- Impact of foreign exchange 138,928.70 662,080.69
- Change of consolidation perimeter 0.00 3,588,976.13
- Increase of the year 10,203,588.96 10,692,291.51
- Decrease of the year (3,388,248.49) (589,333.10)
- Transfert 0,00 0,00
ACQUISITION COST – END OF THE YEAR 131,354,932.82 124,400,663.65
VALUE CORRECTION
- Begin of the year (49,487,608.40) (44,084,737.61)
- Impact of foreign exchange (126,452.57) (464,969.57)
- Change of consolidation perimeter 0.00 (707,251.34)
- Increase of the year (6,256,017.53) (4,612,588.46)
- Decrease of the year 1,458,229.76 381,938.58
- Transfert 0.00 0.00
VALUE CORRECTION – END OF THE YEAR (54,411,848.74) (49,487,608.40)
NET BOOK VALUE – END OF THE YEAR 76,943,084.08 74,913,055.25
32
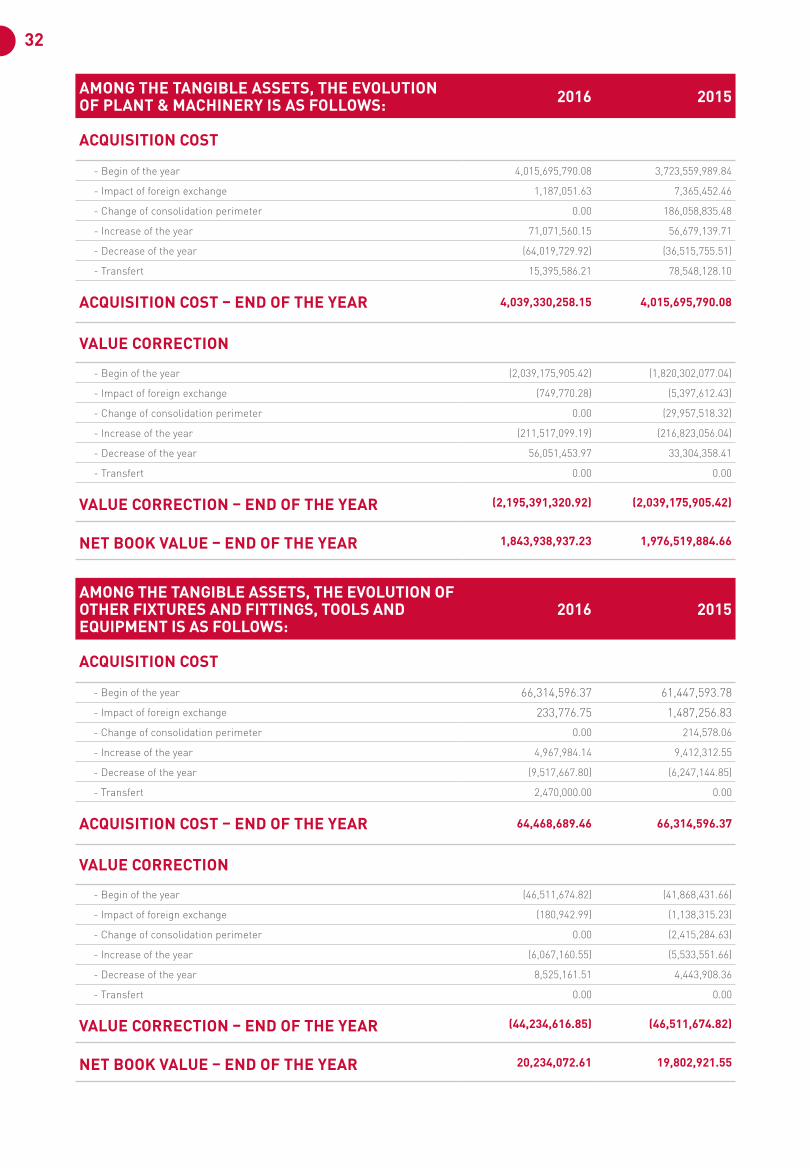
AMONG THE TANGIBLE ASSETS, THE EVOLUTION OF PLANT & MACHINERY IS AS FOLLOWS: 2016 2015
ACQUISITION COST
- Begin of the year 4,015,695,790.08 3,723,559,989.84
- Impact of foreign exchange 1,187,051.63 7,365,452.46
- Change of consolidation perimeter 0.00 186,058,835.48
- Increase of the year 71,071,560.15 56,679,139.71
- Decrease of the year (64,019,729.92) (36,515,755.51)
- Transfert 15,395,586.21 78,548,128.10
ACQUISITION COST – END OF THE YEAR 4,039,330,258.15 4,015,695,790.08
VALUE CORRECTION
- Begin of the year (2,039,175,905.42) (1,820,302,077.04)
- Impact of foreign exchange (749,770.28) (5,397,612.43)
- Change of consolidation perimeter 0.00 (29,957,518.32)
- Increase of the year (211,517,099.19) (216,823,056.04)
- Decrease of the year 56,051,453.97 33,304,358.41
- Transfert 0.00 0.00
VALUE CORRECTION – END OF THE YEAR (2,195,391,320.92) (2,039,175,905.42)
NET BOOK VALUE – END OF THE YEAR 1,843,938,937.23 1,976,519,884.66
AMONG THE TANGIBLE ASSETS, THE EVOLUTION OF OTHER FIXTURES AND FITTINGS, TOOLS AND EQUIPMENT IS AS FOLLOWS:
2016 2015
ACQUISITION COST
- Begin of the year 66,314,596.37 61,447,593.78
- Impact of foreign exchange 233,776.75 1,487,256.83
- Change of consolidation perimeter 0.00 214,578.06
- Increase of the year 4,967,984.14 9,412,312.55
- Decrease of the year (9,517,667.80) (6,247,144.85)
- Transfert 2,470,000.00 0.00
ACQUISITION COST – END OF THE YEAR 64,468,689.46 66,314,596.37
VALUE CORRECTION
- Begin of the year (46,511,674.82) (41,868,431.66)
- Impact of foreign exchange (180,942.99) (1,138,315.23)
- Change of consolidation perimeter 0.00 (2,415,284.63)
- Increase of the year (6,067,160.55) (5,533,551.66)
- Decrease of the year 8,525,161.51 4,443,908.36
- Transfert 0.00 0.00
VALUE CORRECTION – END OF THE YEAR (44,234,616.85) (46,511,674.82)
NET BOOK VALUE – END OF THE YEAR 20,234,072.61 19,802,921.55
33CONSOLIDATED AUDIT REPORT
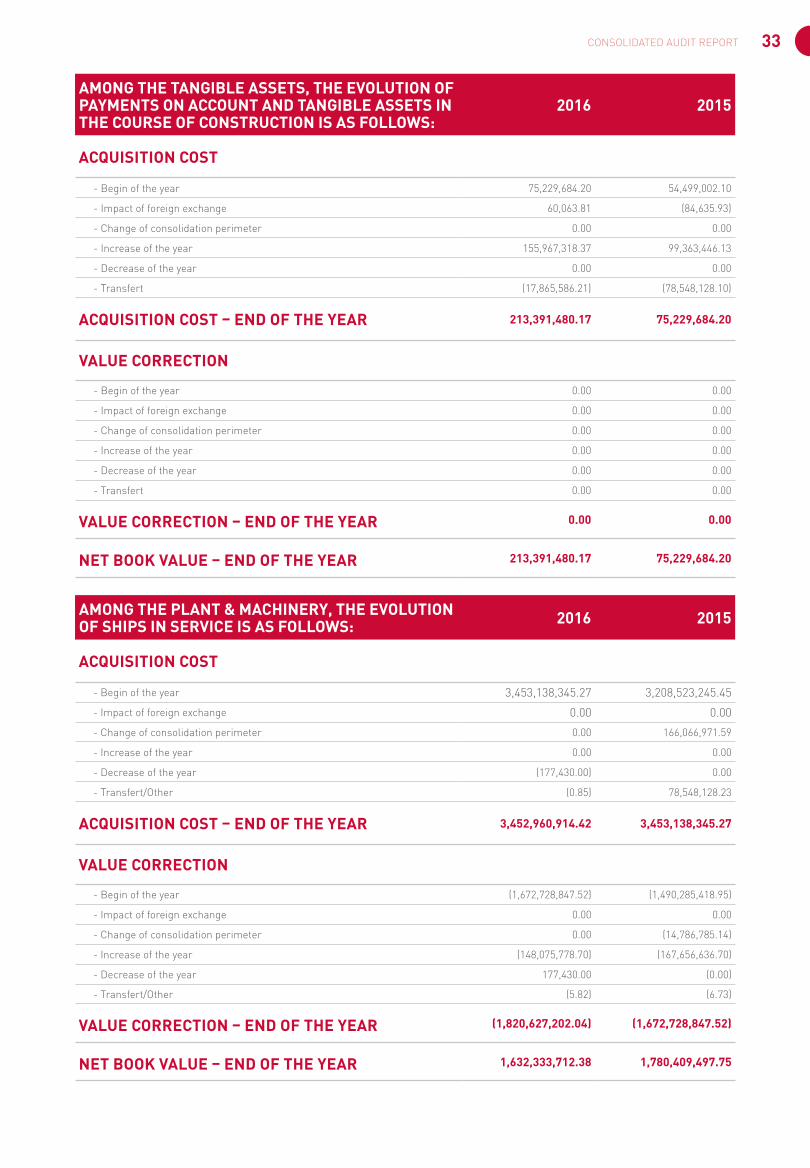
AMONG THE TANGIBLE ASSETS, THE EVOLUTION OF PAYMENTS ON ACCOUNT AND TANGIBLE ASSETS IN THE COURSE OF CONSTRUCTION IS AS FOLLOWS:
2016 2015
ACQUISITION COST
- Begin of the year 75,229,684.20 54,499,002.10
- Impact of foreign exchange 60,063.81 (84,635.93)
- Change of consolidation perimeter 0.00 0.00
- Increase of the year 155,967,318.37 99,363,446.13
- Decrease of the year 0.00 0.00
- Transfert (17,865,586.21) (78,548,128.10)
ACQUISITION COST – END OF THE YEAR 213,391,480.17 75,229,684.20
VALUE CORRECTION
- Begin of the year 0.00 0.00
- Impact of foreign exchange 0.00 0.00
- Change of consolidation perimeter 0.00 0.00
- Increase of the year 0.00 0.00
- Decrease of the year 0.00 0.00
- Transfert 0.00 0.00
VALUE CORRECTION – END OF THE YEAR 0.00 0.00
NET BOOK VALUE – END OF THE YEAR 213,391,480.17 75,229,684.20
AMONG THE PLANT & MACHINERY, THE EVOLUTION OF SHIPS IN SERVICE IS AS FOLLOWS: 2016 2015
ACQUISITION COST
- Begin of the year 3,453,138,345.27 3,208,523,245.45
- Impact of foreign exchange 0.00 0.00
- Change of consolidation perimeter 0.00 166,066,971.59
- Increase of the year 0.00 0.00
- Decrease of the year (177,430.00) 0.00
- Transfert/Other (0.85) 78,548,128.23
ACQUISITION COST – END OF THE YEAR 3,452,960,914.42 3,453,138,345.27
VALUE CORRECTION
- Begin of the year (1,672,728,847.52) (1,490,285,418.95)
- Impact of foreign exchange 0.00 0.00
- Change of consolidation perimeter 0.00 (14,786,785.14)
- Increase of the year (148,075,778.70) (167,656,636.70)
- Decrease of the year 177,430.00 (0.00)
- Transfert/Other (5.82) (6.73)
VALUE CORRECTION – END OF THE YEAR (1,820,627,202.04) (1,672,728,847.52)
NET BOOK VALUE – END OF THE YEAR 1,632,333,712.38 1,780,409,497.75
34
The vessel Vidar (renamed in the meantime Vole au vent) has been acquired from a third party through the acqui-sition of the company Vidar Shipowning S.A. in 2015. In 2015, the vessel was actually leased from a third party; this leasing agreement is considered by the Management as a financial lease agreement and therefore, per appli-cation of the substance over form principle, recognized as a tangible fixed asset; the related leasing debt was shown under Amounts owed to credit institutions. The acqui-sition value of the vessel amounted to 166,066,971.59 EUR; the cumulated depreciation at the date where the Group took control of Vidar Shipowning S.A. amounted to 14,786,785.14 EUR and the depreciation charge sup-ported by the Group from the date of control to December 31, 2015 amounted to 2,411,383.42 EUR. As at December 31, 2015, the related leasing debt shown under Amounts owed to credit institutions amounted to 142,279,472.14 EUR and was fully due within one year. In 2016, the leas-
ing agreement has been terminated and the vessel has been purchased by the Group; the above mentioned acquisition value has been maintained at its initial value and the depreciation continued.
During the year 2015, the vessel Isaac Newton became operational and increased the gross value of Ships in service with an amount of 78,548,128.00 EUR.
As of December 31, 2015 and 2016, the vessels Dirk Martens (shown under Ships in service for a net book value of 0.00 EUR), DN69 and DN71 (shown under Plant & Machinery for a net book value of 0.00 EUR) are not allowed to leave the Sierra Leone territory. Please how-ever refer also to Note 40.
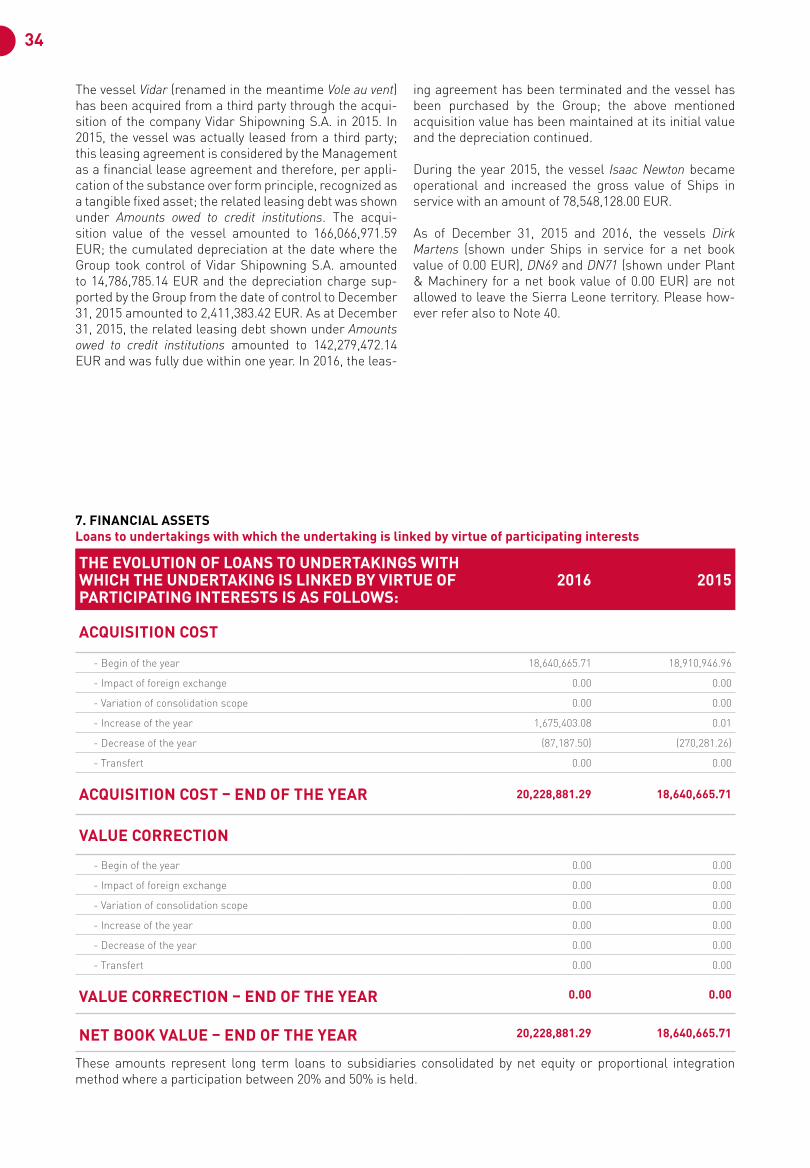
7. FINANCIAL ASSETSLoans to undertakings with which the undertaking is linked by virtue of participating interests
THE EVOLUTION OF LOANS TO UNDERTAKINGS WITH WHICH THE UNDERTAKING IS LINKED BY VIRTUE OF PARTICIPATING INTERESTS IS AS FOLLOWS:
2016 2015
ACQUISITION COST
- Begin of the year 18,640,665.71 18,910,946.96
- Impact of foreign exchange 0.00 0.00
- Variation of consolidation scope 0.00 0.00
- Increase of the year 1,675,403.08 0.01
- Decrease of the year (87,187.50) (270,281.26)
- Transfert 0.00 0.00
ACQUISITION COST – END OF THE YEAR 20,228,881.29 18,640,665.71
VALUE CORRECTION
- Begin of the year 0.00 0.00
- Impact of foreign exchange 0.00 0.00
- Variation of consolidation scope 0.00 0.00
- Increase of the year 0.00 0.00
- Decrease of the year 0.00 0.00
- Transfert 0.00 0.00
VALUE CORRECTION – END OF THE YEAR 0.00 0.00
NET BOOK VALUE – END OF THE YEAR 20,228,881.29 18,640,665.71
These amounts represent long term loans to subsidiaries consolidated by net equity or proportional integration method where a participation between 20% and 50% is held.
35CONSOLIDATED AUDIT REPORT
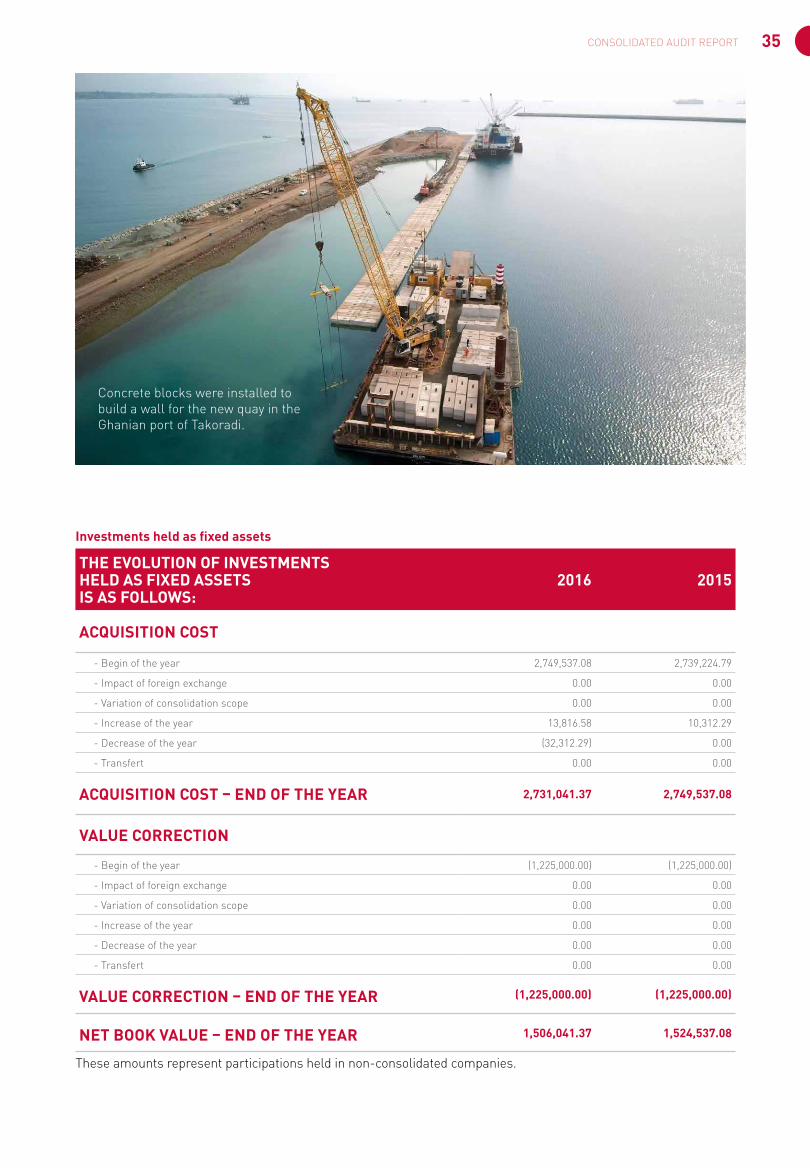
Investments held as fixed assets
THE EVOLUTION OF INVESTMENTS HELD AS FIXED ASSETS IS AS FOLLOWS:
2016 2015
ACQUISITION COST
- Begin of the year 2,749,537.08 2,739,224.79
- Impact of foreign exchange 0.00 0.00
- Variation of consolidation scope 0.00 0.00
- Increase of the year 13,816.58 10,312.29
- Decrease of the year (32,312.29) 0.00
- Transfert 0.00 0.00
ACQUISITION COST – END OF THE YEAR 2,731,041.37 2,749,537.08
VALUE CORRECTION
- Begin of the year (1,225,000.00) (1,225,000.00)
- Impact of foreign exchange 0.00 0.00
- Variation of consolidation scope 0.00 0.00
- Increase of the year 0.00 0.00
- Decrease of the year 0.00 0.00
- Transfert 0.00 0.00
VALUE CORRECTION – END OF THE YEAR (1,225,000.00) (1,225,000.00)
NET BOOK VALUE – END OF THE YEAR 1,506,041.37 1,524,537.08
These amounts represent participations held in non-consolidated companies.
Concrete blocks were installed to build a wall for the new quay in the Ghanian port of Takoradi.
36
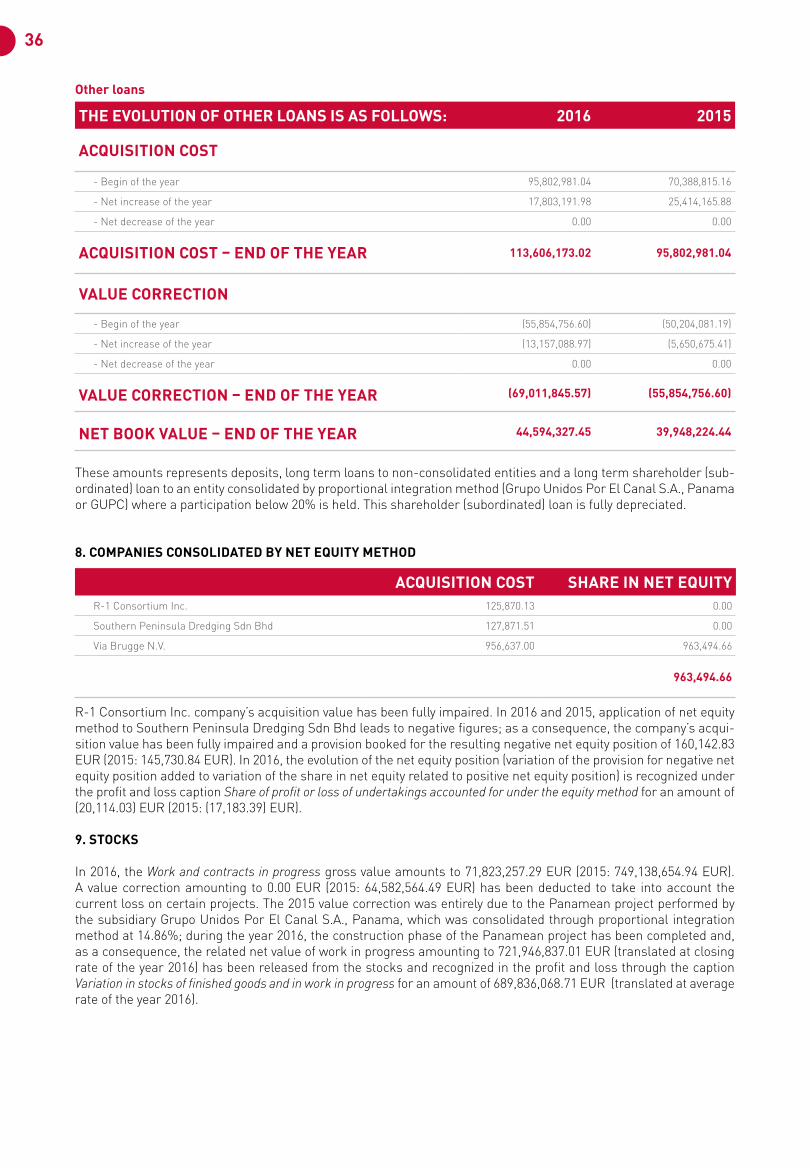
Other loans
THE EVOLUTION OF OTHER LOANS IS AS FOLLOWS: 2016 2015
ACQUISITION COST
- Begin of the year 95,802,981.04 70,388,815.16
- Net increase of the year 17,803,191.98 25,414,165.88
- Net decrease of the year 0.00 0.00
ACQUISITION COST – END OF THE YEAR 113,606,173.02 95,802,981.04
VALUE CORRECTION
- Begin of the year (55,854,756.60) (50,204,081.19)
- Net increase of the year (13,157,088.97) (5,650,675.41)
- Net decrease of the year 0.00 0.00
VALUE CORRECTION – END OF THE YEAR (69,011,845.57) (55,854,756.60)
NET BOOK VALUE – END OF THE YEAR 44,594,327.45 39,948,224.44
These amounts represents deposits, long term loans to non-consolidated entities and a long term shareholder (sub-ordinated) loan to an entity consolidated by proportional integration method (Grupo Unidos Por El Canal S.A., Panama or GUPC) where a participation below 20% is held. This shareholder (subordinated) loan is fully depreciated.
8. COMPANIES CONSOLIDATED BY NET EQUITY METHOD
ACQUISITION COST SHARE IN NET EQUITYR-1 Consortium Inc. 125,870.13 0.00
Southern Peninsula Dredging Sdn Bhd 127,871.51 0.00
Via Brugge N.V. 956,637.00 963,494.66
963,494.66
R-1 Consortium Inc. company’s acquisition value has been fully impaired. In 2016 and 2015, application of net equity method to Southern Peninsula Dredging Sdn Bhd leads to negative figures; as a consequence, the company’s acqui-sition value has been fully impaired and a provision booked for the resulting negative net equity position of 160,142.83 EUR (2015: 145,730.84 EUR). In 2016, the evolution of the net equity position (variation of the provision for negative net equity position added to variation of the share in net equity related to positive net equity position) is recognized under the profit and loss caption Share of profit or loss of undertakings accounted for under the equity method for an amount of (20,114.03) EUR (2015: (17,183.39) EUR).
9. STOCKS
In 2016, the Work and contracts in progress gross value amounts to 71,823,257.29 EUR (2015: 749,138,654.94 EUR). A value correction amounting to 0.00 EUR (2015: 64,582,564.49 EUR) has been deducted to take into account the current loss on certain projects. The 2015 value correction was entirely due to the Panamean project performed by the subsidiary Grupo Unidos Por El Canal S.A., Panama, which was consolidated through proportional integration method at 14.86%; during the year 2016, the construction phase of the Panamean project has been completed and, as a consequence, the related net value of work in progress amounting to 721,946,837.01 EUR (translated at closing rate of the year 2016) has been released from the stocks and recognized in the profit and loss through the caption Variation in stocks of finished goods and in work in progress for an amount of 689,836,068.71 EUR (translated at average rate of the year 2016).
37CONSOLIDATED AUDIT REPORT
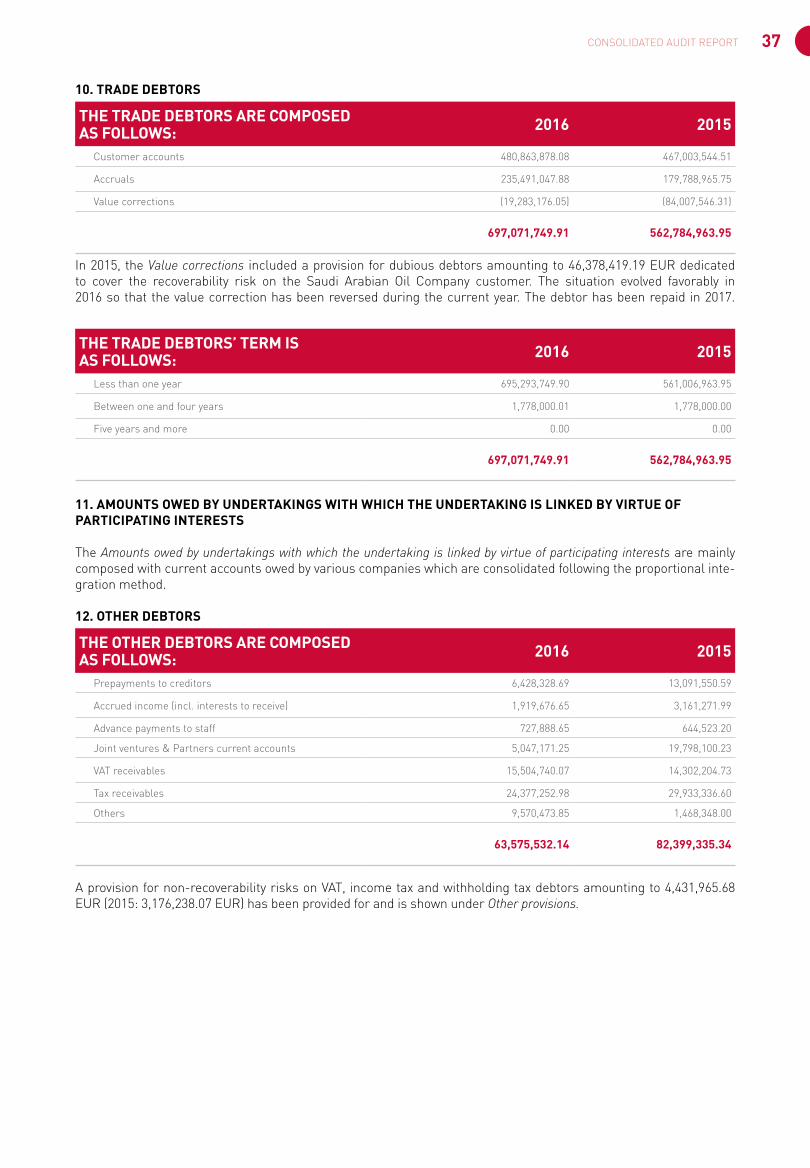
10. TRADE DEBTORS
THE TRADE DEBTORS ARE COMPOSED AS FOLLOWS: 2016 2015
Customer accounts 480,863,878.08 467,003,544.51
Accruals 235,491,047.88 179,788,965.75
Value corrections (19,283,176.05) (84,007,546.31)
697,071,749.91 562,784,963.95
In 2015, the Value corrections included a provision for dubious debtors amounting to 46,378,419.19 EUR dedicated to cover the recoverability risk on the Saudi Arabian Oil Company customer. The situation evolved favorably in 2016 so that the value correction has been reversed during the current year. The debtor has been repaid in 2017.
THE TRADE DEBTORS’ TERM ISAS FOLLOWS: 2016 2015
Less than one year 695,293,749.90 561,006,963.95
Between one and four years 1,778,000.01 1,778,000.00
Five years and more 0.00 0.00
697,071,749.91 562,784,963.95
11. AMOUNTS OWED BY UNDERTAKINGS WITH WHICH THE UNDERTAKING IS LINKED BY VIRTUE OF PARTICIPATING INTERESTS
The Amounts owed by undertakings with which the undertaking is linked by virtue of participating interests are mainly composed with current accounts owed by various companies which are consolidated following the proportional inte-gration method.
12. OTHER DEBTORS
THE OTHER DEBTORS ARE COMPOSED AS FOLLOWS: 2016 2015
Prepayments to creditors 6,428,328.69 13,091,550.59
Accrued income (incl. interests to receive) 1,919,676.65 3,161,271.99
Advance payments to staff 727,888.65 644,523.20
Joint ventures & Partners current accounts 5,047,171.25 19,798,100.23
VAT receivables 15,504,740.07 14,302,204.73
Tax receivables 24,377,252.98 29,933,336.60
Others 9,570,473.85 1,468,348.00
63,575,532.14 82,399,335.34
A provision for non-recoverability risks on VAT, income tax and withholding tax debtors amounting to 4,431,965.68 EUR (2015: 3,176,238.07 EUR) has been provided for and is shown under Other provisions.
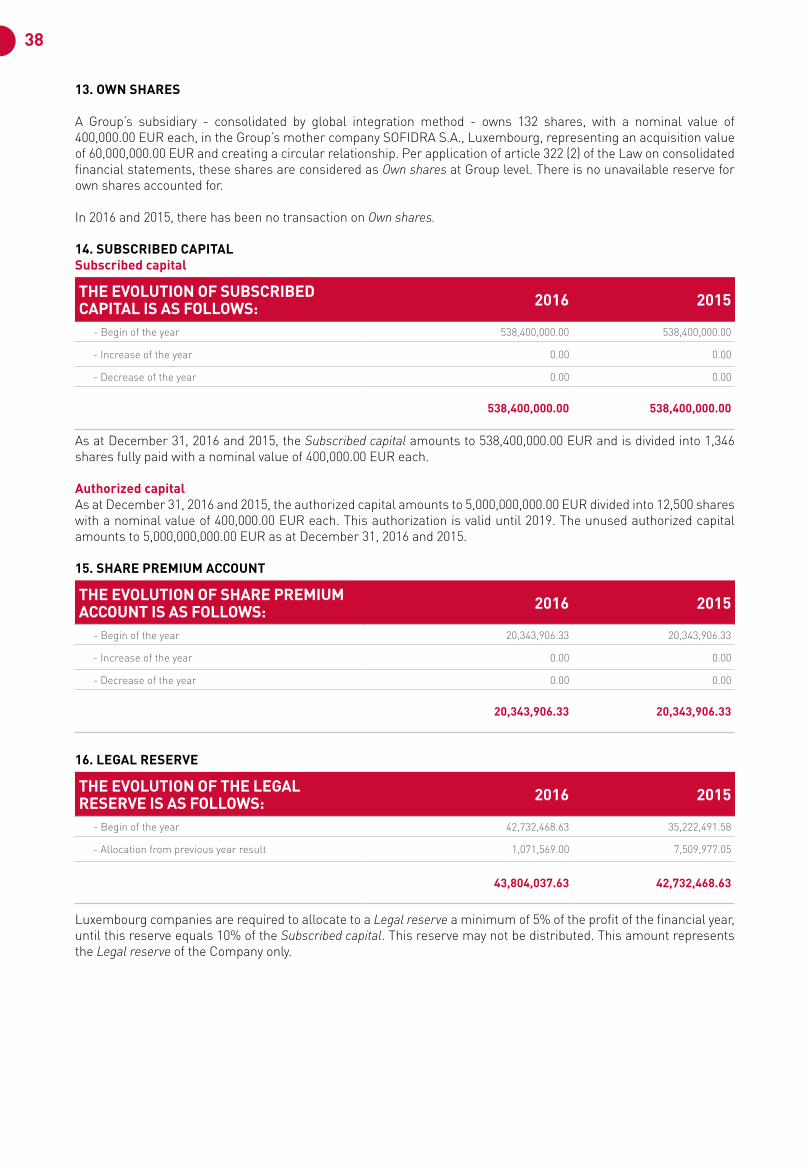
38
13. OWN SHARES
A Group’s subsidiary - consolidated by global integration method - owns 132 shares, with a nominal value of 400,000.00 EUR each, in the Group’s mother company SOFIDRA S.A., Luxembourg, representing an acquisition value of 60,000,000.00 EUR and creating a circular relationship. Per application of article 322 (2) of the Law on consolidated financial statements, these shares are considered as Own shares at Group level. There is no unavailable reserve for own shares accounted for.
In 2016 and 2015, there has been no transaction on Own shares.
14. SUBSCRIBED CAPITALSubscribed capital
THE EVOLUTION OF SUBSCRIBED CAPITAL IS AS FOLLOWS: 2016 2015
- Begin of the year 538,400,000.00 538,400,000.00
- Increase of the year 0.00 0.00
- Decrease of the year 0.00 0.00
538,400,000.00 538,400,000.00
As at December 31, 2016 and 2015, the Subscribed capital amounts to 538,400,000.00 EUR and is divided into 1,346 shares fully paid with a nominal value of 400,000.00 EUR each.
Authorized capitalAs at December 31, 2016 and 2015, the authorized capital amounts to 5,000,000,000.00 EUR divided into 12,500 shares with a nominal value of 400,000.00 EUR each. This authorization is valid until 2019. The unused authorized capital amounts to 5,000,000,000.00 EUR as at December 31, 2016 and 2015.
15. SHARE PREMIUM ACCOUNT
THE EVOLUTION OF SHARE PREMIUM ACCOUNT IS AS FOLLOWS: 2016 2015
- Begin of the year 20,343,906.33 20,343,906.33
- Increase of the year 0.00 0.00
- Decrease of the year 0.00 0.00
20,343,906.33 20,343,906.33
16. LEGAL RESERVE
THE EVOLUTION OF THE LEGAL RESERVE IS AS FOLLOWS: 2016 2015
- Begin of the year 42,732,468.63 35,222,491.58
- Allocation from previous year result 1,071,569.00 7,509,977.05
43,804,037.63 42,732,468.63
Luxembourg companies are required to allocate to a Legal reserve a minimum of 5% of the profit of the financial year, until this reserve equals 10% of the Subscribed capital. This reserve may not be distributed. This amount represents the Legal reserve of the Company only.
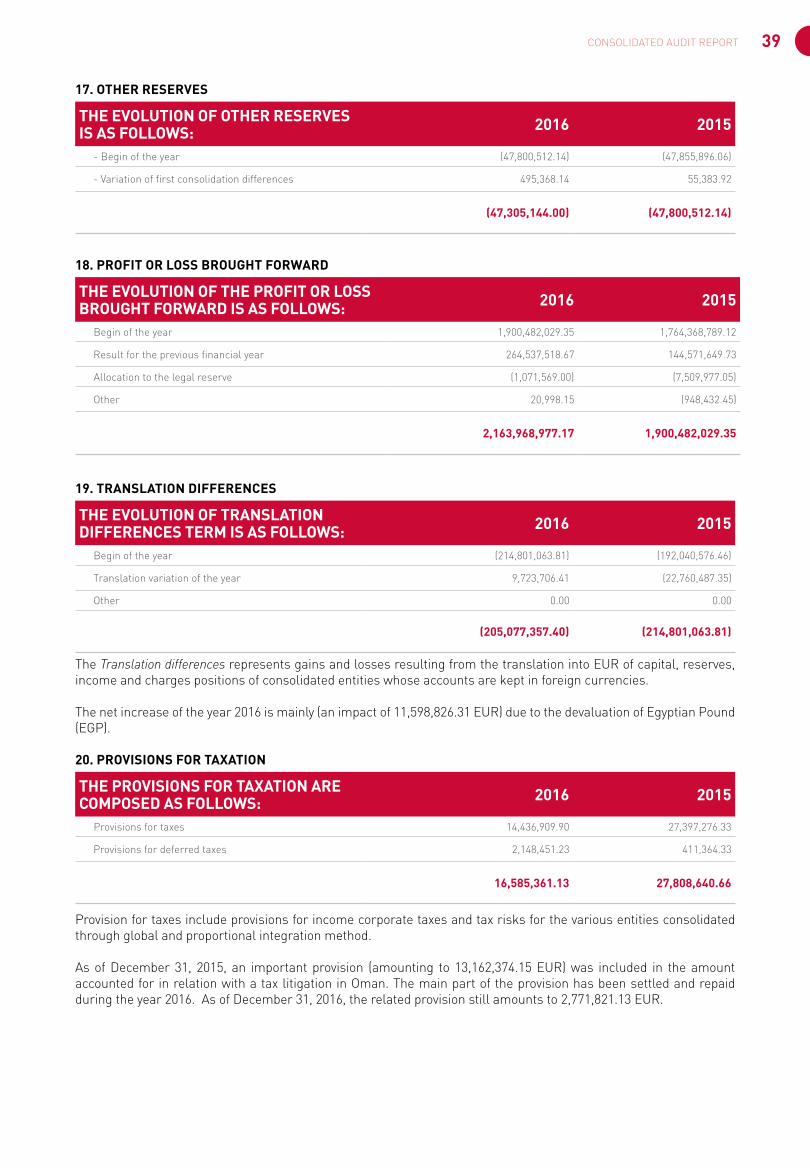
39CONSOLIDATED AUDIT REPORT
17. OTHER RESERVES
THE EVOLUTION OF OTHER RESERVES IS AS FOLLOWS: 2016 2015
- Begin of the year (47,800,512.14) (47,855,896.06)
- Variation of first consolidation differences 495,368.14 55,383.92
(47,305,144.00) (47,800,512.14)
18. PROFIT OR LOSS BROUGHT FORWARD
THE EVOLUTION OF THE PROFIT OR LOSS BROUGHT FORWARD IS AS FOLLOWS: 2016 2015
Begin of the year 1,900,482,029.35 1,764,368,789.12
Result for the previous financial year 264,537,518.67 144,571,649.73
Allocation to the legal reserve (1,071,569.00) (7,509,977.05)
Other 20,998.15 (948,432.45)
2,163,968,977.17 1,900,482,029.35
19. TRANSLATION DIFFERENCES
THE EVOLUTION OF TRANSLATION DIFFERENCES TERM IS AS FOLLOWS: 2016 2015
Begin of the year (214,801,063.81) (192,040,576.46)
Translation variation of the year 9,723,706.41 (22,760,487.35)
Other 0.00 0.00
(205,077,357.40) (214,801,063.81)
The Translation differences represents gains and losses resulting from the translation into EUR of capital, reserves, income and charges positions of consolidated entities whose accounts are kept in foreign currencies.
The net increase of the year 2016 is mainly (an impact of 11,598,826.31 EUR) due to the devaluation of Egyptian Pound (EGP).
20. PROVISIONS FOR TAXATION
THE PROVISIONS FOR TAXATION ARE COMPOSED AS FOLLOWS: 2016 2015
Provisions for taxes 14,436,909.90 27,397,276.33
Provisions for deferred taxes 2,148,451.23 411,364.33
16,585,361.13 27,808,640.66
Provision for taxes include provisions for income corporate taxes and tax risks for the various entities consolidated through global and proportional integration method.
As of December 31, 2015, an important provision (amounting to 13,162,374.15 EUR) was included in the amount accounted for in relation with a tax litigation in Oman. The main part of the provision has been settled and repaid during the year 2016. As of December 31, 2016, the related provision still amounts to 2,771,821.13 EUR.
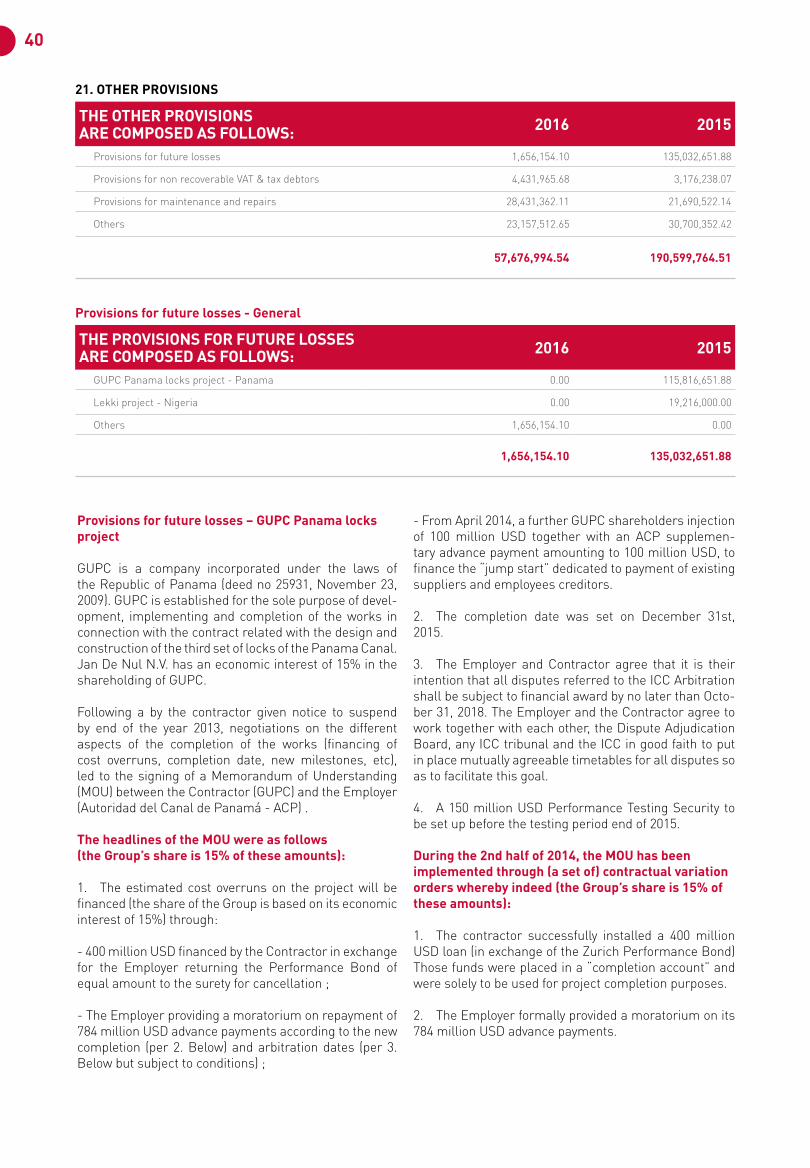
40
21. OTHER PROVISIONS
THE OTHER PROVISIONSARE COMPOSED AS FOLLOWS: 2016 2015
Provisions for future losses 1,656,154.10 135,032,651.88
Provisions for non recoverable VAT & tax debtors 4,431,965.68 3,176,238.07
Provisions for maintenance and repairs 28,431,362.11 21,690,522.14
Others 23,157,512.65 30,700,352.42
57,676,994.54 190,599,764.51
Provisions for future losses - General
THE PROVISIONS FOR FUTURE LOSSES ARE COMPOSED AS FOLLOWS: 2016 2015
GUPC Panama locks project - Panama 0.00 115,816,651.88
Lekki project - Nigeria 0.00 19,216,000.00
Others 1,656,154.10 0.00
1,656,154.10 135,032,651.88
Provisions for future losses – GUPC Panama locks project GUPC is a company incorporated under the laws of the Republic of Panama (deed no 25931, November 23, 2009). GUPC is established for the sole purpose of devel-opment, implementing and completion of the works in connection with the contract related with the design and construction of the third set of locks of the Panama Canal. Jan De Nul N.V. has an economic interest of 15% in the shareholding of GUPC.
Following a by the contractor given notice to suspend by end of the year 2013, negotiations on the different aspects of the completion of the works (financing of cost overruns, completion date, new milestones, etc), led to the signing of a Memorandum of Understanding (MOU) between the Contractor (GUPC) and the Employer (Autoridad del Canal de Panamá - ACP) .
The headlines of the MOU were as follows (the Group’s share is 15% of these amounts):
1. The estimated cost overruns on the project will be financed (the share of the Group is based on its economic interest of 15%) through:
- 400 million USD financed by the Contractor in exchange for the Employer returning the Performance Bond of equal amount to the surety for cancellation ;
- The Employer providing a moratorium on repayment of 784 million USD advance payments according to the new completion (per 2. Below) and arbitration dates (per 3. Below but subject to conditions) ;
- From April 2014, a further GUPC shareholders injection of 100 million USD together with an ACP supplemen-tary advance payment amounting to 100 million USD, to finance the “jump start” dedicated to payment of existing suppliers and employees creditors.
2. The completion date was set on December 31st, 2015.
3. The Employer and Contractor agree that it is their intention that all disputes referred to the ICC Arbitration shall be subject to financial award by no later than Octo-ber 31, 2018. The Employer and the Contractor agree to work together with each other, the Dispute Adjudication Board, any ICC tribunal and the ICC in good faith to put in place mutually agreeable timetables for all disputes so as to facilitate this goal.
4. A 150 million USD Performance Testing Security to be set up before the testing period end of 2015.
During the 2nd half of 2014, the MOU has been implemented through (a set of) contractual variation orders whereby indeed (the Group’s share is 15% of these amounts):
1. The contractor successfully installed a 400 million USD loan (in exchange of the Zurich Performance Bond)Those funds were placed in a “completion account” and were solely to be used for project completion purposes.
2. The Employer formally provided a moratorium on its 784 million USD advance payments.
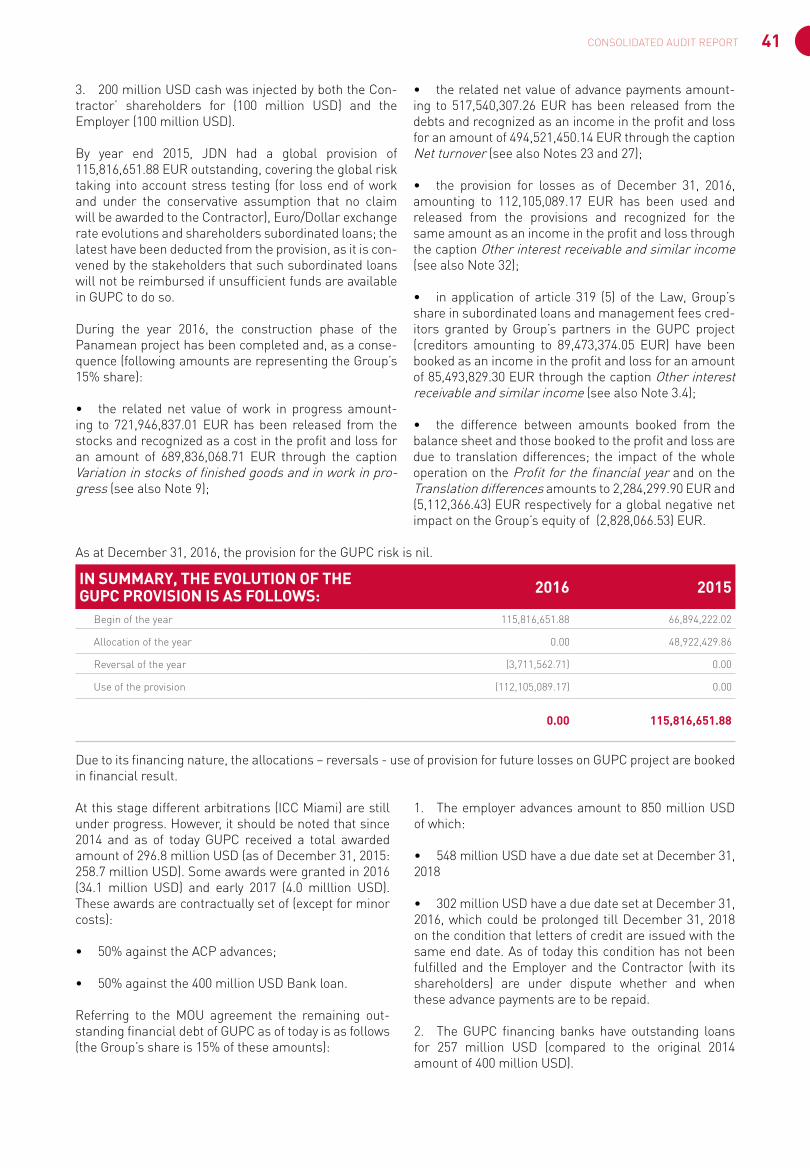
41CONSOLIDATED AUDIT REPORT
3. 200 million USD cash was injected by both the Con-tractor’ shareholders for (100 million USD) and the Employer (100 million USD).
By year end 2015, JDN had a global provision of 115,816,651.88 EUR outstanding, covering the global risk taking into account stress testing (for loss end of work and under the conservative assumption that no claim will be awarded to the Contractor), Euro/Dollar exchange rate evolutions and shareholders subordinated loans; the latest have been deducted from the provision, as it is con-vened by the stakeholders that such subordinated loans will not be reimbursed if unsufficient funds are available in GUPC to do so.
During the year 2016, the construction phase of the Panamean project has been completed and, as a conse-quence (following amounts are representing the Group’s 15% share):
• the related net value of work in progress amount-ing to 721,946,837.01 EUR has been released from the stocks and recognized as a cost in the profit and loss for an amount of 689,836,068.71 EUR through the caption Variation in stocks of finished goods and in work in pro-gress (see also Note 9);
• the related net value of advance payments amount-ing to 517,540,307.26 EUR has been released from the debts and recognized as an income in the profit and loss for an amount of 494,521,450.14 EUR through the caption Net turnover (see also Notes 23 and 27);
• the provision for losses as of December 31, 2016, amounting to 112,105,089.17 EUR has been used and released from the provisions and recognized for the same amount as an income in the profit and loss through the caption Other interest receivable and similar income (see also Note 32);
• in application of article 319 (5) of the Law, Group’s share in subordinated loans and management fees cred-itors granted by Group’s partners in the GUPC project (creditors amounting to 89,473,374.05 EUR) have been booked as an income in the profit and loss for an amount of 85,493,829.30 EUR through the caption Other interest receivable and similar income (see also Note 3.4);
• the difference between amounts booked from the balance sheet and those booked to the profit and loss are due to translation differences; the impact of the whole operation on the Profit for the financial year and on the Translation differences amounts to 2,284,299.90 EUR and (5,112,366.43) EUR respectively for a global negative net impact on the Group’s equity of (2,828,066.53) EUR.
As at December 31, 2016, the provision for the GUPC risk is nil.
IN SUMMARY, THE EVOLUTION OF THE GUPC PROVISION IS AS FOLLOWS: 2016 2015
Begin of the year 115,816,651.88 66,894,222.02
Allocation of the year 0.00 48,922,429.86
Reversal of the year (3,711,562.71) 0.00
Use of the provision (112,105,089.17) 0.00
0.00 115,816,651.88
Due to its financing nature, the allocations – reversals - use of provision for future losses on GUPC project are booked in financial result.
At this stage different arbitrations (ICC Miami) are still under progress. However, it should be noted that since 2014 and as of today GUPC received a total awarded amount of 296.8 million USD (as of December 31, 2015: 258.7 million USD). Some awards were granted in 2016 (34.1 million USD) and early 2017 (4.0 milllion USD).These awards are contractually set of (except for minor costs):
• 50% against the ACP advances;
• 50% against the 400 million USD Bank loan.
Referring to the MOU agreement the remaining out-standing financial debt of GUPC as of today is as follows (the Group’s share is 15% of these amounts):
1. The employer advances amount to 850 million USD of which:
• 548 million USD have a due date set at December 31, 2018
• 302 million USD have a due date set at December 31, 2016, which could be prolonged till December 31, 2018 on the condition that letters of credit are issued with the same end date. As of today this condition has not been fulfilled and the Employer and the Contractor (with its shareholders) are under dispute whether and when these advance payments are to be repaid.
2. The GUPC financing banks have outstanding loans for 257 million USD (compared to the original 2014 amount of 400 million USD).
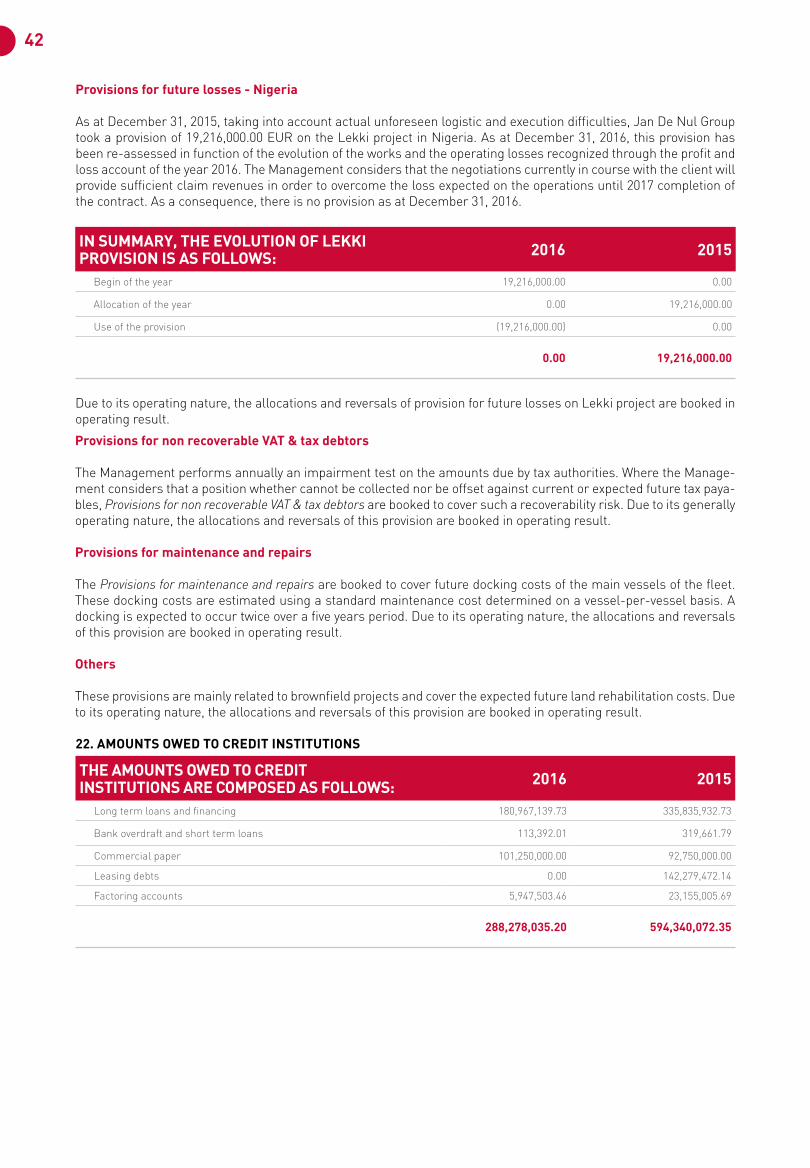
42
Provisions for future losses - Nigeria
As at December 31, 2015, taking into account actual unforeseen logistic and execution difficulties, Jan De Nul Group took a provision of 19,216,000.00 EUR on the Lekki project in Nigeria. As at December 31, 2016, this provision has been re-assessed in function of the evolution of the works and the operating losses recognized through the profit and loss account of the year 2016. The Management considers that the negotiations currently in course with the client will provide sufficient claim revenues in order to overcome the loss expected on the operations until 2017 completion of the contract. As a consequence, there is no provision as at December 31, 2016.
IN SUMMARY, THE EVOLUTION OF LEKKI PROVISION IS AS FOLLOWS: 2016 2015
Begin of the year 19,216,000.00 0.00
Allocation of the year 0.00 19,216,000.00
Use of the provision (19,216,000.00) 0.00
0.00 19,216,000.00
Due to its operating nature, the allocations and reversals of provision for future losses on Lekki project are booked in operating result.
Provisions for non recoverable VAT & tax debtors
The Management performs annually an impairment test on the amounts due by tax authorities. Where the Manage-ment considers that a position whether cannot be collected nor be offset against current or expected future tax paya-bles, Provisions for non recoverable VAT & tax debtors are booked to cover such a recoverability risk. Due to its generally operating nature, the allocations and reversals of this provision are booked in operating result.
Provisions for maintenance and repairs
The Provisions for maintenance and repairs are booked to cover future docking costs of the main vessels of the fleet. These docking costs are estimated using a standard maintenance cost determined on a vessel-per-vessel basis. A docking is expected to occur twice over a five years period. Due to its operating nature, the allocations and reversals of this provision are booked in operating result.
Others
These provisions are mainly related to brownfield projects and cover the expected future land rehabilitation costs. Due to its operating nature, the allocations and reversals of this provision are booked in operating result.
22. AMOUNTS OWED TO CREDIT INSTITUTIONS
THE AMOUNTS OWED TO CREDIT INSTITUTIONS ARE COMPOSED AS FOLLOWS: 2016 2015
Long term loans and financing 180,967,139.73 335,835,932.73
Bank overdraft and short term loans 113,392.01 319,661.79
Commercial paper 101,250,000.00 92,750,000.00
Leasing debts 0.00 142,279,472.14
Factoring accounts 5,947,503.46 23,155,005.69
288,278,035.20 594,340,072.35
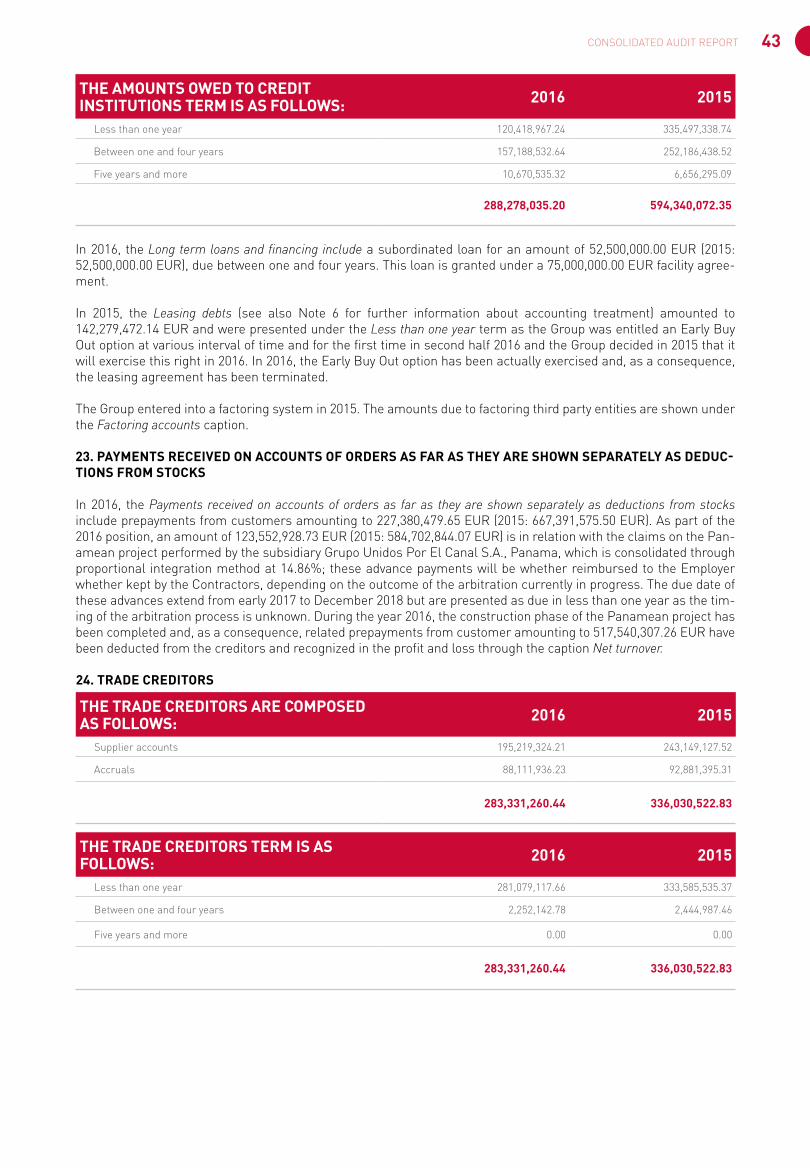
43CONSOLIDATED AUDIT REPORT
24. TRADE CREDITORS
THE TRADE CREDITORS ARE COMPOSED AS FOLLOWS: 2016 2015
Supplier accounts 195,219,324.21 243,149,127.52
Accruals 88,111,936.23 92,881,395.31
283,331,260.44 336,030,522.83
THE TRADE CREDITORS TERM IS AS FOLLOWS: 2016 2015
Less than one year 281,079,117.66 333,585,535.37
Between one and four years 2,252,142.78 2,444,987.46
Five years and more 0.00 0.00
283,331,260.44 336,030,522.83
THE AMOUNTS OWED TO CREDIT INSTITUTIONS TERM IS AS FOLLOWS: 2016 2015
Less than one year 120,418,967.24 335,497,338.74
Between one and four years 157,188,532.64 252,186,438.52
Five years and more 10,670,535.32 6,656,295.09
288,278,035.20 594,340,072.35
In 2016, the Long term loans and financing include a subordinated loan for an amount of 52,500,000.00 EUR (2015: 52,500,000.00 EUR), due between one and four years. This loan is granted under a 75,000,000.00 EUR facility agree-ment.
In 2015, the Leasing debts (see also Note 6 for further information about accounting treatment) amounted to 142,279,472.14 EUR and were presented under the Less than one year term as the Group was entitled an Early Buy Out option at various interval of time and for the first time in second half 2016 and the Group decided in 2015 that it will exercise this right in 2016. In 2016, the Early Buy Out option has been actually exercised and, as a consequence, the leasing agreement has been terminated.
The Group entered into a factoring system in 2015. The amounts due to factoring third party entities are shown under the Factoring accounts caption.
23. PAYMENTS RECEIVED ON ACCOUNTS OF ORDERS AS FAR AS THEY ARE SHOWN SEPARATELY AS DEDUC-TIONS FROM STOCKS In 2016, the Payments received on accounts of orders as far as they are shown separately as deductions from stocks include prepayments from customers amounting to 227,380,479.65 EUR (2015: 667,391,575.50 EUR). As part of the 2016 position, an amount of 123,552,928.73 EUR (2015: 584,702,844.07 EUR) is in relation with the claims on the Pan-amean project performed by the subsidiary Grupo Unidos Por El Canal S.A., Panama, which is consolidated through proportional integration method at 14.86%; these advance payments will be whether reimbursed to the Employer whether kept by the Contractors, depending on the outcome of the arbitration currently in progress. The due date of these advances extend from early 2017 to December 2018 but are presented as due in less than one year as the tim-ing of the arbitration process is unknown. During the year 2016, the construction phase of the Panamean project has been completed and, as a consequence, related prepayments from customer amounting to 517,540,307.26 EUR have been deducted from the creditors and recognized in the profit and loss through the caption Net turnover.
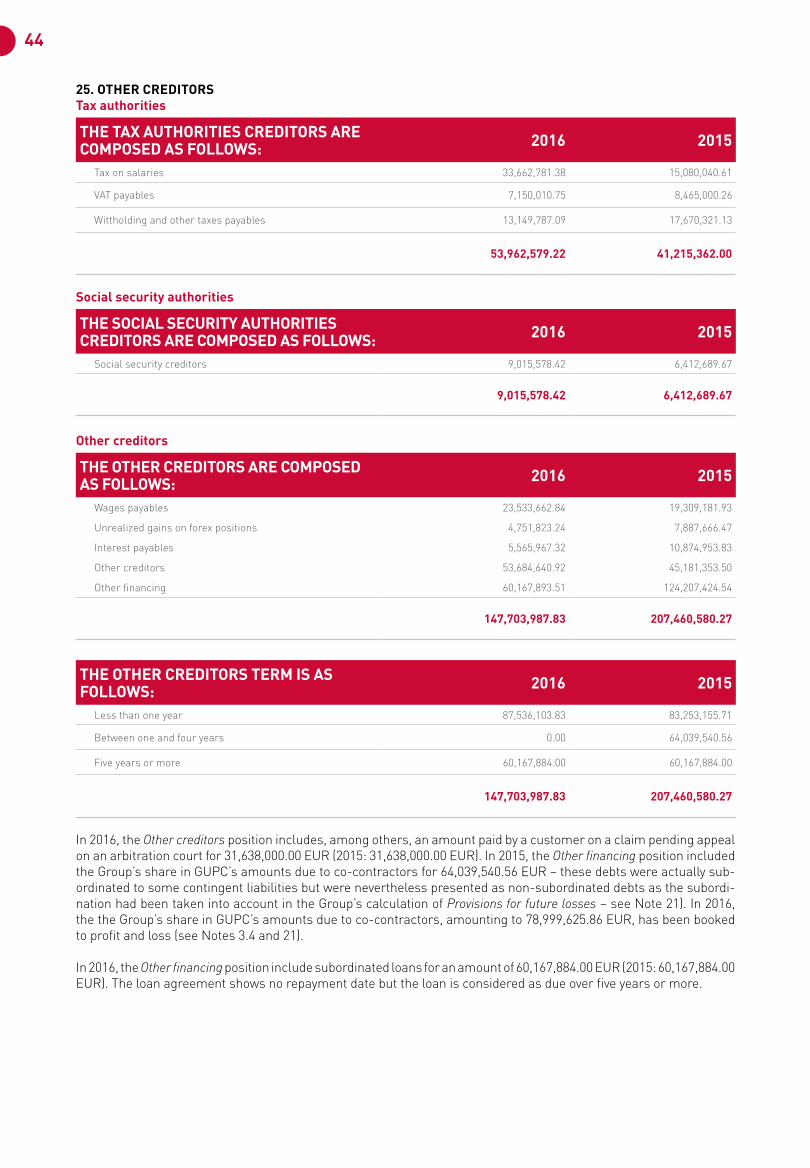
44
25. OTHER CREDITORS Tax authorities
THE TAX AUTHORITIES CREDITORS ARE COMPOSED AS FOLLOWS: 2016 2015
Tax on salaries 33,662,781.38 15,080,040.61
VAT payables 7,150,010.75 8,465,000.26
Wittholding and other taxes payables 13,149,787.09 17,670,321.13
53,962,579.22 41,215,362.00
Social security authorities
THE SOCIAL SECURITY AUTHORITIES CREDITORS ARE COMPOSED AS FOLLOWS: 2016 2015
Social security creditors 9,015,578.42 6,412,689.67
9,015,578.42 6,412,689.67
Other creditors
THE OTHER CREDITORS ARE COMPOSED AS FOLLOWS: 2016 2015
Wages payables 23,533,662.84 19,309,181.93
Unrealized gains on forex positions 4,751,823.24 7,887,666.47
Interest payables 5,565,967.32 10,874,953.83
Other creditors 53,684,640.92 45,181,353.50
Other financing 60,167,893.51 124,207,424.54
147,703,987.83 207,460,580.27
THE OTHER CREDITORS TERM IS AS FOLLOWS: 2016 2015
Less than one year 87,536,103.83 83,253,155.71
Between one and four years 0.00 64,039,540.56
Five years or more 60,167,884.00 60,167,884.00
147,703,987.83 207,460,580.27
In 2016, the Other creditors position includes, among others, an amount paid by a customer on a claim pending appeal on an arbitration court for 31,638,000.00 EUR (2015: 31,638,000.00 EUR). In 2015, the Other financing position included the Group’s share in GUPC’s amounts due to co-contractors for 64,039,540.56 EUR – these debts were actually sub-ordinated to some contingent liabilities but were nevertheless presented as non-subordinated debts as the subordi-nation had been taken into account in the Group’s calculation of Provisions for future losses – see Note 21). In 2016, the the Group’s share in GUPC’s amounts due to co-contractors, amounting to 78,999,625.86 EUR, has been booked to profit and loss (see Notes 3.4 and 21).
In 2016, the Other financing position include subordinated loans for an amount of 60,167,884.00 EUR (2015: 60,167,884.00 EUR). The loan agreement shows no repayment date but the loan is considered as due over five years or more.
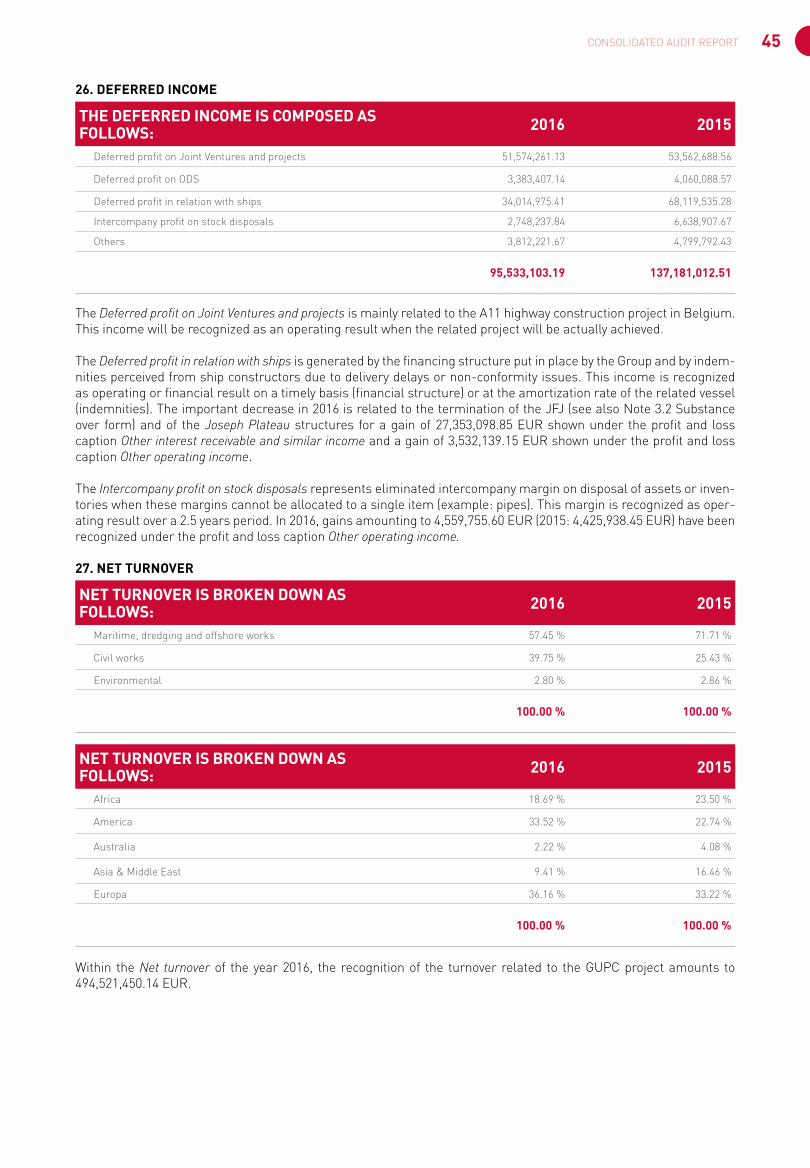
45CONSOLIDATED AUDIT REPORT
26. DEFERRED INCOME
THE DEFERRED INCOME IS COMPOSED AS FOLLOWS: 2016 2015
Deferred profit on Joint Ventures and projects 51,574,261.13 53,562,688.56
Deferred profit on ODS 3,383,407.14 4,060,088.57
Deferred profit in relation with ships 34,014,975.41 68,119,535.28
Intercompany profit on stock disposals 2,748,237.84 6,638,907.67
Others 3,812,221.67 4,799,792.43
95,533,103.19 137,181,012.51
The Deferred profit on Joint Ventures and projects is mainly related to the A11 highway construction project in Belgium. This income will be recognized as an operating result when the related project will be actually achieved.
The Deferred profit in relation with ships is generated by the financing structure put in place by the Group and by indem-nities perceived from ship constructors due to delivery delays or non-conformity issues. This income is recognized as operating or financial result on a timely basis (financial structure) or at the amortization rate of the related vessel (indemnities). The important decrease in 2016 is related to the termination of the JFJ (see also Note 3.2 Substance over form) and of the Joseph Plateau structures for a gain of 27,353,098.85 EUR shown under the profit and loss caption Other interest receivable and similar income and a gain of 3,532,139.15 EUR shown under the profit and loss caption Other operating income.
The Intercompany profit on stock disposals represents eliminated intercompany margin on disposal of assets or inven-tories when these margins cannot be allocated to a single item (example: pipes). This margin is recognized as oper-ating result over a 2.5 years period. In 2016, gains amounting to 4,559,755.60 EUR (2015: 4,425,938.45 EUR) have been recognized under the profit and loss caption Other operating income.
27. NET TURNOVER
NET TURNOVER IS BROKEN DOWN AS FOLLOWS: 2016 2015
Maritime, dredging and offshore works 57.45 % 71.71 %
Civil works 39.75 % 25.43 %
Environmental 2.80 % 2.86 %
100.00 % 100.00 %
NET TURNOVER IS BROKEN DOWN AS FOLLOWS: 2016 2015
Africa 18.69 % 23.50 %
America 33.52 % 22.74 %
Australia 2.22 % 4.08 %
Asia & Middle East 9.41 % 16.46 %
Europa 36.16 % 33.22 %
100.00 % 100.00 %
Within the Net turnover of the year 2016, the recognition of the turnover related to the GUPC project amounts to 494,521,450.14 EUR.
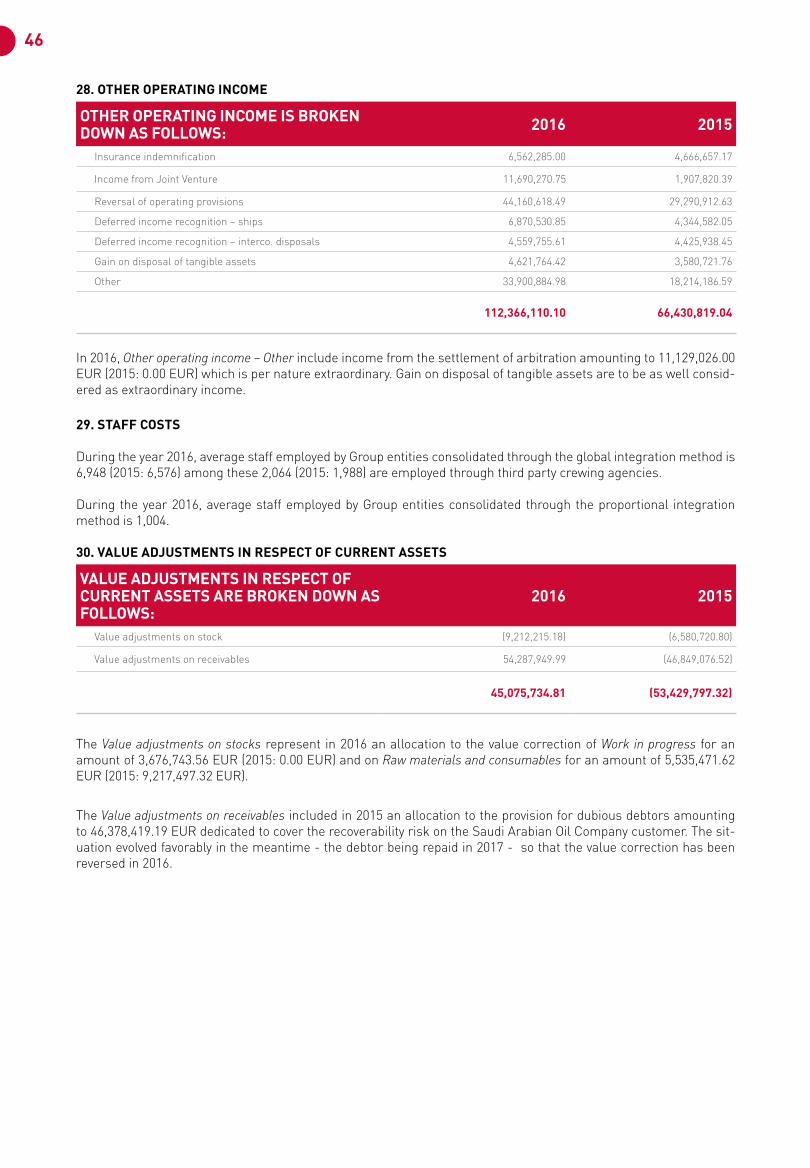
46
28. OTHER OPERATING INCOME
OTHER OPERATING INCOME IS BROKEN DOWN AS FOLLOWS: 2016 2015
Insurance indemnification 6,562,285.00 4,666,657.17
Income from Joint Venture 11,690,270.75 1,907,820.39
Reversal of operating provisions 44,160,618.49 29,290,912.63
Deferred income recognition – ships 6,870,530.85 4,344,582.05
Deferred income recognition – interco. disposals 4,559,755.61 4,425,938.45
Gain on disposal of tangible assets 4,621,764.42 3,580,721.76
Other 33,900,884.98 18,214,186.59
112,366,110.10 66,430,819.04
In 2016, Other operating income – Other include income from the settlement of arbitration amounting to 11,129,026.00 EUR (2015: 0.00 EUR) which is per nature extraordinary. Gain on disposal of tangible assets are to be as well consid-ered as extraordinary income.
29. STAFF COSTS
During the year 2016, average staff employed by Group entities consolidated through the global integration method is 6,948 (2015: 6,576) among these 2,064 (2015: 1,988) are employed through third party crewing agencies.
During the year 2016, average staff employed by Group entities consolidated through the proportional integration method is 1,004.
30. VALUE ADJUSTMENTS IN RESPECT OF CURRENT ASSETS
VALUE ADJUSTMENTS IN RESPECT OF CURRENT ASSETS ARE BROKEN DOWN AS FOLLOWS:
2016 2015
Value adjustments on stock (9,212,215.18) (6,580,720.80)
Value adjustments on receivables 54,287,949.99 (46,849,076.52)
45,075,734.81 (53,429,797.32)
The Value adjustments on stocks represent in 2016 an allocation to the value correction of Work in progress for an amount of 3,676,743.56 EUR (2015: 0.00 EUR) and on Raw materials and consumables for an amount of 5,535,471.62 EUR (2015: 9,217,497.32 EUR).
The Value adjustments on receivables included in 2015 an allocation to the provision for dubious debtors amounting to 46,378,419.19 EUR dedicated to cover the recoverability risk on the Saudi Arabian Oil Company customer. The sit-uation evolved favorably in the meantime - the debtor being repaid in 2017 - so that the value correction has been reversed in 2016.
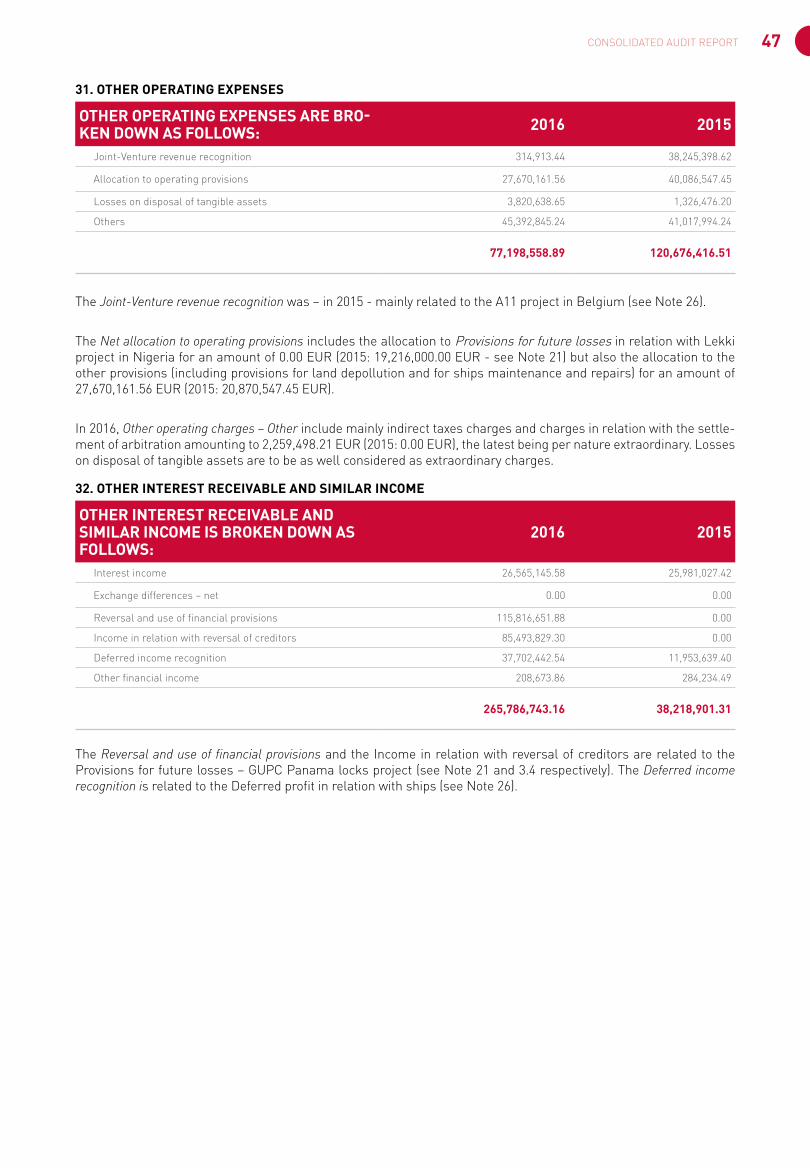
47CONSOLIDATED AUDIT REPORT
31. OTHER OPERATING EXPENSES
OTHER OPERATING EXPENSES ARE BRO-KEN DOWN AS FOLLOWS: 2016 2015
Joint-Venture revenue recognition 314,913.44 38,245,398.62
Allocation to operating provisions 27,670,161.56 40,086,547.45
Losses on disposal of tangible assets 3,820,638.65 1,326,476.20
Others 45,392,845.24 41,017,994.24
77,198,558.89 120,676,416.51
The Joint-Venture revenue recognition was – in 2015 - mainly related to the A11 project in Belgium (see Note 26).
The Net allocation to operating provisions includes the allocation to Provisions for future losses in relation with Lekki project in Nigeria for an amount of 0.00 EUR (2015: 19,216,000.00 EUR - see Note 21) but also the allocation to the other provisions (including provisions for land depollution and for ships maintenance and repairs) for an amount of 27,670,161.56 EUR (2015: 20,870,547.45 EUR).
In 2016, Other operating charges – Other include mainly indirect taxes charges and charges in relation with the settle-ment of arbitration amounting to 2,259,498.21 EUR (2015: 0.00 EUR), the latest being per nature extraordinary. Losses on disposal of tangible assets are to be as well considered as extraordinary charges.
32. OTHER INTEREST RECEIVABLE AND SIMILAR INCOME
OTHER INTEREST RECEIVABLE AND SIMILAR INCOME IS BROKEN DOWN AS FOLLOWS:
2016 2015
Interest income 26,565,145.58 25,981,027.42
Exchange differences – net 0.00 0.00
Reversal and use of financial provisions 115,816,651.88 0.00
Income in relation with reversal of creditors 85,493,829.30 0.00
Deferred income recognition 37,702,442.54 11,953,639.40
Other financial income 208,673.86 284,234.49
265,786,743.16 38,218,901.31
The Reversal and use of financial provisions and the Income in relation with reversal of creditors are related to the Provisions for future losses – GUPC Panama locks project (see Note 21 and 3.4 respectively). The Deferred income recognition is related to the Deferred profit in relation with ships (see Note 26).
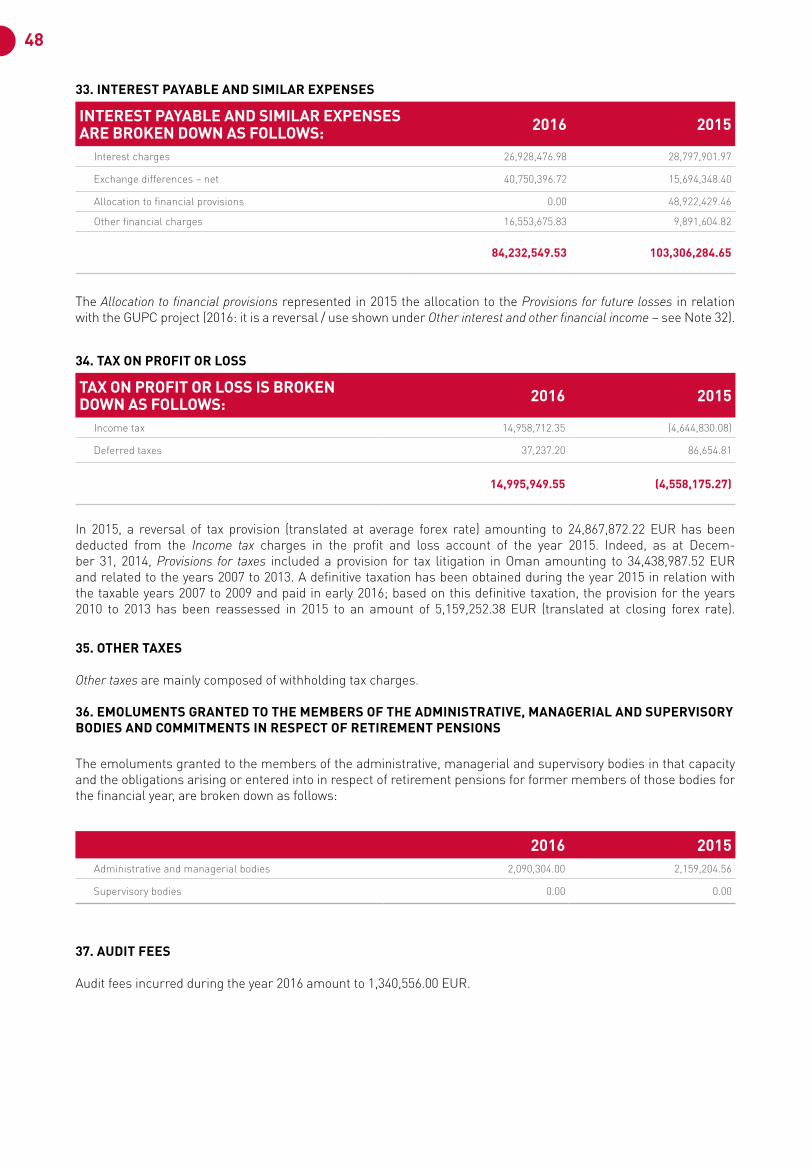
48
33. INTEREST PAYABLE AND SIMILAR EXPENSES
INTEREST PAYABLE AND SIMILAR EXPENSES ARE BROKEN DOWN AS FOLLOWS: 2016 2015
Interest charges 26,928,476.98 28,797,901.97
Exchange differences – net 40,750,396.72 15,694,348.40
Allocation to financial provisions 0.00 48,922,429.46
Other financial charges 16,553,675.83 9,891,604.82
84,232,549.53 103,306,284.65
The Allocation to financial provisions represented in 2015 the allocation to the Provisions for future losses in relation with the GUPC project (2016: it is a reversal / use shown under Other interest and other financial income – see Note 32).
34. TAX ON PROFIT OR LOSS
TAX ON PROFIT OR LOSS IS BROKEN DOWN AS FOLLOWS: 2016 2015
Income tax 14,958,712.35 (4,644,830.08)
Deferred taxes 37,237.20 86,654.81
14,995,949.55 (4,558,175.27)
In 2015, a reversal of tax provision (translated at average forex rate) amounting to 24,867,872.22 EUR has been deducted from the Income tax charges in the profit and loss account of the year 2015. Indeed, as at Decem-ber 31, 2014, Provisions for taxes included a provision for tax litigation in Oman amounting to 34,438,987.52 EUR and related to the years 2007 to 2013. A definitive taxation has been obtained during the year 2015 in relation with the taxable years 2007 to 2009 and paid in early 2016; based on this definitive taxation, the provision for the years 2010 to 2013 has been reassessed in 2015 to an amount of 5,159,252.38 EUR (translated at closing forex rate).
35. OTHER TAXES
Other taxes are mainly composed of withholding tax charges.
36. EMOLUMENTS GRANTED TO THE MEMBERS OF THE ADMINISTRATIVE, MANAGERIAL AND SUPERVISORY BODIES AND COMMITMENTS IN RESPECT OF RETIREMENT PENSIONS
The emoluments granted to the members of the administrative, managerial and supervisory bodies in that capacity and the obligations arising or entered into in respect of retirement pensions for former members of those bodies for the financial year, are broken down as follows:
2016 2015Administrative and managerial bodies 2,090,304.00 2,159,204.56
Supervisory bodies 0.00 0.00
37. AUDIT FEES
Audit fees incurred during the year 2016 amount to 1,340,556.00 EUR.
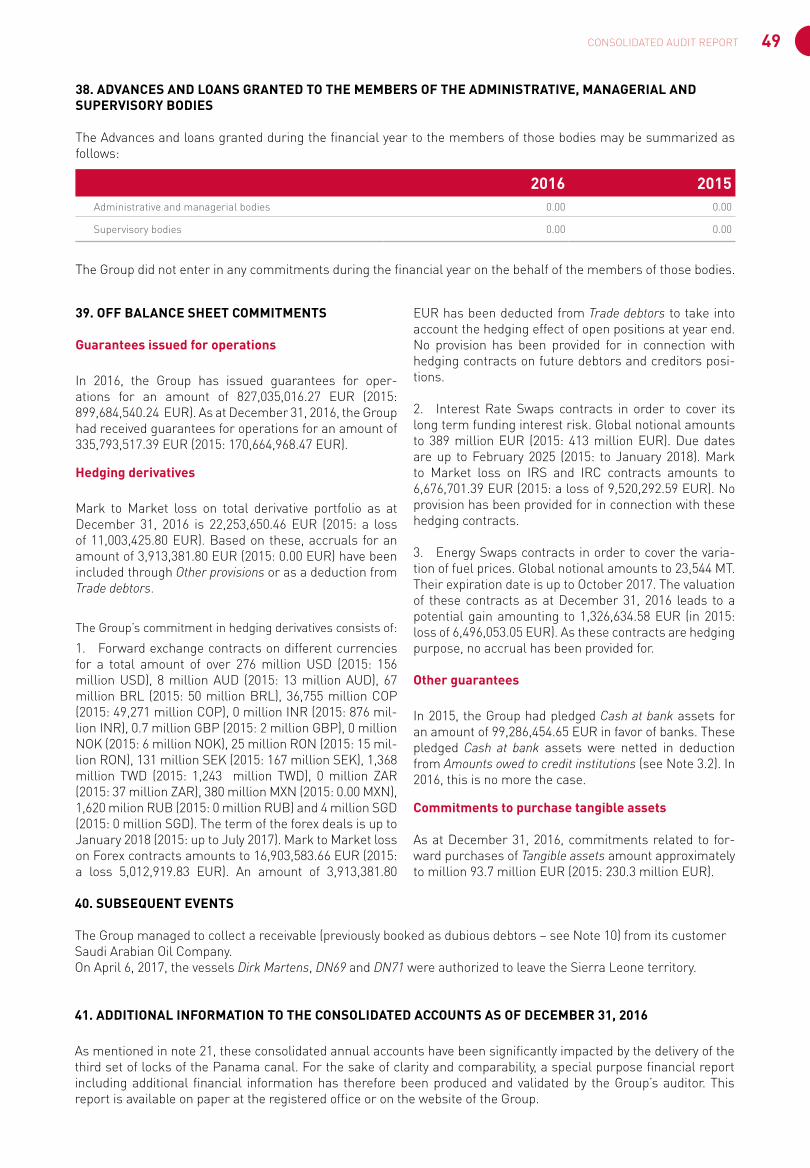
49CONSOLIDATED AUDIT REPORT
39. OFF BALANCE SHEET COMMITMENTS
Guarantees issued for operations
In 2016, the Group has issued guarantees for oper-ations for an amount of 827,035,016.27 EUR (2015: 899,684,540.24 EUR). As at December 31, 2016, the Group had received guarantees for operations for an amount of 335,793,517.39 EUR (2015: 170,664,968.47 EUR).
Hedging derivatives
Mark to Market loss on total derivative portfolio as at December 31, 2016 is 22,253,650.46 EUR (2015: a loss of 11,003,425.80 EUR). Based on these, accruals for an amount of 3,913,381.80 EUR (2015: 0.00 EUR) have been included through Other provisions or as a deduction from Trade debtors.
The Group’s commitment in hedging derivatives consists of:
1. Forward exchange contracts on different currencies for a total amount of over 276 million USD (2015: 156 million USD), 8 million AUD (2015: 13 million AUD), 67 million BRL (2015: 50 million BRL), 36,755 million COP (2015: 49,271 million COP), 0 million INR (2015: 876 mil-lion INR), 0.7 million GBP (2015: 2 million GBP), 0 million NOK (2015: 6 million NOK), 25 million RON (2015: 15 mil-lion RON), 131 million SEK (2015: 167 million SEK), 1,368 million TWD (2015: 1,243 million TWD), 0 million ZAR (2015: 37 million ZAR), 380 million MXN (2015: 0.00 MXN), 1,620 milion RUB (2015: 0 million RUB) and 4 million SGD (2015: 0 million SGD). The term of the forex deals is up to January 2018 (2015: up to July 2017). Mark to Market loss on Forex contracts amounts to 16,903,583.66 EUR (2015: a loss 5,012,919.83 EUR). An amount of 3,913,381.80
EUR has been deducted from Trade debtors to take into account the hedging effect of open positions at year end. No provision has been provided for in connection with hedging contracts on future debtors and creditors posi-tions.
2. Interest Rate Swaps contracts in order to cover its long term funding interest risk. Global notional amounts to 389 million EUR (2015: 413 million EUR). Due dates are up to February 2025 (2015: to January 2018). Mark to Market loss on IRS and IRC contracts amounts to 6,676,701.39 EUR (2015: a loss of 9,520,292.59 EUR). No provision has been provided for in connection with these hedging contracts.
3. Energy Swaps contracts in order to cover the varia-tion of fuel prices. Global notional amounts to 23,544 MT. Their expiration date is up to October 2017. The valuation of these contracts as at December 31, 2016 leads to a potential gain amounting to 1,326,634.58 EUR (in 2015: loss of 6,496,053.05 EUR). As these contracts are hedging purpose, no accrual has been provided for.
Other guarantees
In 2015, the Group had pledged Cash at bank assets for an amount of 99,286,454.65 EUR in favor of banks. These pledged Cash at bank assets were netted in deduction from Amounts owed to credit institutions (see Note 3.2). In 2016, this is no more the case.
Commitments to purchase tangible assets
As at December 31, 2016, commitments related to for-ward purchases of Tangible assets amount approximately to million 93.7 million EUR (2015: 230.3 million EUR).
38. ADVANCES AND LOANS GRANTED TO THE MEMBERS OF THE ADMINISTRATIVE, MANAGERIAL AND SUPERVISORY BODIES
The Advances and loans granted during the financial year to the members of those bodies may be summarized as follows:
2016 2015Administrative and managerial bodies 0.00 0.00
Supervisory bodies 0.00 0.00
The Group did not enter in any commitments during the financial year on the behalf of the members of those bodies.
40. SUBSEQUENT EVENTS
The Group managed to collect a receivable (previously booked as dubious debtors – see Note 10) from its customer Saudi Arabian Oil Company.On April 6, 2017, the vessels Dirk Martens, DN69 and DN71 were authorized to leave the Sierra Leone territory.
41. ADDITIONAL INFORMATION TO THE CONSOLIDATED ACCOUNTS AS OF DECEMBER 31, 2016
As mentioned in note 21, these consolidated annual accounts have been significantly impacted by the delivery of the third set of locks of the Panama canal. For the sake of clarity and comparability, a special purpose financial report including additional financial information has therefore been produced and validated by the Group’s auditor. This report is available on paper at the registered office or on the website of the Group.

50
51SPECIAL PURPOSE CONSOLIDATED ACCOUNTS
SPECIAL PURPOSE CONSOLIDATED ACCOUNTSREPORT ON THE SPECIAL PURPOSE CONSOLIDATED ACCOUNTS
We have audited the accompanying special purpose con-solidated accounts of JAN DE NUL GROUP*, which com-prise the special purpose consolidated balance sheet as at December 31, 2016, the special purpose consolidated profit and loss account for the year then ended, and the notes to the special purpose consolidated accounts. The special purpose consolidated accounts have been pre-pared by the Management to provide additional informa-tion on the Company’s consolidated annual accounts as at December 31, 2016, based on the accounting policies described under notes 1 and 4 to the special purpose consolidated accounts.
BOARD OF DIRECTORS’ RESPONSIBILITY FOR THE SPECIAL PURPOSE CONSOLIDATED ACCOUNTS
The Board of Directors is responsible for the preparation and fair presentation of these special purpose consoli-dated accounts in accordance with the accounting poli-cies disclosed in the notes 1 and 4 of the accompanying notes to the special purpose consolidated accounts, and for such internal control as the Board of Directors deter-mines is necessary to enable the preparation of special purpose consolidated accounts that are free from mate-rial misstatement, whether due to fraud or error.
RESPONSIBILITY OF THE RÉVISEUR D’ENTREPRISES AGRÉÉ
Our responsibility is to express an opinion on these spe-cial purpose consolidated accounts based on our audit. We conducted our audit in accordance with International Standards on Auditing as adopted for Luxembourg by the Commission de Surveillance du Secteur Financier. Those standards require that we comply with ethical requirements and plan and perform the audit to obtain reasonable assurance whether the special purpose con-solidated accounts are free from material misstatement. An audit involves performing procedures to obtain audit evidence about the amounts and disclosures in the spe-
cial purpose consolidated accounts. The procedures selected depend on the judgment of the Réviseur d’En-treprises Agréé, including the assessment of the risks of material misstatement of the special purpose consoli-dated accounts, whether due to fraud or error.
In making those risks assessments, the Réviseur d’En-treprises Agréé considers internal control relevant to the entity’s preparation and fair presentation of the special purpose consolidated accounts in order to design audit procedures that are appropriate in the circumstances, but not for the purpose of expressing an opinion on the effectiveness of the entity’s internal control.
An audit also includes evaluating the appropriateness of accounting policies used and the reasonableness of accounting estimates made by the Board of Directors, as well as evaluating the overall presentation of the special purpose consolidated accounts.
We believe that the audit evidence we have obtained is sufficient and appropriate to provide a basis of our audit opinion.
OPINION
In our opinion, the special purpose consolidated accounts give a true and fair view of the financial position of JAN DE NUL GROUP* as of December 31, 2016, and of the results of its operations for the year then ended in accordance with the accounting policies described under notes 1 and 4 to the special purpose consolidated accounts.
Lxembourg, May 5, 2017
Thierry REMACLE Réviseur d’Entreprises Agréé
Grant Thornton Lux Audit S.A. | 89A, Pafebruch | L-8308 Capellen Luxembourg | Tel.: +352 40 12 991 | Fax: +352 40 05 98 | www.grantthornton.lu
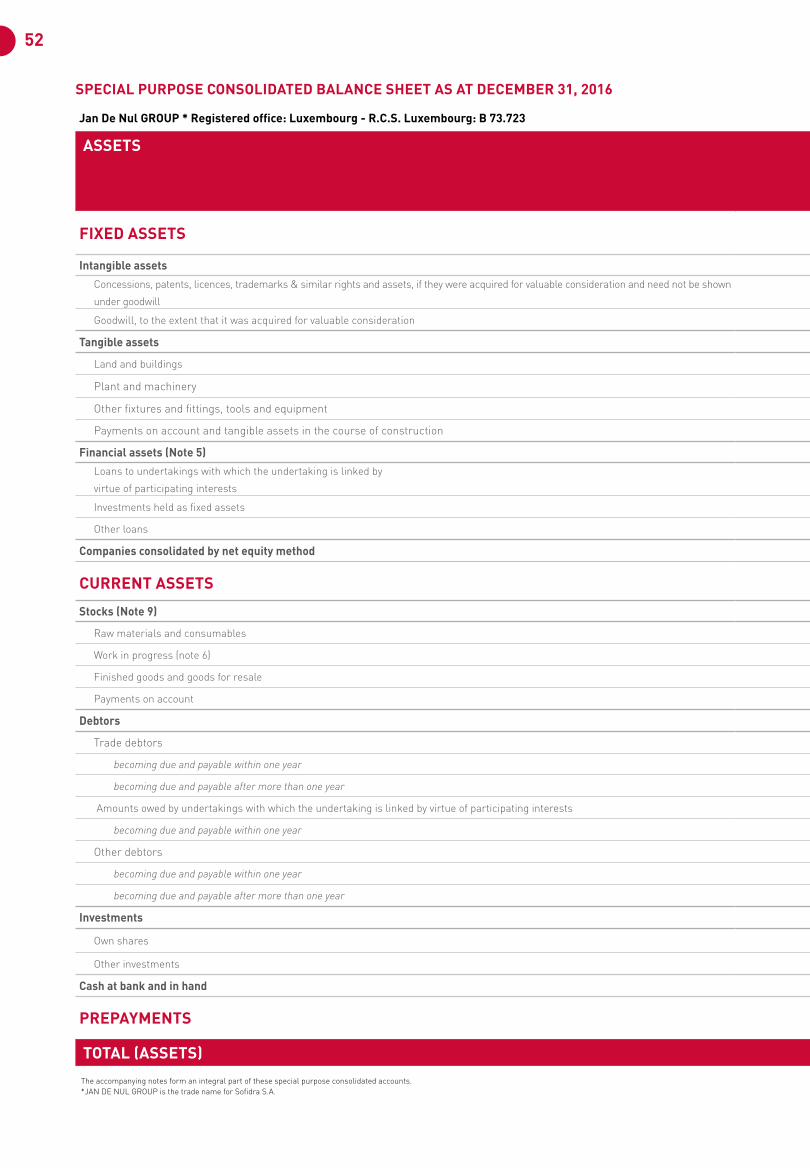
52
SPECIAL PURPOSE CONSOLIDATED BALANCE SHEET AS AT DECEMBER 31, 2016
Jan De Nul GROUP * Registered office: Luxembourg - R.C.S. Luxembourg: B 73.723
ASSETS 2016INCLUDING
ADJUSTMENT RELATED TO DELIVERY
OF GUPC PROJECT
2016 ADJUSTMENT
RELATED TO DELIVERY OF GUPC PROJECT
2016EXCLUDING
ADJUSTMENT RELATED TO DELIVERY
OF GUPC PROJECT
2015
FIXED ASSETS 2,229,976,639.04 0.00 2,229,976,639.04 2,218,752,365.25
Intangible assets 8,176,320.18 0.00 8,176,320.18 11,205,783.92Concessions, patents, licences, trademarks & similar rights and assets, if they were acquired for valuable consideration and need not be shown
under goodwill978,647.52 0.00 978,647.52 1,467,696.48
Goodwill, to the extent that it was acquired for valuable consideration 7,197,672.66 0.00 7,197,672.66 9,738,087.44
Tangible assets 2,154,507,574.09 0.00 2,154,507,574.09 2,146,465,545.66
Land and buildings 76,943,084.08 0.00 76,943,084.08 74,913,055.25
Plant and machinery 1,843,938,937.23 0.00 1,843,938,937.23 1,976,519,884.66
Other fixtures and fittings, tools and equipment 20,234,072.61 0.00 20,234,072.61 19,802,921.55
Payments on account and tangible assets in the course of construction 213,391,480.17 0.00 213,391,480.17 75,229,684.20
Financial assets (Note 5) 66,329,250.11 0.00 66,329,250.11 60,113,427.23Loans to undertakings with which the undertaking is linked by
virtue of participating interests20,228,881.29 0.00 20,228,881.29 18,640,665.71
Investments held as fixed assets 1,506,041.37 0.00 1,506,041.37 1,524,537.08
Other loans 44,594,327.45 0.00 44,594,327.45 39,948,224.44
Companies consolidated by net equity method 963,494.66 0.00 963,494.66 967,608.44
CURRENT ASSETS 1,600,364,201.03 (721,946,837.01) 2,322,311,038.04 2,512,898,330.34
Stocks (Note 9) 239,203,685.61 (721,946,837.01) 961,150,522.62 886,007,389.63
Raw materials and consumables 156,727,832.66 0.00 156,727,832.66 173,747,871.67
Work in progress (note 6) 71,823,257.29 (721,946,837.01) 793,770,094.30 684,556,090.45
Finished goods and goods for resale 10,652,595.66 0.00 10,652,595.66 27,703,427.51
Payments on account 0.00 0.00 0.00 0.00
Debtors 794,645,757.36 0.00 794,645,757.36 649,669,682.74
Trade debtors 697,071,749.91 0.00 697,071,749.91 562,784,963.95
becoming due and payable within one year 695,293,749.90 0.00 695,293,749.90 561,006,963.95
becoming due and payable after more than one year 1,778,000.01 0.00 1,778,000.01 1,778,000.00
Amounts owed by undertakings with which the undertaking is linked by virtue of participating interests 33,998,475.31 0.00 33,998,475.31 4,485,383.45
becoming due and payable within one year 33,998,475.31 0.00 33,998,475.31 4,485,383.45
Other debtors 63,575,532.14 0.00 63,575,532.14 82,399,335.34
becoming due and payable within one year 63,575,532.14 0.00 63,575,532.14 82,399,335.34
becoming due and payable after more than one year 0.00 0.00 0.00 0.00
Investments 60,000,000.00 0.00 60,000,000.00 60,000,000.00
Own shares 60,000,000.00 0.00 60,000,000.00 60,000,000.00
Other investments 0.00 0.00 0.00 0.00
Cash at bank and in hand 506,514,758.06 0.00 506,514,758.06 917,221,257.97
PREPAYMENTS 6,134,542.21 0.00 6,134,542.21 9,317,312.76
TOTAL (ASSETS) 3,836,475,382.28 (721,946,837.01) 4,558,422,219.29 4,740,968,008.35
The accompanying notes form an integral part of these special purpose consolidated accounts. *JAN DE NUL GROUP is the trade name for Sofidra S.A.
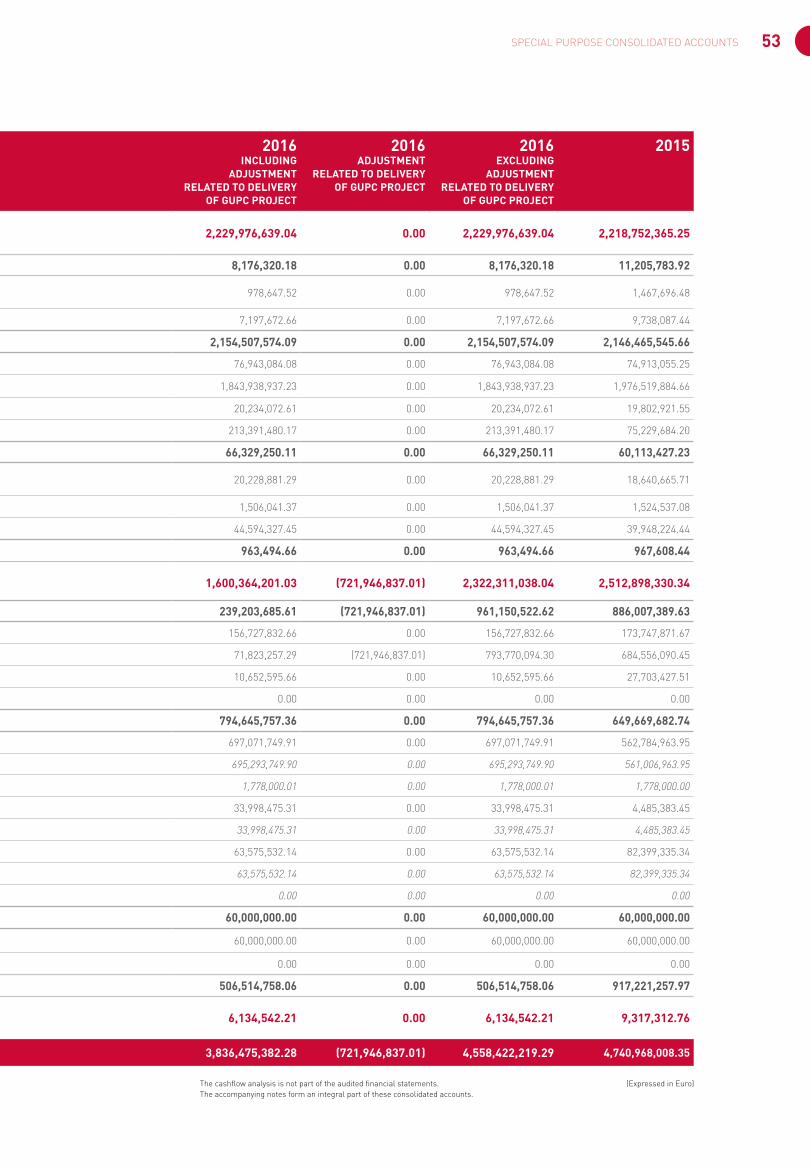
53SPECIAL PURPOSE CONSOLIDATED ACCOUNTS
SPECIAL PURPOSE CONSOLIDATED BALANCE SHEET AS AT DECEMBER 31, 2016
Jan De Nul GROUP * Registered office: Luxembourg - R.C.S. Luxembourg: B 73.723
ASSETS 2016INCLUDING
ADJUSTMENT RELATED TO DELIVERY
OF GUPC PROJECT
2016 ADJUSTMENT
RELATED TO DELIVERY OF GUPC PROJECT
2016EXCLUDING
ADJUSTMENT RELATED TO DELIVERY
OF GUPC PROJECT
2015
FIXED ASSETS 2,229,976,639.04 0.00 2,229,976,639.04 2,218,752,365.25
Intangible assets 8,176,320.18 0.00 8,176,320.18 11,205,783.92Concessions, patents, licences, trademarks & similar rights and assets, if they were acquired for valuable consideration and need not be shown
under goodwill978,647.52 0.00 978,647.52 1,467,696.48
Goodwill, to the extent that it was acquired for valuable consideration 7,197,672.66 0.00 7,197,672.66 9,738,087.44
Tangible assets 2,154,507,574.09 0.00 2,154,507,574.09 2,146,465,545.66
Land and buildings 76,943,084.08 0.00 76,943,084.08 74,913,055.25
Plant and machinery 1,843,938,937.23 0.00 1,843,938,937.23 1,976,519,884.66
Other fixtures and fittings, tools and equipment 20,234,072.61 0.00 20,234,072.61 19,802,921.55
Payments on account and tangible assets in the course of construction 213,391,480.17 0.00 213,391,480.17 75,229,684.20
Financial assets (Note 5) 66,329,250.11 0.00 66,329,250.11 60,113,427.23Loans to undertakings with which the undertaking is linked by
virtue of participating interests20,228,881.29 0.00 20,228,881.29 18,640,665.71
Investments held as fixed assets 1,506,041.37 0.00 1,506,041.37 1,524,537.08
Other loans 44,594,327.45 0.00 44,594,327.45 39,948,224.44
Companies consolidated by net equity method 963,494.66 0.00 963,494.66 967,608.44
CURRENT ASSETS 1,600,364,201.03 (721,946,837.01) 2,322,311,038.04 2,512,898,330.34
Stocks (Note 9) 239,203,685.61 (721,946,837.01) 961,150,522.62 886,007,389.63
Raw materials and consumables 156,727,832.66 0.00 156,727,832.66 173,747,871.67
Work in progress (note 6) 71,823,257.29 (721,946,837.01) 793,770,094.30 684,556,090.45
Finished goods and goods for resale 10,652,595.66 0.00 10,652,595.66 27,703,427.51
Payments on account 0.00 0.00 0.00 0.00
Debtors 794,645,757.36 0.00 794,645,757.36 649,669,682.74
Trade debtors 697,071,749.91 0.00 697,071,749.91 562,784,963.95
becoming due and payable within one year 695,293,749.90 0.00 695,293,749.90 561,006,963.95
becoming due and payable after more than one year 1,778,000.01 0.00 1,778,000.01 1,778,000.00
Amounts owed by undertakings with which the undertaking is linked by virtue of participating interests 33,998,475.31 0.00 33,998,475.31 4,485,383.45
becoming due and payable within one year 33,998,475.31 0.00 33,998,475.31 4,485,383.45
Other debtors 63,575,532.14 0.00 63,575,532.14 82,399,335.34
becoming due and payable within one year 63,575,532.14 0.00 63,575,532.14 82,399,335.34
becoming due and payable after more than one year 0.00 0.00 0.00 0.00
Investments 60,000,000.00 0.00 60,000,000.00 60,000,000.00
Own shares 60,000,000.00 0.00 60,000,000.00 60,000,000.00
Other investments 0.00 0.00 0.00 0.00
Cash at bank and in hand 506,514,758.06 0.00 506,514,758.06 917,221,257.97
PREPAYMENTS 6,134,542.21 0.00 6,134,542.21 9,317,312.76
TOTAL (ASSETS) 3,836,475,382.28 (721,946,837.01) 4,558,422,219.29 4,740,968,008.35
The cashflow analysis is not part of the audited financial statements. (Expressed in Euro) The accompanying notes form an integral part of these consolidated accounts.
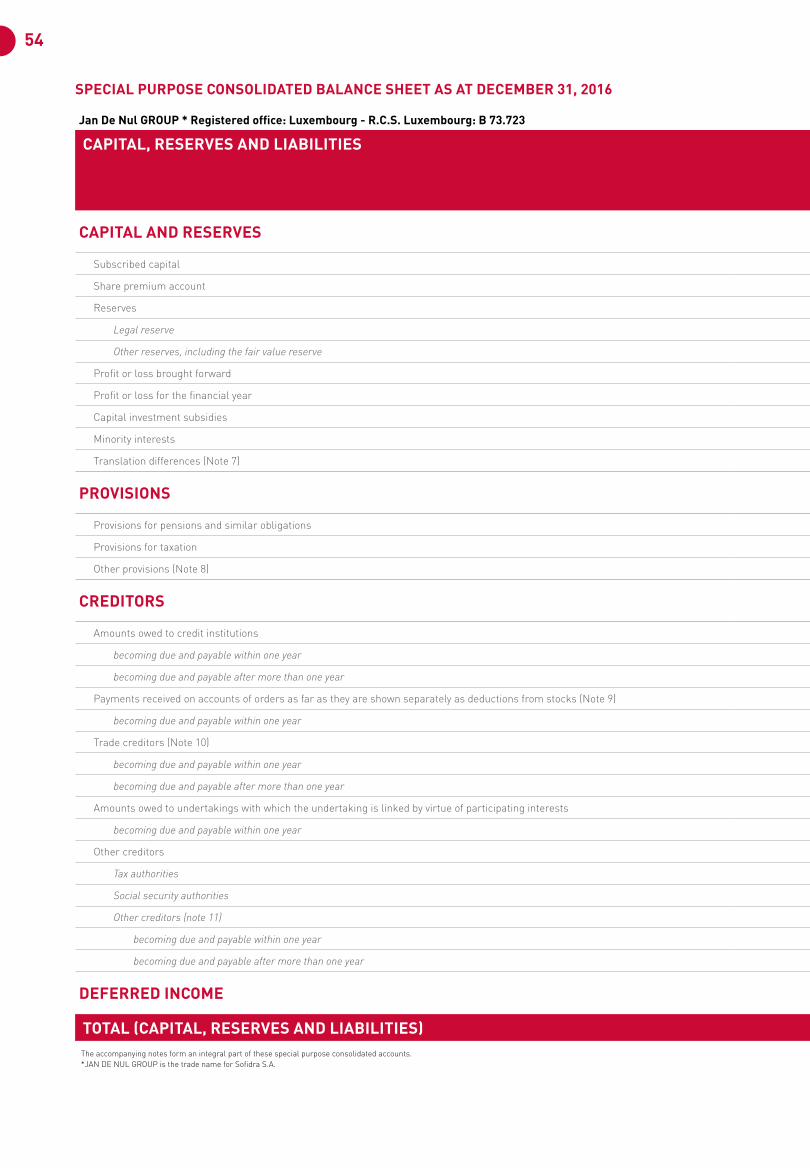
54
SPECIAL PURPOSE CONSOLIDATED BALANCE SHEET AS AT DECEMBER 31, 2016
Jan De Nul GROUP * Registered office: Luxembourg - R.C.S. Luxembourg: B 73.723
CAPITAL, RESERVES AND LIABILITIES 2016INCLUDING
ADJUSTMENT RELATED TO DELIVERY OF GUPC
PROJECT
2016 ADJUSTMENT
RELATED TO DELIVERY OF GUPC PROJECT
2016EXCLUDING
ADJUSTMENT RELATED TO DELIVERY
OF GUPC PROJECT
2015
CAPITAL AND RESERVES 2,636,233,418.60 (2,828,066.53) 2,639,061,485.13 2,521,987,359.86
Subscribed capital 538,400,000.00 0.00 538,400,000.00 538,400,000.00
Share premium account 20,343,906.33 0.00 20,343,906.33 20,343,906.33
Reserves (3,501,106.37) 0.00 (3,501,106.37) (5,068,043.51)
Legal reserve 43,804,037.63 0.00 43,804,037.63 42,732,468.63
Other reserves, including the fair value reserve (47,305,144.00) 0.00 (47,305,144.00) (47,800,512.14)
Profit or loss brought forward 2,163,968,977.17 0.00 2,163,968,977.17 1,900,482,029.35
Profit or loss for the financial year 103,932,460.21 2,284,299.90 101,648,160.31 264,537,518.67
Capital investment subsidies 412,978.80 0.00 412,978.80 434,772.00
Minority interests 17,753,559.86 0.00 17,753,559.86 17,658,240.83
Translation differences (Note 7) (205,077,357.40) 5,112,366.43 (199,964,990.97) (214,801,063.81)
PROVISIONS 77,076,727.25 (112,105,089.17) 189,181,816.42 220,454,657.07
Provisions for pensions and similar obligations 2,814,371.58 0.00 2,814,371.58 2,046,251.90
Provisions for taxation 16,585,361.13 0.00 16,585,361.13 27,808,640.66
Other provisions (Note 8) 57,676,994.54 (112,105,089.17) 169,782,083.71 190,599,764.51
CREDITORS 1,027,632,133.24 (607,013,681.31) 1,634,645,814.55 1,861,344,978.91
Amounts owed to credit institutions 288,278,035.20 0.00 288,278,035.20 594,340,072.35
becoming due and payable within one year 120,418,967.24 0.00 120,418,967.24 335,497,338.74
becoming due and payable after more than one year 167,859,067.96 0.00 167,859,067.96 258,842,733.61
Payments received on accounts of orders as far as they are shown separately as deductions from stocks (Note 9) 241,983,537.79 (517,540,307.26) 759,523,845.05 670,560,316.32
becoming due and payable within one year 241,983,537.79 (517,540,307.26) 759,523,845.05 670,560,316.32
Trade creditors (Note 10) 283,331,260.44 (10,473,748.19) 293,805,008.63 336,030,522.83
becoming due and payable within one year 281,079,117.66 (10,473,748.19) 291,552,865.85 333,585,535.37
becoming due and payable after more than one year 2,252,142.78 0.00 2,252,142.78 2,444,987.46
Amounts owed to undertakings with which the undertaking is linked by virtue of participating interests 3,357,154.34 0.00 3,357,154.34 5,325,435.47
becoming due and payable within one year 3,357,154.34 0.00 3,357,154.34 5,325,435.47
Other creditors 210,682,145.47 (78,999,625.86) 289,681,771.33 255,088,631.94
Tax authorities 53,962,579.22 0.00 53,962,579.22 41,215,362.00
Social security authorities 9,015,578.42 0.00 9,015,578.42 6,412,689.67
Other creditors (note 11) 147,703,987.83 (78,999,625.86) 226,703,613.69 207,460,580.27
becoming due and payable within one year 87,536,094.32 0.00 87,536,094.32 83,253,155.71
becoming due and payable after more than one year 60,167,893.51 (78,999,625.86) 139,167,519.37 124,207,424.56
DEFERRED INCOME 95,533,103.19 0.00 95,533,103.19 137,181,012.51
TOTAL (CAPITAL, RESERVES AND LIABILITIES) 3,836,475,382.28 (721,946,837.01) 4,558,422,219.29 4,740,968,008.35
The accompanying notes form an integral part of these special purpose consolidated accounts. *JAN DE NUL GROUP is the trade name for Sofidra S.A.
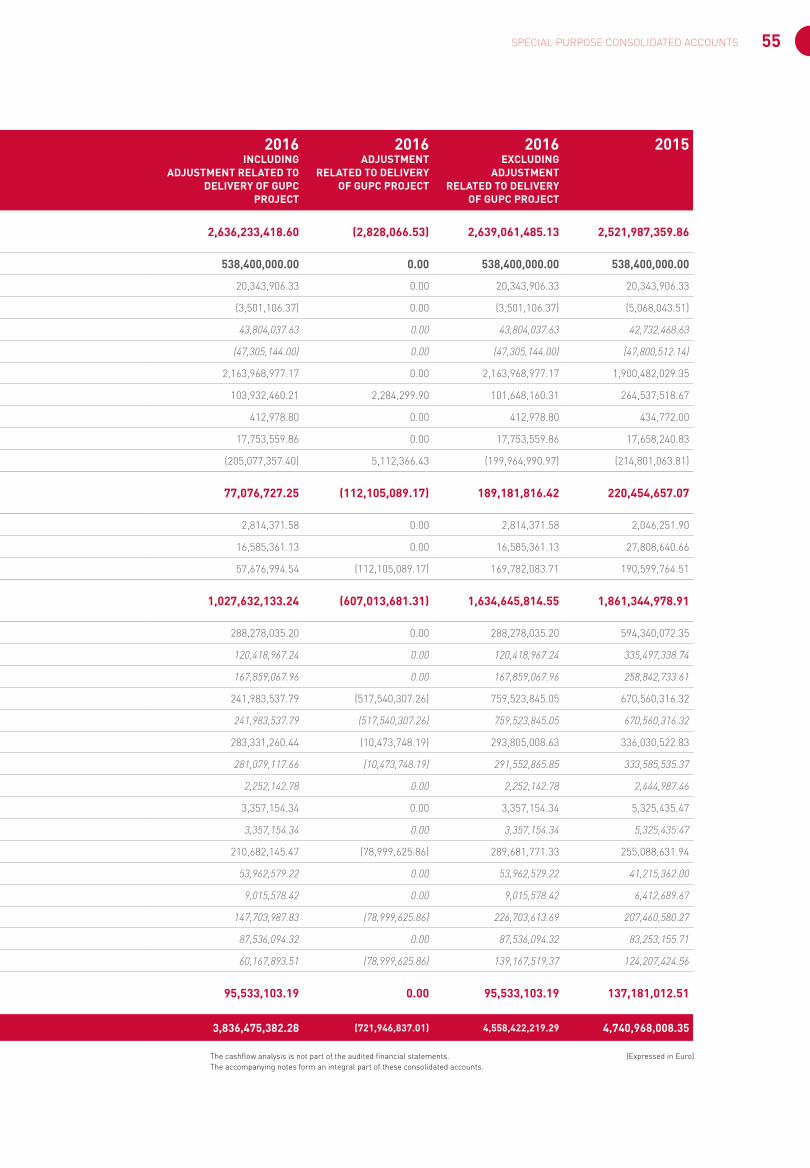
55SPECIAL PURPOSE CONSOLIDATED ACCOUNTS
SPECIAL PURPOSE CONSOLIDATED BALANCE SHEET AS AT DECEMBER 31, 2016
Jan De Nul GROUP * Registered office: Luxembourg - R.C.S. Luxembourg: B 73.723
CAPITAL, RESERVES AND LIABILITIES 2016INCLUDING
ADJUSTMENT RELATED TO DELIVERY OF GUPC
PROJECT
2016 ADJUSTMENT
RELATED TO DELIVERY OF GUPC PROJECT
2016EXCLUDING
ADJUSTMENT RELATED TO DELIVERY
OF GUPC PROJECT
2015
CAPITAL AND RESERVES 2,636,233,418.60 (2,828,066.53) 2,639,061,485.13 2,521,987,359.86
Subscribed capital 538,400,000.00 0.00 538,400,000.00 538,400,000.00
Share premium account 20,343,906.33 0.00 20,343,906.33 20,343,906.33
Reserves (3,501,106.37) 0.00 (3,501,106.37) (5,068,043.51)
Legal reserve 43,804,037.63 0.00 43,804,037.63 42,732,468.63
Other reserves, including the fair value reserve (47,305,144.00) 0.00 (47,305,144.00) (47,800,512.14)
Profit or loss brought forward 2,163,968,977.17 0.00 2,163,968,977.17 1,900,482,029.35
Profit or loss for the financial year 103,932,460.21 2,284,299.90 101,648,160.31 264,537,518.67
Capital investment subsidies 412,978.80 0.00 412,978.80 434,772.00
Minority interests 17,753,559.86 0.00 17,753,559.86 17,658,240.83
Translation differences (Note 7) (205,077,357.40) 5,112,366.43 (199,964,990.97) (214,801,063.81)
PROVISIONS 77,076,727.25 (112,105,089.17) 189,181,816.42 220,454,657.07
Provisions for pensions and similar obligations 2,814,371.58 0.00 2,814,371.58 2,046,251.90
Provisions for taxation 16,585,361.13 0.00 16,585,361.13 27,808,640.66
Other provisions (Note 8) 57,676,994.54 (112,105,089.17) 169,782,083.71 190,599,764.51
CREDITORS 1,027,632,133.24 (607,013,681.31) 1,634,645,814.55 1,861,344,978.91
Amounts owed to credit institutions 288,278,035.20 0.00 288,278,035.20 594,340,072.35
becoming due and payable within one year 120,418,967.24 0.00 120,418,967.24 335,497,338.74
becoming due and payable after more than one year 167,859,067.96 0.00 167,859,067.96 258,842,733.61
Payments received on accounts of orders as far as they are shown separately as deductions from stocks (Note 9) 241,983,537.79 (517,540,307.26) 759,523,845.05 670,560,316.32
becoming due and payable within one year 241,983,537.79 (517,540,307.26) 759,523,845.05 670,560,316.32
Trade creditors (Note 10) 283,331,260.44 (10,473,748.19) 293,805,008.63 336,030,522.83
becoming due and payable within one year 281,079,117.66 (10,473,748.19) 291,552,865.85 333,585,535.37
becoming due and payable after more than one year 2,252,142.78 0.00 2,252,142.78 2,444,987.46
Amounts owed to undertakings with which the undertaking is linked by virtue of participating interests 3,357,154.34 0.00 3,357,154.34 5,325,435.47
becoming due and payable within one year 3,357,154.34 0.00 3,357,154.34 5,325,435.47
Other creditors 210,682,145.47 (78,999,625.86) 289,681,771.33 255,088,631.94
Tax authorities 53,962,579.22 0.00 53,962,579.22 41,215,362.00
Social security authorities 9,015,578.42 0.00 9,015,578.42 6,412,689.67
Other creditors (note 11) 147,703,987.83 (78,999,625.86) 226,703,613.69 207,460,580.27
becoming due and payable within one year 87,536,094.32 0.00 87,536,094.32 83,253,155.71
becoming due and payable after more than one year 60,167,893.51 (78,999,625.86) 139,167,519.37 124,207,424.56
DEFERRED INCOME 95,533,103.19 0.00 95,533,103.19 137,181,012.51
TOTAL (CAPITAL, RESERVES AND LIABILITIES) 3,836,475,382.28 (721,946,837.01) 4,558,422,219.29 4,740,968,008.35
The cashflow analysis is not part of the audited financial statements. (Expressed in Euro) The accompanying notes form an integral part of these consolidated accounts.
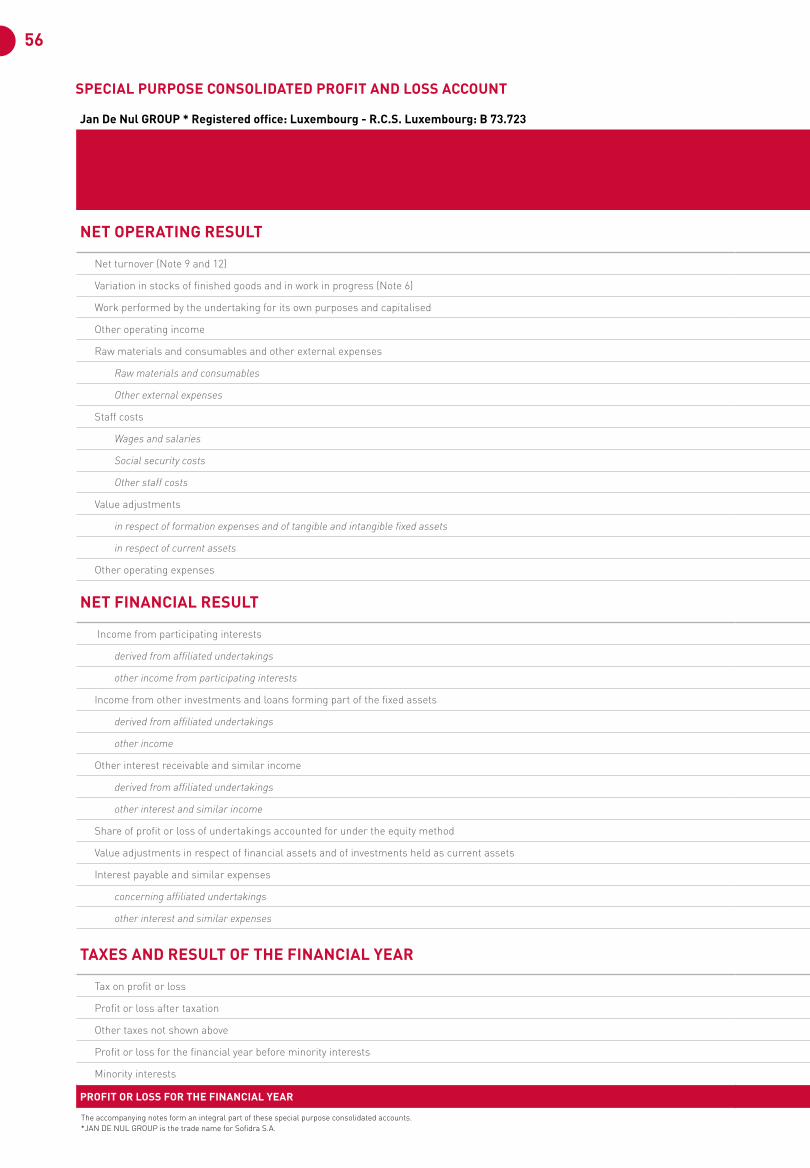
56
Jan De Nul GROUP * Registered office: Luxembourg - R.C.S. Luxembourg: B 73.723
2016INCLUDING
ADJUSTMENT RELATED TO DELIVERY
OF GUPC PROJECT
2016 ADJUSTMENT
RELATED TO DELIVERY OF GUPC PROJECT
2016EXCLUDING
ADJUSTMENT RELATED TO DELIVERY
OF GUPC PROJECT
2015
NET OPERATING RESULT (38,771,063.86) (195,314,618.57) 156,543,554.71 336,554,215.12
Net turnover (Note 9 and 12) 2,538,067,639.73 494,521,450.14 2,043,546,189.59 2,244,468,838.88
Variation in stocks of finished goods and in work in progress (Note 6) (615,783,997.69) (689,836,068.71) 74,052,071.02 149,114,952.23
Work performed by the undertaking for its own purposes and capitalised 8,340,073.45 0.00 8,340,073.45 5,995,955.36
Other operating income 112,366,110.10 0.00 112,366,110.10 66,430,819.04
Raw materials and consumables and other external expenses (1,472,337,990.83) 0.00 (1,472,337,990.83) (1,410,131,747.88)
Raw materials and consumables (773,287,572.12) 0.00 (773,287,572.12) (836,793,165.97)
Other external expenses (699,050,418.71) 0.00 (699,050,418.71) (573,338,581.91)
Staff costs (349,761,734.29) 0.00 (349,761,734.29) (315,952,255.93)
Wages and salaries (257,848,956.80) 0.00 (257,848,956.80) (227,769,527.13)
Social security costs (64,854,602.51) 0.00 (64,854,602.51) (57,382,186.59)
Other staff costs (27,058,174.98) 0.00 (27,058,174.98) (30,800,542.21)
Value adjustments (182,462,605.44) 0.00 (182,462,605.44) (282,695,930.07)
in respect of formation expenses and of tangible and intangible fixed assets (227,538,340.25) 0.00 (227,538,340.25) (229,266,132.75)
in respect of current assets 45,075,734.81 0.00 45,075,734.81 (53,429,797.32)
Other operating expenses (77,198,558.89) 0.00 (77,198,558.89) (120,676,416.51)
NET FINANCIAL RESULT 168,376,990.63 197,598,918.47 (29,221,927.89) (70,749,863.34)
Income from participating interests 0.00 0,00 0.00 5,378.80
derived from affiliated undertakings 0.00 0.00 0.00 0.00
other income from participating interests 0.00 0.00 0.00 5,378.80
Income from other investments and loans forming part of the fixed assets 0.00 0.00 0.00 0.00
derived from affiliated undertakings 0.00 0.00 0.00 0.00
other income 0.00 0.00 0.00 0.00
Other interest receivable and similar income 265,786,743.16 197,598,918.47 68,187,824.69 38,218,901.31
derived from affiliated undertakings 0.00 0.00 0.00 0.00
other interest and similar income 265,786,743.16 197,598,918.47 68,187,824.69 38,218,901.31
Share of profit or loss of undertakings accounted for under the equity method (20,114.03) 0.00 (20,114.03) (17,183.39)
Value adjustments in respect of financial assets and of investments held as current assets (13,157,088.97) 0.00 (13,157,088.97) (5,650,675.41)
Interest payable and similar expenses (84,232,549.53) 0.00 (84,232,549.53) (103,306,284.65)
concerning affiliated undertakings 0.00 0.00 0.00 0.00
other interest and similar expenses (84,232,549.53) 0.00 (84,232,549.53) (103,306,284.65)
TAXES AND RESULT OF THE FINANCIAL YEAR
Tax on profit or loss (14,995,949.55) 0.00 (14,995,949.55) 4,558,175.27
Profit or loss after taxation 114,609,977.22 2,284,299.90 112,325,677.32 270,362,527.05
Other taxes not shown above (10,523,376.93) 0.00 (10,523,376.93) (5,517,638.41)
Profit or loss for the financial year before minority interests 104,086,600.29 2,284,299.00 101,802,300.39 264,844,888.64
Minority interests (154,140.08) 0.00 (154,140.08) (307,369.97)
PROFIT OR LOSS FOR THE FINANCIAL YEAR 103,932,460.21 2,284,299.90 101,648,160.31 264,537,518.67
SPECIAL PURPOSE CONSOLIDATED PROFIT AND LOSS ACCOUNT
The accompanying notes form an integral part of these special purpose consolidated accounts. *JAN DE NUL GROUP is the trade name for Sofidra S.A.
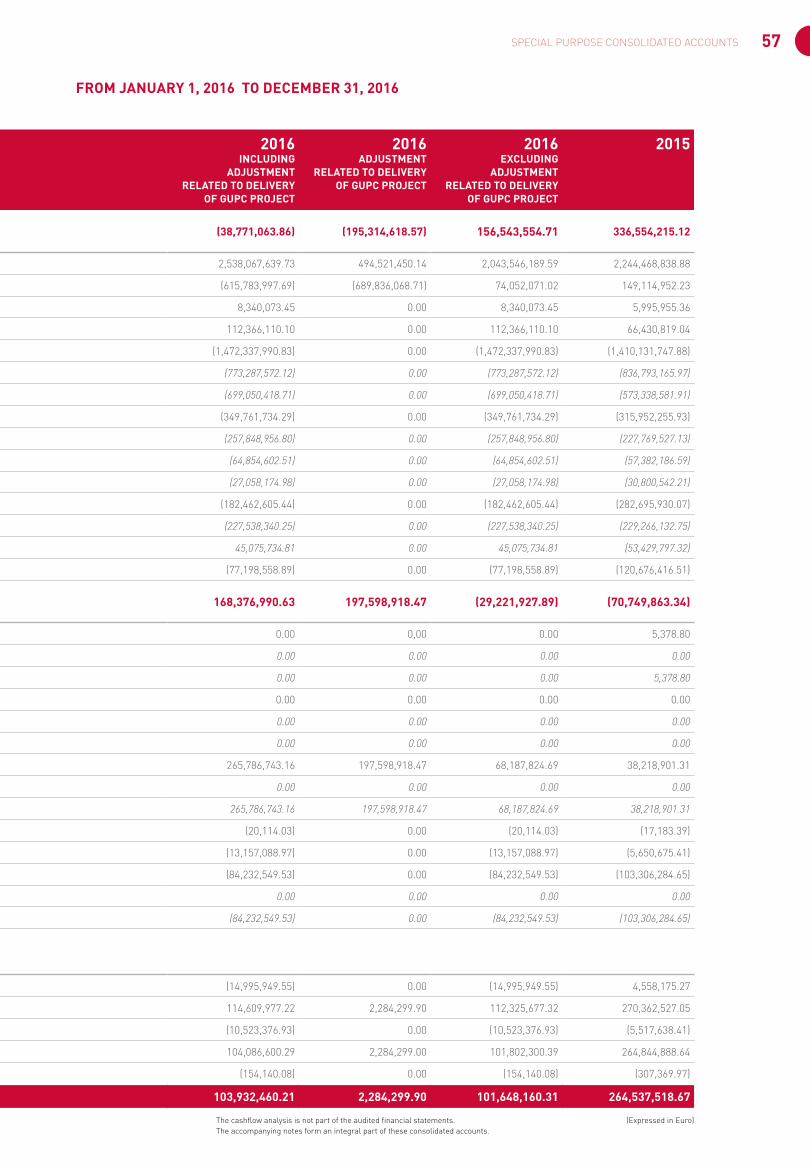
57SPECIAL PURPOSE CONSOLIDATED ACCOUNTS
Jan De Nul GROUP * Registered office: Luxembourg - R.C.S. Luxembourg: B 73.723
2016INCLUDING
ADJUSTMENT RELATED TO DELIVERY
OF GUPC PROJECT
2016 ADJUSTMENT
RELATED TO DELIVERY OF GUPC PROJECT
2016EXCLUDING
ADJUSTMENT RELATED TO DELIVERY
OF GUPC PROJECT
2015
NET OPERATING RESULT (38,771,063.86) (195,314,618.57) 156,543,554.71 336,554,215.12
Net turnover (Note 9 and 12) 2,538,067,639.73 494,521,450.14 2,043,546,189.59 2,244,468,838.88
Variation in stocks of finished goods and in work in progress (Note 6) (615,783,997.69) (689,836,068.71) 74,052,071.02 149,114,952.23
Work performed by the undertaking for its own purposes and capitalised 8,340,073.45 0.00 8,340,073.45 5,995,955.36
Other operating income 112,366,110.10 0.00 112,366,110.10 66,430,819.04
Raw materials and consumables and other external expenses (1,472,337,990.83) 0.00 (1,472,337,990.83) (1,410,131,747.88)
Raw materials and consumables (773,287,572.12) 0.00 (773,287,572.12) (836,793,165.97)
Other external expenses (699,050,418.71) 0.00 (699,050,418.71) (573,338,581.91)
Staff costs (349,761,734.29) 0.00 (349,761,734.29) (315,952,255.93)
Wages and salaries (257,848,956.80) 0.00 (257,848,956.80) (227,769,527.13)
Social security costs (64,854,602.51) 0.00 (64,854,602.51) (57,382,186.59)
Other staff costs (27,058,174.98) 0.00 (27,058,174.98) (30,800,542.21)
Value adjustments (182,462,605.44) 0.00 (182,462,605.44) (282,695,930.07)
in respect of formation expenses and of tangible and intangible fixed assets (227,538,340.25) 0.00 (227,538,340.25) (229,266,132.75)
in respect of current assets 45,075,734.81 0.00 45,075,734.81 (53,429,797.32)
Other operating expenses (77,198,558.89) 0.00 (77,198,558.89) (120,676,416.51)
NET FINANCIAL RESULT 168,376,990.63 197,598,918.47 (29,221,927.89) (70,749,863.34)
Income from participating interests 0.00 0,00 0.00 5,378.80
derived from affiliated undertakings 0.00 0.00 0.00 0.00
other income from participating interests 0.00 0.00 0.00 5,378.80
Income from other investments and loans forming part of the fixed assets 0.00 0.00 0.00 0.00
derived from affiliated undertakings 0.00 0.00 0.00 0.00
other income 0.00 0.00 0.00 0.00
Other interest receivable and similar income 265,786,743.16 197,598,918.47 68,187,824.69 38,218,901.31
derived from affiliated undertakings 0.00 0.00 0.00 0.00
other interest and similar income 265,786,743.16 197,598,918.47 68,187,824.69 38,218,901.31
Share of profit or loss of undertakings accounted for under the equity method (20,114.03) 0.00 (20,114.03) (17,183.39)
Value adjustments in respect of financial assets and of investments held as current assets (13,157,088.97) 0.00 (13,157,088.97) (5,650,675.41)
Interest payable and similar expenses (84,232,549.53) 0.00 (84,232,549.53) (103,306,284.65)
concerning affiliated undertakings 0.00 0.00 0.00 0.00
other interest and similar expenses (84,232,549.53) 0.00 (84,232,549.53) (103,306,284.65)
TAXES AND RESULT OF THE FINANCIAL YEAR
Tax on profit or loss (14,995,949.55) 0.00 (14,995,949.55) 4,558,175.27
Profit or loss after taxation 114,609,977.22 2,284,299.90 112,325,677.32 270,362,527.05
Other taxes not shown above (10,523,376.93) 0.00 (10,523,376.93) (5,517,638.41)
Profit or loss for the financial year before minority interests 104,086,600.29 2,284,299.00 101,802,300.39 264,844,888.64
Minority interests (154,140.08) 0.00 (154,140.08) (307,369.97)
PROFIT OR LOSS FOR THE FINANCIAL YEAR 103,932,460.21 2,284,299.90 101,648,160.31 264,537,518.67
The cashflow analysis is not part of the audited financial statements. (Expressed in Euro) The accompanying notes form an integral part of these consolidated accounts.
FROM JANUARY 1, 2016 TO DECEMBER 31, 2016
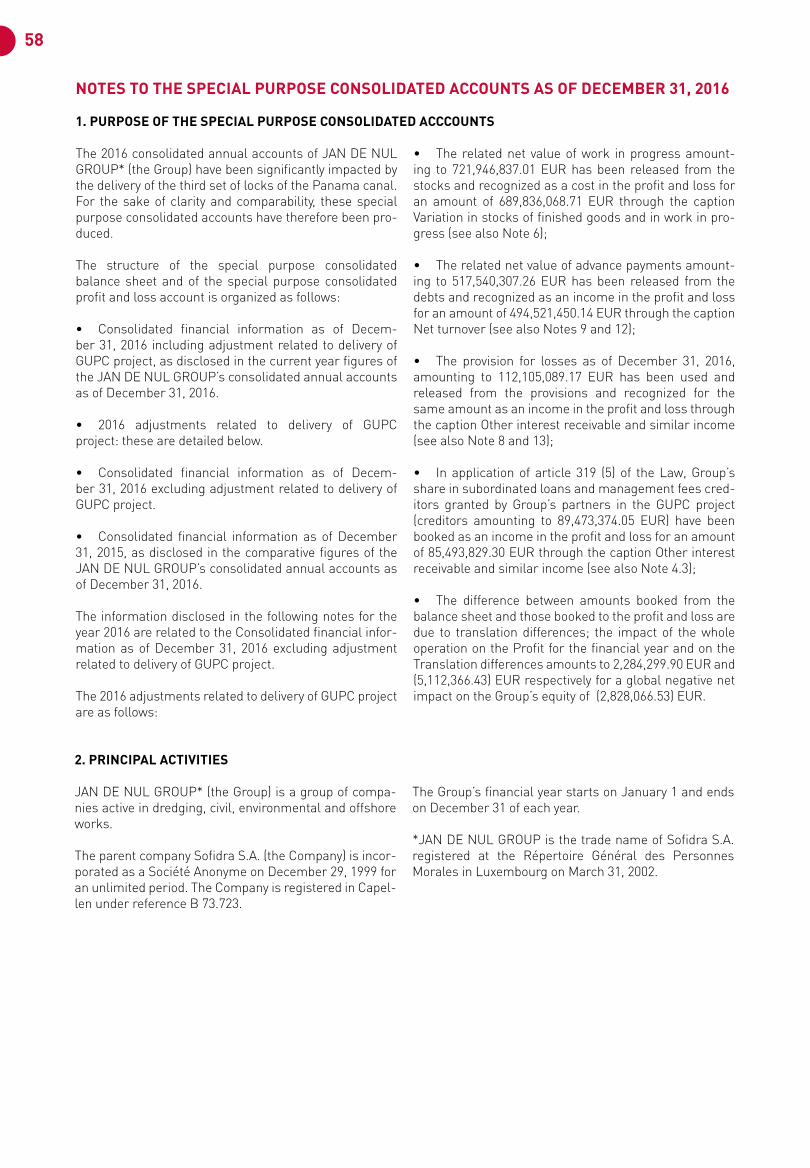
58
NOTES TO THE SPECIAL PURPOSE CONSOLIDATED ACCOUNTS AS OF DECEMBER 31, 2016
1. PURPOSE OF THE SPECIAL PURPOSE CONSOLIDATED ACCCOUNTS
The 2016 consolidated annual accounts of JAN DE NUL GROUP* (the Group) have been significantly impacted by the delivery of the third set of locks of the Panama canal. For the sake of clarity and comparability, these special purpose consolidated accounts have therefore been pro-duced.
The structure of the special purpose consolidated balance sheet and of the special purpose consolidated profit and loss account is organized as follows:
• Consolidated financial information as of Decem-ber 31, 2016 including adjustment related to delivery of GUPC project, as disclosed in the current year figures of the JAN DE NUL GROUP’s consolidated annual accounts as of December 31, 2016.
• 2016 adjustments related to delivery of GUPC project: these are detailed below.
• Consolidated financial information as of Decem-ber 31, 2016 excluding adjustment related to delivery of GUPC project.
• Consolidated financial information as of December 31, 2015, as disclosed in the comparative figures of the JAN DE NUL GROUP’s consolidated annual accounts as of December 31, 2016.
The information disclosed in the following notes for the year 2016 are related to the Consolidated financial infor-mation as of December 31, 2016 excluding adjustment related to delivery of GUPC project.
The 2016 adjustments related to delivery of GUPC project are as follows:
• The related net value of work in progress amount-ing to 721,946,837.01 EUR has been released from the stocks and recognized as a cost in the profit and loss for an amount of 689,836,068.71 EUR through the caption Variation in stocks of finished goods and in work in pro-gress (see also Note 6);
• The related net value of advance payments amount-ing to 517,540,307.26 EUR has been released from the debts and recognized as an income in the profit and loss for an amount of 494,521,450.14 EUR through the caption Net turnover (see also Notes 9 and 12);
• The provision for losses as of December 31, 2016, amounting to 112,105,089.17 EUR has been used and released from the provisions and recognized for the same amount as an income in the profit and loss through the caption Other interest receivable and similar income (see also Note 8 and 13);
• In application of article 319 (5) of the Law, Group’s share in subordinated loans and management fees cred-itors granted by Group’s partners in the GUPC project (creditors amounting to 89,473,374.05 EUR) have been booked as an income in the profit and loss for an amount of 85,493,829.30 EUR through the caption Other interest receivable and similar income (see also Note 4.3);
• The difference between amounts booked from the balance sheet and those booked to the profit and loss are due to translation differences; the impact of the whole operation on the Profit for the financial year and on the Translation differences amounts to 2,284,299.90 EUR and (5,112,366.43) EUR respectively for a global negative net impact on the Group’s equity of (2,828,066.53) EUR.
2. PRINCIPAL ACTIVITIES
JAN DE NUL GROUP* (the Group) is a group of compa-nies active in dredging, civil, environmental and offshore works.
The parent company Sofidra S.A. (the Company) is incor-porated as a Société Anonyme on December 29, 1999 for an unlimited period. The Company is registered in Capel-len under reference B 73.723.
The Group’s financial year starts on January 1 and ends on December 31 of each year.
*JAN DE NUL GROUP is the trade name of Sofidra S.A. registered at the Répertoire Général des Personnes Morales in Luxembourg on March 31, 2002.
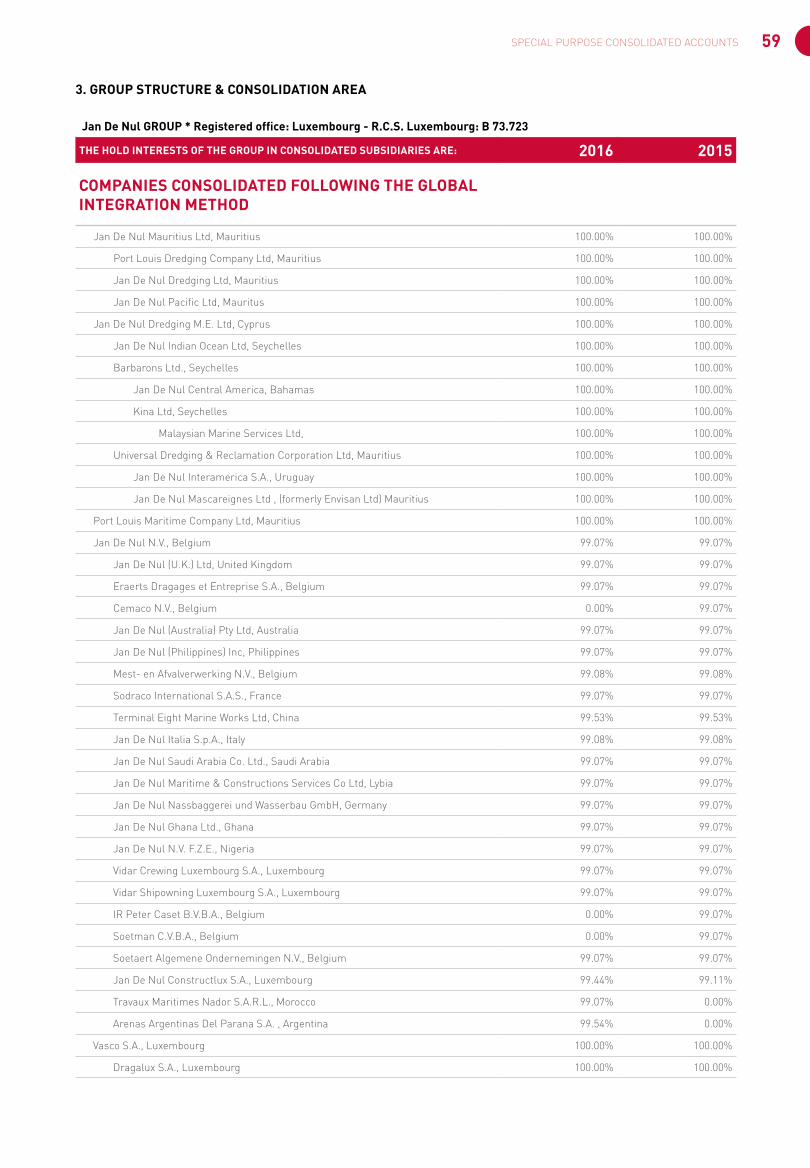
59SPECIAL PURPOSE CONSOLIDATED ACCOUNTS
3. GROUP STRUCTURE & CONSOLIDATION AREA
Jan De Nul GROUP * Registered office: Luxembourg - R.C.S. Luxembourg: B 73.723
THE HOLD INTERESTS OF THE GROUP IN CONSOLIDATED SUBSIDIARIES ARE: 2016 2015
COMPANIES CONSOLIDATED FOLLOWING THE GLOBAL INTEGRATION METHOD
Jan De Nul Mauritius Ltd, Mauritius 100.00% 100.00%
Port Louis Dredging Company Ltd, Mauritius 100.00% 100.00%
Jan De Nul Dredging Ltd, Mauritius 100.00% 100.00%
Jan De Nul Pacific Ltd, Mauritus 100.00% 100.00%
Jan De Nul Dredging M.E. Ltd, Cyprus 100.00% 100.00%
Jan De Nul Indian Ocean Ltd, Seychelles 100.00% 100.00%
Barbarons Ltd., Seychelles 100.00% 100.00%
Jan De Nul Central America, Bahamas 100.00% 100.00%
Kina Ltd, Seychelles 100.00% 100.00%
Malaysian Marine Services Ltd, 100.00% 100.00%
Universal Dredging & Reclamation Corporation Ltd, Mauritius 100.00% 100.00%
Jan De Nul Interamerica S.A., Uruguay 100.00% 100.00%
Jan De Nul Mascareignes Ltd , (formerly Envisan Ltd) Mauritius 100.00% 100.00%
Port Louis Maritime Company Ltd, Mauritius 100.00% 100.00%
Jan De Nul N.V., Belgium 99.07% 99.07%
Jan De Nul (U.K.) Ltd, United Kingdom 99.07% 99.07%
Eraerts Dragages et Entreprise S.A., Belgium 99.07% 99.07%
Cemaco N.V., Belgium 0.00% 99.07%
Jan De Nul (Australia) Pty Ltd, Australia 99.07% 99.07%
Jan De Nul (Philippines) Inc, Philippines 99.07% 99.07%
Mest- en Afvalverwerking N.V., Belgium 99.08% 99.08%
Sodraco International S.A.S., France 99.07% 99.07%
Terminal Eight Marine Works Ltd, China 99.53% 99.53%
Jan De Nul Italia S.p.A., Italy 99.08% 99.08%
Jan De Nul Saudi Arabia Co. Ltd., Saudi Arabia 99.07% 99.07%
Jan De Nul Maritime & Constructions Services Co Ltd, Lybia 99.07% 99.07%
Jan De Nul Nassbaggerei und Wasserbau GmbH, Germany 99.07% 99.07%
Jan De Nul Ghana Ltd., Ghana 99.07% 99.07%
Jan De Nul N.V. F.Z.E., Nigeria 99.07% 99.07%
Vidar Crewing Luxembourg S.A., Luxembourg 99.07% 99.07%
Vidar Shipowning Luxembourg S.A., Luxembourg 99.07% 99.07%
IR Peter Caset B.V.B.A., Belgium 0.00% 99.07%
Soetman C.V.B.A., Belgium 0.00% 99.07%
Soetaert Algemene Ondernemingen N.V., Belgium 99.07% 99.07%
Jan De Nul Constructlux S.A., Luxembourg 99.44% 99.11%
Travaux Maritimes Nador S.A.R.L., Morocco 99.07% 0.00%
Arenas Argentinas Del Parana S.A. , Argentina 99.54% 0.00%
Vasco S.A., Luxembourg 100.00% 100.00%
Dragalux S.A., Luxembourg 100.00% 100.00%
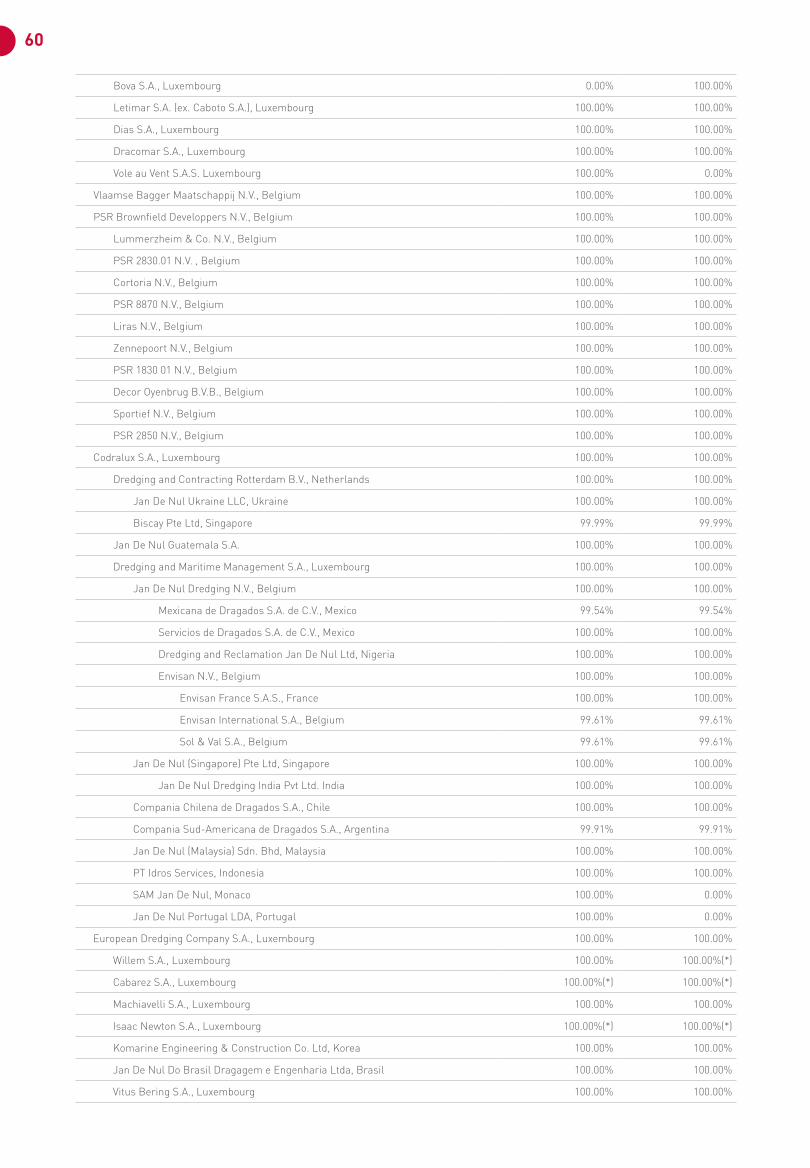
60
Bova S.A., Luxembourg 0.00% 100.00%
Letimar S.A. (ex. Caboto S.A.), Luxembourg 100.00% 100.00%
Dias S.A., Luxembourg 100.00% 100.00%
Dracomar S.A., Luxembourg 100.00% 100.00%
Vole au Vent S.A.S. Luxembourg 100.00% 0.00%
Vlaamse Bagger Maatschappij N.V., Belgium 100.00% 100.00%
PSR Brownfield Developpers N.V., Belgium 100.00% 100.00%
Lummerzheim & Co. N.V., Belgium 100.00% 100.00%
PSR 2830.01 N.V. , Belgium 100.00% 100.00%
Cortoria N.V., Belgium 100.00% 100.00%
PSR 8870 N.V., Belgium 100.00% 100.00%
Liras N.V., Belgium 100.00% 100.00%
Zennepoort N.V., Belgium 100.00% 100.00%
PSR 1830 01 N.V., Belgium 100.00% 100.00%
Decor Oyenbrug B.V.B., Belgium 100.00% 100.00%
Sportief N.V., Belgium 100.00% 100.00%
PSR 2850 N.V., Belgium 100.00% 100.00%
Codralux S.A., Luxembourg 100.00% 100.00%
Dredging and Contracting Rotterdam B.V., Netherlands 100.00% 100.00%
Jan De Nul Ukraine LLC, Ukraine 100.00% 100.00%
Biscay Pte Ltd, Singapore 99.99% 99.99%
Jan De Nul Guatemala S.A. 100.00% 100.00%
Dredging and Maritime Management S.A., Luxembourg 100.00% 100.00%
Jan De Nul Dredging N.V., Belgium 100.00% 100.00%
Mexicana de Dragados S.A. de C.V., Mexico 99.54% 99.54%
Servicios de Dragados S.A. de C.V., Mexico 100.00% 100.00%
Dredging and Reclamation Jan De Nul Ltd, Nigeria 100.00% 100.00%
Envisan N.V., Belgium 100.00% 100.00%
Envisan France S.A.S., France 100.00% 100.00%
Envisan International S.A., Belgium 99.61% 99.61%
Sol & Val S.A., Belgium 99.61% 99.61%
Jan De Nul (Singapore) Pte Ltd, Singapore 100.00% 100.00%
Jan De Nul Dredging India Pvt Ltd. India 100.00% 100.00%
Compania Chilena de Dragados S.A., Chile 100.00% 100.00%
Compania Sud-Americana de Dragados S.A., Argentina 99.91% 99.91%
Jan De Nul (Malaysia) Sdn. Bhd, Malaysia 100.00% 100.00%
PT Idros Services, Indonesia 100.00% 100.00%
SAM Jan De Nul, Monaco 100.00% 0.00%
Jan De Nul Portugal LDA, Portugal 100.00% 0.00%
European Dredging Company S.A., Luxembourg 100.00% 100.00%
Willem S.A., Luxembourg 100.00% 100.00%(*)
Cabarez S.A., Luxembourg 100.00%(*) 100.00%(*)
Machiavelli S.A., Luxembourg 100.00% 100.00%
Isaac Newton S.A., Luxembourg 100.00%(*) 100.00%(*)
Komarine Engineering & Construction Co. Ltd, Korea 100.00% 100.00%
Jan De Nul Do Brasil Dragagem e Engenharia Ltda, Brasil 100.00% 100.00%
Vitus Bering S.A., Luxembourg 100.00% 100.00%
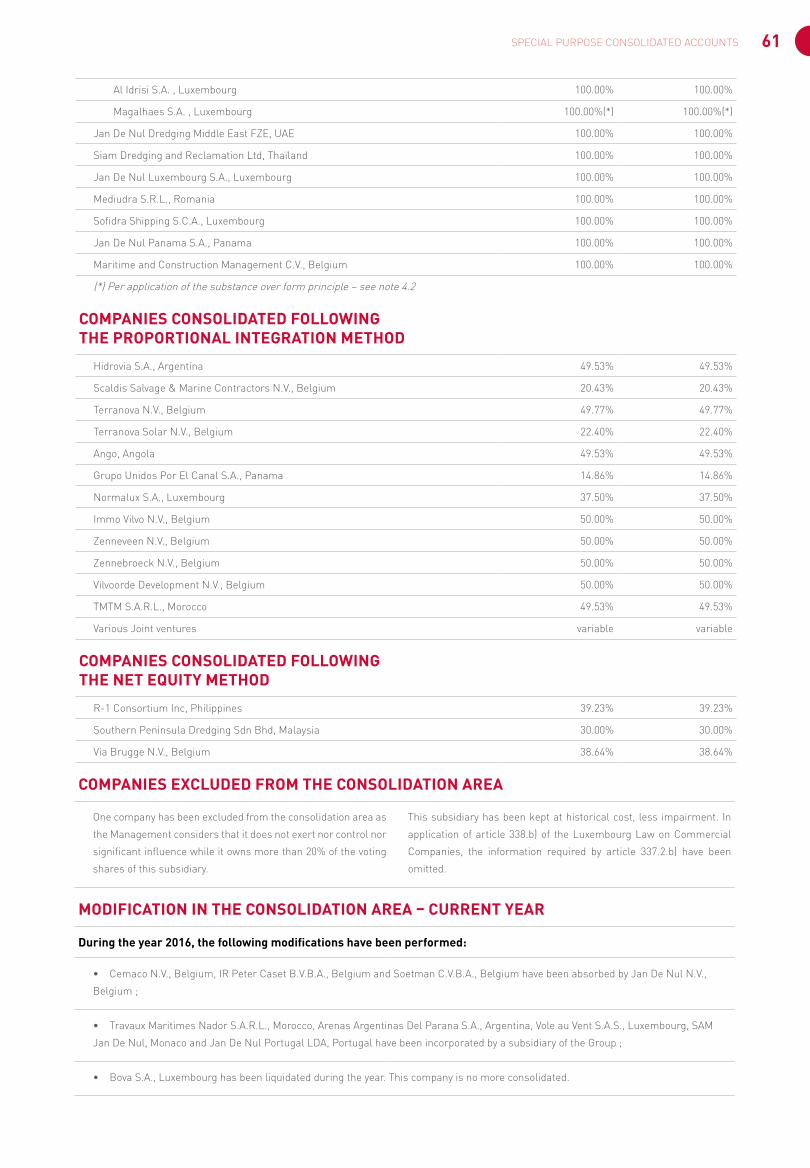
61SPECIAL PURPOSE CONSOLIDATED ACCOUNTS
COMPANIES EXCLUDED FROM THE CONSOLIDATION AREA
One company has been excluded from the consolidation area as
the Management considers that it does not exert nor control nor
significant influence while it owns more than 20% of the voting
shares of this subsidiary.
This subsidiary has been kept at historical cost, less impairment. In
application of article 338.b) of the Luxembourg Law on Commercial
Companies, the information required by article 337.2.b) have been
omitted.
MODIFICATION IN THE CONSOLIDATION AREA – CURRENT YEAR
During the year 2016, the following modifications have been performed:
• Cemaco N.V., Belgium, IR Peter Caset B.V.B.A., Belgium and Soetman C.V.B.A., Belgium have been absorbed by Jan De Nul N.V.,
Belgium ;
• Travaux Maritimes Nador S.A.R.L., Morocco, Arenas Argentinas Del Parana S.A., Argentina, Vole au Vent S.A.S., Luxembourg, SAM
Jan De Nul, Monaco and Jan De Nul Portugal LDA, Portugal have been incorporated by a subsidiary of the Group ;
• Bova S.A., Luxembourg has been liquidated during the year. This company is no more consolidated.
Al Idrisi S.A. , Luxembourg 100.00% 100.00%
Magalhaes S.A. , Luxembourg 100.00%(*) 100.00%(*)
Jan De Nul Dredging Middle East FZE, UAE 100.00% 100.00%
Siam Dredging and Reclamation Ltd, Thaïland 100.00% 100.00%
Jan De Nul Luxembourg S.A., Luxembourg 100.00% 100.00%
Mediudra S.R.L., Romania 100.00% 100.00%
Sofidra Shipping S.C.A., Luxembourg 100.00% 100.00%
Jan De Nul Panama S.A., Panama 100.00% 100.00%
Maritime and Construction Management C.V., Belgium 100.00% 100.00%
(*) Per application of the substance over form principle – see note 4.2
COMPANIES CONSOLIDATED FOLLOWING THE PROPORTIONAL INTEGRATION METHOD
Hidrovia S.A., Argentina 49.53% 49.53%
Scaldis Salvage & Marine Contractors N.V., Belgium 20.43% 20.43%
Terranova N.V., Belgium 49.77% 49.77%
Terranova Solar N.V., Belgium 22.40% 22.40%
Ango, Angola 49.53% 49.53%
Grupo Unidos Por El Canal S.A., Panama 14.86% 14.86%
Normalux S.A., Luxembourg 37.50% 37.50%
Immo Vilvo N.V., Belgium 50.00% 50.00%
Zenneveen N.V., Belgium 50.00% 50.00%
Zennebroeck N.V., Belgium 50.00% 50.00%
Vilvoorde Development N.V., Belgium 50.00% 50.00%
TMTM S.A.R.L., Morocco 49.53% 49.53%
Various Joint ventures variable variable
COMPANIES CONSOLIDATED FOLLOWING THE NET EQUITY METHOD
R-1 Consortium Inc, Philippines 39.23% 39.23%
Southern Peninsula Dredging Sdn Bhd, Malaysia 30.00% 30.00%
Via Brugge N.V., Belgium 38.64% 38.64%
62
MODIFICATION IN THE CONSOLIDATION AREA – PRIOR YEAR
During the year 2015, the following modifications have been performed:
• Dracomar S.A., Luxembourg, Jan De Nul Constructlux S.A., Luxembourg and Jan De Nul N.V. F.Z.E., Nigeria have been incorporated
by subsidiaries of the Group ;
• Jan De Nul Mozambique Ltda, Mozambique, Isaac Newton S.A., Luxembourg, Vidar Shipowning S.A., Luxembourg, Vidar Crewing
Luxembourg S.A., Luxembourg, IR Peter Caset B.V.B.A., Belgium, Soetman C.V.B.A., Belgium and Soetaert Algemeen Ondernemingen
N.V., Belgium, have been acquired from third parties ;
• Trivisa S.A, Luxembourg, Zheng S.A., Luxembourg, Astrolabe S.A., Luxembourg and Comarlux S.A., Luxembourg have been
liquidated. These companies are no more consolidated.
4. SIGNIFICANT ACCOUNTING POLICIES 4.1. Principles of consolidation
Basis of preparation of special purpose consolidated accounts
These special purpose consolidated accounts are pre-sented according to the framework set out and described hereafter. The special purpose consolidated accounts for the year under review are composed of a special purpose consolidated profit and loss account, special purpose consolidated balance sheet and notes to the special pur-pose consolidated accounts. The layout presentation of the special purpose consolidated accounts is as deter-mined by the Board of Directors.
Date of first consolidation
The Company acquired in 2000 Jan De Nul Mauritius Ltd and subsidiaries and in 2001 Jan De Nul N.V., Bel-gium and subsidiaries. In both operations, ships included under fixed assets were revaluated. The revaluation was based on a valuation report issued by an independent expert. No deferred taxes were accounted for on this reevaluation of assets. These operations restructured the initial Group Jan De Nul N.V. and subsidiairies, Bel-gium. Date of the first consolidation is fixed at the fiscal year starting January 1st, 2001. The revaluations have been fully depreciated as of December 31, 2016 and 2015.
Companies consolidated following the global integration method
Subsidiaries are in principle all entities (including spe-cial purpose entities) over which the Group has the power to govern the financial and operating policies generally accompanying a shareholding of more than one half of voting rights. The existence and effect of potential voting rights currently exercisable or convertible are considered when assessing whether the Group controls another entity.
Subsidiaries are consolidated using the global integra-tion method. Subsidiaries are consolidated from the date on which control is transferred to the Group. They are deconsolidated from the date control ceases.
Intercompany transactions, balances and unrealized gains on transactions between Group companies are eliminated. Accounting policies of subsidiaries have been exchanged where necessary to ensure consistency with the policies adopted by the Group.
Minority interests are that portion of the profit or loss and net assets of a subsidiary attributable to equity interests that are not owned, directly or indirectly through subsid-iaries, by the parent. Equity attributable to the interest of minority shareholder interests in subsidiaries is shown separately in the special purpose consolidated accounts.
Companies consolidated following the proportional inte-gration method
Joint ventures are those entities over whose activities the Group has joint control, established by contractual agreement. Joint Ventures and Jointly controlled entities are accounted for using the proportional consolidation method.
Unrealized gains on transactions between the Group and its Joint Ventures and jointly controlled entities are eliminated to the extent of the Group’s interest in these entities. Unrealized losses are also eliminated unless the transaction provides evidence of an impairment of the asset transferred. Accounting policies of Joint Ven-tures and Jointly controlled entities have been changed where necessary to ensure consistency with the policies adopted by the Group.
Companies consolidated following the net equity method
Associates are all entities over which the Group has significant influence but not control, gener-ally accompanying a shareholding of between 20% and 50% of the voting rights. Investments in asso-ciates are accounted for using the equity method of accounting and are initially recognized at cost. The Group’s share of its associates’ post acquisition profits is recognized in the special purpose consolidated
63SPECIAL PURPOSE CONSOLIDATED ACCOUNTS
profit and loss account under the caption Share of profit or loss of undertakings accounted for under the equity method. The cumulative post-acquisition movements are adjusted against the carrying amount of the investment. When the Group’s share of losses in an associate equals or exceeds its interest in the associate, the Group recognizes further losses under the caption Other provisions.
Unrealized gains on transactions between the Group and its associates are eliminated to the extent of the Group’s interest in the associates. Unrealized losses are also eliminated unless the transaction provides evidence of an impairment of the asset transferred. Accounting pol-icies of associates have been changed where necessary to ensure consistency with the policies adopted by the Group.
4.2. Accounting methods
Foreign currencies
• The Company’s accounts are kept in Euros (EUR) and the special purpose consolidated accounts are expressed in this currency. Transactions in any currency other than the EUR are translated at exchange rates fixed monthly by the Group. At balance sheet date, the translation is done based on the following methods:
- Banks are translated at exchange rates prevailing at the balance sheet date ;
- For Debtors and Creditors, realized exchange gains and losses are recorded in the profit and loss account as well as the unrealized exchange losses; unrealized exchange gains are booked in a balance sheet account presented under Other creditors;
- Other accounts are translated at the historical exchange rate.
• The annual accounts of the subsidiaries kept in another currency than EUR are translated – in order to include those in the special purpose consolidated accounts - as follows:
- Assets and liabilities other than Capital and reserves are translated at the exchange rates prevailing at the balance sheet date ;
- Capital and reserves are translated at rates prevailing at the first consolidation or at historical rates ;
- Income and charges are translated at the average exchange rate of the year.
Gains and losses resulting from the transla-tion of capital, reserves, income and charges into EUR are accumulated in a separate account under shareholders’ equity called Translation differences. Exchange gains and exchange losses resulting from the elimination of intercompany debtors and creditors accounts are recorded in the Other interest and similar expenses or Other interest and similar income captions respectively.
Acquisition differences
Up to 2012, positive and negative acquisition differences related to the acquisition of subsidiaries are recorded under Other reserves in the Capital and reserves. Start-ing from 2013, positive acquisition differences related to the acquisition of subsidiaries are allocated to certain assets and/or liabilities, and for the unallocated portion to Goodwill (within the Intangible assets caption); negative acquisition differences are recorded under Other reserves in the Capital and reserves caption. The Goodwill is depre-ciated over a 5 years period.
Formation expenses
Formation expenses are entirely depreciated during the year of their acquisition.
Intangible and tangible assets
Vessels that were brought in during the first year of con-solidation (2001) are recognized at the revaluated acqui-sition cost, while ships acquired since then are recog-nized at acquisition cost.
Intangible and other tangible assets are recognized at acquisition cost. Replacement spare parts for vessels, which are constantly being replaced and whose overall value is of secondary importance to the Group are shown under Plant and machinery at a fixed quantity and value, as the quantity, value and composition thereof do not vary materially.
Vessels are depreciated on a linear or degressive method over their expected lifetime or a period of 12 years to 20 years, whichever is the shortest. Intangible and other tangible fixed assets are depreciated using a linear or degressive method over their expected lifetime. Land and assets under construction are not depreciated.
Where the Group considers that an intangible or tangi-ble asset has suffered a durable depreciation in value, an additional write-down is recorded in order to reflect this loss. These value adjustments are not continued if the reasons for which the value adjustments were made have ceased to apply.
Financial assets
Financial assets represent participations in non-con-solidated companies, guarantees and long-term loans. Shares in participating interests are recognized at pur-chase price. Guarantees and long-term loans are recog-nized at nominal value including the expenses incidental thereto.
In case of a durable depreciation in value according to the opinion of the Board of Directors, value adjustments are made in respect of fixed assets, so that they are valued at the lower figure to be attributed to them at the balance sheet date. These value adjustments are not continued if the reasons for which the value adjustments were made have ceased to apply.
64
Stocks
Stocks represent raw materials, heavy material held for resale, work in progress, finished goods and merchan-dise.
Stocks of Raw materials and consumables are valued at the lower of purchase price calculated on the basis of the “first in, first out” (FIFO) method or market value. A value adjustment is recorded where the economic value is below the purchase price. These value adjustments are not continued if the reasons for which the value adjust-ments were made have ceased to apply.
Heavy material held for resale represent on-shore heavy equipment and steel pipes that are not allocated to a par-ticular site at year end and are available for sale, within or out of the Group. Heavy material held for resale is included under the Raw materials and consumables caption. Heavy material held for resale is recognized at the net book value valid at the date of transfer from tangible assets (or stock) to stock. A value adjustment is recorded where the economic value is below the purchase price. These value adjustments are not continued if the reasons for which the value adjustments were made have ceased to apply.
Finished goods and goods for resale represent mainly brownfields pieces of land acquired and the related cost for their rehabilitation. The gross book value includes the initial acquisition price paid and the costs directly attrib-utable to the rehabilitation of the land. A value adjust-ment is recorded where the economic value is below the net book value. These value adjustments are not contin-ued if the reasons for which the value adjustments were made have ceased to apply.
Work and contracts in progress is valued at the lower of production cost including the purchase price of the raw materials and consumables, the costs directly attributa-ble to the project in question and a proportion of the costs indirectly attributable to the product in question, and market value. A value adjustment is recorded where the expected realization value is below the production cost. These value adjustments are not continued if the reasons for which the value adjustments were made have ceased to apply.
Debtors
Debtors are recognized at their nominal value. They are subject to value adjustments where their recovery is compromised. These value adjustments are not contin-ued if the reasons for which the value adjustments were made have ceased to apply.
Transferable securities
Transferable securities are valued at the lower of purchase cost, including expenses incidental thereto and calcu-lated on the basis of weighted average prices method, expressed in the currency in which the annual accounts are prepared and market value. A value adjustment is recorded where the market value is lower than the pur-
chase cost. These value adjustments are not continued if the reasons for which the value adjustments were made have ceased to apply.
The market value corresponds to:
• the last available quote on the valuation day for trans-ferable securities listed on a stock exchange or dealt in on another regulated market;
• the probable realisation value estimated with care and in good faith by the Board of Directors
• for transferable securities not listed on a stock exchange or not dealt in on another regulated market and for transferable securities listed on a stock exchange or dealt in on another regulated market where the latest quote is not representative.
Prepayments
This asset item includes expenditure incurred during the financial year but relating to a subsequent financial year.
Provisions
Provisions are intended to cover losses or debts the nature of which is clearly defined and which, at the date of the balance sheet are either likely to be incurred or certain to be incurred but uncertain as to their amount or as to the date on which they will arise.
Deferred taxes
Deferred taxes are recognized for temporary differences due to consolidation retreatments that will result in deductible or taxable amounts or from tax losses carried forward. Deferred tax assets are fully impaired except if they can be offset against statutory tax accruals and/or deferred tax liabilities.
Debts
Debts are valued at their nominal value. See also Note 4.3.
Deferred income
This liability item includes income received during the financial year or previous years but relating to a sub-sequent financial year. Among these, Group’s techni-cal contribution to some vessels invoiced by the Group to the shipyard in charge of the ship’s construction are retreated from the revenues to the deferred income and amortized at the same rate as the related tangible asset.
Deferred income also includes profit on intercompany disposals on Heavy material held for resale which can-not be individually identified. These positions are recog-nized in revenues over a 2.5 years period. This method is intended to deal appropriately with profits on intercom-pany disposals of fixed assets or inventory items that are whether fungible whether difficult to retreat individually over their remaining useful lifetime (among others the stock of pipes).
65SPECIAL PURPOSE CONSOLIDATED ACCOUNTS
Net turnover
The Net turnover comprises the amounts derived from the sale of products and the provision of services falling within the Group’s ordinary activities, after deductions of sales rebates and of value added tax and other taxes directly linked to the turnover.
Derivatives
Unrealized losses and gains on derivatives subscribed for hedging of assets or liabilities that are present in the balance sheet at year end (example: Forex deals hedging trade debtors in foreign currency that are booked at year end and will be collected on next year) are recognized in the profit and loss account concommitently with the revenue/loss recognition of the hedged asset or liability. Unrealized losses and gains on derivatives subscribed for hedging of transactions occurring in the future and – as such - not present in the balance sheet at year end (example: Energy swaps in relation with next year’s fuel purchases – Forex deals hedging trade debtors not yet booked at year end but expected to be recognized on next year) are not accrued but are mentioned in off balance sheet commitments.
Unrealized losses on derivatives not subscribed for hedg-ing purpose are accrued for and recognized in profit and loss at year end.
Realized losses and gains on derivatives are recognized in profit and loss account during the year of their reali-zation.
Substance over form
The presentation of the amounts recorded on the special purpose consolidated balance sheet and special purpose consolidated profit and loss account should refer to the substance of the operation rather than its legal form.
This principle has been applied to the consolidation method applied to certain subsidiaries which are - based on the voting rights - controlled by a third party but whose effective control is exercised by the Group.
This principle has been applied to some receivables, term deposits and liabilities in relation with financing struc-tures of some of the fleet’s vessels to reflect the actual financial position and delayed income recognition gener-ated by these structures. In 2015, per the application of this principle, the Other receivables had been decreased with an amount of 179,174,965.94 EUR, the Cash at bank had been decreased with an amount of 99,286,454.65 EUR, the Amounts owed to credit institutions had been decreased with an amount of 284,423,817.87 EUR and a Deferred income position created for an amount of 30,241,515.59 EUR. The Deferred income generated by this retreatment represented the income from interests differential to be recognized as a financial income over time. In 2016, this financing structure has been termi-nated; as a consequence, no retreatment has been per-formed in the 2016 special purpose balance sheet.
4.3. Application of article 319 (5)
For the special purpose consolidated accounts of the year ended December 31, 2016, the Group applied the prescriptions of article 319 (5) of the Law for the pres-entation of certain transactions described hereunder. Per this rule, in the extraordinary situation where the strict application of the accounting principles of the Law would not provide a true and fair view of its financial position and of the results of its operations, the Group can dero-gate to these accounting principles in order to restore a proper presentation.
In application of the article 332 (1) of the Law, article 63 (1) of the amended Luxembourg law on annual accounts dated December 19, 2002 and the accounting methods described in Note 4.2, the debts should be presented at their nominal value. However, the captions Trade creditors and Other creditors include debts due to Group’s partners in the GUPC project that are repayable only if sufficient claims will be awarded to the Group and its partners as part of the arbitration process currently in course (see Note 8). As these special purpose consolidated accounts have been consistently prepared under the assumption that no claims will be awarded to GUPC and its share-holders (the related provisions for risks were based on the same assumption during previous years), these debts have not been valued using their nominal value but – instead – using the future reimbursement value which is actually nil under the same assumption. For the same reason, the Group has fully impaired its related receiv-ables shown under Financial assets. Would the claims awarded in the future be above the threshold where amounts in relation with these debts would have to be reimbursed to partners, an equivalent amount would be received by the Group in relation with its fully impaired receivable so that the future profit and loss impact of these operations would be neutral.
The impact of the above described modifications (part of the 2016 adjustments related to delivery of GUPC project) on the special purpose consolidated accounts of the year ended December 31, 2016 are as follows:
• Debts shown under the captions Trade creditors becoming due and payable within one year and Other creditors becoming due and payable after more than one year amounting respectively to 10,473,748.19 EUR and 78,999,625.86 EUR have been booked as an income in the profit and loss for an amount of 85,493,829.30 EUR through the caption Other interest receivable and similar income – other interest and similar income;
• The difference between amounts booked from the balance sheet and those booked to the profit and loss are due to translation differences; the impact of the whole operation on the Profit for the financial year and on the Translation differences amounts to 85,493,829.30 EUR and 3,979,544.75 EUR respectively for a global positive net impact on the Group’s net equity of 89,473,374.05 EUR.
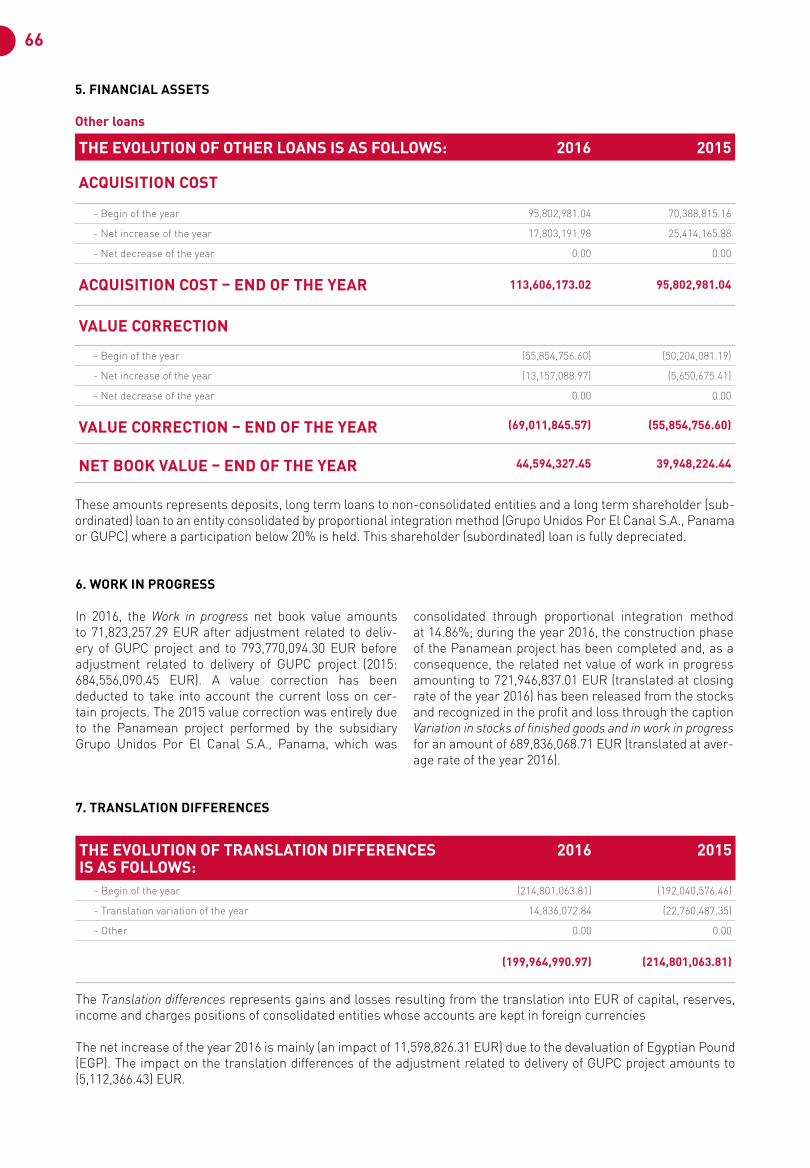
66
5. FINANCIAL ASSETS
Other loans
THE EVOLUTION OF OTHER LOANS IS AS FOLLOWS: 2016 2015
ACQUISITION COST
- Begin of the year 95,802,981.04 70,388,815.16
- Net increase of the year 17,803,191.98 25,414,165.88
- Net decrease of the year 0.00 0.00
ACQUISITION COST – END OF THE YEAR 113,606,173.02 95,802,981.04
VALUE CORRECTION
- Begin of the year (55,854,756.60) (50,204,081.19)
- Net increase of the year (13,157,088.97) (5,650,675.41)
- Net decrease of the year 0.00 0.00
VALUE CORRECTION – END OF THE YEAR (69,011,845.57) (55,854,756.60)
NET BOOK VALUE – END OF THE YEAR 44,594,327.45 39,948,224.44
These amounts represents deposits, long term loans to non-consolidated entities and a long term shareholder (sub-ordinated) loan to an entity consolidated by proportional integration method (Grupo Unidos Por El Canal S.A., Panama or GUPC) where a participation below 20% is held. This shareholder (subordinated) loan is fully depreciated.
7. TRANSLATION DIFFERENCES
THE EVOLUTION OF TRANSLATION DIFFERENCESIS AS FOLLOWS:
2016 2015
- Begin of the year (214,801,063.81) (192,040,576.46)
- Translation variation of the year 14,836,072.84 (22,760,487.35)
- Other 0.00 0.00
(199,964,990.97) (214,801,063.81)
The Translation differences represents gains and losses resulting from the translation into EUR of capital, reserves, income and charges positions of consolidated entities whose accounts are kept in foreign currencies
The net increase of the year 2016 is mainly (an impact of 11,598,826.31 EUR) due to the devaluation of Egyptian Pound (EGP). The impact on the translation differences of the adjustment related to delivery of GUPC project amounts to (5,112,366.43) EUR.
6. WORK IN PROGRESS
In 2016, the Work in progress net book value amounts to 71,823,257.29 EUR after adjustment related to deliv-ery of GUPC project and to 793,770,094.30 EUR before adjustment related to delivery of GUPC project (2015: 684,556,090.45 EUR). A value correction has been deducted to take into account the current loss on cer-tain projects. The 2015 value correction was entirely due to the Panamean project performed by the subsidiary Grupo Unidos Por El Canal S.A., Panama, which was
consolidated through proportional integration method at 14.86%; during the year 2016, the construction phase of the Panamean project has been completed and, as a consequence, the related net value of work in progress amounting to 721,946,837.01 EUR (translated at closing rate of the year 2016) has been released from the stocks and recognized in the profit and loss through the caption Variation in stocks of finished goods and in work in progress for an amount of 689,836,068.71 EUR (translated at aver-age rate of the year 2016).
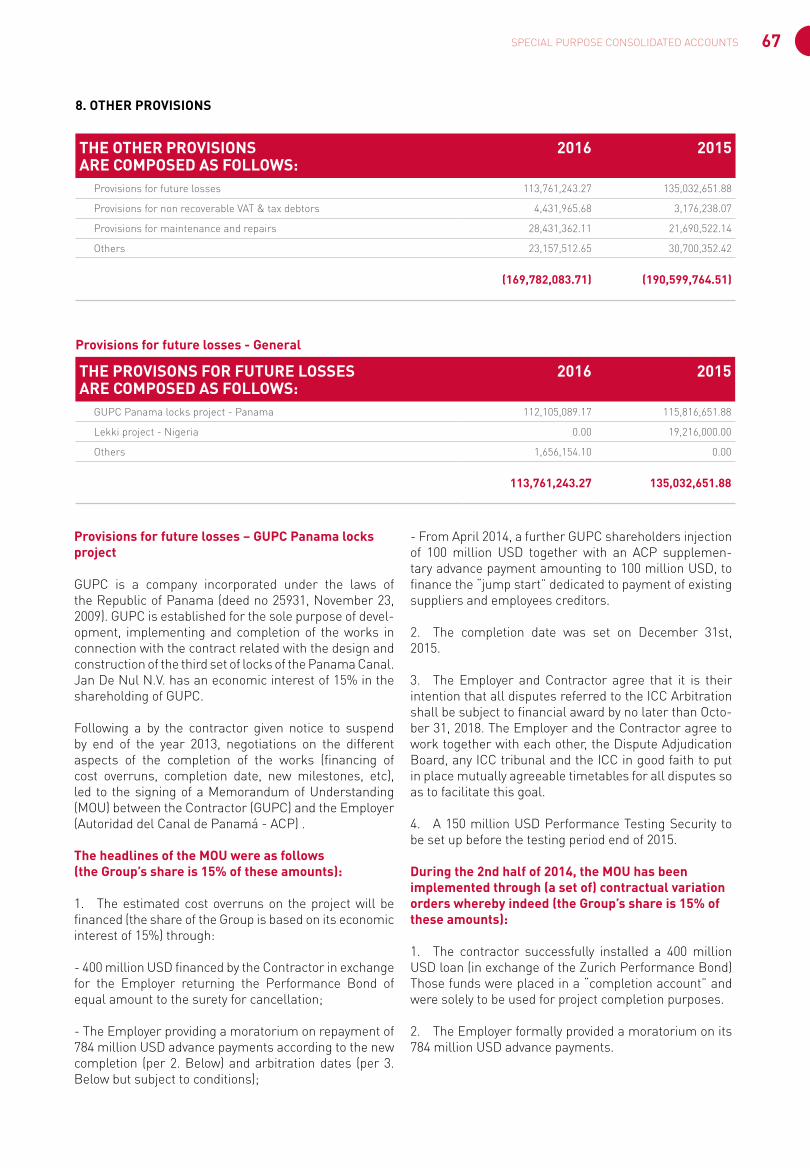
67SPECIAL PURPOSE CONSOLIDATED ACCOUNTS
8. OTHER PROVISIONS
THE OTHER PROVISIONS ARE COMPOSED AS FOLLOWS:
2016 2015
Provisions for future losses 113,761,243.27 135,032,651.88
Provisions for non recoverable VAT & tax debtors 4,431,965.68 3,176,238.07
Provisions for maintenance and repairs 28,431,362.11 21,690,522.14
Others 23,157,512.65 30,700,352.42
(169,782,083.71) (190,599,764.51)
Provisions for future losses - General
THE PROVISONS FOR FUTURE LOSSES ARE COMPOSED AS FOLLOWS:
2016 2015
GUPC Panama locks project - Panama 112,105,089.17 115,816,651.88
Lekki project - Nigeria 0.00 19,216,000.00
Others 1,656,154.10 0.00
113,761,243.27 135,032,651.88
Provisions for future losses – GUPC Panama locks project GUPC is a company incorporated under the laws of the Republic of Panama (deed no 25931, November 23, 2009). GUPC is established for the sole purpose of devel-opment, implementing and completion of the works in connection with the contract related with the design and construction of the third set of locks of the Panama Canal. Jan De Nul N.V. has an economic interest of 15% in the shareholding of GUPC.
Following a by the contractor given notice to suspend by end of the year 2013, negotiations on the different aspects of the completion of the works (financing of cost overruns, completion date, new milestones, etc), led to the signing of a Memorandum of Understanding (MOU) between the Contractor (GUPC) and the Employer (Autoridad del Canal de Panamá - ACP) .
The headlines of the MOU were as follows (the Group’s share is 15% of these amounts):
1. The estimated cost overruns on the project will be financed (the share of the Group is based on its economic interest of 15%) through:
- 400 million USD financed by the Contractor in exchange for the Employer returning the Performance Bond of equal amount to the surety for cancellation;
- The Employer providing a moratorium on repayment of 784 million USD advance payments according to the new completion (per 2. Below) and arbitration dates (per 3. Below but subject to conditions);
- From April 2014, a further GUPC shareholders injection of 100 million USD together with an ACP supplemen-tary advance payment amounting to 100 million USD, to finance the “jump start” dedicated to payment of existing suppliers and employees creditors.
2. The completion date was set on December 31st, 2015.
3. The Employer and Contractor agree that it is their intention that all disputes referred to the ICC Arbitration shall be subject to financial award by no later than Octo-ber 31, 2018. The Employer and the Contractor agree to work together with each other, the Dispute Adjudication Board, any ICC tribunal and the ICC in good faith to put in place mutually agreeable timetables for all disputes so as to facilitate this goal.
4. A 150 million USD Performance Testing Security to be set up before the testing period end of 2015.
During the 2nd half of 2014, the MOU has been implemented through (a set of) contractual variation orders whereby indeed (the Group’s share is 15% of these amounts):
1. The contractor successfully installed a 400 million USD loan (in exchange of the Zurich Performance Bond)Those funds were placed in a “completion account” and were solely to be used for project completion purposes.
2. The Employer formally provided a moratorium on its 784 million USD advance payments.
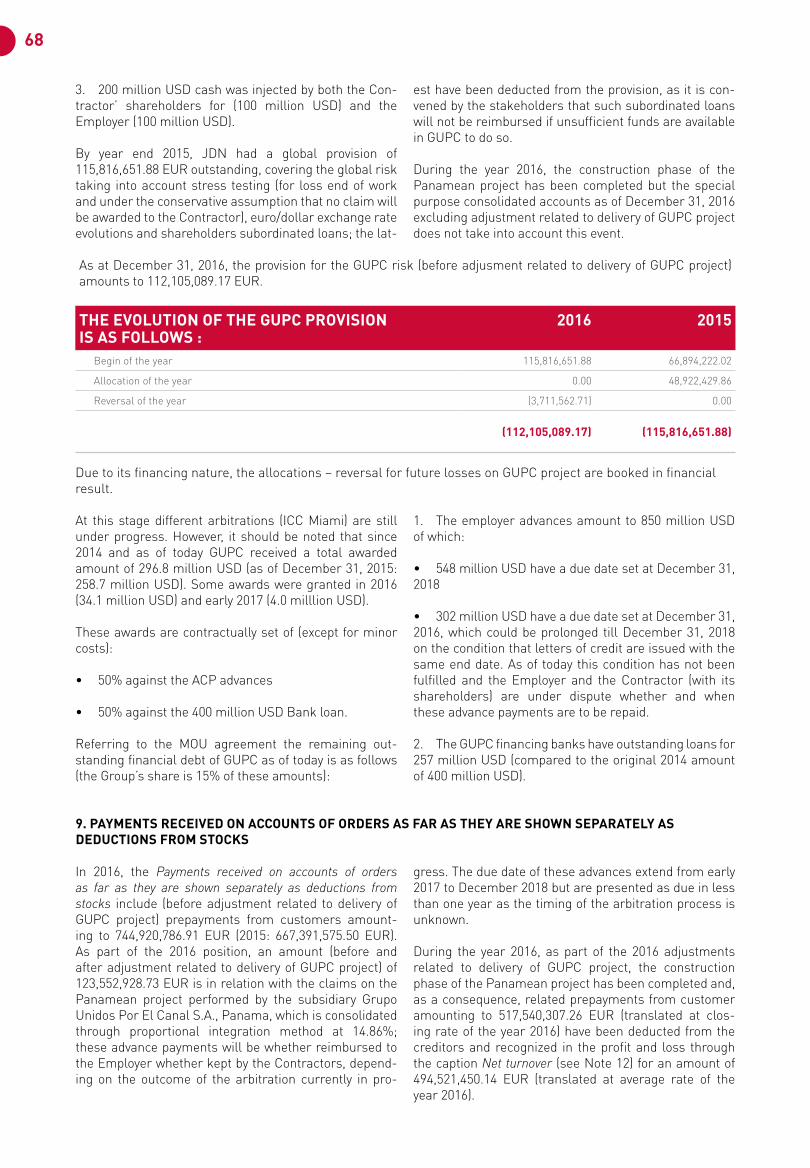
68
3. 200 million USD cash was injected by both the Con-tractor’ shareholders for (100 million USD) and the Employer (100 million USD).
By year end 2015, JDN had a global provision of 115,816,651.88 EUR outstanding, covering the global risk taking into account stress testing (for loss end of work and under the conservative assumption that no claim will be awarded to the Contractor), euro/dollar exchange rate evolutions and shareholders subordinated loans; the lat-
est have been deducted from the provision, as it is con-vened by the stakeholders that such subordinated loans will not be reimbursed if unsufficient funds are available in GUPC to do so.
During the year 2016, the construction phase of the Panamean project has been completed but the special purpose consolidated accounts as of December 31, 2016 excluding adjustment related to delivery of GUPC project does not take into account this event.
As at December 31, 2016, the provision for the GUPC risk (before adjusment related to delivery of GUPC project) amounts to 112,105,089.17 EUR.
THE EVOLUTION OF THE GUPC PROVISION IS AS FOLLOWS :
2016 2015
Begin of the year 115,816,651.88 66,894,222.02
Allocation of the year 0.00 48,922,429.86
Reversal of the year (3,711,562.71) 0.00
(112,105,089.17) (115,816,651.88)
Due to its financing nature, the allocations – reversal for future losses on GUPC project are booked in financial result.
At this stage different arbitrations (ICC Miami) are still under progress. However, it should be noted that since 2014 and as of today GUPC received a total awarded amount of 296.8 million USD (as of December 31, 2015: 258.7 million USD). Some awards were granted in 2016 (34.1 million USD) and early 2017 (4.0 milllion USD).
These awards are contractually set of (except for minor costs):
• 50% against the ACP advances
• 50% against the 400 million USD Bank loan.
Referring to the MOU agreement the remaining out-standing financial debt of GUPC as of today is as follows (the Group’s share is 15% of these amounts):
1. The employer advances amount to 850 million USD of which:
• 548 million USD have a due date set at December 31, 2018
• 302 million USD have a due date set at December 31, 2016, which could be prolonged till December 31, 2018 on the condition that letters of credit are issued with the same end date. As of today this condition has not been fulfilled and the Employer and the Contractor (with its shareholders) are under dispute whether and when these advance payments are to be repaid.
2. The GUPC financing banks have outstanding loans for 257 million USD (compared to the original 2014 amount of 400 million USD).
In 2016, the Payments received on accounts of orders as far as they are shown separately as deductions from stocks include (before adjustment related to delivery of GUPC project) prepayments from customers amount-ing to 744,920,786.91 EUR (2015: 667,391,575.50 EUR). As part of the 2016 position, an amount (before and after adjustment related to delivery of GUPC project) of 123,552,928.73 EUR is in relation with the claims on the Panamean project performed by the subsidiary Grupo Unidos Por El Canal S.A., Panama, which is consolidated through proportional integration method at 14.86%; these advance payments will be whether reimbursed to the Employer whether kept by the Contractors, depend-ing on the outcome of the arbitration currently in pro-
gress. The due date of these advances extend from early 2017 to December 2018 but are presented as due in less than one year as the timing of the arbitration process is unknown.
During the year 2016, as part of the 2016 adjustments related to delivery of GUPC project, the construction phase of the Panamean project has been completed and, as a consequence, related prepayments from customer amounting to 517,540,307.26 EUR (translated at clos-ing rate of the year 2016) have been deducted from the creditors and recognized in the profit and loss through the caption Net turnover (see Note 12) for an amount of 494,521,450.14 EUR (translated at average rate of the year 2016).
9. PAYMENTS RECEIVED ON ACCOUNTS OF ORDERS AS FAR AS THEY ARE SHOWN SEPARATELY AS DEDUCTIONS FROM STOCKS
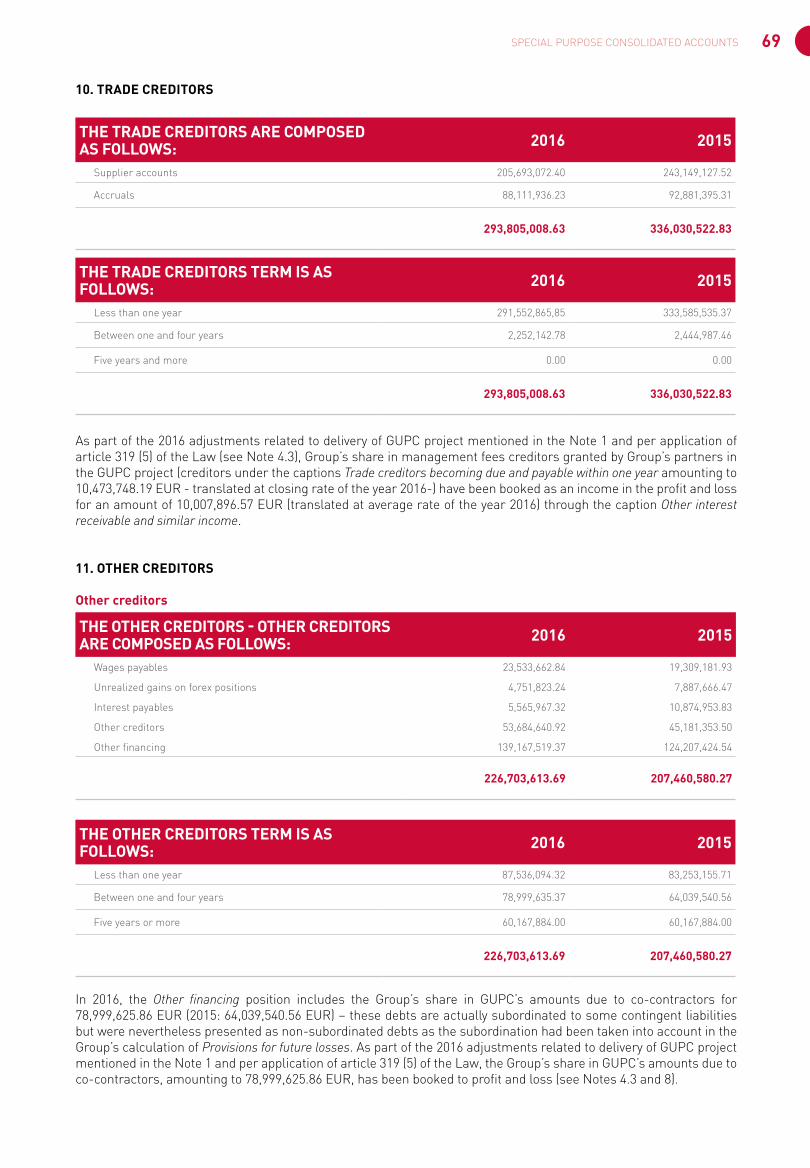
69SPECIAL PURPOSE CONSOLIDATED ACCOUNTS
10. TRADE CREDITORS
THE TRADE CREDITORS ARE COMPOSED AS FOLLOWS: 2016 2015
Supplier accounts 205,693,072.40 243,149,127.52
Accruals 88,111,936.23 92,881,395.31
293,805,008.63 336,030,522.83
THE TRADE CREDITORS TERM IS AS FOLLOWS: 2016 2015
Less than one year 291,552,865,85 333,585,535.37
Between one and four years 2,252,142.78 2,444,987.46
Five years and more 0.00 0.00
293,805,008.63 336,030,522.83
As part of the 2016 adjustments related to delivery of GUPC project mentioned in the Note 1 and per application of article 319 (5) of the Law (see Note 4.3), Group’s share in management fees creditors granted by Group’s partners in the GUPC project (creditors under the captions Trade creditors becoming due and payable within one year amounting to 10,473,748.19 EUR - translated at closing rate of the year 2016-) have been booked as an income in the profit and loss for an amount of 10,007,896.57 EUR (translated at average rate of the year 2016) through the caption Other interest receivable and similar income.
11. OTHER CREDITORS Other creditors
THE OTHER CREDITORS - OTHER CREDITORS ARE COMPOSED AS FOLLOWS: 2016 2015
Wages payables 23,533,662.84 19,309,181.93
Unrealized gains on forex positions 4,751,823.24 7,887,666.47
Interest payables 5,565,967.32 10,874,953.83
Other creditors 53,684,640.92 45,181,353.50
Other financing 139,167,519.37 124,207,424.54
226,703,613.69 207,460,580.27
THE OTHER CREDITORS TERM IS AS FOLLOWS: 2016 2015
Less than one year 87,536,094.32 83,253,155.71
Between one and four years 78,999,635.37 64,039,540.56
Five years or more 60,167,884.00 60,167,884.00
226,703,613.69 207,460,580.27
In 2016, the Other financing position includes the Group’s share in GUPC’s amounts due to co-contractors for 78,999,625.86 EUR (2015: 64,039,540.56 EUR) – these debts are actually subordinated to some contingent liabilities but were nevertheless presented as non-subordinated debts as the subordination had been taken into account in the Group’s calculation of Provisions for future losses. As part of the 2016 adjustments related to delivery of GUPC project mentioned in the Note 1 and per application of article 319 (5) of the Law, the Group’s share in GUPC’s amounts due to co-contractors, amounting to 78,999,625.86 EUR, has been booked to profit and loss (see Notes 4.3 and 8).
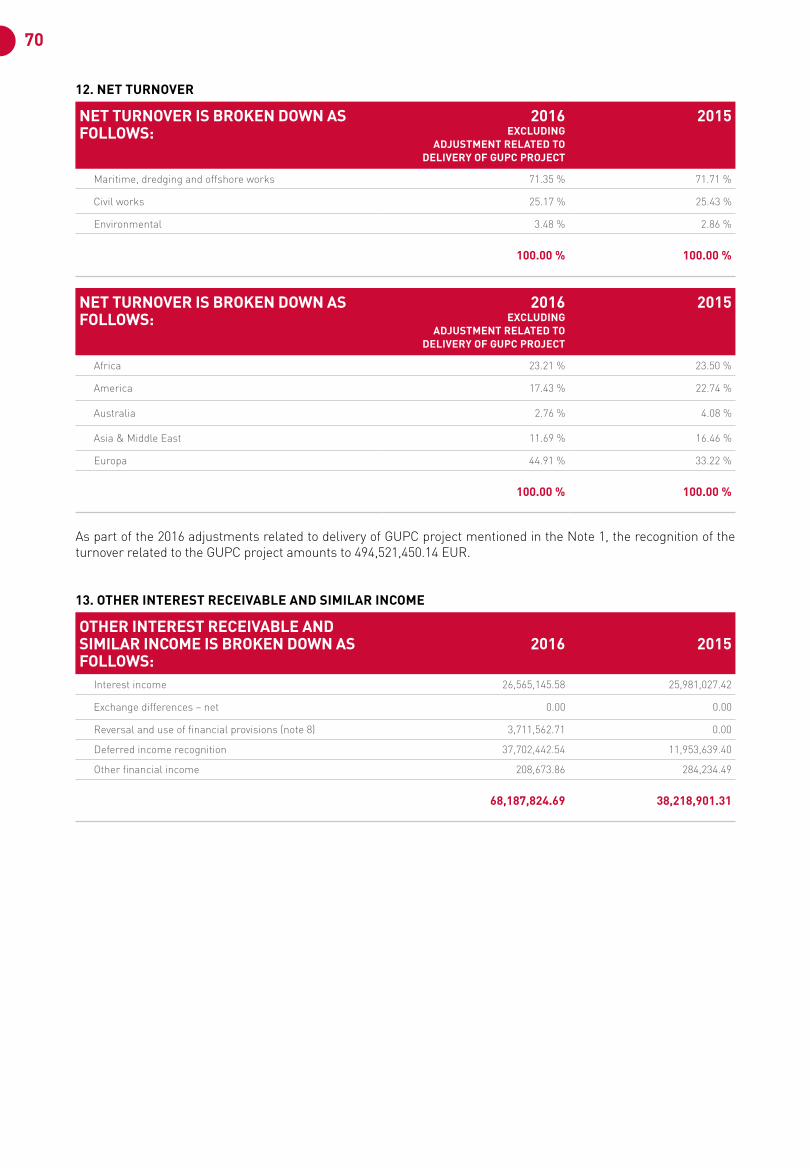
70
12. NET TURNOVER
NET TURNOVER IS BROKEN DOWN AS FOLLOWS:
2016EXCLUDING
ADJUSTMENT RELATED TO DELIVERY OF GUPC PROJECT
2015
Maritime, dredging and offshore works 71.35 % 71.71 %
Civil works 25.17 % 25.43 %
Environmental 3.48 % 2.86 %
100.00 % 100.00 %
NET TURNOVER IS BROKEN DOWN AS FOLLOWS:
2016EXCLUDING
ADJUSTMENT RELATED TO DELIVERY OF GUPC PROJECT
2015
Africa 23.21 % 23.50 %
America 17.43 % 22.74 %
Australia 2.76 % 4.08 %
Asia & Middle East 11.69 % 16.46 %
Europa 44.91 % 33.22 %
100.00 % 100.00 %
As part of the 2016 adjustments related to delivery of GUPC project mentioned in the Note 1, the recognition of the turnover related to the GUPC project amounts to 494,521,450.14 EUR.
13. OTHER INTEREST RECEIVABLE AND SIMILAR INCOME
OTHER INTEREST RECEIVABLE AND SIMILAR INCOME IS BROKEN DOWN AS FOLLOWS:
2016 2015
Interest income 26,565,145.58 25,981,027.42
Exchange differences – net 0.00 0.00
Reversal and use of financial provisions (note 8) 3,711,562.71 0.00
Deferred income recognition 37,702,442.54 11,953,639.40
Other financial income 208,673.86 284,234.49
68,187,824.69 38,218,901.31
72
COLOPHONRESPONSIBLE EDITORJan De Nul Group [Sofidra SA]Luxembourginfo@jandenulgroup.comwww.jandenul.comannualreport.jandenul.com
SOCIAL ADDRESS34-36, Parc d’Activités Capellen, 8308 Capellen, Luxembourg LAY-OUTCantilis | p/a De Punt | Kerkstraat 108, 9050 Ghent, Belgium [email protected]
BOARD OF DIRECTORSJ.P.J. De Nul, Dirk De Nul, Julie De Nul, Géry Vandewalle Jeannot Krecké, Paul Lievens, Johan Van Boxstael, David Lutty
PHOTOGRAPHY© Jan De Nul Group | Sofie Beirens (cover, p. 13)Menno Mulder (p. 2-3) | Flying Focus (p. 14) | © AWV (p. 9)
For more information on this financial report, please contact:Paul Lievens, Financial Department [email protected]
Dit rapport is ook beschikbaar in het Nederlands.Ce rapport est également disponible en français.Este informe también está disponible en español.