Embed Size (px)
Citation preview
FEATURE ARTICLEJeanna Van Rensselar / Contributing Editor
Tribological Bearing Testing
3 8 • A P R I L 2 0 1 4 T R I B O L O G Y & L U B R I C A T I O N T E C H N O L O G Y W W W . S T L E . O R G
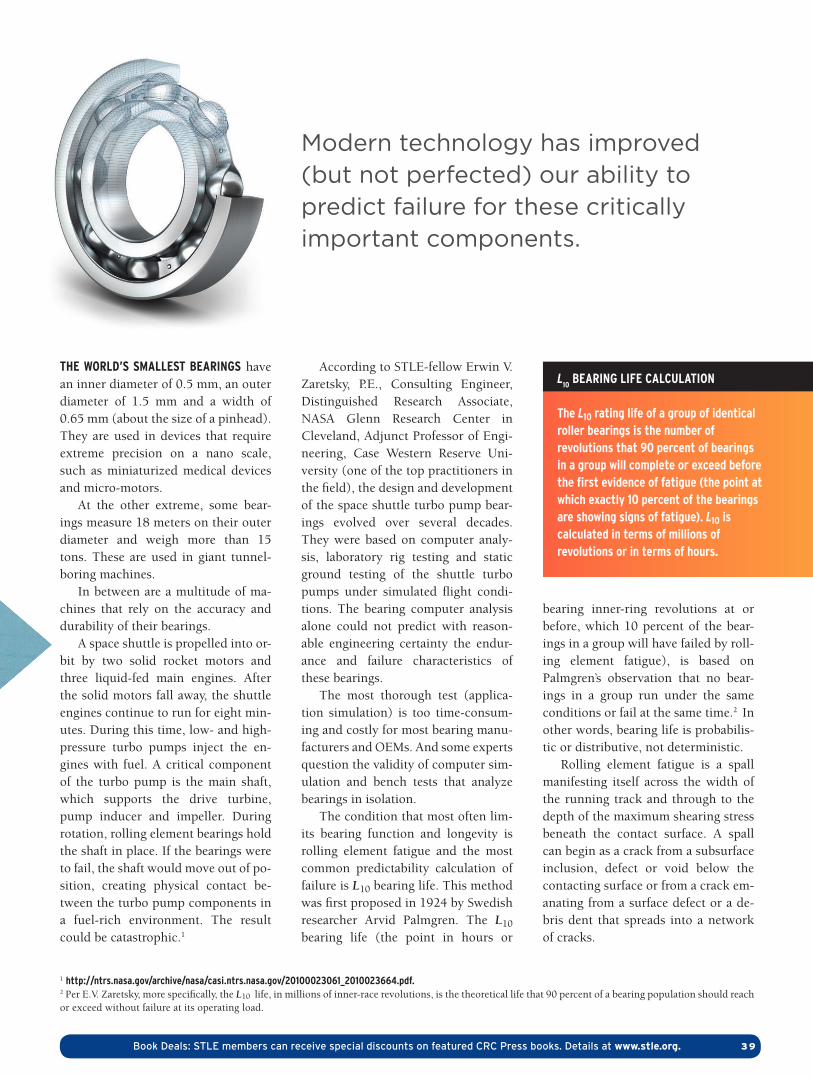
THE WORLD’S SMALLEST BEARINGS have an inner diameter of 0.5 mm, an outer diameter of 1.5 mm and a width of 0.65 mm (about the size of a pinhead). They are used in devices that require extreme precision on a nano scale, such as miniaturized medical devices and micro-motors.
At the other extreme, some bear-ings measure 18 meters on their outer diameter and weigh more than 15 tons. These are used in giant tunnel-boring machines.
In between are a multitude of ma-chines that rely on the accuracy and durability of their bearings.
A space shuttle is propelled into or-bit by two solid rocket motors and three liquid-fed main engines. After the solid motors fall away, the shuttle engines continue to run for eight min-utes. During this time, low- and high-pressure turbo pumps inject the en-gines with fuel. A critical component of the turbo pump is the main shaft, which supports the drive turbine, pump inducer and impeller. During rotation, rolling element bearings hold the shaft in place. If the bearings were to fail, the shaft would move out of po-sition, creating physical contact be-tween the turbo pump components in a fuel-rich environment. The result could be catastrophic.1
According to STLE-fellow Erwin V. Zaretsky, P.E., Consulting Engineer, Distinguished Research Associate, NASA Glenn Research Center in Cleveland, Adjunct Professor of Engi-neering, Case Western Reserve Uni-versity (one of the top practitioners in the field), the design and development of the space shuttle turbo pump bear-ings evolved over several decades. They were based on computer analy-sis, laboratory rig testing and static ground testing of the shuttle turbo pumps under simulated flight condi-tions. The bearing computer analysis alone could not predict with reason-able engineering certainty the endur-ance and failure characteristics of these bearings.
The most thorough test (applica-tion simulation) is too time-consum-ing and costly for most bearing manu-facturers and OEMs. And some experts question the validity of computer sim-ulation and bench tests that analyze bearings in isolation.
The condition that most often lim-its bearing function and longevity is rolling element fatigue and the most common predictability calculation of failure is L10 bearing life. This method was first proposed in 1924 by Swedish researcher Arvid Palmgren. The L10
bearing life (the point in hours or
bearing inner-ring revolutions at or before, which 10 percent of the bear-ings in a group will have failed by roll-ing element fatigue), is based on Palmgren’s observation that no bear-ings in a group run under the same conditions or fail at the same time.2 In other words, bearing life is probabilis-tic or distributive, not deterministic.
Rolling element fatigue is a spall manifesting itself across the width of the running track and through to the depth of the maximum shearing stress beneath the contact surface. A spall can begin as a crack from a subsurface inclusion, defect or void below the contacting surface or from a crack em-anating from a surface defect or a de-bris dent that spreads into a network of cracks.
1 http://ntrs.nasa.gov/archive/nasa/casi.ntrs.nasa.gov/20100023061_2010023664.pdf.2 Per E.V. Zaretsky, more specifically, the L10 life, in millions of inner-race revolutions, is the theoretical life that 90 percent of a bearing population should reach or exceed without failure at its operating load.
Modern technology has improved (but not perfected) our ability to predict failure for these critically important components.
L10
BEARING LIFE CALCULATION
The L10 rating life of a group of identical roller bearings is the number of revolutions that 90 percent of bearings in a group will complete or exceed before the first evidence of fatigue (the point at which exactly 10 percent of the bearings are showing signs of fatigue). L10 is calculated in terms of millions of revolutions or in terms of hours.
Book Deals: STLE members can receive special discounts on featured CRC Press books. Details at www.stle.org. 3 9
For 90 to 95 percent of machine design applications, the recommenda-tions in bearing manufacturers’ cata-logs lead to safe and reliable function-ing. Remaining applications require specialized knowledge and analysis.3
Rolling element fatigue occurs in both bearing races and rolling ele-ments. It is extremely variable but sta-tistically predictable depending on such life factors as:
• Operating conditions
• The method of steel processing
• The method of bearingmanufacture (including the heat treatment)
• The steel type
• The lubricant.
Fatigue failures that originate be-low the contacting surface (classic rolling element fatigue) are an inevi-table result of age. But most bearings are removed for other reasons before this happens.
Failures other than those caused by age (rolling element fatigue) can be avoided as long as the bearing is not overloaded and is correctly designed, installed, lubricated and not subject to harsh operating conditions. With im-provements in manufacturing, today’s testing technology and care, bearing life has been extended appreciably.
The term basic bearing life refers to the L10 life without dependent life fac-tors such as those listed above. Be-cause the vast majority of undamaged bearings are removed from service for reasons other than the end of their cal-culated L10 life, it is cost-effective to inspect and place back into service those undamaged bearings that were removed before reaching their L10 life.
Per Zaretsky, probable causes for rolling element bearing removal and the approximate percent of failures include:
• Fatigue (surface and subsur-face) (3 percent)
• Cage wear (3 percent)
• Wear (6 percent)
• Handling damage (7 percent)
• Dimensional discrepancies (17 percent)
• Debris denting/contamination (20 percent)
• Corrosion pitting (27 percent)
• Other (17 percent).
Other causes include true and false brinelling, misalignment, bearing overload, excessive thrust lubrication, roller-edge stress, electric arc discharge and cage element or ring fracture. While these causes can be mitigated, they can never be completely elimi-nated. This makes understanding and determining bearing life even more important.
BEARING TESTSThere are three basic types of bearing tests: application simulation, comput-er simulation and individual bearing tests in the lab. Each method has its pros and cons. Design engineers tasked with bearing acceptance testing need to determine which test(s) best satisfies their specific situation.
STLE-member Joe Braza, senior scientist for Lancer Systems in Allen-town, Pa., explains, “For plain bear-ings, there are straightforward service life equations that can be used to pre-
dict the life of a bearing. These equa-tions depend on a number of factors such as load, speed, lubrication, tem-perature, dimension (i.e., radial clear-ance) and material, including under-standing the effect of contamination or seal design. In developing new plain bearing materials, these factors are not yet defined; therefore, bearing testing needs to occur before any type of bear-ing life formulas can be used.”
Let’s examine the three bearing-test categories.
Application Simulation. For some OEMs, there is no substitute for actual application simulation testing. During this type of analysis, bearings are test-ed in either a prototype or the actual assembly where they operate. For complex simulations, the bearing manufacturer and OEM may need to develop a formal test plan together. In some less-critical machinery, one way around application simulation is for the bearing manufacturer to supply bearings in mounted assemblies.
Application simulation tests ensure that the bearings will perform as speci-fied in actual application operating conditions. While this is true, applica-tion simulation is very expensive in terms of time and dollars and yields comparatively paltry statistics.
Actual application testing is more important in some bearing applica-tions than others—especially where there is no room for failure. Examples
ISO 281:2007
ISO 281:2007 specifies methods of calculating the basic dynamic load rating of roller bearings manufactured from high-quality hardened bearing steel. It also specifies the methods of calculating the basic rating life (L10). In addition, ISO 281:2007 specifies methods of calculating the modified rating life; where lubrication condition, lubricant contamination, fatigue load of the bearing and other factors are taken into account. It does not cover the effects of wear, corrosion and electrical erosion on bearing life. ISO 281:2007 does not apply to designs where the rolling elements operate directly on a shaft or housing surface, unless that surface is equivalent in all respects to the bearing ring (or washer) raceway it replaces.
4 2 • A P R I L 2 0 1 4 T R I B O L O G Y & L U B R I C A T I O N T E C H N O L O G Y W W W . S T L E . O R G
3 Per E.V. Zaretsky, many engineers don’t understand that the life they are calculating is not based on the point just before no failures will statistically occur but on the point at which 10 percent of the bearings are statistically expected to fail. This mistake can result in warranty and product liability claims for the OEM.
are wind turbines, where post-installa-tion repairs are extremely costly; spacecraft, where repairs are either costly or impossible; and CT scanners where a noisy bearing makes the ma-chine effectively unusable. Applica-tion testing makes sense just about any place where bearings are key to the proper functioning of critical equipment.
Actual bearing performance can stray from computer simulation pre-dictions because of unknown load and mounting effects (incomplete input data) and variations in tolerances. While bearing inspections verify phys-ical characteristics, they don’t provide any information about performance characteristics like torque and effec-tive operating tolerances. Application testing resolves these issues.
“Optimal testing should replicate the application as closely as possible in terms of load, speed, temperature, lu-
brication and environment,” Braza says. “Besides closely simulating the application, the bearing tester should be designed with fixture flexibility to accommodate various test coupons, force transducers or measuring devic-es (load cells, thermocouples, speed sensors and accelerometers) and data acquisition system to provide informa-tion about the bearing performance—particularly in real-time.”
Braza adds, “One word of caution. The majority of the time researchers design accelerated tests to speed up the process of obtaining bearing infor-mation quickly. The downfall of accel-erated testing is that the bearing may fail by a different mechanism and not be representative of the actual service condition.”
Computer Simulation. If performed carefully, computer simulation pro-vides the answers to real-world func-tionality. It is a good alternative to
bearing tests and application simula-tions where those costs would be pro-hibitive or the scale would be unwieldy or the logistics just too complex. An-other good reason to opt for computer simulation is security.
But the accuracy of computer sim-ulations depends on the validity of the simulation models and the consisten-cy of the results. The simulation mod-el should provide the same (or nearly the same) result for each execution. The process is much easier if the equa-tions for simulation are already in place. Accurate calibration, verifica-tion and validation of simulation mod-els are the keys to success. Tribologists are advised to understand these three factors.
1. Calibration. The base model’s pa-rameters should be specified and cali-brated so that the model matches the ultimate application as closely as pos-sible. Of the three types of errors that can affect calibration (input error, model error and parameter error), in-put error and parameter error can be remedied by the user. But since model error is rooted in the methodology, it requires more to fix. Another consid-eration is that simulation models can produce conflicting results if they are based on different modeling theories.
2. Verification. Once calibrated, the model must be verified to ensure that it is operating as expected based on the statistical input. Verification is achieved by comparing initial output data with what is expected from the input data. Basically it is an analysis of the output to see if it is reasonable. For example, in bearing simulation, the type and level of damage can be veri-fied to ensure that it is reasonably close to what the researcher would ex-pect, given the parameters.
3. Validation. Once the model has been verified, the final step is to vali-date it by statistically comparing the outputs to existing historical data. This establishes the model’s ability to replicate reality. The process of valida-tion highlights the importance of care-ful planning, thoroughness and accu-racy during calibration and verification.
W W W . S T L E . O R G T R I B O L O G Y & L U B R I C A T I O N T E C H N O L O G Y A P R I L 2 0 1 4 • 4 3
Computer simulations can be time- and money-saving substitutes for bear-ing tests and lab simulations, but in order to be relevant they must accu-rately model the intended use. Unless these techniques are employed, the ac-curacy of the model will always be open to question.
“No matter how good the bearing computer analysis is, the successful operation of the system is dependent on the boundary conditions and as-sumptions that are inserted into the computer analysis,” Zaretsky says. “The difference in performance be-tween the predicted and the experi-mental results can mean the difference between a successful product and a fi-nancial disaster.”
He continues, “In the last four de-cades, bearing modeling and analysis based on theoretical analysis has be-come very sophisticated and reason-ably accurate in predicting bearing performance, life and reliability based on classical rolling element fatigue. There are 26 variables that can affect rolling element fatigue.4 However, some of these variables are not neces-sarily susceptible to accurate analysis. As a result, testing rather than com-puter analysis may be a condition precedent for reliable bearing opera-tion for some critical applications.”
Bearing Tests in the Lab. STLE-mem-ber Harvey Nixon, senior technologist, bearings, for Meritor Heavy Vehicle Systems in Troy, Mich., says, “Labora-tory testing plays a rather large role in determining the design and manufac-turing capability of the supplier. Such testing is done at both the component
level (individual bearings) and in the intended application positions.”
Napoleon Engineering Services (NES) in St. Olean, N.Y., operates the largest independent bearing test facili-ty in the U.S. Its bearing test lab pro-grams focus on three main aspects of testing: life (dynamic), environmental and impact/static testing.
Life (dynamic)Testing. For OEMs, laboratory bearing life testing is per-formed as a means of comparing the performance of multiple suppliers. The most cost-effective method is via the standard bearing test (SBT) for validation of bearing design, material quality, manufacturing capability and overall workmanship quality. An SBT is performed without significant input
on application conditions.Considerations include application
loads, speeds and lubricant condi-tions, but the test is accelerated to shorten overall test time—with con-siderable effort to maintain a failure mode common to the application. The tester runs the bearings to the point of failure, using classical or sudden-death testing methods. This yields relatively large quantities of data.
The lab generates a Weibull plot from the failure times (or failure and suspension times), and the result is an empirically derived supplier reliability metric. The addition of upper and low-er confidence boundaries establishes the anticipated variability within a supplier’s population. When results between suppliers are compared, they provide a valuable understanding of relative performance differences. Lab testing of a baseline bearing supplier
with known application experience al-lows an OEM to predict expected bear-ing life in an application from a new supplier.
Although SBT is the most common and cost-effective bearing test, it is also possible to perform theoretical ap-plication simulation (TAS) in the lab. The difference between TAS and SBT is that TAS test conditions are applica-tion-driven. Bearing loads and speeds are representative of how a bearing will perform within a particular appli-cation. Duty-cycle testing falls into this category. As a result, TAS tests of-ten take longer to reach failure or are run only to a suspension point. The testing benefit to the OEM is the knowledge and confidence that they have tested the bearing under simu-lated real-life performance conditions. However, results are based on a small-er data subset.
Dynamic lab testing can have the added benefit of yielding additional test results without significantly influ-encing a test budget and lead time. Ex-amples include:
• Supplier life adjustment factors
• Catalog load rating validation
• Bearing efficiency comparison – torque and temperature
• Weakest link failure mode – due to design or quality of workmanship
• Model correlation
• Material/process validation.
Environmental Testing. When prima-ry bearing failure is due to external contamination (rather than pure fa-tigue failure), the ability of the seal to withstand contamination intrusion be-comes paramount. Environmental lab tests that use mud slurry, water spray and fine particle dust are the tests of choice because of their relatively short runtimes and ability to replicate harsh operating environments. The end re-
4 Articulated the book that Zaretsky co-authored and edited, Life Factors for Rolling Bearings, 2nd Edition, STLE (1997).
‘The downfall of accelerated testing is that the bearing may fail by a different mechanism and not be representative of the actual service condition.’
44 Animals and insects associated with spring include the rabbit, frog, deer, fox, bear, bee, butterfly, ladybug and hummingbird.
sult is significant time savings over application-style field testing for com-paring seal efficiency.5
Impact/Static Load Testing. Due to the increase in the global supply of through-hardened bearing materials, over case-carburized steel in tapered roller bearings (TRB) and mast guide bearings, impact and static load lab testing is on the rise. Such testing pro-vides information on cone rib flange resistance to fracture on TRBs and true-brinelling indentation depth for mast guide bearings. Simple test fix-tures can create extreme load and im-pact conditions without requirements for full application accessories to cre-ate the failure condition.
By using test rigs and test parame-ters with relatively short test times and lower costs, standard bearing testing examines operational differences be-tween suppliers or designs. But it does not take intended application condi-tions into consideration.
Nixon explains, “Bench testing of the individual bearings is used most often for validation after the bearing samples have met all the initial scruti-ny in the multistep evaluation process. Bench testing can be less expensive than full-scale application testing, and more bearing samples can be evaluat-ed in less time. The more test data, the better the reliability of the conclusions about the performance capability of the bearing products. By necessity, the loading is higher in order to accelerate the testing. It is then important to compare the results to the life perfor-mance prediction model and compare it to a known validated supplier per-formance baseline (the existing pro-duction supply base, i.e., comparative testing of two suppliers).
WHEN TO TEST Bearing tests are necessary when the proper functioning of a critical or cost-ly machine depends on the bearing. While catalog data is sufficient for the
majority of applications, it only de-scribes the estimated performance characteristics of bearings. In reality, the performance strays from catalogue stats for reasons that include operating conditions like load, tolerance and mounting configuration. It’s difficult to predict exactly how a bearing will perform until it is assembled and mounted. Testing determines key per-formance characteristics and whether the bearing can even meet application requirements. Testing makes sense when:
• The equipment must be reliable
• In-service repair is extremely
difficult or impossible
• The equipment is expensive
• The equipment is critical to operations
• Equipment failure could result in injury or death
• Certification is required; for example to maintain the warranty.
“At Lancer Systems, we developed a ceramic matrix composite material to replace silicon carbide bearings for fluid film plain bearings,” Braza says. “During the development, it was im-
5 Most environmental testing is performed in an A-B comparison format. 6 http://www.itl.nist.gov/div898/handbook/eda/section3/weibplot.htm.
W W W . S T L E . O R G T R I B O L O G Y & L U B R I C A T I O N T E C H N O L O G Y A P R I L 2 0 1 4 • 4 5
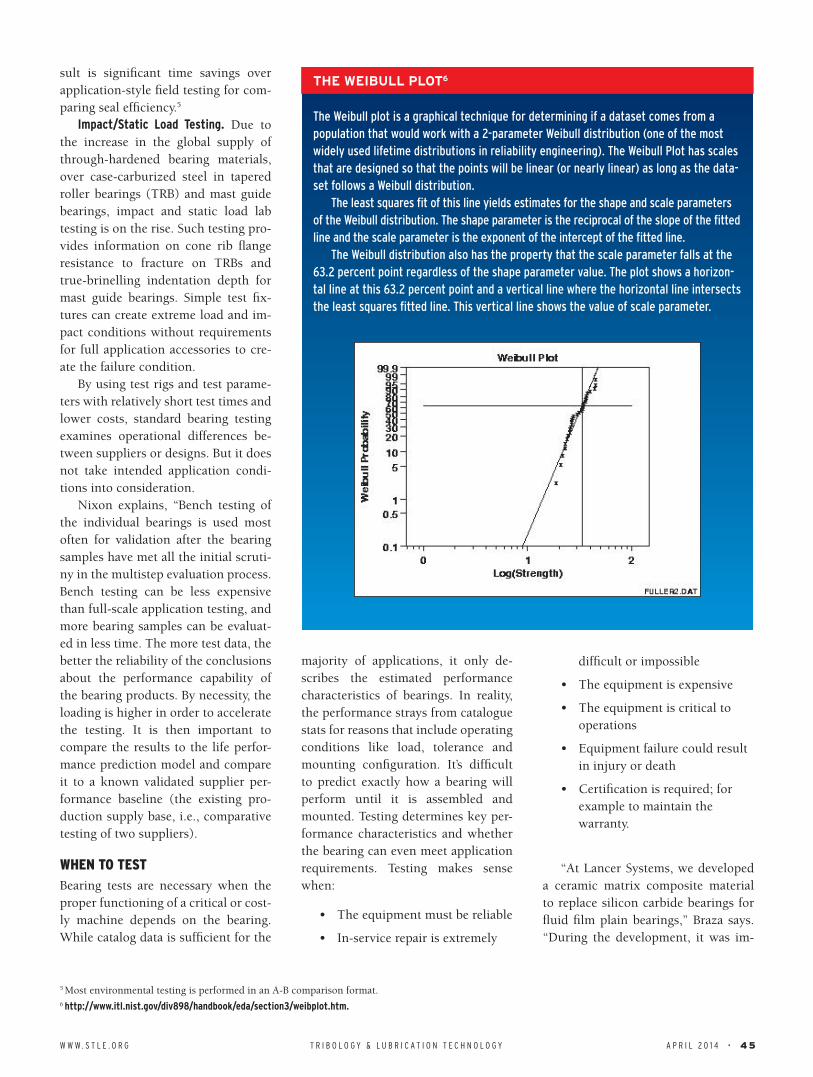
THE WEIBULL PLOT6
The Weibull plot is a graphical technique for determining if a dataset comes from a population that would work with a 2-parameter Weibull distribution (one of the most widely used lifetime distributions in reliability engineering). The Weibull Plot has scales that are designed so that the points will be linear (or nearly linear) as long as the data-set follows a Weibull distribution.
The least squares fit of this line yields estimates for the shape and scale parameters of the Weibull distribution. The shape parameter is the reciprocal of the slope of the fitted line and the scale parameter is the exponent of the intercept of the fitted line.
The Weibull distribution also has the property that the scale parameter falls at the 63.2 percent point regardless of the shape parameter value. The plot shows a horizon-tal line at this 63.2 percent point and a vertical line where the horizontal line intersects the least squares fitted line. This vertical line shows the value of scale parameter.
perative to generate technical data re-garding the performance of the mate-rial as fluid film bearing in order to convince our customers to use this material in their pumps. The pump design engineers needed an under-standing of the material as a bearing, particularly its pressure velocity limi-tation, chemical resistance and dry-run capabilities.”
TESTING VS. ISO 281 L10 Bearing tests and standards have been the source of confusion and controver-sy for decades. Rolling element bearing fatigue life calculations for most indus-trial and machine applications are dic-tated in the U.S. by ANSI/ABMA Stan-dard 9 for ball bearings and ANSI/ABMA Standard 11 for roller bearings.
Outside of the U.S., both ball and roller bearing fatigue life is dictated by ISO Standard 281: 2007, which incor-porates a fatigue limit into its L10 bear-ing life calculation. It is hotly disputed by bearing experts that include Za-retsky. He and others are certain that no true fatigue limit for a bearing has ever been established and that existing data does not support the establish-ment of a fatigue limit.
Zaretsky explains, “What can hap-pen when using the ISO Standard 281: 2007 is that the life of a rolling ele-ment bearing can be over-predicted for a specific application. Since the bear-ing life that is predicted is greater than that which may be required, the bear-ing size is reduced as well as the bear-ing acquisition cost. This can result in an undersized bearing for the applica-tion and early bearing failure. Then there is the matter of warranty and li-ability issues when the bearing or bearings do not perform as predicted for the application.”
He continues, “It’s important to distinguish between the rolling ele-ment bearing’s service life and the bearing’s L10 fatigue life. Bearing ser-vice life can be defined as the time a bearing is removed from service for any cause. The bearing’s theoretical life analysis is based, for the most part, on the L10 fatigue life. It is my opinion
that, with some exceptions, bearing (L10) fatigue life analysis is no longer theoretical but experimentally estab-lished with reasonable engineering and statistical certainty.”
Zaretsky adds that rolling element bearing (service) life, whether based on fatigue or other failure mode, is probabilistic and not deterministic. It is not a calculation of the absolute val-ue of a bearing’s operating time but, rather, the probability that a specific bearing operating under well-defined
conditions will equal or exceed a cal-culated operating time based upon a defined failure mode.
“There is a conundrum associated with bearing fatigue life calculations and bearing service life,” Zaretsky says. “If a bearing is properly designed, installed, lubricated and maintained, it should theoretically fail by classical rolling element fatigue. However, probably less than 5 percent of bear-ings removed from service are removed because of rolling element fatigue. This means that the probable cause for bearing removal for most applications is not rolling element fatigue (which is the basis for the ANSI/ABMA and ISO standards). The cause for removal and thus the bearing service life depends on the bearing application.”
Zaretsky concludes that ISO 281:2007 does not provide a valid rep-resentation of actual bearing life in re-al-world application conditions.
Nixon adds, “ISO and ABMA stan-dards rely on the assumption that proper bearing quality steels and ade-quate internal geometric design have been incorporated to give the standard catalog performance-rating placed on the product. But improper internal ge-
ometry and inadequate steel perfor-mance can negate the load rating es-tablished by the rating equations.”
IN THE END “Any company that purchases and uses bearings in their equipment should do adequate testing to validate the bearing supplier’s products,” Nix-on says. “It is, however, just as impor-tant to validate the supplier’s capabili-ty to produce the product to the same specifications on an ongoing basis. Most suppliers can provide acceptable prototype samples but may not be able to maintain specifications in series production. Therefore, scrutiny of the supplier’s quality systems and their manufacturing processes along with supply base is just as important.”
Reliable bearings are essential for many applications, including space development. For example, satellites have a flywheel to maintain them in the correct position and orientation. Some satellites, along with their fly-wheels’ ultra-high-precision bearings, have been operating seamlessly in space for more than 15 years.
The accuracy of any bearing-equipped machinery is determined by the accuracy of its bearings’ revolu-tion. For example, the deflection from the central axis of a computer’s hard disk drive (which uses ultra-high pre-cision bearings) is less than 100 nano-meters (100 billionths of a meter).
This points not only to the neces-sity for performing tests but choosing the correct test and carefully analyzing the data. While bearing tests have im-proved markedly during the past 60 years, the challenge to improve bear-ing life through testing remains.
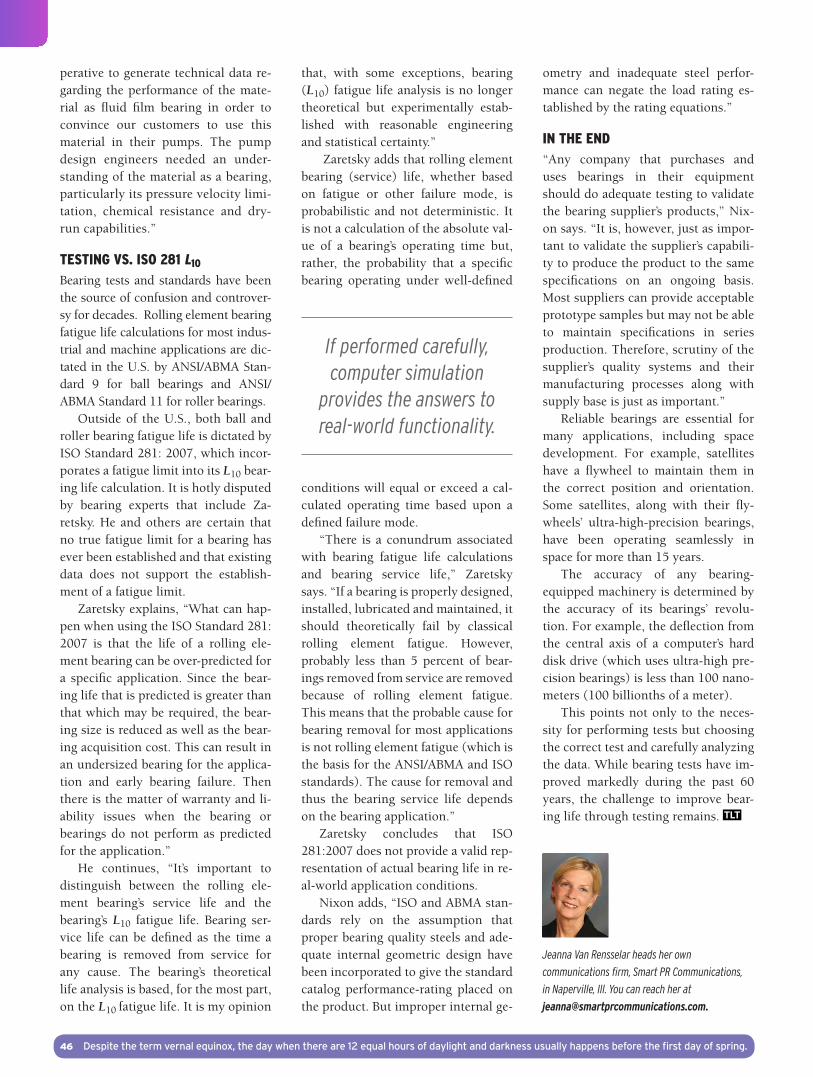
Jeanna Van Rensselar heads her own
communications firm, Smart PR Communications,
in Naperville, Ill. You can reach her at
If performed carefully, computer simulation
provides the answers to real-world functionality.
46 Despite the term vernal equinox, the day when there are 12 equal hours of daylight and darkness usually happens before the first day of spring.


![Jeanna Vogt [other team member names removed]. User Experience](https://img.pdfslide.net/doc/110x75/55194f0c550346bb2d8b4614/jeanna-vogt-other-team-member-names-removed-user-experience.jpg)

