Embed Size (px)
Citation preview
© Copyright 2016 Quintiles
Jefferies2016 Healthcare Conference
Tom PikeCEO
June 7, 2016
NYSE: Q
2
Cautionary Statements Regarding Forward Looking StatementsThis communication contains “forward-looking statements” within the meaning of the federal securities laws, including Section 27A of the Securities Act of 1933, as amended, and Section 21E of the Securities Exchange Act of 1934, as amended. In this context, forward-looking statements often address expected future business and financial performance and financial condition, and often contain words such as “expect,” “anticipate,” “intend,” “plan,” “believe,” “seek,” “see,” “will,” “would,” “target,” similar expressions, and variations or negatives of these words. Forward-looking statements by their nature address matters that are, to different degrees, uncertain, such as statements about the potential timing or consummation of the proposed transaction or the anticipated benefits thereof, including, without limitation, future financial and operating results. IMS Health and Quintiles caution readers that these and other forward-looking statements are not guarantees of future results and are subject to risks, uncertainties and assumptions that could cause actual results to differ materially from those expressed in any forward-looking statements. Important risk factors that may cause such a difference include, but are not limited to risks and uncertainties related to (i) the ability to obtain shareholder and regulatory approvals, or the possibility that they may delay the transaction or that such regulatory approval may result in the imposition of conditions that could cause the parties to abandon the transaction, (ii) the risk that a condition to closing of the merger may not be satisfied; (iii) the ability of IMS Health and Quintiles to integrate their businesses successfully and to achieve anticipated cost savings and other synergies, (iv) the possibility that other anticipated benefits of the proposed transaction will not be realized, including without limitation, anticipated revenues, expenses, earnings and other financial results, and growth and expansion of the new combined company’s operations, and the anticipated tax treatment, (v) current or potential future litigation relating to the proposed transaction that has been or could be instituted against IMS Health, Quintiles or their respective directors, (vi) possible disruptions from the proposed transaction that could harm IMS Health’s or Quintiles’ business, including current plans and operations, (vii) the ability of IMS Health or Quintiles to retain, attract and hire key personnel, (viii) potential adverse reactions or changes to relationships with clients, employees, suppliers or other parties resulting from the announcement or completion of the merger, (ix) potential business uncertainty, including changes to existing business relationships, during the pendency of the merger that could affect IMS Health’s and/or Quintiles’ financial performance, (x) certain restrictions during the pendency of the merger that may impact IMS Health’s or Quintiles’ ability to pursue certain business opportunities or strategic transactions, (xi) continued availability of capital and financing and rating agency actions, (xii) legislative, regulatory and economic developments and (xiii) unpredictability and severity of catastrophic events, including, but not limited to, acts of terrorism or outbreak of war or hostilities, as well as management’s response to any of the aforementioned factors. These risks, as well as other risks associated with the proposed transaction, are more fully discussed in the preliminary joint proxy statement/prospectus included in the registration statement on Form S-4 filed with the SEC in connection with the proposed transaction. While the list of factors presented here is, and the list of factors presented in the registration statement on Form S-4 are, considered representative, no such list should be considered to be a complete statement of all potential risks and uncertainties. Unlisted factors may present significant additional obstacles to the realization of forward looking statements. Consequences of material differences in results as compared with those anticipated in the forward-looking statements could include, among other things, business disruption, operational problems, financial loss, legal liability to third parties and similar risks, any of which could have a material adverse effect on IMS Health’s or Quintiles’ consolidated financial condition, results of operations, credit rating or liquidity. Neither IMS Health nor Quintiles assumes any obligation to provide revisions or updates to any forward looking statements, whether as a result of new information, future developments or otherwise, should circumstances change, except as otherwise required by securities and other applicable laws.
Note on Non-GAAP Financial MeasuresNon-GAAP results, such as combined adjusted EBITDA, constant currency growth, adjusted income from operations, diluted adjusted EPS and free cash flow, are presented only as a supplement to IMS Health’s and Quintiles’ financial statements based on GAAP. Non-GAAP financial information is provided to enhance understanding of IMS Health’s and Quintiles’ financial performance, but none of these non-GAAP financial measures are recognized terms under GAAP and non-GAAP measures should not be considered in isolation from, or as a substitute analysis for, IMS Health’s and Quintiles’ results of operations as determined in accordance with GAAP. Definitions and reconciliations of non-GAAP measures to the most directly comparable GAAP measures are provided within the schedules attached to this release.
IMS Health and Quintiles use non-GAAP measures in their respective operational and financial decision making, and believe that it is useful to exclude certain items in order to focus on what they regard to be a more reliable indicator of the underlying operating performance of the business. As a result, internal management reports feature non-GAAP measures which are also used to prepare strategic plans and annual budgets and review management compensation. IMS Health and Quintiles also believe that investors may find non-GAAP financial measures useful for the same reasons, although investors are cautioned that non-GAAP financial measures are not a substitute for GAAP disclosures.
Non-GAAP measures are frequently used by securities analysts, investors and other interested parties in their evaluation of companies comparable to IMS Health and Quintiles, many of which present non-GAAP measures when reporting their results. Non-GAAP measures have limitations as an analytical tool. They are not presentations made in accordance with GAAP, are not measures of financial condition or liquidity and should not be considered as an alternative to profit or loss for the period determined in accordance with GAAP or operating cash flows determined in accordance with GAAP. Non-GAAP measures are not necessarily comparable to similarly titled measures used by other companies. As a result, you should not consider such performance measures in isolation from, or as a substitute analysis for, IMS Health’s and Quintiles’ respective results of operations as determined in accordance with GAAP.
3
Important Information About the Transaction and Where to Find ItIn connection with the proposed transaction, Quintiles has filed a registration statement on Form S-4 with the Securities and Exchange Commission (“SEC”) that includes the preliminary joint proxy statement of Quintiles and IMS Health and that also constitutes a preliminary prospectus of Quintiles. After the registration statement is declared effective, IMS Health and Quintiles plan to mail to their respective shareholders the definitive joint proxy statement/prospectus and may also file other documents with the SEC regarding the proposed transaction. This document is not a substitute for the joint proxy statement/prospectus or registration statement or any other document which IMS Health or Quintiles may file with the SEC. Investors and security holders of IMS Health and Quintiles are urged to read the registration statement, the joint proxy statement/prospectus and any other relevant documents when they are available, as well as any amendments or supplements to these documents, carefully and in their entirety because they contain important information. Investors and security holders may obtain free copies of the registration statement and the joint proxy statement/prospectus and other documents filed with the SEC by IMS Health and Quintiles through the web site maintained by the SEC at www.sec.gov or by contacting the investor relations department of IMS Health or Quintiles at the following:
IMS Health [email protected] [email protected]+1.203.448.4600 +1.919.998.2590Investor Relations 4820 Emperor Boulevard83 Wooster Heights RD PO Box 13979Danbury, CT, 06810 Durham, North Carolina 27703
Participants in the SolicitationIMS Health, Quintiles and certain of their respective directors, executive officers and employees may be deemed to be participants in the solicitation of proxies in respect of the proposed transaction and related matters. Information regarding IMS Health’s directors and executive officers, including a description of their direct interests, by security holdings or otherwise, is contained in IMS Health’s Form 10-K for the year ended December 31, 2015 and its proxy statement filed on February 22, 2016, which are filed with the SEC. Information regarding Quintiles’ directors and executive officers, including a description of their direct interests, by security holdings or otherwise, is contained in Quintiles’ Form 10-K for the year ended December 31, 2015 and its proxy statement filed on March 21, 2016, which are filed with the SEC. A more complete description is contained in the registration statement on Form S-4 and the joint proxy statement/prospectus filed with the SEC.
No Offer or SolicitationThis communication is not intended to and shall not constitute an offer to sell or the solicitation of an offer to sell or the solicitation of an offer to buy any securities or a solicitation of any vote of approval, nor shall there be any sale of securities in any jurisdiction in which such offer, solicitation or sale would be unlawful prior to registration or qualification under the securities laws of any such jurisdiction. No offer of securities shall be made except by means of a prospectus meeting the requirements of Section 10 of the Securities Act of 1933, as amended.
4
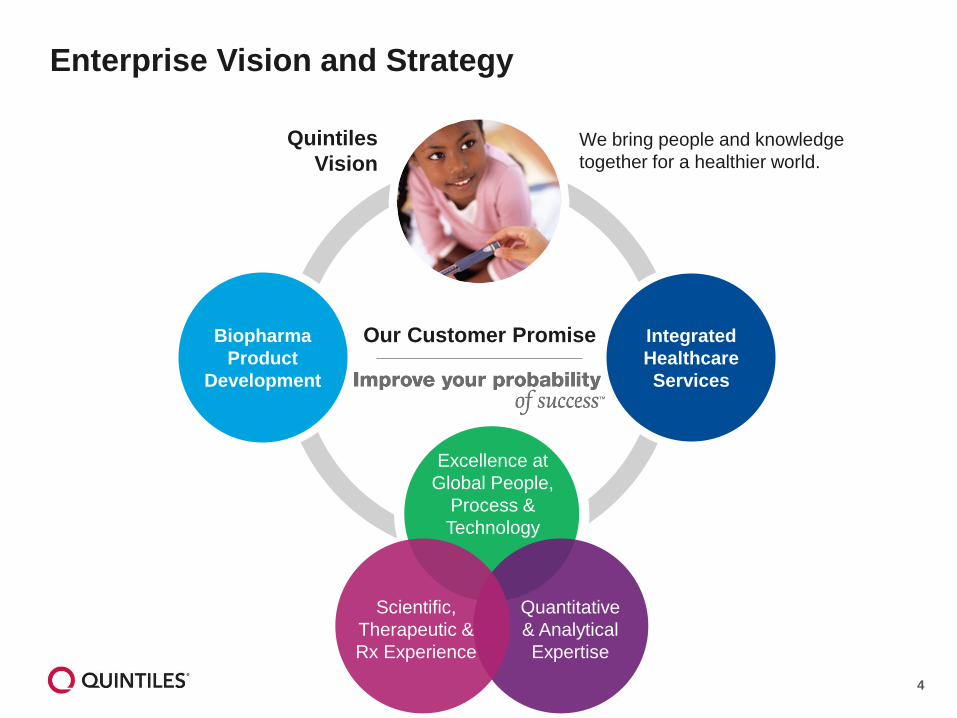
Enterprise Vision and Strategy
Quintiles Vision
We bring people and knowledge together for a healthier world.
Our Customer Promise
Excellence at Global People,
Process & Technology
Scientific, Therapeutic & Rx Experience
Quantitative& Analytical Expertise
Biopharma Product
Development
IntegratedHealthcare Services
5
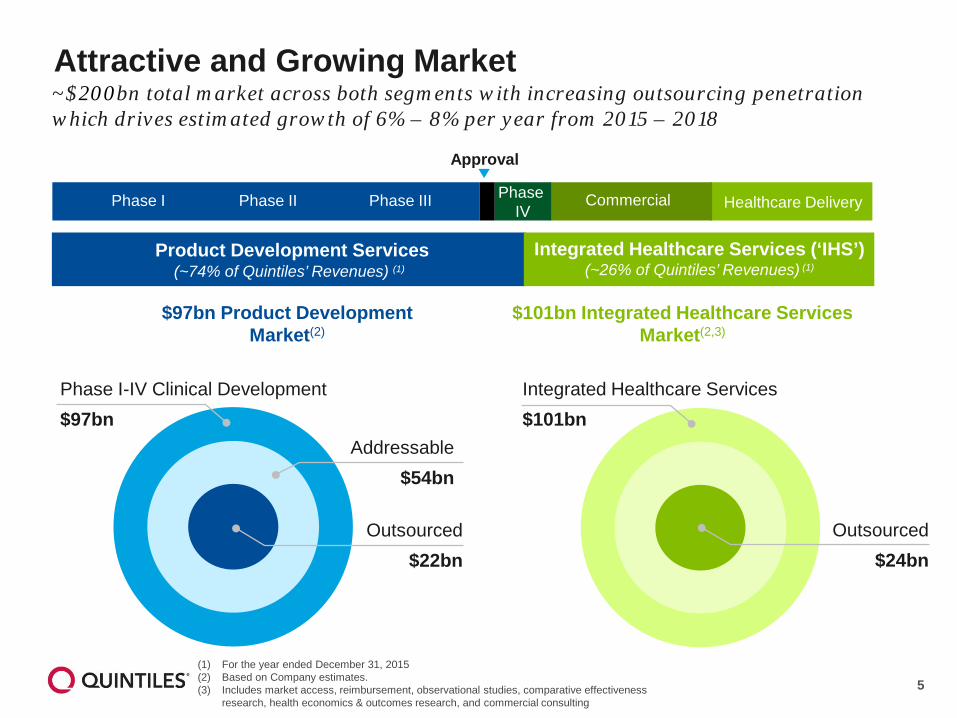
Attractive and Growing Market~$200bn total market across both segments with increasing outsourcing penetration which drives estimated growth of 6% – 8% per year from 2015 – 2018
$97bn Product Development Market(2)
$101bn Integrated Healthcare Services Market(2,3)
Phase I-IV Clinical Development$97bn
Outsourced$22bn
Addressable$54bn
Integrated Healthcare Services$101bn
Outsourced$24bn
Product Development Services (~74% of Quintiles’ Revenues) (1)
Integrated Healthcare Services (‘IHS’) (~26% of Quintiles’ Revenues) (1)
Approval
Phase I Phase II Phase III Healthcare DeliveryCommercialPhase IV
(1) For the year ended December 31, 2015(2) Based on Company estimates.(3) Includes market access, reimbursement, observational studies, comparative effectiveness
research, health economics & outcomes research, and commercial consulting
6
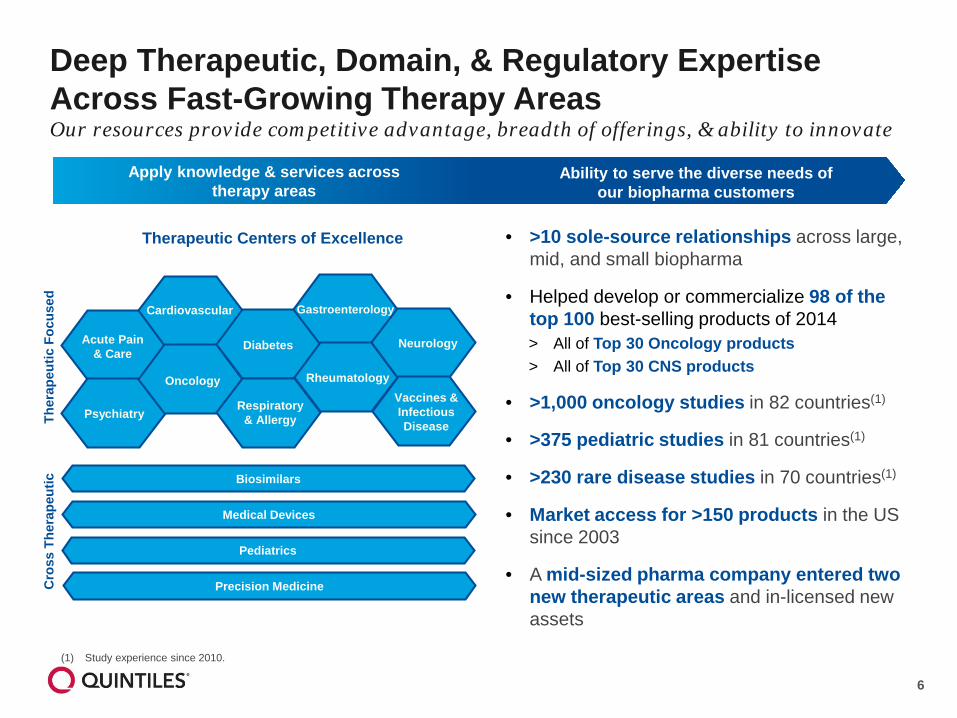
Deep Therapeutic, Domain, & Regulatory Expertise Across Fast-Growing Therapy Areas
• >10 sole-source relationships across large, mid, and small biopharma
• Helped develop or commercialize 98 of the top 100 best-selling products of 2014> All of Top 30 Oncology products> All of Top 30 CNS products
• >1,000 oncology studies in 82 countries(1)
• >375 pediatric studies in 81 countries(1)
• >230 rare disease studies in 70 countries(1)
• Market access for >150 products in the US since 2003
• A mid-sized pharma company entered two new therapeutic areas and in-licensed new assets
(1) Study experience since 2010.
Our resources provide competitive advantage, breadth of offerings, & ability to innovate
Therapeutic Centers of Excellence
Apply knowledge & services across therapy areas
Ability to serve the diverse needs of our biopharma customers
Ther
apeu
tic F
ocus
edC
ross
The
rape
utic
Acute Pain& Care
Cardiovascular
Diabetes Neurology
Gastroenterology
Psychiatry
Oncology
Respiratory& Allergy
RheumatologyVaccines &InfectiousDisease
Biosimilars
Precision Medicine
Medical Devices
Pediatrics
7
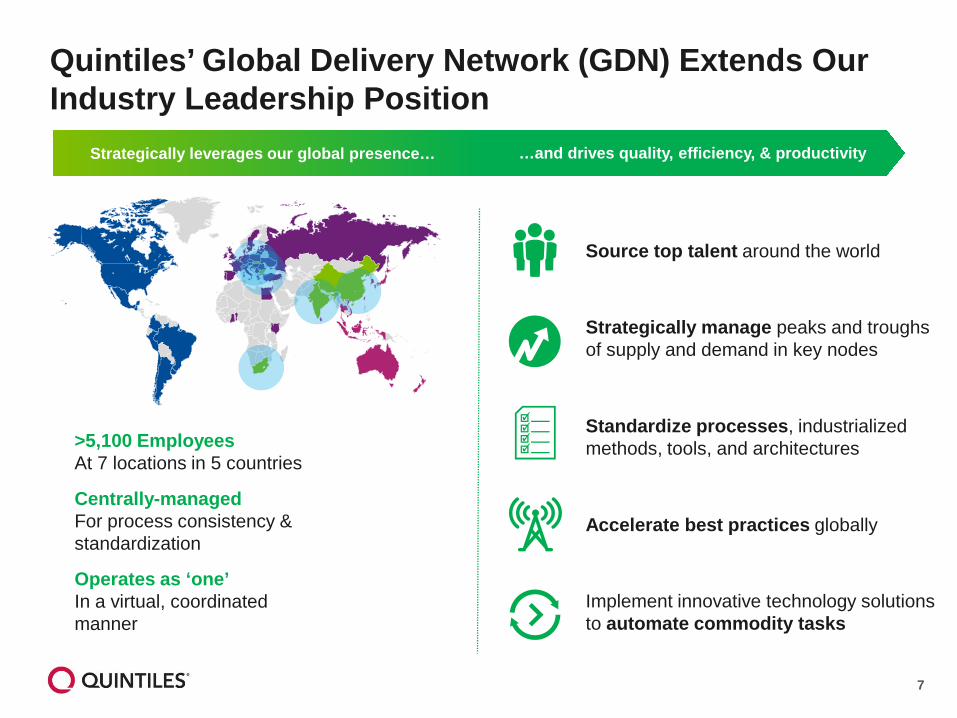
Quintiles’ Global Delivery Network (GDN) Extends Our Industry Leadership Position
>5,100 EmployeesAt 7 locations in 5 countries
Centrally-managedFor process consistency & standardization
Operates as ‘one’In a virtual, coordinated manner
Strategically leverages our global presence… …and drives quality, efficiency, & productivity
Accelerate best practices globally
Source top talent around the world
Standardize processes, industrialized methods, tools, and architectures
Strategically manage peaks and troughs of supply and demand in key nodes
Implement innovative technology solutions to automate commodity tasks
8
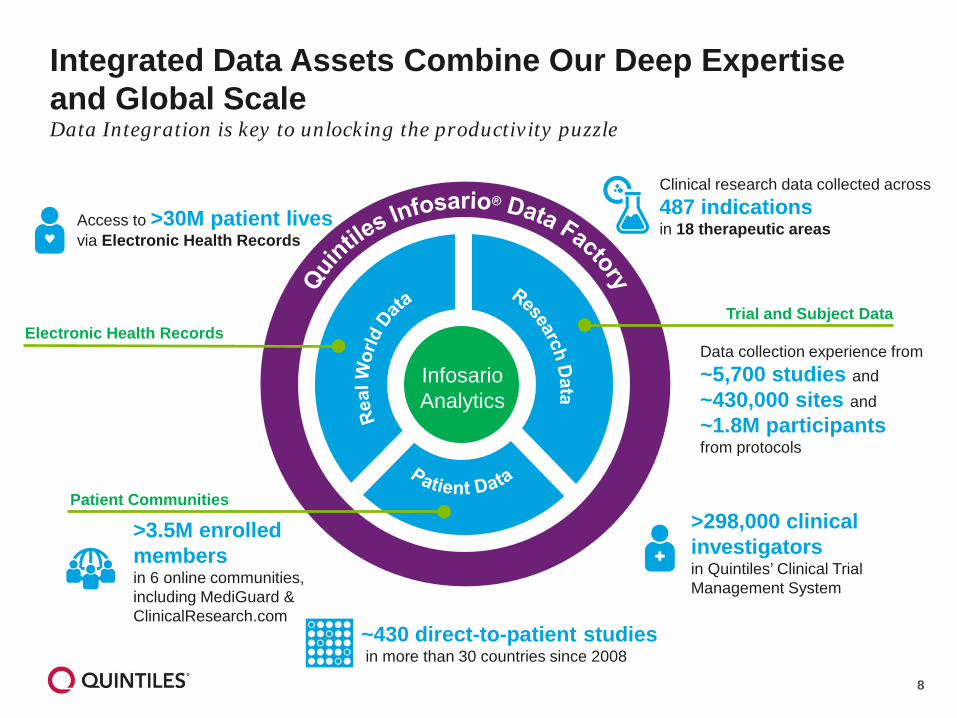
Integrated Data Assets Combine Our Deep Expertise and Global ScaleData Integration is key to unlocking the productivity puzzle
InfosarioAnalytics
Trial and Subject Data
Patient Communities
Electronic Health Records
Access to >30M patient lives via Electronic Health Records
>3.5M enrolled members in 6 online communities,including MediGuard &ClinicalResearch.com
~430 direct-to-patient studiesin more than 30 countries since 2008
>298,000 clinical investigators in Quintiles’ Clinical Trial Management System
Data collection experience from~5,700 studies and~430,000 sites and~1.8M participantsfrom protocols
Clinical research data collected across487 indicationsin 18 therapeutic areas
9
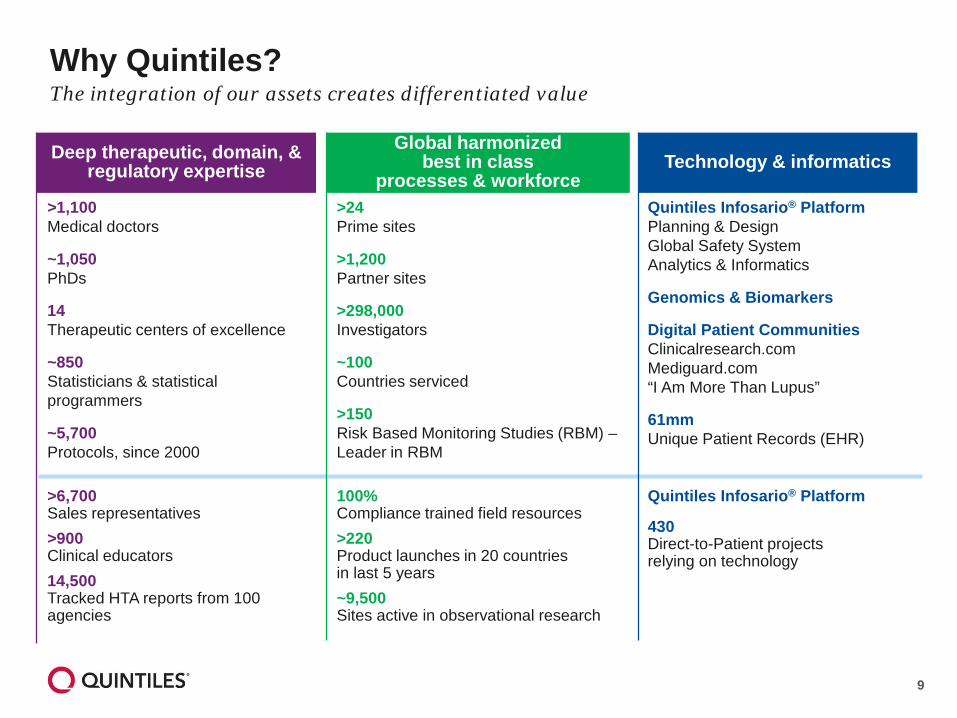
Quintiles Infosario® PlatformPlanning & DesignGlobal Safety SystemAnalytics & Informatics
Genomics & Biomarkers
Digital Patient CommunitiesClinicalresearch.comMediguard.com“I Am More Than Lupus”
61mm Unique Patient Records (EHR)
>24Prime sites
>1,200 Partner sites
>298,000Investigators
~100 Countries serviced
>150 Risk Based Monitoring Studies (RBM) –Leader in RBM
>1,100Medical doctors
~1,050PhDs
14Therapeutic centers of excellence
~850Statisticians & statistical programmers
~5,700 Protocols, since 2000
Deep therapeutic, domain, & regulatory expertise
Global harmonized best in class
processes & workforceTechnology & informatics
Quintiles Infosario® Platform
430Direct-to-Patient projects relying on technology
100% Compliance trained field resources>220 Product launches in 20 countries in last 5 years~9,500Sites active in observational research
>6,700Sales representatives>900Clinical educators14,500Tracked HTA reports from 100 agencies
Why Quintiles?The integration of our assets creates differentiated value
10
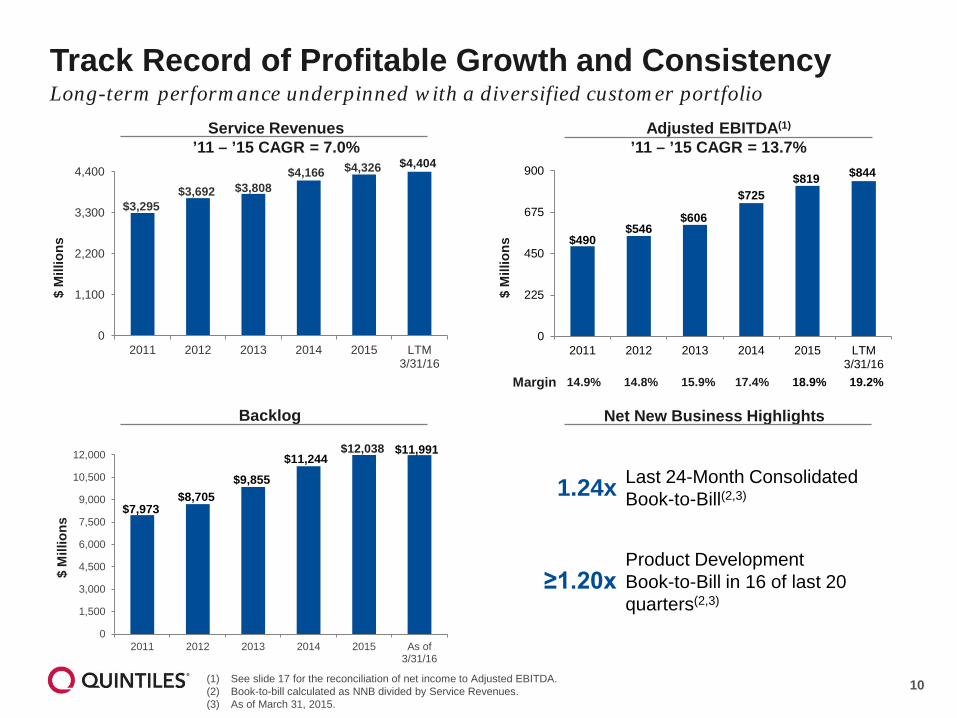
$7,973$8,705
$9,855$11,244
$11,991
0
1,500
3,000
4,500
6,000
7,500
9,000
10,500
12,000
2011 2012 2013 2014 2015 As of3/31/16
Track Record of Profitable Growth and Consistency Long-term performance underpinned with a diversified customer portfolio
(1) See slide 17 for the reconciliation of net income to Adjusted EBITDA.(2) Book-to-bill calculated as NNB divided by Service Revenues.(3) As of March 31, 2015.
$490$546
$606
$725$819 $844
0
225
450
675
900
2011 2012 2013 2014 2015 LTM3/31/16
$3,295$3,692 $3,808
$4,166 $4,326
0
1,100
2,200
3,300
4,400
2011 2012 2013 2014 2015 LTM3/31/16
$ M
illio
ns
$ M
illio
ns
$ M
illio
ns
14.9% 14.8% 15.9% 17.4% 18.9% 19.2%Margin
Service Revenues’11 – ’15 CAGR = 7.0%
Adjusted EBITDA(1)
’11 – ’15 CAGR = 13.7%
Backlog Net New Business Highlights
1.24x
≥1.20x
Last 24-Month Consolidated Book-to-Bill(2,3)
Product DevelopmentBook-to-Bill in 16 of last 20 quarters(2,3)
$12,038
$4,404
11
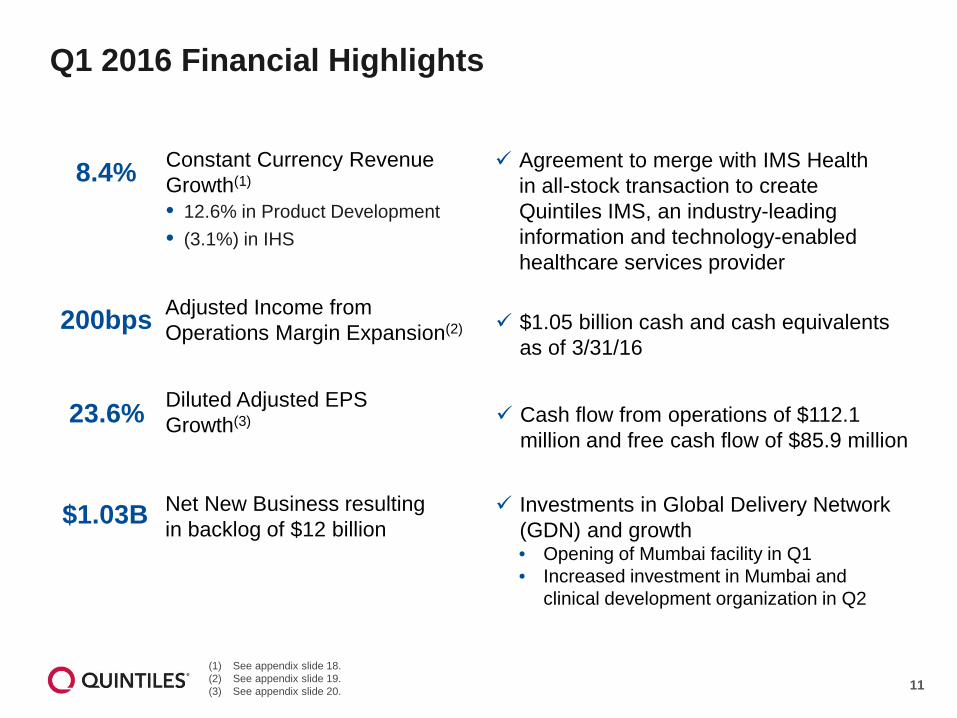
Q1 2016 Financial Highlights
(1) See appendix slide 18.(2) See appendix slide 19.(3) See appendix slide 20.
200bps Adjusted Income from Operations Margin Expansion(2)
$1.03B Net New Business resulting in backlog of $12 billion
Agreement to merge with IMS Health in all-stock transaction to create Quintiles IMS, an industry-leading information and technology-enabled healthcare services provider
23.6% Diluted Adjusted EPSGrowth(3)
8.4% Constant Currency RevenueGrowth(1)
• 12.6% in Product Development• (3.1%) in IHS
Investments in Global Delivery Network (GDN) and growth• Opening of Mumbai facility in Q1• Increased investment in Mumbai and
clinical development organization in Q2
Cash flow from operations of $112.1 million and free cash flow of $85.9 million
$1.05 billion cash and cash equivalents as of 3/31/16
12
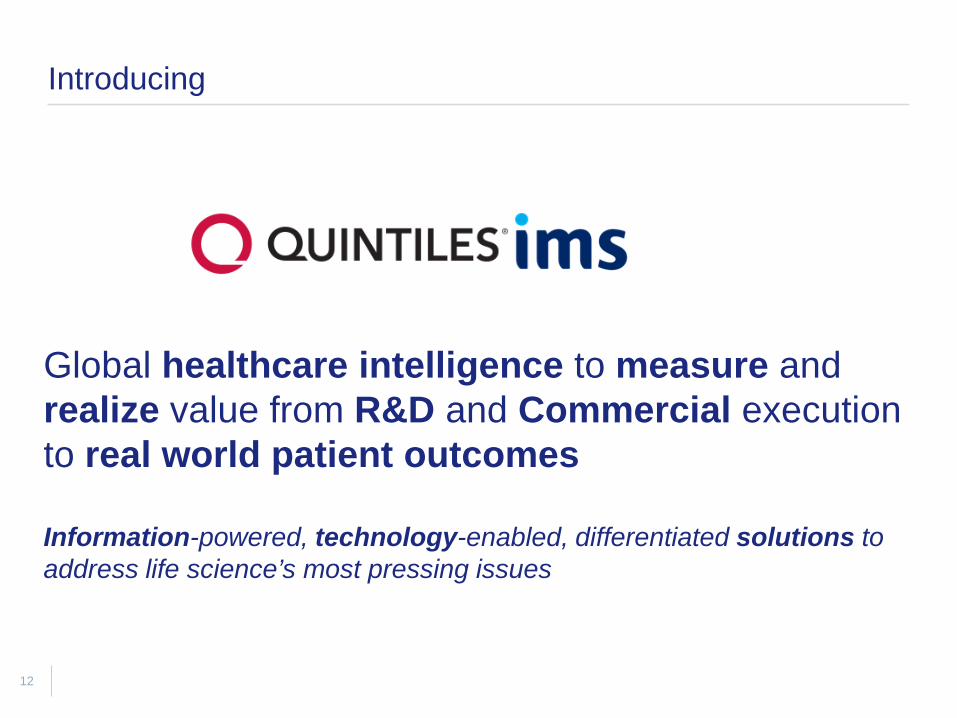
Introducing
Global healthcare intelligence to measure and realize value from R&D and Commercial execution to real world patient outcomes
Information-powered, technology-enabled, differentiated solutions to address life science’s most pressing issues
13
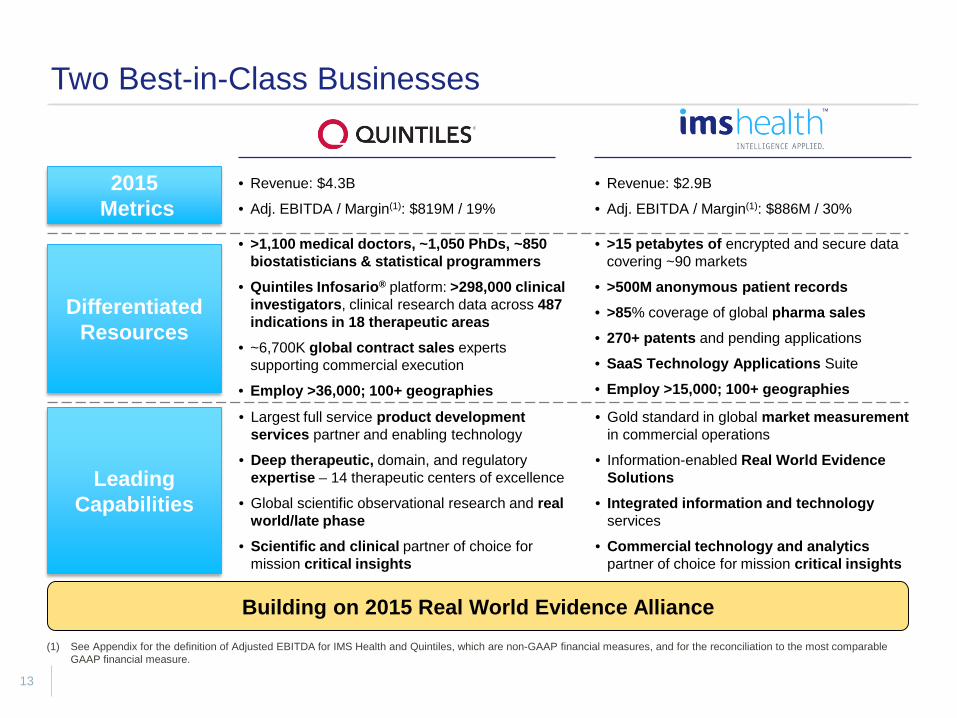
Two Best-in-Class Businesses
2015Metrics
Differentiated Resources
LeadingCapabilities
• Revenue: $4.3B
• Adj. EBITDA / Margin(1): $819M / 19%
• >1,100 medical doctors, ~1,050 PhDs, ~850 biostatisticians & statistical programmers
• Quintiles Infosario® platform: >298,000 clinical investigators, clinical research data across 487 indications in 18 therapeutic areas
• ~6,700K global contract sales experts supporting commercial execution
• Employ >36,000; 100+ geographies
(1) See Appendix for the definition of Adjusted EBITDA for IMS Health and Quintiles, which are non-GAAP financial measures, and for the reconciliation to the most comparable GAAP financial measure.
• Largest full service product development services partner and enabling technology
• Deep therapeutic, domain, and regulatory expertise – 14 therapeutic centers of excellence
• Global scientific observational research and real world/late phase
• Scientific and clinical partner of choice for mission critical insights
• Revenue: $2.9B
• Adj. EBITDA / Margin(1): $886M / 30%
• >15 petabytes of encrypted and secure data covering ~90 markets
• >500M anonymous patient records• >85% coverage of global pharma sales• 270+ patents and pending applications
• SaaS Technology Applications Suite
• Employ >15,000; 100+ geographies
• Gold standard in global market measurement in commercial operations
• Information-enabled Real World Evidence Solutions
• Integrated information and technology services
• Commercial technology and analytics partner of choice for mission critical insights
Building on 2015 Real World Evidence Alliance
14
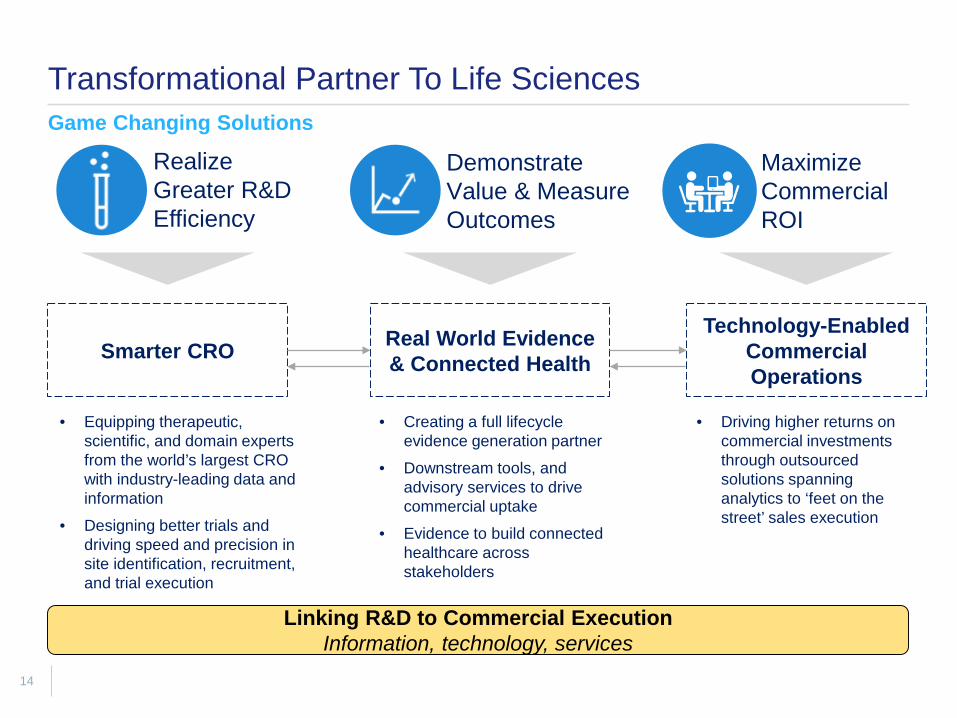
Transformational Partner To Life SciencesGame Changing Solutions
Realize Greater R&DEfficiency
Demonstrate Value & Measure Outcomes
Maximize Commercial ROI
Smarter CRO Real World Evidence & Connected Health
Technology-Enabled Commercial Operations
• Equipping therapeutic, scientific, and domain experts from the world’s largest CRO with industry-leading data and information
• Designing better trials and driving speed and precision in site identification, recruitment, and trial execution
• Creating a full lifecycle evidence generation partner
• Downstream tools, and advisory services to drive commercial uptake
• Evidence to build connected healthcare across stakeholders
• Driving higher returns on commercial investments through outsourced solutions spanning analytics to ‘feet on the street’ sales execution
Linking R&D to Commercial ExecutionInformation, technology, services
15
At Quintiles, weimprove your probability of success
16
Appendix
17
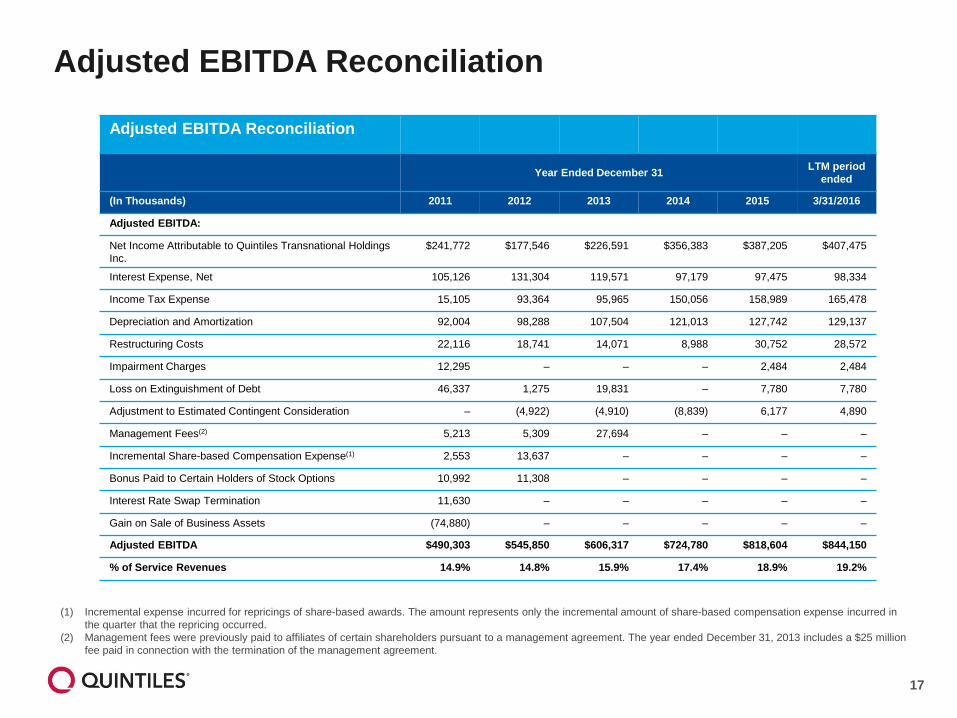
Adjusted EBITDA Reconciliation
Adjusted EBITDA Reconciliation
Year Ended December 31 LTM period ended
(In Thousands) 2011 2012 2013 2014 2015 3/31/2016
Adjusted EBITDA:
Net Income Attributable to Quintiles Transnational Holdings Inc.
$241,772 $177,546 $226,591 $356,383 $387,205 $407,475
Interest Expense, Net 105,126 131,304 119,571 97,179 97,475 98,334
Income Tax Expense 15,105 93,364 95,965 150,056 158,989 165,478
Depreciation and Amortization 92,004 98,288 107,504 121,013 127,742 129,137
Restructuring Costs 22,116 18,741 14,071 8,988 30,752 28,572
Impairment Charges 12,295 – – – 2,484 2,484
Loss on Extinguishment of Debt 46,337 1,275 19,831 – 7,780 7,780
Adjustment to Estimated Contingent Consideration – (4,922) (4,910) (8,839) 6,177 4,890
Management Fees(2) 5,213 5,309 27,694 – – –
Incremental Share-based Compensation Expense(1) 2,553 13,637 – – – –
Bonus Paid to Certain Holders of Stock Options 10,992 11,308 – – – –
Interest Rate Swap Termination 11,630 – – – – –
Gain on Sale of Business Assets (74,880) – – – – –
Adjusted EBITDA $490,303 $545,850 $606,317 $724,780 $818,604 $844,150
% of Service Revenues 14.9% 14.8% 15.9% 17.4% 18.9% 19.2%
(1) Incremental expense incurred for repricings of share-based awards. The amount represents only the incremental amount of share-based compensation expense incurred in the quarter that the repricing occurred.
(2) Management fees were previously paid to affiliates of certain shareholders pursuant to a management agreement. The year ended December 31, 2013 includes a $25 million fee paid in connection with the termination of the management agreement.
18
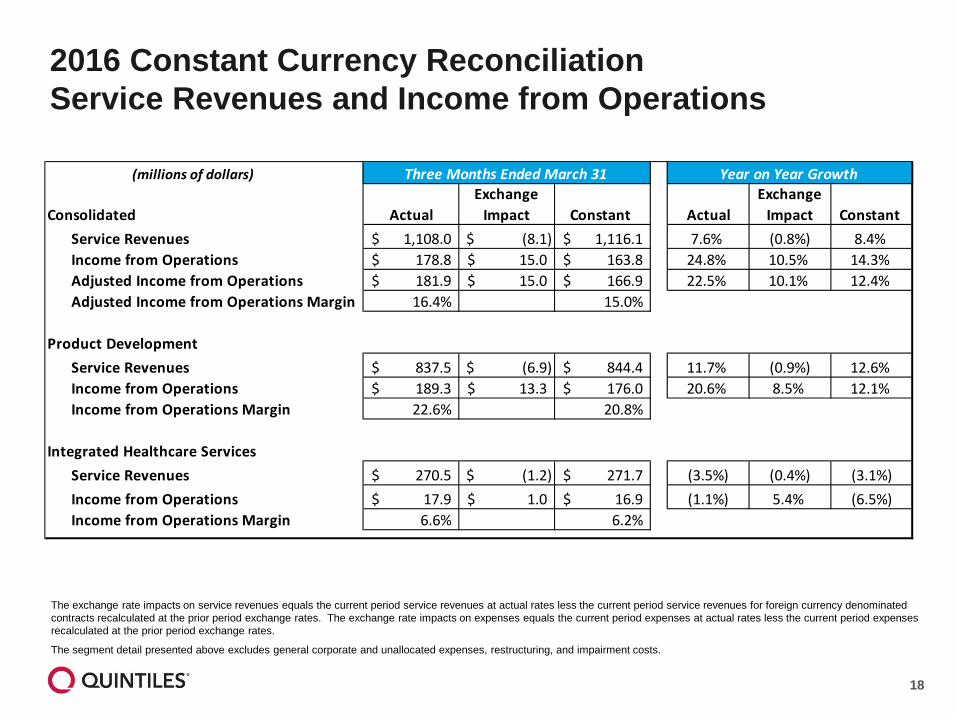
The exchange rate impacts on service revenues equals the current period service revenues at actual rates less the current period service revenues for foreign currency denominated contracts recalculated at the prior period exchange rates. The exchange rate impacts on expenses equals the current period expenses at actual rates less the current period expenses recalculated at the prior period exchange rates.
The segment detail presented above excludes general corporate and unallocated expenses, restructuring, and impairment costs.
2016 Constant Currency ReconciliationService Revenues and Income from Operations
(millions of dollars)
Consolidated ActualExchange
Impact Constant ActualExchange
Impact Constant Service Revenues 1,108.0$ (8.1)$ 1,116.1$ 7.6% (0.8%) 8.4%Income from Operations 178.8$ 15.0$ 163.8$ 24.8% 10.5% 14.3%Adjusted Income from Operations 181.9$ 15.0$ 166.9$ 22.5% 10.1% 12.4%Adjusted Income from Operations Margin 16.4% 15.0%
Product DevelopmentService Revenues 837.5$ (6.9)$ 844.4$ 11.7% (0.9%) 12.6%Income from Operations 189.3$ 13.3$ 176.0$ 20.6% 8.5% 12.1%Income from Operations Margin 22.6% 20.8%
Integrated Healthcare ServicesService Revenues 270.5$ (1.2)$ 271.7$ (3.5%) (0.4%) (3.1%)Income from Operations 17.9$ 1.0$ 16.9$ (1.1%) 5.4% (6.5%)Income from Operations Margin 6.6% 6.2%
Three Months Ended March 31 Year on Year Growth
19
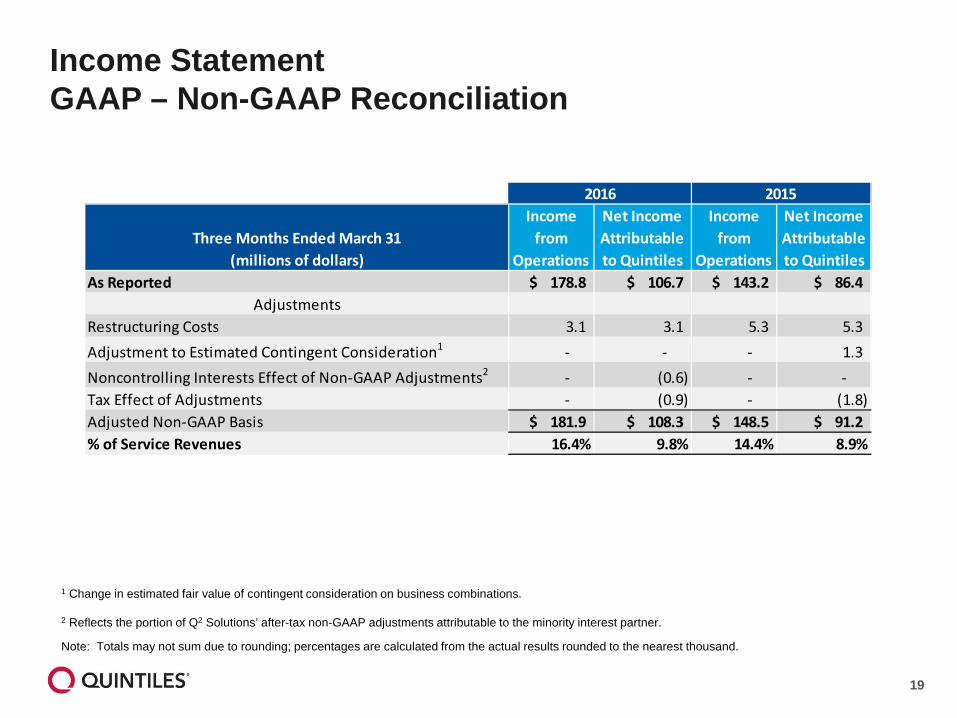
1 Change in estimated fair value of contingent consideration on business combinations.
2 Reflects the portion of Q2 Solutions’ after-tax non-GAAP adjustments attributable to the minority interest partner.
Note: Totals may not sum due to rounding; percentages are calculated from the actual results rounded to the nearest thousand.
Income StatementGAAP – Non-GAAP Reconciliation
Three Months Ended March 31(millions of dollars)
Income from
Operations
Net Income Attributable to Quintiles
Income from
Operations
Net Income Attributable to Quintiles
As Reported $ 178.8 $ 106.7 $ 143.2 $ 86.4Adjustments
Restructuring Costs 3.1 3.1 5.3 5.3 Adjustment to Estimated Contingent Consideration1 - - - 1.3 Noncontrolling Interests Effect of Non-GAAP Adjustments2 - (0.6) - - Tax Effect of Adjustments - (0.9) - (1.8) Adjusted Non-GAAP Basis $ 181.9 $ 108.3 $ 148.5 $ 91.2% of Service Revenues 16.4% 9.8% 14.4% 8.9%
2016 2015
20
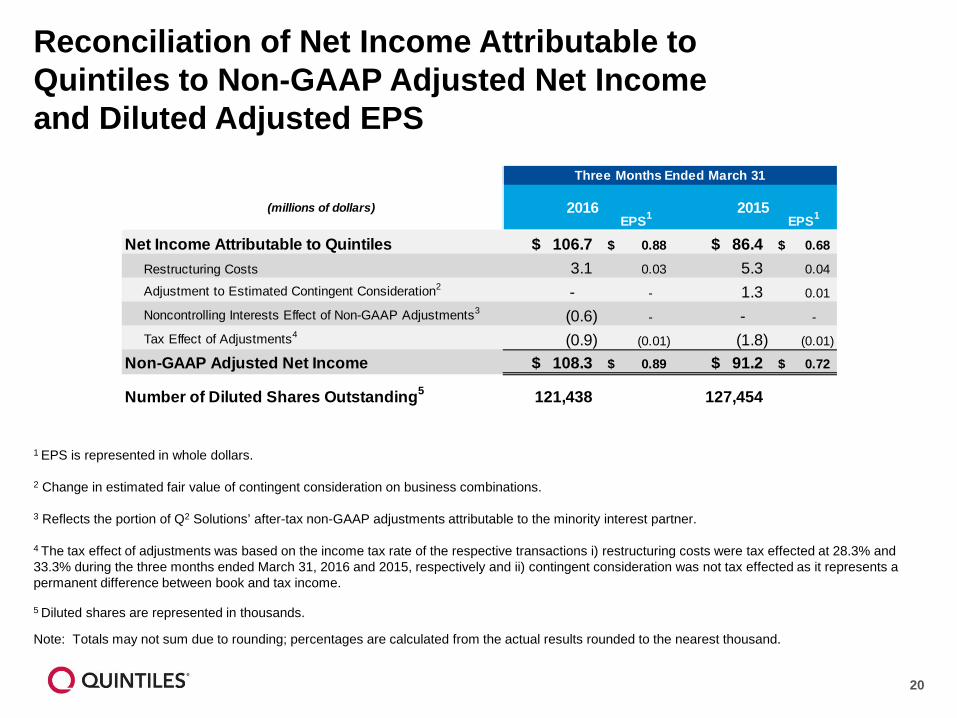
Reconciliation of Net Income Attributable to Quintiles to Non-GAAP Adjusted Net Income and Diluted Adjusted EPS
1 EPS is represented in whole dollars.
2 Change in estimated fair value of contingent consideration on business combinations.
3 Reflects the portion of Q2 Solutions’ after-tax non-GAAP adjustments attributable to the minority interest partner.
4 The tax effect of adjustments was based on the income tax rate of the respective transactions i) restructuring costs were tax effected at 28.3% and 33.3% during the three months ended March 31, 2016 and 2015, respectively and ii) contingent consideration was not tax effected as it represents a permanent difference between book and tax income.
5 Diluted shares are represented in thousands.
Note: Totals may not sum due to rounding; percentages are calculated from the actual results rounded to the nearest thousand.
(millions of dollars) 2016EPS1 2015
EPS1
Net Income Attributable to Quintiles $ 106.7 0.88$ $ 86.4 0.68$
Restructuring Costs 3.1 0.03 5.3 0.04
Adjustment to Estimated Contingent Consideration2 - - 1.3 0.01
Noncontrolling Interests Effect of Non-GAAP Adjustments3 (0.6) - - -
Tax Effect of Adjustments4 (0.9) (0.01) (1.8) (0.01)
Non-GAAP Adjusted Net Income $ 108.3 0.89$ $ 91.2 0.72$
Number of Diluted Shares Outstanding5 121,438 127,454
Three Months Ended March 31
21
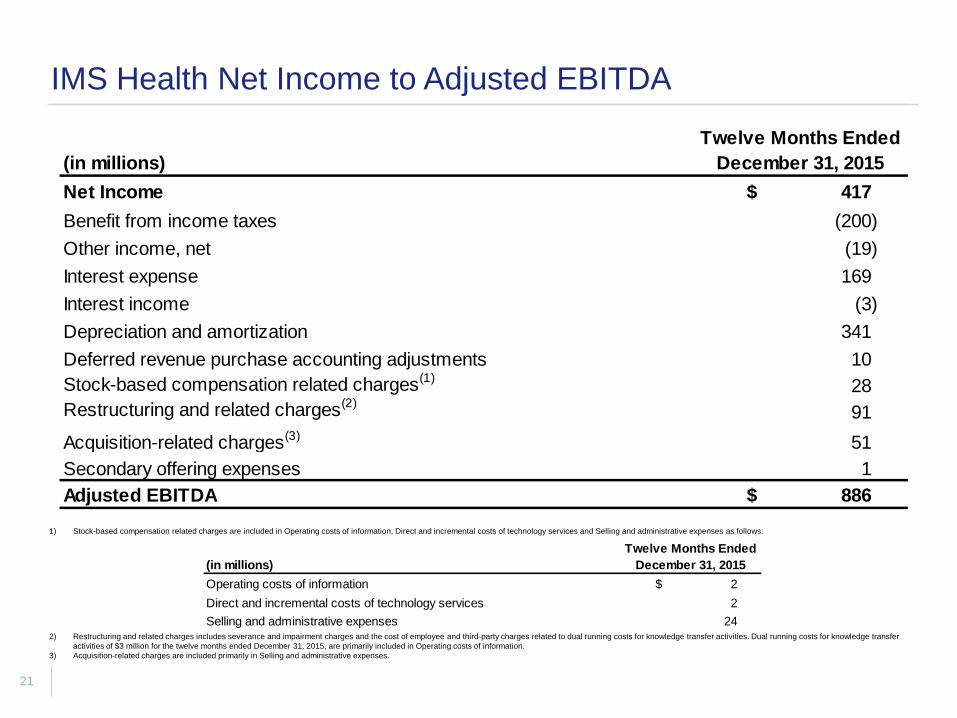
1) Stock-based compensation related charges are included in Operating costs of information, Direct and incremental costs of technology services and Selling and administrative expenses as follows:
2) Restructuring and related charges includes severance and impairment charges and the cost of employee and third-party charges related to dual running costs for knowledge transfer activities. Dual running costs for knowledge transfer activities of $3 million for the twelve months ended December 31, 2015, are primarily included in Operating costs of information.
3) Acquisition-related charges are included primarily in Selling and administrative expenses.
IMS Health Net Income to Adjusted EBITDA
(in millions)Net Income $ 417Benefit from income taxes (200)Other income, net (19)Interest expense 169Interest income (3)Depreciation and amortization 341Deferred revenue purchase accounting adjustments 10Stock-based compensation related charges(1) 28Restructuring and related charges(2) 91Acquisition-related charges(3) 51Secondary offering expenses 1Adjusted EBITDA $ 886
Twelve Months EndedDecember 31, 2015
(in millions)Operating costs of information $ 2Direct and incremental costs of technology services 2Selling and administrative expenses 24
Twelve Months EndedDecember 31, 2015