Embed Size (px)
Citation preview

JERASH HOLDINGS (US), INC.
Premium Global Garment Manufacturing
November 2018

02
FORWARD-LOOKING STATEMENTS
This document contains forward-looking statements within the
meaning of the U.S. Private Securities Litigation Reform Act of 1995,
including statements relating to earnings expectations. The terms and
phrases “commitment”, “guidance”, “expects”, “would”, “will”, “continuing”,
”drive”, “’’believes”, “indicate”, “look forward’, “grow’”, “outlook”,
“forecasts”, and similar terms and phrases are intended to identify these
forward-looking statements. Forward-looking statements are based on
estimates and assumptions made by Jerash Holdings in light of its
experience and its perception of historical trends, current conditions and
expected future developments, as well as other factors that Jerash
believes are appropriate in the circumstances, including but not limited to
general economic conditions, expectations regarding business
performance, strategy and prospects, and confidence in the cash flow
generation or profitability.
Many factors could cause Jerash’s actual results, performance or
achievements to differ materially from those expressed or implied by the
forward-looking statements, including, without limitation: risks related to
competition; reliance on key personnel; ability to maintain and enhance its
brand; and difficulties in forecasting financial results, particularly over
longer periods, competition and product life cycles. These risk factors and
others relating to Jerash that may cause actual results to differ are set
forth in periodic filings with the U.S. Securities and Exchange Commission,
copies of which may be obtained at www.sec.gov. These factors should be
considered carefully, and readers should not place undue reliance on
forward-looking statements. Jerash has no intention and undertakes no
obligation to update or revise any forward-looking statements, whether as
a result of new information, future events or otherwise, except as required
by law.
This document contains disclosure regarding adjusted net income, adjusted net income per share, adjusted EBITDA and adjusted EBITDA per share,
which are determined by methods other than in accordance with U.S. generally accepted accounting principles (“GAAP”). These non-GAAP measures
provide supplemental information that may help investors to analyze our net income without regard to the effects of income tax expense and one-
time non-cash stock-based compensation. Non-GAAP financial measures have inherent limitations and are not uniformly applied by issuers. Therefore,
these non-GAAP financial measures should not be considered in isolation, or as a substitute for comparable measures prepared in accordance with
GAAP. The comparable GAAP financial measures and reconciliation to the comparable GAAP financial measures can be found in Appendix A to the press
release filed with our Current Report on Form 8-K filed with the SEC on November 8, 2018.

03
WHY JERASHGlobal manufacturer and
exporter of customized,
ready-made knit fabric sport
and outerwear
US & EU tariff-free
production facilities in Jordan
utilized by world-renowned
brands and retailers
21
Positioned for organic growth
from current accounts,
maximizing utilization with
new customers, and strategic
transactions
43 History of growth and
profitability with FY2019
outlook calling for 15-18%
organic growth

04
WHY JORDANStable US ally, central to
middle eastern peace
More than $1.3 billion in US aid
payments annually
Global crossroads for highly skilled,
low cost imported workforce
Favorable trade agreements
with US and EU
Manufacturing focused
national economy
Recognized by world-
renowned brands and retailers

05
FINANCIAL OVERVIEW
JERASH HOLDINGS (US), INC. NASDAQ: JRSH
Shares Outstanding: 11.3 million
Market Cap: (As of November 9, 2018) $88.9 million
Insider Ownership: 82%
Cash and Restricted Cash: (At September 30, 2018) $30.4 million
Long-term Debt: $0
FY2018 Revenue: $69.3 million, +12% YoY
FY2018 Adj Net Income1, Adj EPS1: $10.5 million, $1.08 per share
Revenue Outlook: $80-82 million, +15-18% YoY
Fiscal Year: March 31
Market capitalization based on share price as of November 9, 2018 close. 1. Based on 9,735,651 average shares outstanding pre-IPO. Adjustment reflects add back of tax and stock based compensation for comparability purposes. A reconciliation is provided in the most recent quarterly results press release.

DIVERSEGROWTH DRIVERS
06
Strong organic trend: growing
orders from current and new
top global brand customers
1 Diversifying customer base
and increasing warm weather
seasonal line utilization
2
3 Build or buy additional
capacity and capabilities:
▪ Line expansion and new
capabilities at existing
factories
▪ Acquire or build additional
facilities in Jordan or
globally
Fiscal 2019 Outlook:
▪ Revenue $80-82M1,
reported $51.8 million
through first six months
▪ Multiple new contracts
with additional brands,
expanded capacity
4
1. Based on company guidance of FY2019 revenue of $80 million to $82 million as of November 8, 2018 and is not being confirmed or updated.

JERASH HAS LONG-STANDING RELATIONSHIPS WITH
TOP GLOBAL BRANDS
07
Growing demand from global customer base

LARGE AND UNTAPPED TOTAL ADDRESSABLE MARKET
FOR U.S AND GLOBAL GROWTH
Growing demand from global customer base
08

8%PANTS & SHORTS
48%JACKET
09
Product sales by type for fiscal year ended 2018
(% of total pieces)
DIVERSIFYINGPRODUCT OFFERINGS
34%CREW NECKS
10%POLO

10
DIVERSIFYINGPRODUCT OFFERINGSSeasonality of Products
(% of total revenue)
1H 2H
62%38%
2019E61%39%
2017$62,041 $69,296 71%29%
2018$80,000+1
1H 2H
1. Based on company guidance of FY2019 revenue of $80 million to $82 million as of November 8, 2018 and is not being confirmed or updated.
11
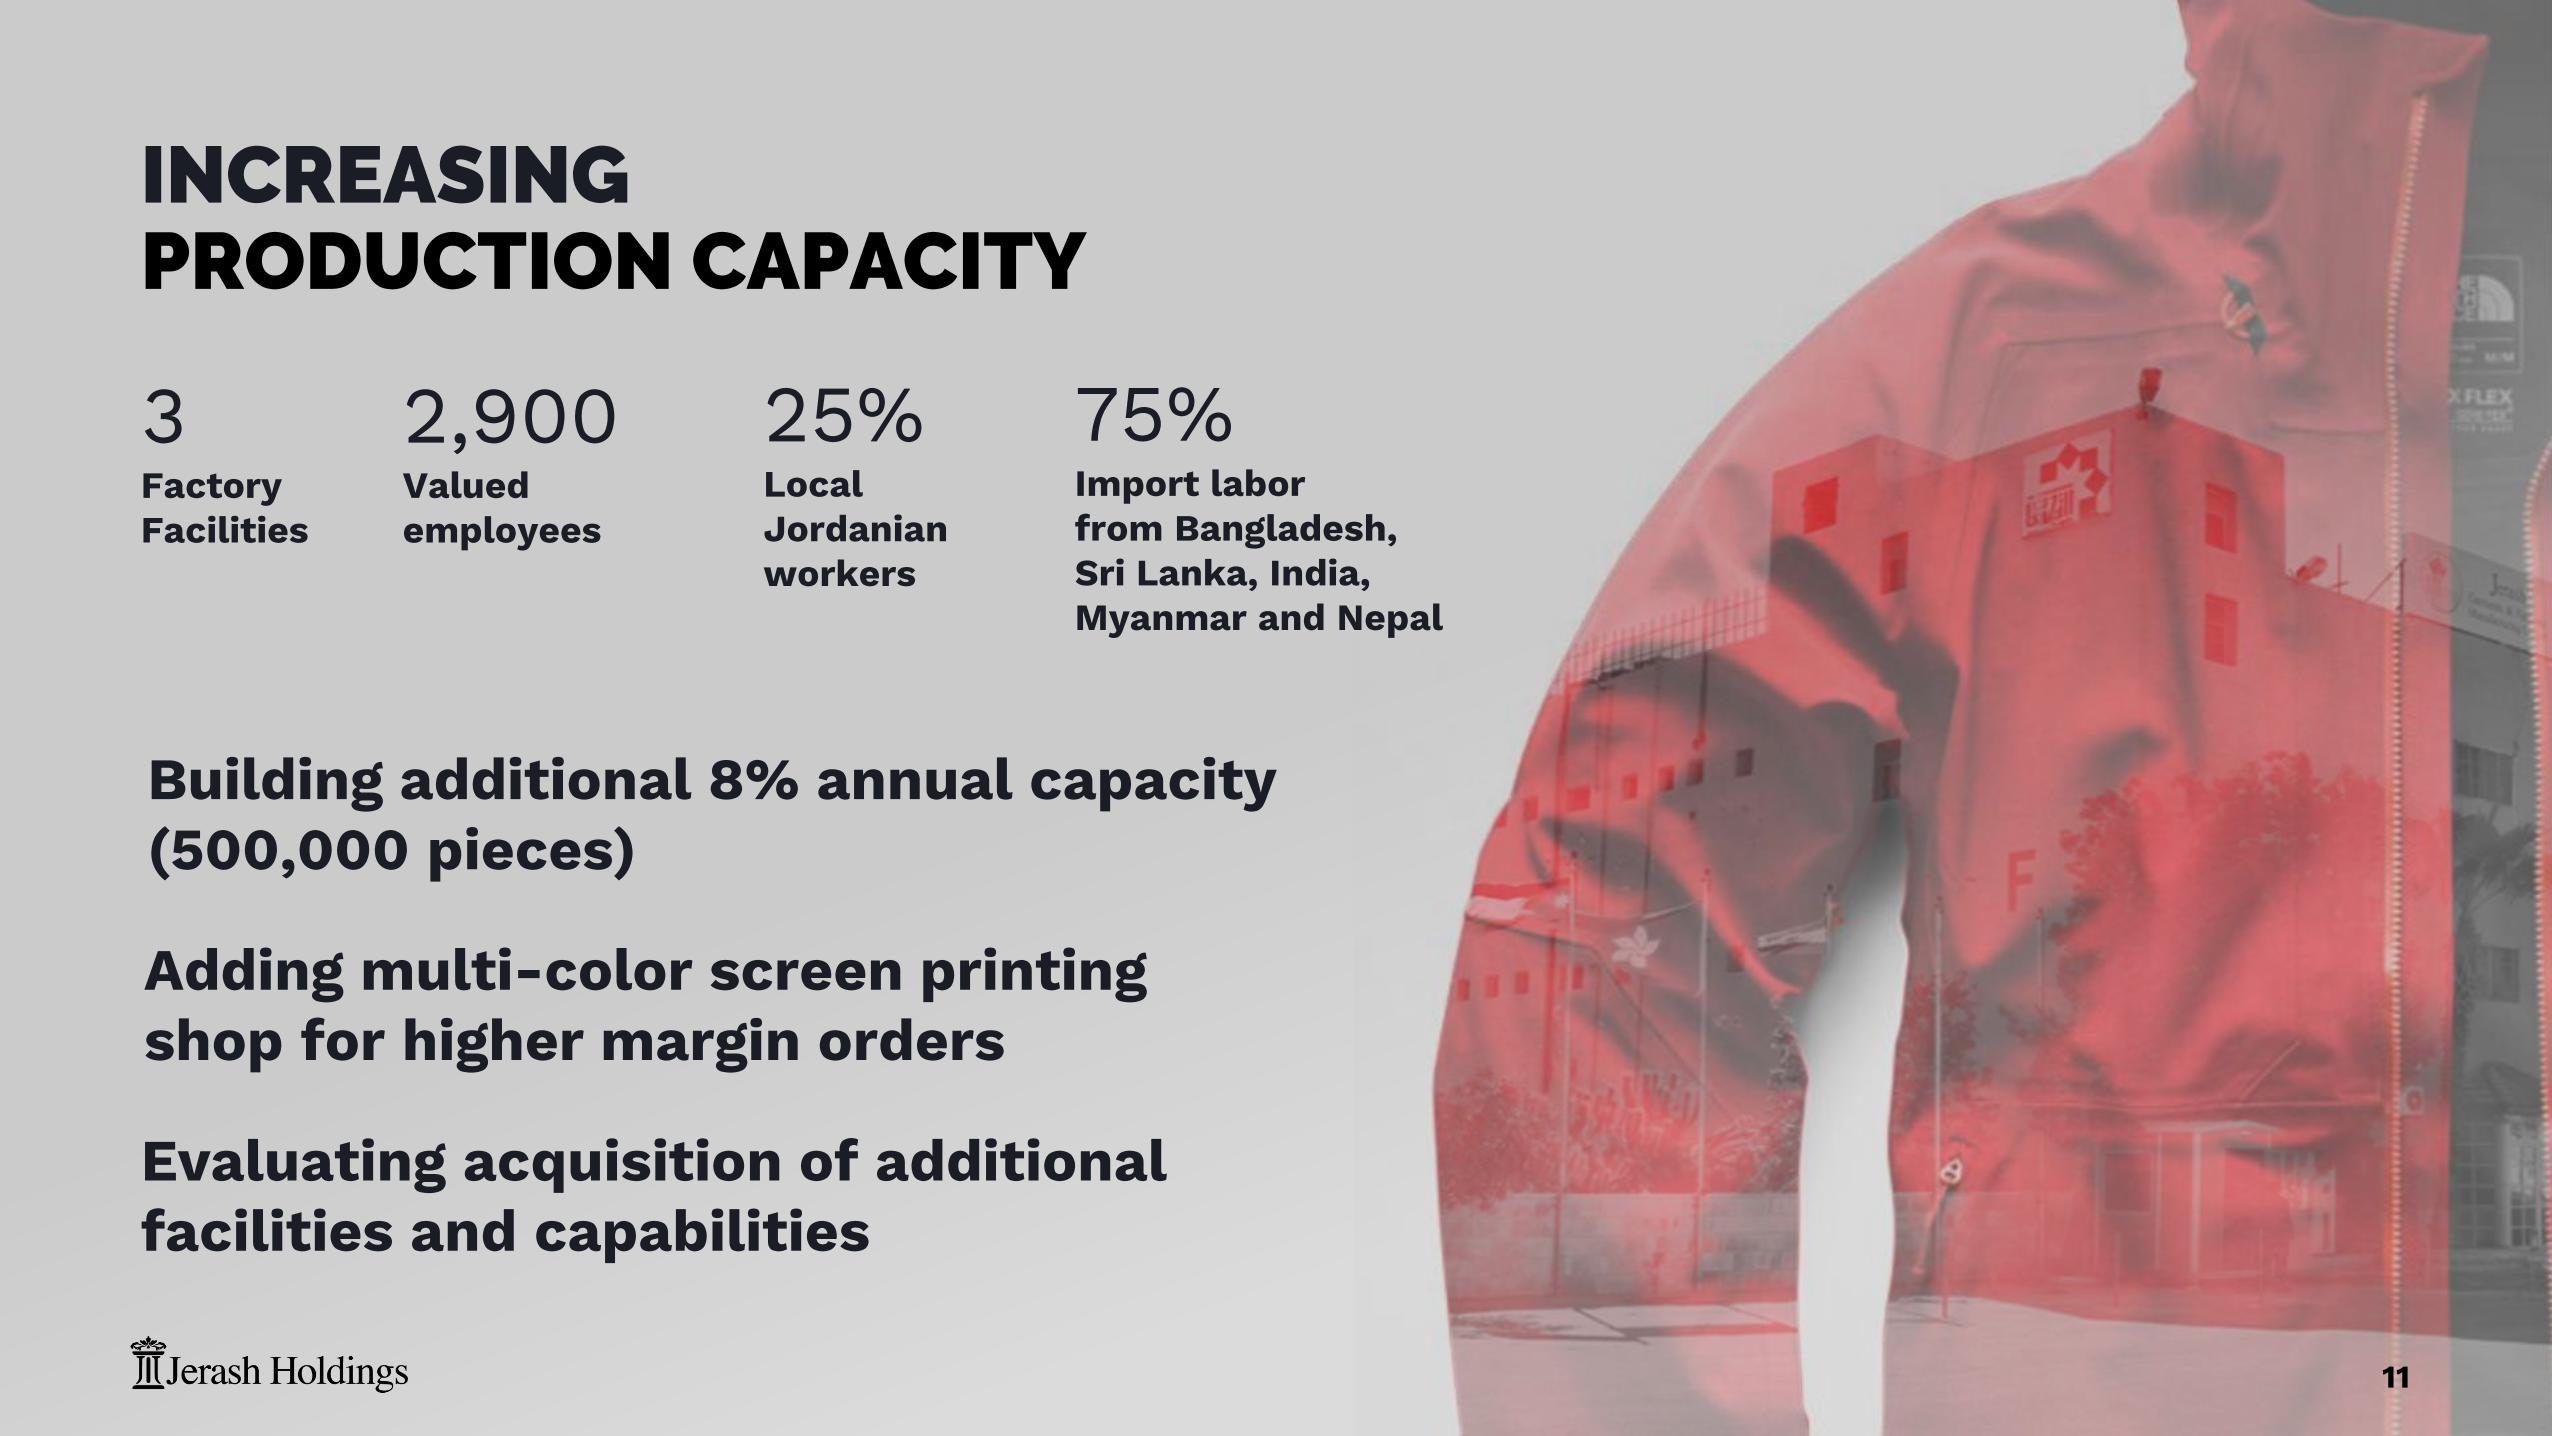
INCREASINGPRODUCTION CAPACITY
2,900Valued employees
3FactoryFacilities
25%Local Jordanian workers
75%Import labor from Bangladesh, Sri Lanka, India, Myanmar and Nepal
Building additional 8% annual capacity (500,000 pieces)
Adding multi-color screen printing shop for higher margin orders
Evaluating acquisition of additional facilities and capabilities

RAPID DEMAND GROWTHDRIVES CAPACITY EXPANSION
▪ Increased demand from current
customers▪ Indications for expanded capacity
▪ Shifting more production to Jordan
▪ Tariff concerns, labor arbitrage
increasing demand
▪ Rapidly rising interest from new
customers▪ Seeking proven high quality, low duty
manufacturers
▪ Moving production out of China, other
locations, to Jordan
3 Current Factories
Build New Facilities
Expand Facilities
Acquire Similar
Facilities
Contract Capacity
Joint Ventures
Acquire New
Categories
Acquire Foreign Facilities
12

RECOGNIZEDGLOBAL SOCIAL RESPONSIBILITY
13
▪ Worldwide Responsible Accredited Production
▪ C-TPAT certified facility
▪ Facility is monitored and supervised by Better Work Jordan,
an audit wing of International Labor Organization (ILO) and
International Finance Corporation (IFC) for social & ethical
compliance.
▪ Golden Listed Company – certification by Jordan Ministry of
Labor
▪ Certified for the Supplier Qualification Program (SQP)
▪ Approved FCCA for Walmart
▪ Audited by the FLA ( Fair Labor Association) for PVH
▪ Passed the C-TPAT audit for Wal-Mart conducted by BV
▪ Recognized as first Jordanian company proactively hiring
Syrian refugees

SOCIALLY RESPONSIBLECAPACITY EXPANSION
14
▪ Partnering with UNHCR and Jordanian
Government to provide quality, long-
term employment options to refugees
▪ Building new first-of-its-kind satellite
sewing factory in proximity to refugee
camp
▪ Providing jobs, transportation and
benefits to camp residents
▪ Jordanian government contributing to
construction capital, wages and social
benefits

15
US QIZ AND EU FTA ADVANTAGES
▪ Established in 2000 under Bill Clinton
▪ Provides for free movement of
industrial goods between Jordan and
the USA
▪ Saved $18 million in tariffs for The
North Face brand in last fiscal year
UNITED STATES QUALIFYINGINDUSTRIAL ZONE1
▪ Established in 2002, updated 2018
▪ Provides for free movement of
industrial goods between Jordan and
the EU
▪ Strategic opportunity to grow non-
US sales
EUROPEAN UNION FREE TRADE AREA2
1. For additional information: http://web.ita.doc.gov/tacgi/fta.nsf/7a9d3143265673ee85257a0700667a6f/196ed79f4f79ac0085257a070066961d
2. For additional information: http://ec.europa.eu/trade/policy/countries-and-regions/countries/jordan/
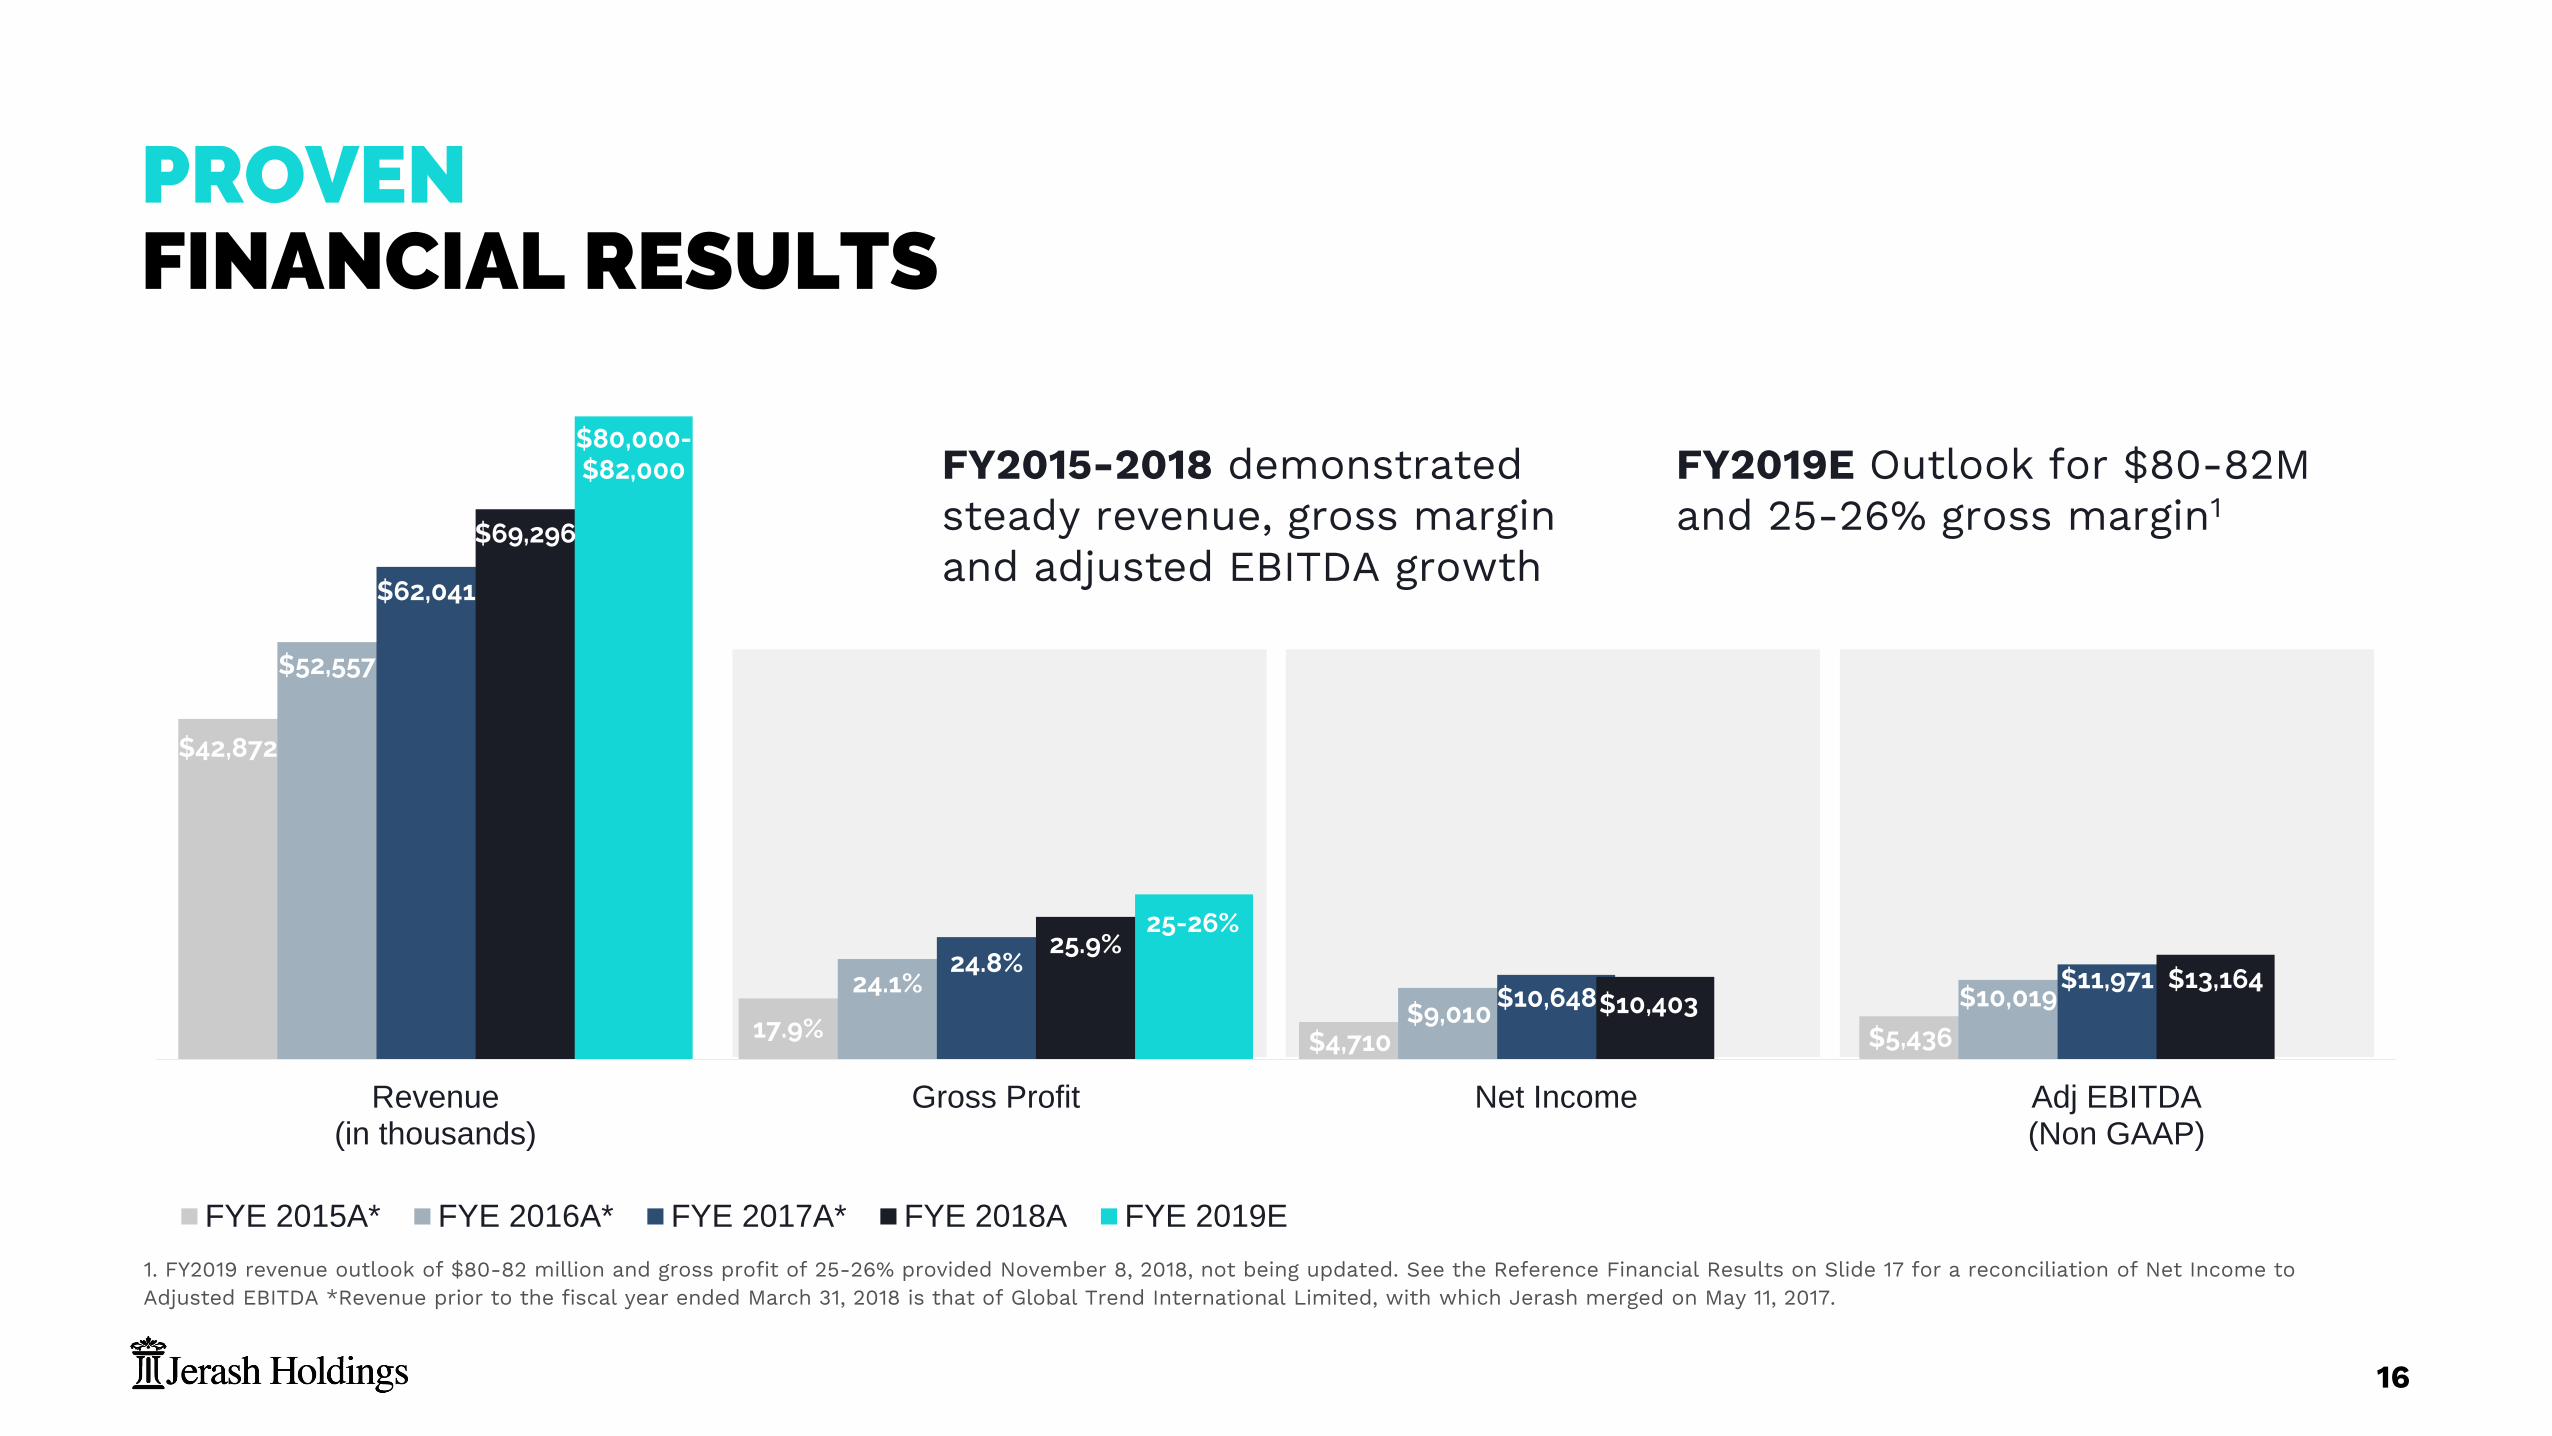
$42,872
17.9% $4,710 $5,436
$52,557
24.1%$9,010
$10,019
$62,041
24.8%$10,648
$11,971
$69,296
25.9%
$10,403$13,164
$80,000-$82,000
25-26%
Revenue(in thousands)
Gross Profit Net Income Adj EBITDA(Non GAAP)
FYE 2015A* FYE 2016A* FYE 2017A* FYE 2018A FYE 2019E
(Projected)
16
PROVENFINANCIAL RESULTS
FY2015-2018 demonstrated steady revenue, gross margin and adjusted EBITDA growth
1. FY2019 revenue outlook of $80-82 million and gross profit of 25-26% provided November 8, 2018, not being updated. See the Reference Financial Results on Slide 17 for a reconciliation of Net Income to Adjusted EBITDA *Revenue prior to the fiscal year ended March 31, 2018 is that of Global Trend International Limited, with which Jerash merged on May 11, 2017.
FY2019E Outlook for $80-82M and 25-26% gross margin1

RECORD FISCAL 2Q19 RESULTS
17
▪ Record $33.5 million revenue, +21.5% year-over-year, exceeding guidance of $32 million
▪ GAAP net income $4.6 million, $0.41 per share
▪ Includes $0.2 million stock-based compensation, $1.5 million of income tax reserves
▪ Adjusted EBITDA of $6.6 million, or $0.59 per share
▪ Announced $0.20 per share annual dividend, payable quarterly

REFERENCEFINANCIAL RESULTS
FY 20181st Qtr 2nd Qtr 3rd Qtr 4th Qtr YTD
$000's 6/30 9/30 12/31 3/31ActualRevenue $21,350 $27,549 $11,544 $8,853 $69,296 Gross Profit 22.7% 26.2% 32.5% 24.1% 25.9%Net Income (Loss) $3,429 $5,752 $2,207 $(985) $10,403 AdjustedAdd back income taxes - - - 1,400 1,400 Add back interest expense - - 4 23 27 Add back depreciation and amortization 288 300 311 318 1,217 Add back stock based compensation 117 - - - 117 Adjusted EBITDA $3,834 $6,057 $2,510 $2,189 $14,590
FY 2019ActualRevenue $18,363 $33,464 $51,827Gross Profit 25.4% 24.9% 25.1%Net Income (Loss) $(885) $4,587 $3,702AdjustedAdd back income taxes 366 1,463 1,829Add back interest expense 43 43 86Add back depreciation and amortization 319 335 654Add back stock based compensation 3,206 194 3,400Adjusted EBITDA $3,049 $6,622 $9,671
18

(in thousands) Sept 30, 2018 March 31, 2018
Cash and Restricted Cash $30,460 $12,196
Accounts Receivable 15,688 5,297
Inventories 8,742 20,293
Property, Plant & Equipment 2,864 2,820
Total Assets $58,892 $43,268
Credit Facilities $2,155 $980
Accounts Payable 1,716 4,777
Income Tax Payable 1,463 879
Total Liabilities $9,102 $9,211
Shareholders’ Equity $49,480 $33,747
Liabilities and Shareholders’ Equity $58,892 $43,268
19
STRONGBALANCE SHEET
1. For additional information…
2. For additional information: http://ec.europa.eu/trade/policy/countries-and-regions/countries/jordan/
Jerash has $30.5
million in cash
and restricted
cash with a
strong balance
sheet to fuel
strategic growth.

Deep Value Opportunity
20
Company Ticker P/E EV/Revenue(1) EV/EBITDA(1) EV/Net Income(1)
Trailing Forward 2017E 2018E 2017E 2018E 2017E 2018E
Universe
Delta Apparel Inc DLA 11.7x 11.0x 0.6x 0.6x 10.2x 8.0x 11.4x NA
Differential Brands Group Inc DFBG NULL NaN 1.0x 0.9x 22.5x 12.3x NA NA
Ever-Glory International Group Inc EVK NULL NaN 0.1x NA 1.4x NA NA NA
Superior Group of Companies Inc SGC 19.0x 18.3x 1.7x 1.2x 15.2x 13.3x 17.1x 17.9x
Oxford Industries Inc OXM 27.3x 20.1x 1.6x 1.4x 13.1x 11.4x 29.3x 20.3x
Lakeland Industries Inc LAKE 9.8x 13.4x 1.0x 0.9x 10.2x 8.0x 10.2x 13.4x
Sequential Brands Group Inc SQBG NULL 3.8x 4.8x 4.4x 8.7x 7.9x NA 3.8x
VF Corp VFC 28.8x 25.4x 13.1x 2.8x NA 18.5x 141.7x 25.2x
PVH Corp PVH 25.6x 16.7x 1.7x 1.5x 13.8x 11.6x 32.8x 16.7x
Destination XL Group Inc DXLG NULL NaN 0.4x NA 9.3x 7.0x NA NA
Limoneira Co LMNR 38.2x 35.8x 4.5x 3.1x 29.8x 23.6x 65.7x 38.5x
Landec Corp LNDC 54.2x 36.3x 0.8x 0.8x 15.7x 16.4x 36.4x 35.1x
Clarus Corp CLAR NULL 17.6x 1.6x 1.2x 96.8x 16.8x NA 16.5x
Average(1) 2.5x 1.7x 20.6x 12.9x 43.1x 20.8x
Median(1) 1.6x 1.2x 13.5x 12.0x 31.1x 17.9x
1. Based on prices reflected in Thomson First Call as of July 31, 2018

21
Fully integrated global
manufacturer
▪ Comprehensive production
capabilities capture value from
entire manufacturing chain
▪ Dedicated to high levels of
quality control and international
manufacturing standards
Growth drivers
in place
▪ Profitable company with
established strong organic
growth
▪ Free-trade zone location allows
sales to the U.S. and EU without
tariff or quota restrictions
Increasing financial
returns
▪ Proven operating metrics drive
increased profitability
▪ Factory expansion to increase
capacity, capabilities for
expected growth
▪ Evaluating strategic
opportunities to accelerate
profit growth
CREATINGSHAREHOLDER VALUE

22
CONTACTS
(315) 727-6791
RICHARD J. SHAW
(214) 597-8200
MATT KREPSChief Financial Officer Darrow Associates Investor Relations