Embed Size (px)
Citation preview

JERSEY CENTRAL POWER & LIGHT COMPANY
2005 ANNUAL REPORT TO STOCKHOLDERS Jersey Central Power & Light Company is a wholly owned electric utility operating subsidiary of FirstEnergy Corp. It engages in the distribution and sale of electric energy in an area of approximately 3,300 square miles in New Jersey. It also engages in the sale, purchase and interchange of electric energy with other electric companies. The area it serves has a population of approximately 2.5 million. Contents Page Glossary of Terms i-ii Report of Independent Registered Public Accounting Firm 1 Selected Financial Data 2 Management's Discussion and Analysis 3-14 Consolidated Statements of Income 15 Consolidated Balance Sheets 16 Consolidated Statements of Capitalization 17 Consolidated Statements of Common Stockholder's Equity 18 Consolidated Statements of Preferred Stock 18 Consolidated Statements of Cash Flows 19 Consolidated Statements of Taxes 20 Notes to Consolidated Financial Statements 21-40

i
GLOSSARY OF TERMS The following abbreviations and acronyms are used in this report to identify Jersey Central Power & Light Company and its affiliates: ATSI American Transmission Systems, Inc., owns and operates transmission facilities CEI The Cleveland Electric Illuminating Company, an affiliated Ohio electric utility Companies OE, CEI, TE, Penn, JCP&L, Met-Ed and Penelec FES FirstEnergy Solutions Corp., provides energy-related products and services FESC FirstEnergy Service Company, provides legal, financial, and other corporate support services FirstEnergy FirstEnergy Corp., a public utility holding company GPU GPU, Inc., former parent of JCP&L, Met-Ed and Penelec, which merged with FirstEnergy on
November 7, 2001 GPUS GPU Service Company, previously provided corporate support services JCP&L Jersey Central Power & Light Company JCP&L Transition JCP&L Transition Funding LLC, a Delaware limited liability company and issuer of transition
Bonds Met-Ed Metropolitan Edison Company, an affiliated Pennsylvania electric utility NGC FirstEnergy Nuclear Generation Corp., owns nuclear generating facilities OE Ohio Edison Company, an affiliated Ohio electric utility Ohio Companies CEI, OE and TE Penelec Pennsylvania Electric Company, an affiliated Pennsylvania electric utility Penn Pennsylvania Power Company, an affiliated Pennsylvania electric utility TE The Toledo Edison Company, an affiliated Ohio electric utility The following abbreviations and acronyms are used to identify frequently used terms in this report: AOCL Accumulated Other Comprehensive Loss APB Accounting Principles Board APB 29 APB Opinion No. 29, "Accounting for Stock Issued to Employees" ARB Accounting Research Bulletin ARB 43 ARB No. 43, "Restatement and Revision of Accounting Research Bulletins" ARO Asset Retirement Obligation BGS Basic Generation Service CTC Competitive Transition Charge ECAR East Central Area Reliability Coordination Agreement EITF Emerging Issues Task Force EITF 03-1 EITF Issue No. 03-1, "The Meaning of Other-Than-Temporary and Its Application to Certain
Investments” EITF 04-13 EITF Issue No. 04-13, "Accounting for Purchases and Sales of Inventory with the Same
Counterparty EPACT Energy Policy Act of 2005 FASB Financial Accounting Standards Board FERC Federal Energy Regulatory Commission FIN 46R FASB Interpretation (revised December 2003), "Consolidation of Variable Interest Entities" FIN 47 FIN 47, "Accounting for Conditional Asset Retirement Obligations – an interpretation of FASB
Statement No. 143" FMB First Mortgage Bonds FSP FASB Staff Position FSP 106-1 FASB Staff Position No.106-1, "Accounting and Disclosure Requirements Related to the Medicare
Prescription Drug, Improvement and Modernization Act of 2003" FSP 106-2 FASB Staff Position No. 106-2, "Accounting and Disclosure Requirements Related to the
Medicare Prescription Drug, Improvement and Modernization Act of 2003" FSP 115-1 and FAS 124-1
FASB Staff Position No. 115-1 and FAS 124-1, "The Meaning of Other-Than-Temporary Impairment and its Application to Certain Investments"
GAAP Accounting Principles Generally Accepted in the United States IRS Internal Revenue Service KWH Kilowatt-hours Medicare Act Medicare Prescription Drug, Improvement and Modernization Act of 2003 MISO Midwest Independent Transmission System Operator, Inc. Moody’s Moody’s Investors Service

GLOSSARY OF TERMS Cont'd.
ii
MTC Market Transition Charge MW Megawatts NERC North American Electric Reliability Council NJBPU New Jersey Board of Public Utilities NUG Non-Utility Generation OCI Other Comprehensive Income OPEB Other Post-Employment Benefits PJM PJM Interconnection L.L.C. PRP Potentially Responsible Party PUCO Public Utilities Commission of Ohio PUHCA Public Utility Holding Company Act S&P Standard & Poor’s Ratings Service SBC Societal Benefits Charge SEC United States Securities and Exchange Commission SFAC Statement of Financial Accounting Concepts SFAC 7 SFAC No. 7, "Using Cash Flow Information and Present Value in Accounting Measurements" SFAS Statement of Financial Accounting Standards SFAS 71 SFAS No. 71, "Accounting for the Effects of Certain Types of Regulation" SFAS 87 SFAS No. 87, "Employers' Accounting for Pensions" SFAS 101 SFAS No. 101, "Accounting for Discontinuation of Application of SFAS 71" SFAS 106 SFAS No. 106, "Employers' Accounting for Postretirement Benefits Other Than Pensions" SFAS 115 SFAS No. 115, "Accounting for Certain Investments in Debt and Equity Securities" SFAS 133 SFAS No. 133, “Accounting for Derivative Instruments and Hedging Activities” SFAS 142 SFAS No. 142, "Goodwill and Other Intangible Assets" SFAS 143 SFAS No. 143, "Accounting for Asset Retirement Obligations" SFAS 144 SFAS No. 144, "Accounting for the Impairment or Disposal of Long-Lived Assets" SFAS 151 SFAS No. 151, "Inventory Costs – an amendment of ARB No. 43, Chapter 4" SFAS 153 SFAS No. 153, "Exchanges of Nonmonetary Assets – an amendment of APB Opinion No. 29" SFAS 154 SFAS No. 154, "Accounting Changes and Error Corrections – a replacement of APB Opinion No.
20 and FASB Statement No. 3" TBC Transition Bond Charge TMI-1 Three Mile Island Unit 1 TMI-2 Three Mile Island Unit 2 VIE Variable Interest Entity

1
Report of Independent Registered Public Accounting Firm
To the Stockholder and Board of Directors of Jersey Central Power & Light Company: In our opinion, the accompanying consolidated balance sheets and the related consolidated statements of income, capitalization, common stockholder’s equity, preferred stock, cash flows and taxes present fairly, in all material respects, the financial position of Jersey Central Power & Light Company and its subsidiaries at December 31, 2005 and 2004, and the results of their operations and their cash flows for each of the three years in the period ended December 31, 2005 in conformity with accounting principles generally accepted in the United States of America. These financial statements are the responsibility of the Company’s management. Our responsibility is to express an opinion on these financial statements based on our audits. We conducted our audits of these statements in accordance with the standards of the Public Company Accounting Oversight Board (United States). Those standards require that we plan and perform the audit to obtain reasonable assurance about whether the financial statements are free of material misstatement. An audit includes examining, on a test basis, evidence supporting the amounts and disclosures in the financial statements, assessing the accounting principles used and significant estimates made by management, and evaluating the overall financial statement presentation. We believe that our audits provide a reasonable basis for our opinion. As discussed in Note 2(I) to the consolidated financial statements, the Company has restated its previously issued consolidated financial statements for the years ended December 31, 2004 and 2003. PricewaterhouseCoopers LLP Cleveland, Ohio February 27, 2006

2
The following selected financial data should be read in conjunction with, and is qualified in its entirety by reference to, the sections entitled “Management’s Discussion and Analysis of Results of Operations and Financial Condition” and with our consolidated financial statements and the “Notes to Consolidated Financial Statements.” Our Consolidated Statements of Income are not necessarily indicative of future conditions or results of operations.
JERSEY CENTRAL POWER & LIGHT COMPANY
SELECTED FINANCIAL DATARestated * Restated *
Restated * Restated * Restated * Nov 7 - Jan 1-2005 2004 2003 2002 Dec. 31, 2001 Nov. 6, 2001
GENERAL FINANCIAL INFORMATION: (Dollars in thousands)
Operating Revenues 2,602,234$ 2,206,987$ 2,359,646$ 2,328,415$ 282,902$ 1,838,638$
Operating Income 255,676$ 181,816$ 144,606$ 332,953$ 43,347$ 291,049$
Net Income 182,927$ 107,626$ 64,277$ 248,357$ 29,525$ 31,560$
Earnings on Common Stock 182,427$ 107,126$ 64,389$ 249,821$ 28,827$ 27,013$
Total Assets 7,584,106$ 7,296,532$ 7,583,361$ 8,062,148$ 8,053,295$
CAPITALIZATION AS OF DECEMBER 31:Common Stockholder’s Equity 3,210,763$ 3,143,554$ 3,146,180$ 3,270,014$ 3,163,185$ Preferred Stock-
Not Subject to Mandatory Redemption 12,649 12,649 12,649 12,649 12,649 Subject to Mandatory Redemption - - - - 44,868
Company-Obligated MandatorilyRedeemable Preferred Securities - - - 125,244 125,250
Long-Term Debt and Other Long-Term Obligations 972,061 1,238,984 1,095,991 1,210,446 1,224,001 Total Capitalization 4,195,473$ 4,395,187$ 4,254,820$ 4,618,353$ 4,569,953$
CAPITALIZATION RATIOS:Common Stockholder’s Equity 76.5 % 71.5 % 73.9 % 70.8 % 69.2 %Preferred Stock-
Not Subject to Mandatory Redemption 0.3 0.3 0.3 0.3 0.3 Subject to Mandatory Redemption - - - - 1.0
Company-Obligated MandatorilyRedeemable Preferred Securities - - - 2.7 2.7
Long-Term Debt and Other Long-Term Obligations 23.2 28.2 25.8 26.2 26.8 Total Capitalization 100.0 % 100.0 % 100.0 % 100.0 % 100.0 %
DISTRIBUTION KWH DELIVERIES (Millions):Residential 10,107 9,355 9,104 8,976 1,428 7,042 Commercial 9,432 8,877 8,620 8,509 1,330 6,787 Industrial 3,074 3,070 3,046 3,171 474 2,670 Other 86 73 89 81 17 66 Total 22,699 21,375 20,859 20,737 3,249 16,565
CUSTOMERS SERVED:Residential 950,622 941,917 931,227 921,716 909,494 Commercial 117,365 115,861 114,270 112,385 109,985 Industrial 2,640 2,666 2,705 2,759 2,785 Other 1,601 1,320 1,345 1,393 1,484 Total 1,072,228 1,061,764 1,049,547 1,038,253 1,023,748
NUMBER OF EMPLOYEES: 1,416 1,444 1,557 ** ** **
*
** For years prior to 2003 JCP&L's employees were employed by GPU Service Company.
See Note 2(I) to the Consolidated Financial Statements.

3
JERSEY CENTRAL POWER & LIGHT COMPANY
Management’s Discussion and Analysis of Results of Operations and Financial Condition
Forward-looking Statements. This discussion includes forward-looking statements based on information currently available to management. Such statements are subject to certain risks and uncertainties. These statements typically contain, but are not limited to, the terms "anticipate," "potential," "expect," "believe," "estimate" and similar words. Actual results may differ materially due to the speed and nature of increased competition and deregulation in the electric utility industry, economic or weather conditions affecting future sales and margins, changes in markets for energy services, changing energy and commodity market prices, replacement power costs being higher than anticipated or inadequately hedged, the continued ability of our regulated utilities to collect transition and other charges or to recover increased transmission costs, maintenance costs being higher than anticipated, legislative and regulatory changes (including revised environmental requirements), the repeal of PUHCA and the legal and regulatory changes resulting from the implementation of the EPACT, the uncertainty of the timing and amounts of the capital expenditures (including that such amounts could be higher than anticipated) or levels of emission reductions related to the settlement agreement resolving the New Source Review litigation, adverse regulatory or legal decisions and outcomes (including, but not limited to, the revocation of necessary licenses or operating permits, fines or other enforcement actions and remedies) of governmental investigations and oversight, including by the Securities and Exchange Commission, the United States Attorney's Office, the Nuclear Regulatory Commission and the New Jersey Board of Public Utilities as disclosed in our Securities and Exchange Commission filings, the continuing availability and operation of generating units, the ability of generating units to continue to operate at, or near full capacity, our inability to accomplish or realize anticipated benefits from strategic goals (including employee workforce factors), the anticipated benefits from our voluntary pension plan contributions, our ability to improve electric commodity margins and to experience growth in the distribution business, our ability to access the public securities and other capital markets and the cost of such capital, the outcome, cost and other effects of present and potential legal and administrative proceedings and claims related to the August 14, 2003 regional power outage, the risks and other factors discussed from time to time in our Securities and Exchange Commission filings, and other similar factors. Also, a credit rating should not be viewed as a recommendation to buy, sell or hold securities and may be revised or withdrawn by a rating agency at any time. We expressly disclaim any current intention to update any forward-looking statements contained herein as a result of new information, future events, or otherwise. Restatements As further discussed in Note 2(I) to the Consolidated Financial Statements, the Company is restating its consolidated financial statements for the two years ended December 31, 2004. The revisions are a result of a current tax audit from the State of New Jersey, in which the Company became aware that the New Jersey Transitional Energy Facilities Assessment (TEFA) tax is not an allowable deduction for state income tax purposes. Results of Operations Earnings on common stock increased to $182 million from $107 million in 2004 as increases in operating revenues were partially offset by increases in purchased power and other operating expenses. Earnings on common stock in 2004 increased to $107 million from $64 million in 2003 principally due to the absence of non-cash charges aggregating $185 million ($109 million after tax) from a 2003 rate case decision disallowing recovery of certain regulatory assets (see Regulatory Matters) and reduced purchased power costs in 2004 which were partially offset by a decline in operating revenues. Operating revenues increased $395 million or 17.9% in 2005 compared with 2004. The revenue increases consisted of increases in retail generation revenues of $195 million, distribution throughput revenues of $123 million and wholesale revenues of $75 million. Retail generation sales revenues increased in 2005 from 2004 due to higher volumes and unit prices resulting from the BGS auction. Retail generation kilowatt-hour sales increases in the residential (13.9%) and commercial (13.5%) sectors more than offset a decline in sales to the industrial sector (6.3%) due to changes in customer shopping. Generation provided by alternative suppliers to residential and commercial customers as a percent of total sales in our franchise area decreased by 5.2 and 5.1 percentage points, respectively, while the percentage of shopping by industrial customers increased by 1.6 percentage points. The $123 million increase in distribution deliveries was due to higher composite unit prices coupled with a 6.2% volume increase in 2005 from the previous year. The higher composite prices reflected the impact of the distribution rate increase effective June 1, 2005 due to the NJBPU stipulated settlements (see Note 7). Higher residential and commercial sector deliveries resulted, in large part, from warmer summer temperatures and colder winter temperatures; a slight increase in industrial sector deliveries reflected improving economic conditions. Revenues from wholesale sales increased by $75 million in 2005 as compared to the previous year as higher unit prices were partially offset by a 5.1% decline in kilowatt-hour sales.

4
Operating revenues decreased $153 million in 2004 compared with 2003. The decrease in revenues was due to a $107 million decline in distribution throughput revenues and a $49 million decline in wholesale revenues partially offset by an $11 million increase in retail generation revenues. Our BGS obligation was transferred to external parties as a result of an NJBPU auction process that extended the termination of our BGS obligation through May 2006 (see Note 7 – Regulatory Matters). We entered into long-term power purchase agreements in connection with the divestiture of our generation facilities and sold any power in excess of our retail customer needs to the wholesale market. The long-term purchase agreements ended after the first quarter of 2003 and as a result, sales to the wholesale market subsequently decreased. Retail generation sales revenues increased by $11 million in 2004 compared to 2003 due to higher unit prices resulting from the BGS auction. This increase more than offset a composite 13.2% decrease in KWH sales (commercial – 16.0% and industrial – 63.4%), which reflected increases in electric generation services to commercial and industrial customers provided by alternative suppliers. The shopping percentage in our franchise area increased in 2004 by 16.7 percentage points and 46.0 percentage points, for the commercial and industrial sectors respectively, while the percentage of shopping by residential customers was relatively unchanged. The $107 million decrease in distribution deliveries was due to lower unit prices that more than offset the impact of the 2.5% volume increase in 2004 from the previous year. The lower prices reflected the impact of the distribution rate decrease effective August 1, 2003. Warmer temperatures in the summer and improving economic conditions resulted, in large part, in higher residential, commercial and industrial demand. Changes in electric generation sales and distribution deliveries in 2005 and 2004, compared to the prior year, are summarized in the following table:
Changes in KWH Sales 2005 2004 Increase (Decrease) Electric Generation: Retail 12.8% (13.2 )% Wholesale (5.1)% (19.1 )% Total Electric Generation Sales 8.6% (14.7 )% Distribution Deliveries: Residential 8.0% 2.8 % Commercial 6.3% 3.0 % Industrial 0.1% 0.8 % Total Distribution Deliveries 6.2% 2.5 %
Operating Expenses and Taxes Total operating expenses and taxes increased $321 million in 2005 after decreasing $190 million in 2004, compared to the prior year. The increase in 2005 was primarily due to higher purchased power costs. The decrease in 2004 was attributed to non-cash charges in 2003 for amounts disallowed by the NJBPU in its rate case decision. The following table presents changes in 2005 and 2004 from the prior year by expense category:
Operating Expenses and Taxes - Changes 2005 2004 Increase (Decrease) (In millions) Purchased power costs $ 263 $ (220 ) Other operating costs 25 (18 ) Provision for depreciation 5 (24 ) Amortization of regulatory assets 14 15 Deferral of new regulatory assets (29) - General taxes 2 9 Income taxes 41 48 Total operating expenses and taxes $ 321 $ (190 )
Purchased power increased $263 million in 2005 compared to 2004. The increased purchased power costs have no impact on our earnings as all power is provided from the BGS arrangement and deferral accounting ensures the matching of revenue with purchased power expense. The increased purchased power costs reflected higher kilowatt-hour purchases due to increased generation sales requirements as discussed above and higher unit prices. Other operating expenses increased $25 million in 2005 compared to 2004, primarily due to our recording a $16 million liability for a potential labor arbitration award. Depreciation expense increased $5 million in 2005 due to an increased depreciable asset base and the transfer of computer system software assets to us from FESC. Deferral of new regulatory assets of $29 million in 2005, reflected the NJBPU approval to defer previously incurred reliability expenses for recovery from customers. Amortization of regulatory assets increased $14 million in 2005 due to an increase in the level of MTC revenue recovery.

5
Excluding the disallowed deferred energy costs of $153 million in 2003, purchased power costs decreased $67 million in 2004 compared to 2003. The lower purchased power costs reflected lower kilowatt-hour purchases due to reduced generation sales requirements. Other operating expenses decreased $18 million in 2004 compared to 2003, due to cost containment efforts as demonstrated by the 7% decline in the number of employees and the absence in 2004 of storm restoration costs incurred in 2003. Changes in depreciation expense and amortization of regulatory assets in 2004 compared to the prior year primarily resulted from the 2003 rate case decision. Depreciation expense decreased $24 million in 2004 due to reduced depreciation rates effective in August 2003 and amortization of regulatory assets increased $15 million in 2004 ($48 million excluding the rate case decision's disallowed costs of $33 million in 2003) due to an increase in the level of MTC revenue recovery. Net Interest Charges Net interest charges in 2005, 2004 and 2003 include charges of $2 million in each year for potential interest assessments associated with a New Jersey state income tax audit. Excluding these charges, net interest charges decreased $3 million in 2005 and $6 million in 2004, compared to the prior year, reflecting debt redemptions of $56 million and $290 million, respectively. Those decreases were partially offset by interest on $300 million of senior notes issued in April 2004. Capital Resources and Liquidity Our cash requirements in 2005 for operating expenses, construction expenditures and scheduled debt maturities were met with cash from operations. We plan to issue long-term debt during 2006 to fund maturing long-term debt obligations. Changes in Cash Position As of December 31, 2005, we had $0.1 million of cash and cash equivalents compared with $0.2 million as of December 31, 2004. The major sources for changes in these balances are summarized below. Cash Flows From Operating Activities Our net cash provided from operating activities was $507 million in 2005, $263 million in 2004 and $180 million in 2003, summarized as follows:
Operating Cash Flows 2005 2004 2003 (In millions) Cash earnings(1) $ 295 $ 226 $ 321 Pension trust contribution(2) (54) (37) - Working capital and other 266 74 (141 ) Total cash flows from operating activities $ 507 $ 263 $ 180
(1) Cash earnings is a non-GAAP measure (see reconciliation below). (2) Pension trust contributions in 2005 and 2004 were each net of $25 million of income tax benefits.
Cash earnings (in the table above) are not a measure of performance calculated in accordance with GAAP. We believe that cash earnings is a useful financial measure because it provides investors and management with an additional means of evaluating our cash-based operating performance. The following table reconciles cash earnings with net income.
Reconciliation of Cash Earnings 2005 2004 2003 (In millions) Net Income (GAAP) $ 183 $ 108 $ 64 Non-Cash Charges (Credits): Provision for depreciation 80 75 99 Amortization of regulatory assets 293 279 263 Deferral of new regulatory assets (29) - - Revenue credits to customers - - (72) Disallowed regulatory assets - - 153 Deferred purchased power and other costs (257) (263 ) (276) Deferred income taxes & investment tax credits, net* 36 30 62 Other non-cash charges (credits) (11) (3 ) 28 Cash earnings (Non-GAAP) $ 295 $ 226 $ 321
* Excludes $25 million of deferred tax benefits from pension contributions in 2004.
6
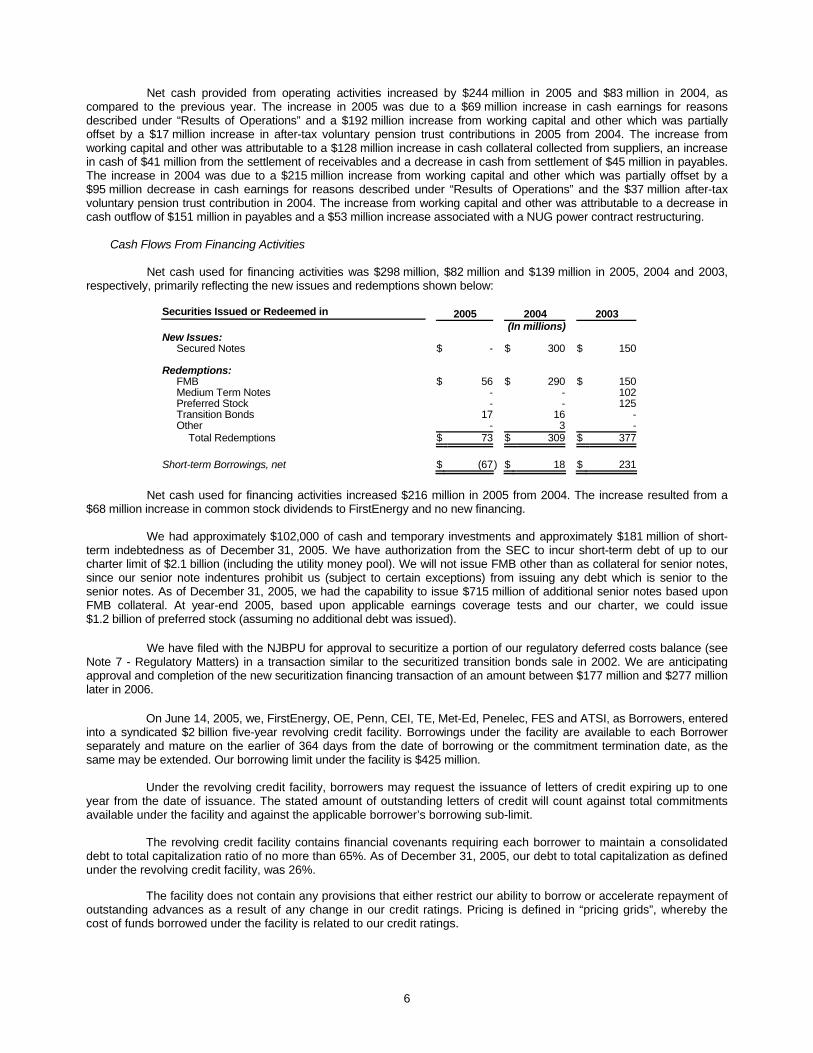
Net cash provided from operating activities increased by $244 million in 2005 and $83 million in 2004, as compared to the previous year. The increase in 2005 was due to a $69 million increase in cash earnings for reasons described under “Results of Operations” and a $192 million increase from working capital and other which was partially offset by a $17 million increase in after-tax voluntary pension trust contributions in 2005 from 2004. The increase from working capital and other was attributable to a $128 million increase in cash collateral collected from suppliers, an increase in cash of $41 million from the settlement of receivables and a decrease in cash from settlement of $45 million in payables. The increase in 2004 was due to a $215 million increase from working capital and other which was partially offset by a $95 million decrease in cash earnings for reasons described under “Results of Operations” and the $37 million after-tax voluntary pension trust contribution in 2004. The increase from working capital and other was attributable to a decrease in cash outflow of $151 million in payables and a $53 million increase associated with a NUG power contract restructuring. Cash Flows From Financing Activities Net cash used for financing activities was $298 million, $82 million and $139 million in 2005, 2004 and 2003, respectively, primarily reflecting the new issues and redemptions shown below:
Securities Issued or Redeemed in 2005 2004 2003 (In millions) New Issues:
Secured Notes $ - $ 300 $ 150 Redemptions:
FMB $ 56 $ 290 $ 150 Medium Term Notes - - 102 Preferred Stock - - 125 Transition Bonds 17 16 - Other - 3 -
Total Redemptions $ 73 $ 309 $ 377
Short-term Borrowings, net $ (67) $ 18 $ 231 Net cash used for financing activities increased $216 million in 2005 from 2004. The increase resulted from a $68 million increase in common stock dividends to FirstEnergy and no new financing. We had approximately $102,000 of cash and temporary investments and approximately $181 million of short-term indebtedness as of December 31, 2005. We have authorization from the SEC to incur short-term debt of up to our charter limit of $2.1 billion (including the utility money pool). We will not issue FMB other than as collateral for senior notes, since our senior note indentures prohibit us (subject to certain exceptions) from issuing any debt which is senior to the senior notes. As of December 31, 2005, we had the capability to issue $715 million of additional senior notes based upon FMB collateral. At year-end 2005, based upon applicable earnings coverage tests and our charter, we could issue $1.2 billion of preferred stock (assuming no additional debt was issued). We have filed with the NJBPU for approval to securitize a portion of our regulatory deferred costs balance (see Note 7 - Regulatory Matters) in a transaction similar to the securitized transition bonds sale in 2002. We are anticipating approval and completion of the new securitization financing transaction of an amount between $177 million and $277 million later in 2006. On June 14, 2005, we, FirstEnergy, OE, Penn, CEI, TE, Met-Ed, Penelec, FES and ATSI, as Borrowers, entered into a syndicated $2 billion five-year revolving credit facility. Borrowings under the facility are available to each Borrower separately and mature on the earlier of 364 days from the date of borrowing or the commitment termination date, as the same may be extended. Our borrowing limit under the facility is $425 million. Under the revolving credit facility, borrowers may request the issuance of letters of credit expiring up to one year from the date of issuance. The stated amount of outstanding letters of credit will count against total commitments available under the facility and against the applicable borrower’s borrowing sub-limit. The revolving credit facility contains financial covenants requiring each borrower to maintain a consolidated debt to total capitalization ratio of no more than 65%. As of December 31, 2005, our debt to total capitalization as defined under the revolving credit facility, was 26%. The facility does not contain any provisions that either restrict our ability to borrow or accelerate repayment of outstanding advances as a result of any change in our credit ratings. Pricing is defined in “pricing grids”, whereby the cost of funds borrowed under the facility is related to our credit ratings.

7
We have the ability to borrow from our regulated affiliates and FirstEnergy to meet our short-term working capital requirements. FESC administers this money pool and tracks surplus funds of FirstEnergy and its regulated subsidiaries. Companies receiving a loan under the money pool agreements must repay the principal, together with accrued interest, within 364 days of borrowing the funds. The rate of interest is the same for each company receiving a loan from the pool and is based on the average cost of funds available through the pool. The average interest rate for borrowings in 2005 was 3.24%. On July 18, 2005, Moody’s revised its rating outlook on FirstEnergy and its subsidiaries to positive from stable. Moody’s stated that the revision to FirstEnergy’s outlook resulted from steady financial improvement and steps taken by management to improve operations, including the stabilization of its nuclear operations. On October 3, 2005, S&P raised its corporate credit rating on FirstEnergy and the EUOC to 'BBB' from 'BBB-'. At the same time, S&P raised the senior unsecured ratings at the holding company to 'BBB-' from 'BB+' and each of the EUOC by one notch above the previous rating. S&P noted that the upgrade followed the continuation of a good operating track record, specifically for the nuclear fleet through the third quarter of 2005. On December 23, 2005, Fitch revised its rating outlook on FirstEnergy and its subsidiaries to positive from stable. Fitch stated that the revision to FirstEnergy's outlook resulted from improved performance of the Company's generating fleet and ongoing debt reduction. Our access to capital markets and costs of financing are dependent on the ratings of our securities and that of FirstEnergy. The following table shows securities ratings as of December 31, 2005. The ratings outlook from S&P on all securities is stable. The ratings outlook from Moody's & Fitch on all securities is positive.
Ratings of Securities Securities S&P Moody’s Fitch FirstEnergy Senior unsecured BBB- Baa3 BBB- JCP&L Senior secured BBB+ Baa1 BBB+ Preferred stock BB+ Ba1 BBB-
Cash Flows From Investing Activities Cash used in investing activities increased $28 million in 2005 and $136 million in 2004. The increase in 2005 resulted primarily from a $30 million increase in property additions. The increase in 2004 resulted primarily from a $56 million increase in property additions and a $79 million decrease in loan repayments from associated companies. Our capital spending for the period 2006-2010 is expected to be approximately $924 million for property additions and improvements, of which approximately $174 million applies to 2006. The capital spending is primarily for property additions supporting the distribution of electricity. Contractual Obligations As of December 31, 2005, our estimated cash payments under existing contractual obligations that we considered firm obligations were as follows:
2007- 2009- Contractual Obligations Total 2006 2008 2010 Thereafter (In millions) Long-term debt (1) $ 1,191 $ 207 $ 37 $ 41 $ 906 Short-term borrowings 181 181 - - - Operating leases (2) 103 6 13 12 72 Purchases (3) 3,358 642 1,182 870 664 Total $ 4,833 $ 1,036 $ 1,232 $ 923 $ 1,642
(1) Amounts reflected do not include interest on long-term debt. (2) Operating lease payments are net of reimbursements from subleasees (see Note 5 – Leases). (3) Power purchases under contracts with fixed or minimum quantities and approximate timing.
Market Risk Information We use various market risk sensitive instruments, including derivative contracts, primarily to manage the risk of price and interest rate fluctuations. Our Risk Policy Committee, comprised of members of senior management, provides general oversight to risk management activities throughout the company.
8
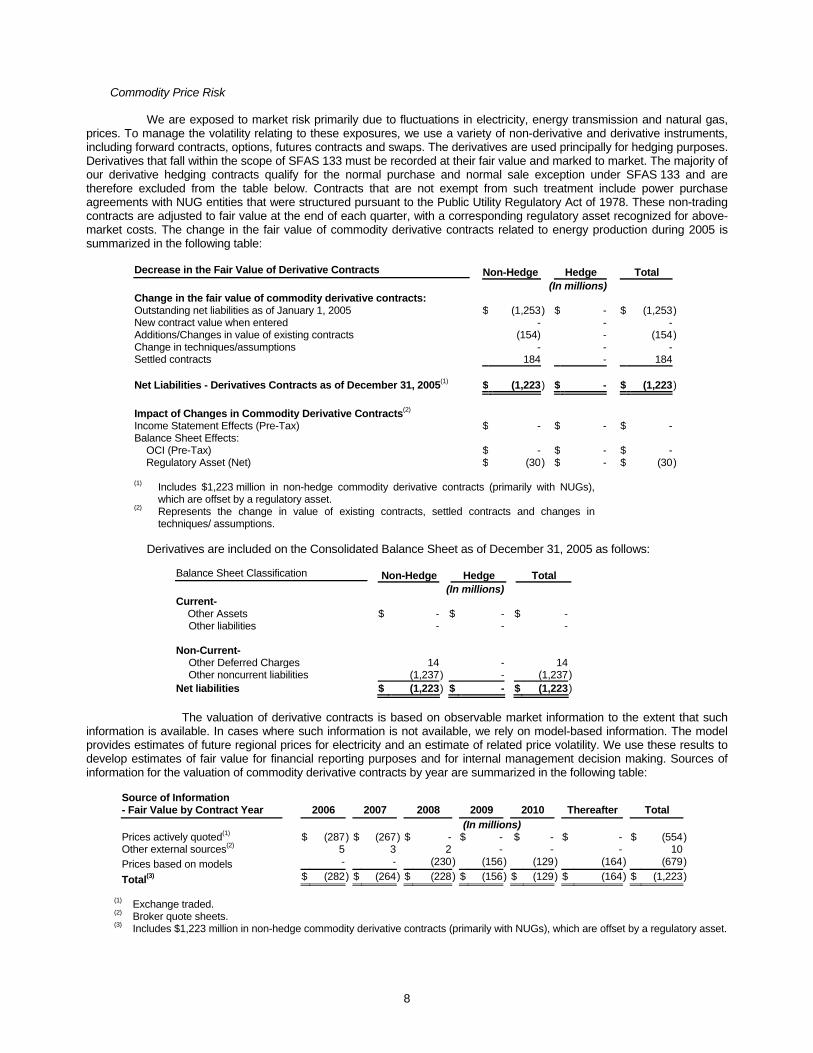
Commodity Price Risk We are exposed to market risk primarily due to fluctuations in electricity, energy transmission and natural gas, prices. To manage the volatility relating to these exposures, we use a variety of non-derivative and derivative instruments, including forward contracts, options, futures contracts and swaps. The derivatives are used principally for hedging purposes. Derivatives that fall within the scope of SFAS 133 must be recorded at their fair value and marked to market. The majority of our derivative hedging contracts qualify for the normal purchase and normal sale exception under SFAS 133 and are therefore excluded from the table below. Contracts that are not exempt from such treatment include power purchase agreements with NUG entities that were structured pursuant to the Public Utility Regulatory Act of 1978. These non-trading contracts are adjusted to fair value at the end of each quarter, with a corresponding regulatory asset recognized for above-market costs. The change in the fair value of commodity derivative contracts related to energy production during 2005 is summarized in the following table:
Decrease in the Fair Value of Derivative Contracts Non-Hedge Hedge Total (In millions) Change in the fair value of commodity derivative contracts: Outstanding net liabilities as of January 1, 2005 $ (1,253) $ - $ (1,253)New contract value when entered - - - Additions/Changes in value of existing contracts (154) - (154)Change in techniques/assumptions - - - Settled contracts 184 - 184 Net Liabilities - Derivatives Contracts as of December 31, 2005(1) $ (1,223) $ - $ (1,223) Impact of Changes in Commodity Derivative Contracts(2) Income Statement Effects (Pre-Tax) $ - $ - $ - Balance Sheet Effects:
OCI (Pre-Tax) $ - $ - $ - Regulatory Asset (Net) $ (30) $ - $ (30)
(1) Includes $1,223 million in non-hedge commodity derivative contracts (primarily with NUGs),
which are offset by a regulatory asset. (2) Represents the change in value of existing contracts, settled contracts and changes in
techniques/ assumptions.
Derivatives are included on the Consolidated Balance Sheet as of December 31, 2005 as follows:
Balance Sheet Classification Non-Hedge Hedge Total (In millions) Current- Other Assets $ - $ - $ - Other liabilities - - - Non-Current- Other Deferred Charges 14 - 14 Other noncurrent liabilities (1,237) - (1,237) Net liabilities $ (1,223) $ - $ (1,223)
The valuation of derivative contracts is based on observable market information to the extent that such information is available. In cases where such information is not available, we rely on model-based information. The model provides estimates of future regional prices for electricity and an estimate of related price volatility. We use these results to develop estimates of fair value for financial reporting purposes and for internal management decision making. Sources of information for the valuation of commodity derivative contracts by year are summarized in the following table:
Source of Information - Fair Value by Contract Year 2006 2007 2008 2009 2010 Thereafter Total (In millions) Prices actively quoted(1) $ (287) $ (267) $ - $ - $ - $ - $ (554)Other external sources(2) 5 3 2 - - - 10 Prices based on models - - (230) (156) (129) (164 ) (679)
Total(3) $ (282) $ (264) $ (228) $ (156) $ (129) $ (164 ) $ (1,223)
(1) Exchange traded. (2) Broker quote sheets. (3) Includes $1,223 million in non-hedge commodity derivative contracts (primarily with NUGs), which are offset by a regulatory asset.

9
We perform sensitivity analyses to estimate our exposure to the market risk of our commodity positions. A hypothetical 10% adverse shift in quoted market prices in the near term on both our trading and non-trading derivative instruments would not have had a material effect on our consolidated financial position or cash flows as of December 31, 2005. We estimate that if energy commodity prices experienced an adverse 10% change, net income for the next twelve months would not change, as the prices for all commodity positions are already above the contract price caps. Interest Rate Risk Our exposure to fluctuations in market interest rates is reduced since our debt has fixed interest rates, as noted in the following table: Comparison of Carrying Value to Fair Value
There- Fair Year of Maturity 2006 2007 2008 2009 2010 after Total Value
(Dollars in millions) Assets Investments Other Than Cash and Cash Equivalents- Fixed Income $ 226 $ 226 $ 224 Average interest rate 5.1 % 5.1 % _________________________________________________________________________________________________________
Liabilities Long-term Debt and Other Long-Term Obligations: Fixed rate $ 207 $ 18 $ 19 $ 20 $ 21 $ 906 $ 1,191 $ 1,214 Average interest rate 6.3 % 4.2% 5.4% 5.4% 5.5% 6.0 % 6.0% Short-term Borrowings 181 $ 181 $ 181 Average interest rate 4.0 % 4.0 %
Equity Price Risk Included in nuclear decommissioning trusts are marketable equity securities carried at their current fair value of approximately $84 million and $80 million at December 31, 2005 and 2004, respectively. A hypothetical 10% decrease in prices quoted by stock exchanges would result in a $8 million reduction in fair value as of December 31, 2005. (See Note 4 Fair Value of Financial Instruments) Outlook Beginning in 1999, all of our customers were able to select alternative energy suppliers. We continue to deliver power to homes and businesses through our existing distribution system, which remains regulated. To support customer choice, rates were restructured into unbundled service charges and additional non-bypassable charges to recover stranded costs. Regulatory Matters
Regulatory assets are costs which have been authorized by the NJBPU and the FERC for recovery from customers in the future periods or for which authorization is probable. Without the probability of such authorization, costs currently recorded as regulatory assets would have been charged to income as incurred. All of our regulatory assets are expected to continue to be recovered under the provisions of the regulatory proceedings discussed below. Our regulatory assets totaled $2.2 billion as of December 31, 2005 and 2004. We are permitted to defer for future collection from customers the amounts by which our costs of supplying BGS to non-shopping customers and costs incurred under NUG agreements exceed amounts collected through BGS and MTC rates and market sales of NUG energy and capacity. As of December 31, 2005, the accumulated deferred cost balance totaled approximately $541 million. New Jersey law allows for securitization of our deferred balance upon application by us and a determination by the NJBPU that the conditions of the New Jersey restructuring legislation are met. On February 14, 2003, we filed for approval to securitize the July 31, 2003 deferred balance. We are in discussions with the NJBPU staff as a result of the stipulated settlement agreements (as further discussed below) which recommended that the NJBPU issue an order regarding our application. On July 20, 2005, we requested the NJBPU to set a procedural schedule for this matter and are awaiting NJBPU action. On February 1, 2006, the NJBPU selected Bear Stearns as the financial advisor. On December 2, 2005, we filed a request for recovery of $165 million of actual above-market NUG costs incurred from August 1, 2005 through October 31, 2005 and forecasted above-market NUG costs for November and December 2005. The filing also includes a request for recovery of $49 million for above-market NUG costs incurred prior to August 1, 2003, to the extent those costs are not recoverable through securitization.
10
On May 25, 2005, the NJBPU approved two stipulated settlement agreements. The first stipulation between us and the NJBPU staff resolves all of the issues associated with our motion for reconsideration of the 2003 NJBPU decision on our base electric rate proceeding (Phase I Order). The second stipulation between us, the NJBPU staff and the Ratepayer Advocate resolves all of the issues associated with our Phase II petition requesting an increase in base rates of $36 million for the recovery of system reliability costs and a 9.75% return on equity. The stipulated settlements provide for, among other things, the following:
• An annual increase in distribution revenues of $23 million, effective June 1, 2005, associated with the Phase I Order reconsideration;
• An annual increase in distribution revenues of $36 million, effective June 1, 2005, related to our Phase II
Petition;
• An annual reduction in both rates and amortization expense of $8 million, effective June 1, 2005, in anticipation of an NJBPU order regarding our request to securitize up to $277 million of its deferred cost balance;
• An increase in our authorized return on common equity from 9.5% to 9.75%; and
• A commitment by us, through December 31, 2006 or until related legislation is adopted, whichever occurs
first, to maintain a target level of customer service reliability with a reduction in our authorized return on common equity from 9.75% to 9.5% if the target is not met for two consecutive quarters. The authorized return on common equity would then be restored to 9.75% if the target is met for two consecutive quarters.
The Phase II stipulation included an agreement that the distribution revenue increase also reflects a three-year amortization of our one-time service reliability improvement costs incurred in 2003-2005. This resulted in the creation of a regulatory asset associated with accelerated tree trimming and other reliability costs which were expensed in 2003 and 2004. The establishment of the new regulatory asset of approximately $28 million resulted in an increase to net income of approximately $16 million in the second quarter of 2005. On August 1, 2005, the NJBPU established a proceeding to determine whether additional ratepayer protections are required at the state level in light of the recent repeal of PUHCA under the EPACT. An NJBPU proposed rulemaking to address the issues was published in the NJ Register on December 19, 2005. The proposal would prevent a holding company that owns a gas or electric public utility from investing more than 25% of the combined assets of its utility and utility-related subsidiaries into businesses unrelated to the utility industry. A public hearing was held on February 7, 2006 and comments to the NJBPU were due by February 17, 2006. See Note 7 to the consolidated financial statements for further details and a complete discussion of regulatory matters in New Jersey. Environmental Matters We accrue environmental liabilities only when we can conclude that it is probable that we have an obligation for such costs and can reasonably determine the amount of such costs. Unasserted claims, are reflected in our determination of environmental liabilities and are accrued in the period that they are both probable and reasonably estimable. We have been named as a PRP at waste disposal sites which may require cleanup under the Comprehensive Environmental Responsive, Comprehension and Liability Act of 1980. Allegations of disposal of hazardous substances at historical sites and the liability involved are often unsubstantial and subject to dispute; however, federal law provides that PRPs for a particular site are held liable on a joint and several basis. Therefore, environmental liabilities that are considered probable have been recognized on the Consolidated Balance Sheet as of December 31, 2005, based on estimates of the total costs of cleanup, our proportionate responsibility for such costs and the financial ability of other unaffiliated entities to pay. In addition, we have accrued liabilities for environmental remediation of former manufactured gas plants in New Jersey; those costs are being recovered by us through a non-bypassable SBC. Total liabilities of approximately $47.3 million have been accrued through December 31, 2005. On December 1, 2005, FirstEnergy issued a comprehensive report to shareholders regarding air emissions regulations and an assessment of its future risks and mitigation efforts. The report is available on FirstEnergy's web site at www.firstenergycorp.com/environmental. See Note 11(B) to the consolidated financial statements for further details and a complete discussion of environmental matters.

11
Legal Matters There are various lawsuits, claims (including claims for asbestos exposure) and proceedings related to our normal business operations pending against us. The other material items not otherwise discussed above are described in Note 11 to the consolidated financial statements. Critical Accounting Policies We prepare our consolidated financial statements in accordance with GAAP. Application of these principles often requires a high degree of judgment, estimates and assumptions that affect financial results. All of our assets are subject to their own specific risks and uncertainties and are regularly reviewed for impairment. Our more significant accounting policies are described below. Regulatory Accounting We are subject to regulation that sets the prices (rates) we are permitted to charge our customers based on costs that the regulatory agencies determine we are permitted to recover. At times, regulators permit the future recovery through rates of costs that would be currently charged to expense by an unregulated company. This ratemaking process results in the recording of regulatory assets based on anticipated future cash inflows. We regularly review these assets to assess their ultimate recoverability within the approved regulatory guidelines. Impairment risk associated with these assets relates to potentially adverse legislative, judicial or regulatory actions in the future. Revenue Recognition We follow the accrual method of accounting for revenues, recognizing revenue for electricity that has been delivered to customers but not yet billed through the end of the accounting period. The determination of electricity sales to individual customers is based on meter readings, which occur on a systematic basis throughout the month. At the end of each month, electricity delivered to customers since the last meter reading is estimated and a corresponding accrual for unbilled sales is recognized. The determination of unbilled sales requires management to make estimates regarding electricity available for retail load, transmission and distribution line losses, demand by customer class, weather-related impacts, prices in effect for each customer class and electricity provided by alternative suppliers. Pension and Other Postretirement Benefits Accounting Our reported costs of providing non-contributory defined pension benefits and post employment benefits other than pensions are dependent upon numerous factors resulting from actual plan experience and certain assumptions. Pension and OPEB costs are affected by employee demographics (including age, compensation levels, and employment periods), the level of contributions we make to the plans, and earnings on plan assets. Such factors may be further affected by business combinations, which impact employee demographics, plan experience and other factors. Pension and OPEB costs are also affected by changes to key assumptions, including anticipated rates of return on plan assets, the discount rates and health care trend rates used in determining the projected benefit obligations for pension and OPEB costs. In accordance with SFAS 87, changes in pension and OPEB obligations associated with these factors may not be immediately recognized as costs on the income statement, but generally are recognized in future years over the remaining average service period of plan participants. SFAS 87 and SFAS 106 delay recognition of changes due to the long-term nature of pension and OPEB obligations and the varying market conditions likely to occur over long periods of time. As such, significant portions of pension and OPEB costs recorded in any period may not reflect the actual level of cash benefits provided to plan participants and are significantly influenced by assumptions about future market conditions and plan participants' experience. In selecting an assumed discount rate, we consider currently available rates of return on high-quality fixed income investments expected to be available during the period to maturity of the pension and other postretirement benefit obligations. Due to recent declines in corporate bond yields and interest rates in general, we reduced the assumed discount rate as of December 31, 2005 to 5.75% from 6.00% and 6.25% used as of December 31, 2004 and 2003, respectively.

12
Our assumed rate of return on pension plan assets considers historical market returns and economic forecasts for the types of investments held by our pension trusts. In 2005, 2004 and 2003, plan assets actually earned $325 million or 8.2%, $415 million or 11.1% and $671 million or 24.2%, respectively. Our pension costs in 2005, 2004 and 2003 were computed using an assumed 9.0% rate of return on plan assets which generated $345 million, $286 million and $248 million expected return on plan assets, respectively. The 2005 expected return was based upon projections of future returns and our pension trust investment allocation of approximately 63% equities, 33% bonds, 2% real estate and 2% cash. The gains or losses generated as a result of the difference between expected and actual return on plan assets are deferred and amortized and will increase or decrease future net periodic pension expense, respectively. In the fourth quarter of 2005, FirstEnergy made a $500 million voluntary contribution to its pension plan (our share was $79 million). As a result of our voluntary contribution and the increased market value of pension plan assets, we recognized a prepaid benefit cost of $148 million as of December 31, 2005. As prescribed by SFAS 87, we eliminated our additional minimum liability of $90 million. In addition, the entire AOCL balance was credited by $53 million (net of $37 million of deferred taxes) as the fair value of trust assets exceeded the accumulated benefit obligation as of December 31, 2005. Health care cost trends have significantly increased and will affect future OPEB costs. The 2005 and 2004 composite health care trend rate assumptions are approximately 9-11%, gradually decreasing to 5% in later years. In determining our trend rate assumptions, we included the specific provisions of our health care plans, the demographics and utilization rates of plan participants, actual cost increases experienced in our health care plans, and projections of future medical trend rates. The effect on JCP&L's portion of pension and OPEB costs from changes in key assumptions are as follows:
Increase in Costs from Adverse Changes in Key Assumptions Assumption Adverse Change Pension OPEB Total (In millions) Discount rate Decrease by 0.25% $ 1.4 $ 0.6 $ 2.0 Long-term return on assets Decrease by 0.25% $ 1.4 $ 0.3 $ 1.7 Health care trend rate Increase by 1% na $ 4.6 $ 4.6
Long-Lived Assets In accordance with SFAS No. 144, we periodically evaluate our long-lived assets to determine whether conditions exist that would indicate that the carrying value of an asset might not be fully recoverable. The accounting standard requires that if the sum of future cash flows (undiscounted) expected to result from an asset is less than the carrying value of the asset, an asset impairment must be recognized in the financial statements. If impairment has occurred, we recognize a loss – calculated as the difference between the carrying value and the estimated fair value of the asset (discounted future net cash flows). The calculation of future cash flows is based on assumptions, estimates and judgment about future events. The aggregate amount of cash flows determines whether an impairment is indicated. The timing of the cash flows is critical in determining the amount of the impairment. Asset Retirement Obligations In accordance with SFAS 143 and FIN 47, we recognize an ARO for the future decommissioning of our nuclear power plants and future remediation of other environmental liabilities associated with all our long-lived assets. The ARO liability represents an estimate of the fair value of our current obligation related to nuclear decommissioning and the retirement or remediation of environmental liabilities of other assets. A fair value measurement inherently involves uncertainty in the amount and timing of settlement of the liability. We used an expected cash flow approach to measure the fair value of the nuclear decommissioning and environmental remediation ARO. This approach applies probability weighting to discounted future cash flow scenarios that reflect a range of possible outcomes. The scenarios consider settlement of the ARO at the expiration of the nuclear power plants' current license; settlement based on an extended license term and expected remediation dates.

13
Goodwill In a business combination, the excess of the purchase price over the estimated fair values of the assets acquired and liabilities assumed is recognized as goodwill. Based on the guidance provided by SFAS 142, we evaluate our goodwill for impairment at least annually and would make such an evaluation more frequently if indicators of impairment should arise. In accordance with the accounting standard, if the fair value of a reporting unit is less than its carrying value (including goodwill), the goodwill is tested for impairment. If an impairment were indicated, we recognize a loss – calculated as the difference between the implied fair value of our goodwill and the carrying value of the goodwill. Our annual review was completed in the third quarter of 2005, with no impairment of goodwill indicated. The forecasts used in our evaluation of goodwill reflect operations consistent with our general business assumptions. Unanticipated changes in those assumptions could have a significant effect on our future evaluations of goodwill. In the year ended December 31, 2005, we adjusted goodwill to reverse pre-merger tax accruals due to the final resolution of tax contingencies related to the GPU acquisition. As of December 31, 2005, we had approximately $2.0 billion of goodwill. New Accounting Standards and Interpretations Adopted FSP FAS 115-1 and FAS 124-1, "The Meaning of Other-Than-Temporary Impairment and its Application to Certain
Investments" Issued in November 2005, FSP 115-1 and FAS 124-1 addresses the determination as to when an investment is considered impaired, whether that impairment is other than temporary, and the measurement of an impairment loss. The FSP finalized and renamed EITF 03-1 and 03-1-a to FSP FAS 115-1. This FSP will (1) nullify certain requirements of Issue 03-1 and supersedes EITF topic No. D-44, "Recognition of Other Than Temporary Impairment upon the Planned Sale of a Security Whose Cost Exceeds Fair Value," (2) clarify that an investor should recognize an impairment loss no later than when the impairment is deemed other than temporary, even if a decision to sell has not been made, and (3) be effective for other-than-temporary impairment and analyses conducted in periods beginning after September 15, 2005. The FSP requires prospective application with an effective date for reporting periods beginning after December 15, 2005. We are currently evaluating this FSP and any impact on our investments. EITF Issue 04-13, "Accounting for Purchases and Sales of Inventory with the Same Counterparty" In September 2005, the EITF reached a final consensus on Issue 04-13 concluding that two or more legally separate exchange transactions with the same counterparty should be combined and considered as a single arrangement for purposes of applying APB 29, when the transactions were entered into "in contemplation" of one another. If two transactions are combined and considered a single arrangement, the EITF reached a consensus that an exchange of inventory should be accounted for at fair value. Although electric power is not capable of being held in inventory, there is no substantive conceptual distinction between exchanges involving power and other storable inventory. Therefore, we will adopt this EITF effective for new arrangements entered into, or modifications or renewals of existing arrangements, in interim or annual periods beginning after March 15, 2006. SFAS 154 – “Accounting Changes and Error Corrections – a replacement of APB Opinion No. 20 and FASB
Statement No. 3” In May 2005, the FASB issued SFAS 154 to change the requirements for accounting and reporting a change in accounting principle. It applies to all voluntary changes in accounting principle and to changes required by an accounting pronouncement when that pronouncement does not include specific transition provisions. This Statement requires retrospective application to prior periods’ financial statements of changes in accounting principle, unless it is impracticable to determine either the period-specific effects or the cumulative effect of the change. In those instances, this Statement requires that the new accounting principle be applied to the balances of assets and liabilities as of the beginning of the earliest period for which retrospective application is practicable and that a corresponding adjustment be made to the opening balance of retained earnings (or other appropriate components of equity or net assets in the statement of financial position) for that period rather than being reported in the Consolidated Statements of Income. This Statement also requires that a change in depreciation, amortization, or depletion method for long-lived, nonfinancial assets be accounted for as a change in accounting estimate affected by a change in accounting principle. The provisions of this Statement are effective for accounting changes and corrections of errors made in fiscal years beginning after December 15, 2005. We adopted this Statement effective January 1, 2006.

14
SFAS 153, “Exchanges of Nonmonetary Assets – an amendment of APB Opinion No. 29” In December 2004, the FASB issued SFAS 153 amending APB 29, which was based on the principle that nonmonetary assets should be measured based on the fair value of the assets exchanged. The guidance in APB 29 included certain exceptions to that principle. SFAS 153 eliminates the exception from fair value measurement for nonmonetary exchanges of similar productive assets and replaces it with an exception for exchanges that do not have commercial substance. This Statement specifies that a nonmonetary exchange has commercial substance if the future cash flows of the entity are expected to change significantly as a result of the exchange. The provisions of this Statement are effective January 1, 2006 for us. This FSP is not expected to have a material impact on our financial statements.
SFAS 151, “Inventory Costs – an amendment of ARB No. 43, Chapter 4” In November 2004, the FASB issued SFAS 151 to clarify the accounting for abnormal amounts of idle facility expense, freight, handling costs and wasted material (spoilage). Previous guidance stated that in some circumstances these costs may be “so abnormal” that they would require treatment as current period costs. SFAS 151 requires abnormal amounts for these items to always be recorded as current period costs. In addition, this Statement requires that allocation of fixed production overheads to the cost of conversion be based on the normal capacity of the production facilities. The provisions of this statement are effective for inventory costs incurred by us beginning January 1, 2006. We do not expect this statement to have a material impact on the financial statements.
15
JERSEY CENTRAL POWER & LIGHT COMPANY
CONSOLIDATED STATEMENTS OF INCOME
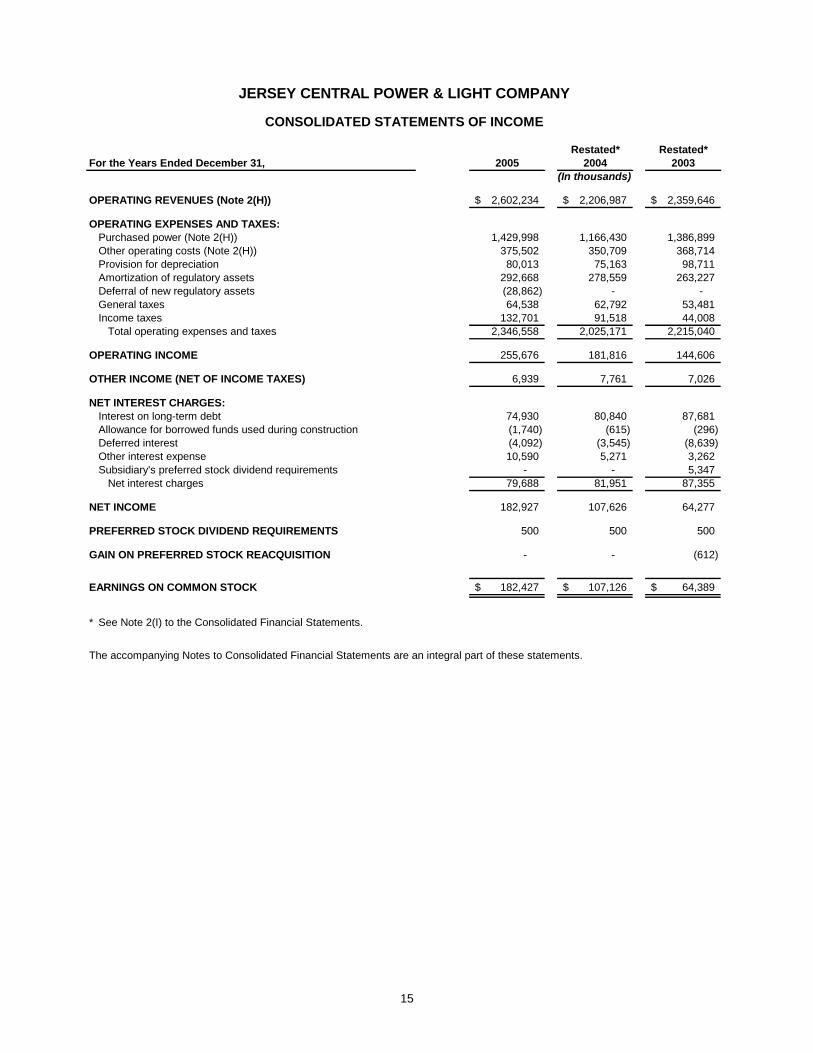
Restated* Restated*For the Years Ended December 31, 2005 2004 2003
(In thousands)
OPERATING REVENUES (Note 2(H)) 2,602,234$ 2,206,987$ 2,359,646$
OPERATING EXPENSES AND TAXES:Purchased power (Note 2(H)) 1,429,998 1,166,430 1,386,899 Other operating costs (Note 2(H)) 375,502 350,709 368,714 Provision for depreciation 80,013 75,163 98,711 Amortization of regulatory assets 292,668 278,559 263,227 Deferral of new regulatory assets (28,862) - - General taxes 64,538 62,792 53,481 Income taxes 132,701 91,518 44,008
Total operating expenses and taxes 2,346,558 2,025,171 2,215,040
OPERATING INCOME 255,676 181,816 144,606
OTHER INCOME (NET OF INCOME TAXES) 6,939 7,761 7,026
NET INTEREST CHARGES:Interest on long-term debt 74,930 80,840 87,681 Allowance for borrowed funds used during construction (1,740) (615) (296) Deferred interest (4,092) (3,545) (8,639) Other interest expense 10,590 5,271 3,262 Subsidiary's preferred stock dividend requirements - - 5,347
Net interest charges 79,688 81,951 87,355
NET INCOME 182,927 107,626 64,277
PREFERRED STOCK DIVIDEND REQUIREMENTS 500 500 500
GAIN ON PREFERRED STOCK REACQUISITION - - (612)
EARNINGS ON COMMON STOCK 182,427$ 107,126$ 64,389$
* See Note 2(I) to the Consolidated Financial Statements.
The accompanying Notes to Consolidated Financial Statements are an integral part of these statements.

16
JERSEY CENTRAL POWER & LIGHT COMPANYCONSOLIDATED BALANCE SHEETS
Restated*As of December 31, 2005 2004
(In thousands)ASSETS
UTILITY PLANT:In service 3,902,684$ 3,730,767$ Less - Accumulated provision for depreciation 1,445,718 1,380,775
2,456,966 2,349,992 Construction work in progress 98,720 75,012
2,555,686 2,425,004 OTHER PROPERTY AND INVESTMENTS:
Nuclear plant decommissioning trusts 145,975 138,205 Nuclear fuel disposal trust 164,203 159,696 Long-term notes receivable from associated companies 18,419 20,436 Other 16,693 19,379
345,290 337,716 CURRENT ASSETS:
Cash and cash equivalents 102 162 Receivables-
Customers (less accumulated provision of $3,830,000 and $3,881,000, respectively, for uncollectible accounts) 258,077 201,415
Associated companies 203 86,531 Other (less accumulated provisions of $204,000 and $162,000,
respectively, for uncollectable accounts) 41,456 39,898 Materials and supplies, at average cost 2,104 2,435 Prepayments and other 17,065 31,489
319,007 361,930 DEFERRED CHARGES AND OTHER ASSETS:
Regulatory assets 2,226,591 2,168,554 Goodwill 1,985,858 1,998,350 Prepaid pension costs 148,054 - Other 3,620 4,978
4,364,123 4,171,882 7,584,106$ 7,296,532$
CAPITALIZATION AND LIABILITIES
CAPITALIZATION (See Consolidated Statements of Capitalization):Common stockholder's equity 3,210,763$ 3,143,554$ Preferred stock not subject to mandatory redemption 12,649 12,649 Long-term debt and other long-term obligations 972,061 1,238,984
4,195,473 4,395,187 CURRENT LIABILITIES:
Currently payable long-term debt 207,231 16,866 Notes payable (Note 10)-
Associated companies 181,346 248,532 Accounts payable-
Associated companies 37,955 20,605 Other 149,501 124,733
Accrued taxes 54,356 19,908 Accrued interest 19,916 18,199 Cash collateral from suppliers 141,225 6,662 Other 86,884 58,468
878,414 513,973 NONCURRENT LIABILITIES:
Power purchase contract loss liability 1,237,249 1,268,478 Accumulated deferred income taxes 812,034 645,741 Nuclear fuel disposal costs 175,156 169,884 Asset retirement obligation 79,527 72,655 Retirement benefits 72,454 103,036 Other 133,799 127,578
2,510,219 2,387,372 COMMITMENTS AND CONTINGENCIES (Notes 5 and 11)
7,584,106$ 7,296,532$
* See Note 2(I) to the Consolidated Financial Statements.
The accompanying Notes to Consolidated Financial Statements are an integral part of these balance sheets.

17
JERSEY CENTRAL POWER & LIGHT COMPANY
CONSOLIDATED STATEMENTS OF CAPITALIZATIONRestated*
As of December 31, 2005 2004(Dollars in thousands, except per share amounts)
COMMON STOCKHOLDER'S EQUITY:Common stock, par value $10 per share, authorized 16,000,000 shares
15,371,270 shares outstanding 153,713$ 153,713$ Other paid-in capital 3,003,190 3,013,912 Accumulated other comprehensive loss (Note 2(F)) (2,030) (55,534) Retained earnings (Note 8(A)) 55,890 31,463
Total common stockholder's equity 3,210,763 3,143,554
Number of Shares OptionalOutstanding Redemption Price
2005 2004 Per Share AggregatePREFERRED STOCK NOT SUBJECT TOMANDATORY REDEMPTION (Note 8(B)):Cumulative, without par value-Authorized 125,000 shares
4.00% Series 125,000 125,000 106.50$ 13,313$ 12,649 12,649
LONG-TERM DEBT AND OTHER LONG-TERM OBLIGATIONS (Note 8(C)):First mortgage bonds:
6.850% due 2006 40,000 40,000 7.125% due 2009 - 5,985 7.100% due 2015 12,200 12,200 7.500% due 2023 125,000 125,000 8.450% due 2025 - 50,000 6.750% due 2025 150,000 150,000
Total first mortgage bonds 327,200 383,185
Secured notes:6.450% due 2006 150,000 150,000 4.190% due 2005-2007 35,172 51,723 5.390% due 2007-2010 52,297 52,297 5.810% due 2010-2013 77,075 77,075 5.625% due 2016 300,000 300,000 6.160% due 2013-2017 99,517 99,517 4.800% due 2018 150,000 150,000
Total secured notes 864,061 880,612
Net unamortized discount on debt (11,969) (7,947) Long-term debt due within one year (207,231) (16,866)
Total long-term debt and other long-term obligations 972,061 1,238,984
TOTAL CAPITALIZATION 4,195,473$ 4,395,187$
* See Note 2(I) to the Consolidated Financial Statements.
The accompanying Notes to Consolidated Financial Statements are an integral part of these statements.

18
JERSEY CENTRAL POWER & LIGHT COMPANY
CONSOLIDATED STATEMENTS OF COMMON STOCKHOLDER'S EQUITY
AccumulatedCommon Stock Other Other
Comprehensive Number Par Paid-In Comprehensive RetainedIncome of Shares Value Capital Income (Loss) Earnings
(Dollars in thousands)
Balance, January 1, 2003 92,003$ Cumulative effect for restatements* (4,055)
Balance, January 1, 2003 (Restated*) 15,371,270 153,713$ 3,029,218$ (865)$ 87,948 Net income (Restated*) 64,277$ 64,277 Net unrealized loss on derivative instruments (3,020) (3,020) Minimum liability for unfunded retirement
benefits, net of $(32,998,000) of income taxes (47,880) (47,880) Comprehensive income 13,377$ Cash dividends on preferred stock (500) Cash dividends on common stock (138,000) Gain on preferred stock reacquisition 612 Purchase accounting fair value adjustment 676
Balance, December 31, 2003 (Restated*) 15,371,270 153,713 3,029,894 (51,765) 14,337 Net income (Restated*) 107,626$ 107,626 Net unrealized loss on investments (5) (5) Net unrealized gain on derivative instruments,
net of $1,583,000 of income taxes 1,697 1,697 Minimum liability for unfunded retirement
benefits, net of $(3,772,000) of income taxes (5,461) (5,461) Comprehensive income 103,857$ Cash dividends on preferred stock (500) Cash dividends on common stock (90,000) Purchase accounting fair value adjustment (15,982)
Balance, December 31, 2004 (Restated*) 15,371,270 153,713 3,013,912 (55,534) 31,463 Net income 182,927$ 182,927 Net unrealized gain on derivative instruments,
net of $113,000 of income taxes 163 163 Minimum liability for unfunded retirement
benefits, net of $36,838,000 of income taxes 53,341 53,341 Comprehensive income 236,431$ Cash dividends on preferred stock (500) Cash dividends on common stock (158,000) Purchase accounting fair value adjustment (10,722)
Balance, December 31, 2005 15,371,270 153,713$ 3,003,190$ (2,030)$ 55,890$
* See Note 2(I) to the Consolidated Financial Statements.
CONSOLIDATED STATEMENTS OF PREFERRED STOCK
Not Subject to Subject toMandatory Redemption Mandatory Redemption
Number Carrying Number Carryingof Shares Value of Shares Value
(Dollars in thousands)
Balance, January 1, 2003 125,000 12,649$ 5,000,000 125,244$ Redemptions-
8.56% Series (5,000,000) (125,242) Amortization of fair market
value adjustment (2) Balance, December 31, 2003 125,000 12,649 - - Balance, December 31, 2004 125,000 12,649 - - Balance, December 31, 2005 125,000 12,649$ - -$
The accompanying Notes to Consolidated Financial Statements are an integral part of these statements.

19
JERSEY CENTRAL POWER & LIGHT COMPANY
CONSOLIDATED STATEMENTS OF CASH FLOWS
Restated* Restated*For the Years Ended December 31, 2005 2004 2003
(In thousands)
CASH FLOWS FROM OPERATING ACTIVITIES:Net income 182,927$ 107,626$ 64,277$
Adjustments to reconcile net income to net cash from operating activities -
Provision for depreciation 80,013 75,163 98,711 Amortization of regulatory assets 292,668 278,559 263,227 Deferral of new regulatory assets (28,862) - - Deferred purchased power and other costs (257,418) (263,257) (276,214) Deferred income taxes and investment tax credits, net 36,125 54,887 62,372 Accrued retirement benefit obligation (9,268) (2,986) 8,381 Accrued compensation, net (1,163) 1,014 19,864 NUG power contract restructuring - 52,800 - Cash collateral from suppliers 134,563 6,662 - Pension trust contribution (79,120) (62,499) - Accrued liability from arbitration decision 16,141 - - Revenue credits to customers - - (71,984) Disallowed regulatory assets - - 152,500 Decrease (increase) in operating assets-
Receivables 28,108 (13,360) 4,528 Materials and supplies 331 45 (1,139) Prepayments and other current assets 14,424 17,870 (11,640)
Increase (decrease) in operating liabilities-Accounts payable 42,118 (2,887) (153,953) Accrued taxes 34,448 3,800 (10,756) Accrued interest 1,717 (2,564) (10,748)
Other 18,970 11,780 42,526 Net cash provided from operating activities 506,722 262,653 179,952
CASH FLOWS FROM FINANCING ACTIVITIES:New Financing-
Long-term debt - 300,000 150,000 Short-term borrowings, net - 17,547 230,985
Redemptions and Repayments-Preferred stock - - (125,244) Long-term debt (72,536) (308,872) (251,815) Short-term borrowings, net (67,187) - -
Dividend Payments-Common stock (158,000) (90,000) (138,000) Preferred stock (500) (500) (5,235)
Net cash used for financing activities (298,223) (81,825) (139,309)
CASH FLOWS FROM INVESTING ACTIVITIES:Property additions (209,118) (178,877) (122,930) Loan repayments from (loans to) associated companies, net 2,017 (857) 78,112 Contributions to nuclear decommissioning trusts (2,895) (2,895) (2,630) Other 1,437 1,692 2,253
Net cash used for investing activities (208,559) (180,937) (45,195)
Net decrease in cash and cash equivalents (60) (109) (4,552) Cash and cash equivalents at beginning of year 162 271 4,823 Cash and cash equivalents at end of year 102$ 162$ 271$
SUPPLEMENTAL CASH FLOW INFORMATION:Cash Paid During the Year-
Interest (net of amounts capitalized) 78,750$ 83,341$ 101,432$ Income taxes 12,385$ 58,549$ 16,883$
* See Note 2(I) to the Consolidated Financial Statements.
The accompanying Notes to Consolidated Financial Statements are an integral part of these statements.

20
JERSEY CENTRAL POWER & LIGHT COMPANY
CONSOLIDATED STATEMENTS OF TAXES
Restated* Restated*For the Years Ended December 31, 2005 2004 2003
(In thousands)GENERAL TAXES:New Jersey Transitional Energy Facilities Assessment** 52,026$ 49,455$ 38,668$ Real and personal property 4,567 4,894 3,889 Social security and unemployment 7,682 8,287 4,826 Other 263 156 6,098
Total general taxes 64,538$ 62,792$ 53,481$
PROVISION FOR INCOME TAXES:Currently payable-
Federal 77,783$ 27,701$ (17,701)$ State 21,899 14,617 3,938
99,682 42,318 (13,763) Deferred, net-
Federal 27,336 50,817 54,252 State 10,167 5,657 10,348
37,503 56,474 64,600 Investment tax credit amortization (1,338) (1,587) (2,228)
Total provision for income taxes 135,847$ 97,205$ 48,609$
INCOME STATEMENT CLASSIFICATIONOF PROVISION FOR INCOME TAXES:Operating income 132,701$ 91,518$ 44,008$ Other income 3,146 5,687 4,601
Total provision for income taxes 135,847$ 97,205$ 48,609$
RECONCILIATION OF FEDERAL INCOME TAXEXPENSE AT STATUTORY RATE TO TOTALPROVISION FOR INCOME TAXES:Book income before provision for income taxes 318,832$ 204,831$ 112,887$
Federal income tax expense at statutory rate 111,591$ 71,691$ 39,510$ Increases (reductions) in taxes resulting from-
Amortization of investment tax credits (1,338) (1,587) (2,228) State income taxes, net of federal income tax benefit 20,843 13,178 9,286 Other, net 4,751 13,923 2,041
Total provision for income taxes 135,847$ 97,205$ 48,609$
ACCUMULATED DEFERRED INCOME TAXES AS OF DECEMBER 31:Property basis differences 416,005$ 361,640$ 345,753$ Deferred sale and leaseback costs (18,942) (17,836) (16,651) Purchase accounting basis difference (1,253) (1,253) (1,253) Sale of generation assets (17,861) (17,861) (17,861) Regulatory transition charge 227,379 213,665 197,729 Customer receivables for future income taxes 6,589 (27,239) (4,519) Oyster Creek securitization 173,177 184,245 193,558 Other comprehensive income (1,402) (38,353) (32,998) Deferred nuclear expenses (9,881) (11,178) 3,531 Employee benefits 29,182 1,652 (29,129) Other 9,041 (1,741) 2,048
Net deferred income tax liability 812,034$ 645,741$ 640,208$
* See Note 2(I) to the Consolidated Financial Statements.
** Collected from customers through regulated rates and included in revenue in the Consolidated Statements of Income.
The accompanying Notes to Consolidated Financial Statements are an integral part of these statements.

21
NOTES TO CONSOLIDATED FINANCIAL STATEMENTS 1. ORGANIZATION AND BASIS OF PRESENTATION: The consolidated financial statements include JCP&L (Company) and its wholly owned subsidiaries. The Company is a wholly owned subsidiary of FirstEnergy. FirstEnergy also holds directly all of the issued and outstanding common shares of its other principal electric utility operating subsidiaries, including OE, CEI, TE, ATSI, Met-Ed and Penelec. The Company follows GAAP and complies with the regulations, orders, policies and practices prescribed by the SEC, NJBPU and the FERC. The preparation of financial statements in conformity with GAAP requires management to make periodic estimates and assumptions that affect the reported amounts of assets, liabilities, revenues and expenses and the disclosure of contingent assets and liabilities. Actual results could differ from these estimates. The Company consolidates all majority-owned subsidiaries, over which the Company exercises control and, when applicable, entities for which the Company has a controlling financial interest and VIEs for which the Company or any of its subsidiaries is the primary beneficiary. Intercompany transactions and balances are eliminated in consolidation. Investments in non-consolidated affiliates (20-50% owned companies, joint ventures and partnerships) over which the Company has the ability to exercise significant influence, but not control, are accounted for on the equity basis. Unless otherwise indicated, defined terms used herein have the meanings set forth in the accompanying Glossary of Terms. 2. SUMMARY OF SIGNIFICANT ACCOUNTING POLICIES: (A) ACCOUNTING FOR THE EFFECTS OF REGULATION The Company accounts for the effects of regulation through the application of SFAS 71 since its rates:
• are established by a third-party regulator with the authority to set rates that bind customers;
• are cost-based; and
• can be charged to and collected from customers. An enterprise meeting all of these criteria capitalizes costs that would otherwise be charged to expense if the rate actions of its regulator make it probable that those costs will be recovered in future revenue. SFAS 71 is applied only to the parts of the business that meet the above criteria. If a portion of the business applying SFAS 71 no longer meets those requirements, previously recorded regulatory assets are removed from the balance sheet in accordance with the guidance in SFAS 101. Regulatory Assets- The Company recognizes, as regulatory assets, costs which the FERC and the NJBPU have authorized for recovery from customers in future periods or for which authorization is probable. Without the probability of such authorization, costs currently recorded as regulatory assets would have been charged to income as incurred. All regulatory assets are expected to be recovered from customers under the Company’s regulatory plan. The Company continues to bill and collect cost-based rates for its transmission and distribution services, which remain regulated; accordingly, it is appropriate that the Company continue the application of SFAS 71 to those operations. Net regulatory assets on the Consolidated Balance Sheets are comprised of the following:
2005 2004 (In millions) Regulatory transition costs $ 2,229 $ 2,215Societal benefits charge 29 51Property losses and unrecovered plant costs 29 50Customer receivables for future income taxes 31 (58)Employee postretirement benefit costs 23 27Loss on reacquired debt 10 10Reliability costs 23 -Component removal costs (148) (150)Other 1 24
Total $ 2,227 $ 2,169

22
Regulatory transition charges as of December 31, 2005 for the Company are approximately $2.2 billion. Deferral of above-market costs from power supplied by NUGs to the Company are approximately $1.2 billion and are being recovered through BGS and MTC revenues. The liability for projected above-market NUG costs and corresponding regulatory asset are adjusted to fair value at the end of each quarter. Recovery of the remaining regulatory transition costs is expected to continue under the provisions of the various regulatory proceedings in New Jersey. (B) CASH AND SHORT-TERM FINANCIAL INSTRUMENTS- All temporary cash investments purchased with an initial maturity of three months or less are reported as cash equivalents on the Consolidated Balance Sheets at cost, which approximates their fair market value. (C) REVENUES AND RECEIVABLES- The Company’s principal business is providing electric service to customers in New Jersey. The Company’s retail customers are metered on a cycle basis. Electric revenues are recorded based on energy delivered through the end of the calendar month. An estimate of unbilled revenues is calculated to recognize electric service provided between the last meter reading and the end of the month. This estimate includes many factors including estimated weather impacts, customer shopping activity, historical line loss factors and prices in effect for each class of customer. In each accounting period, the Company accrues the estimated unbilled amount receivable as revenue and reverses the related prior period estimate. Receivables from customers include sales to residential, commercial and industrial customers and sales to wholesale customers. There was no material concentration of receivables as of December 31, 2005, with respect to any particular segment of the Company's customers. Total customer receivables were $258 million (billed – $157 million and unbilled – $101 million) and $201 million (billed – $122 million and unbilled – $79 million) as of December 31, 2005 and 2004, respectively. (D) PROPERTY, PLANT AND EQUIPMENT- As a result of the Company's acquisition by FirstEnergy, a portion of the Company’s property, plant and equipment was adjusted to reflect fair value. The majority of the Company’s property, plant and equipment is reflected at original cost since such assets remain subject to rate regulation on a historical cost basis. In addition to its wholly owned facilities, the Company holds a 50% ownership interest in Yards Creek Pumped Storage Facility, and its net book value was approximately $20 million as of December 31, 2005. The costs of normal maintenance, repairs and minor replacements are expensed as incurred. The Company's accounting policy for planned major maintenance projects is to recognize liabilities as they are incurred. The Company provides for depreciation on a straight-line basis at various rates over the estimated lives of property included in plant in service. The annualized composite rate was approximately 2.2% in 2005, 2.1% in 2004 and 2.8% in 2003. The reduced depreciation rate in 2004 reflects reductions from the NJBPU August 2003 rate decision. (E) ASSET IMPAIRMENTS- Long-Lived Assets The Company evaluates the carrying value of its long-lived assets when events or circumstances indicate that the carrying amount may not be recoverable. In accordance with SFAS 144, the carrying amount of a long-lived asset is not recoverable if it exceeds the sum of the undiscounted cash flows expected to result from the use and eventual disposition of the asset. If an impairment exists, a loss is recognized for the amount by which the carrying value of the long-lived asset exceeds its estimated fair value. Fair value is estimated by using available market valuations or the long-lived asset's expected future net discounted cash flows. The calculation of expected cash flows is based on estimates and assumptions about future events.

23
Goodwill In a business combination, the excess of the purchase price over the estimated fair values of assets acquired and liabilities assumed is recognized as goodwill. Based on the guidance provided by SFAS 142, the Company evaluates its goodwill for impairment at least annually and would make such an evaluation more frequently if indicators of impairment should arise. In accordance with the accounting standard, if the fair value of a reporting unit is less than its carrying value (including goodwill), the goodwill is tested for impairment. If an impairment is indicated, the Company recognizes a loss – calculated as the difference between the implied fair value of a reporting unit's goodwill and the carrying value of the goodwill. The Company's 2005 annual review was completed in the third quarter of 2005 with no impairment indicated. The forecasts used in the Company's evaluation of goodwill reflect operations consistent with its general business assumptions. Unanticipated changes in those assumptions could have a significant effect on the Company's future evaluations of goodwill. As of December 31, 2005, the Company had recorded goodwill of $2.0 billion related to the merger. In the year ended December 31, 2005, the Company adjusted goodwill to reverse pre-merger tax accruals due to the final resolution of tax contingencies related to the GPU acquisition. Investments The Company periodically evaluates for impairment investments that include available-for-sale securities held by their nuclear decommissioning trusts. In accordance with SFAS 115, securities classified as available-for-sale are evaluated to determine whether a decline in fair value below the cost basis is other than temporary. If the decline in fair value is determined to be other than temporary, the cost basis of the security is written down to fair value. The Company considers, among other factors, the length of time and the extent to which the security's fair value has been less than cost and the near-term financial prospects of the security issuer when evaluating investments for impairment. The fair value and unrealized gains and losses of the Company's investments are disclosed in Note 4. (F) COMPREHENSIVE INCOME- Comprehensive income includes net income as reported on the Consolidated Statements of Income and all other changes in common stockholder’s equity except those resulting from transactions with FirstEnergy and preferred stockholders. As of December 31, 2005, accumulated other comprehensive loss consisted of unrealized losses on derivative instrument hedges of $2 million. As of December 31, 2004, accumulated other comprehensive loss consisted of unrealized losses on derivative instrument hedges of $2 million and a minimum liability for unfunded retirement benefits of $53 million. (G) INCOME TAXES- Details of the total provision for income taxes are shown on the Consolidated Statements of Taxes. The Company records income taxes in accordance with the liability method of accounting. Deferred income taxes reflect the net tax effect of temporary differences between the carrying amounts of assets and liabilities for financial reporting purposes and the amounts used for tax purposes. Investment tax credits, which were deferred when utilized, are being amortized over the recovery period of the related property. Deferred income tax liabilities related to tax and accounting basis differences and tax credit carry forward items are recognized at the statutory income tax rates in effect when the liabilities are expected to be paid. Deferred tax assets are recognized based on income tax rates expected to be in effect when they are settled. The Company is included in FirstEnergy's consolidated federal income tax return. The consolidated tax liability is allocated on a “stand-alone” company basis, with the Company recognizing the tax benefit for any tax losses or credits it contributes to the consolidated return. (H) TRANSACTIONS WITH AFFILIATED COMPANIES- Operating expenses and other income included transactions with affiliated companies, primarily FESC, GPUS and FES. GPUS (until it ceased operations in mid-2003) and FESC have provided legal, accounting, financial and other corporate support services to the Company. Through the BGS auction process, FES is a supplier of power to the Company. The primary affiliated companies transactions are as follows:
2005 2004 2003 (In millions) Operating Revenues: Wholesale sales – affiliated companies $ 33 $ 49 $ 36 Services Received: Service Company support services 94 95 101 Power purchased from FES 78 71 55

24
FirstEnergy does not bill directly or allocate any of its costs to any subsidiary company. Costs are allocated to the Company from FESC, a subsidiary of FirstEnergy. The vast majority of costs are directly billed or assigned at no more than cost. The remaining costs are for services that are provided on behalf of more than one company, or costs that cannot be precisely identified and are allocated using formulas developed by FESC. The current allocation or assignment formulas used and their bases include multiple factor formulas; each company’s proportionate amount of FirstEnergy’s aggregate total for direct payroll, number of employees, asset balances, revenues, number of customers, other factors and specific departmental charge ratios. It is management’s belief that allocation methods utilized are reasonable. Intercompany transactions with FirstEnergy and its other subsidiaries are generally settled under commercial terms within thirty days.
(I) RESTATEMENTS The Company is restating its financial statements for the two years ended December 31, 2004. The revisions are a result of a current tax audit from the State of New Jersey, in which the Company became aware that the New Jersey Transitional Energy Facilities Assessment (TEFA) tax is not an allowable deduction for state income tax purposes. The Company had incorrectly claimed a state income tax deduction for TEFA tax payments since 1998. The underpayment of tax, with interest through December 31, 2005, is approximately $29.5 million (net of federal tax benefit). The portion related to the period before the merger between GPU and FirstEnergy (1998 through November 6, 2001) is reflected as an increase to acquired liabilities, with the offset in the acquisition accounting resulting in an increase in goodwill of $13.3 million (net of federal tax benefit). The Company has adjusted the results of operations for all periods subsequent to the merger and has reflected the cumulative impact of the accounting through December 31, 2002 as an adjustment of $4.1 million to the opening retained earnings as of January 1, 2003 in these consolidated financial statements. The effect of this item on the Consolidating Statements of Income for the two years ended December 31, 2004 is as follows:
Income Statement EffectsIncrease (Decrease) 2004 2003
Income taxes 2,093$ 2,169$ Total operating expenses and taxes 2,093 2,169 Operating Income (2,093) (2,169) Other interest expense 1,920 1,571 Net interest charges 1,920 1,571 Net income (4,013)$ (3,740)$
(In thousands)
In addition, the above adjustments had the following impact on the Consolidated Balance Sheet as of December 31, 2004:
Increase (Decrease(in thousands)
Goodwill 13,314$ Total assets 13,314$
Common stockholder's equity (11,808)$ Accrued taxes 17,282 Accrued interest 7,840 Total capitalization and liabilities 13,314$

25
The effects of all of the changes in this restatement on the previously reported Consolidated Balance Sheet as of December 31, 2004, and the Consolidated Statements of Income and Consolidated Statements of Cash Flow for the years ended December 31, 2004 and 2003 are as follows:
As Previously As As Previously AsCONSOLIDATED STATEMENTS OF INCOME Reported Restated Reported Restated
OPERATING REVENUES (Note 2(H)) 2,206,987$ 2,206,987$ 2,359,646$ 2,359,646$
OPERATING EXPENSES AND TAXES: Purchased power (Note 2(H)) 1,166,430 1,166,430 1,386,899 1,386,899 Other operating costs (Note 2(H)) 350,709 350,709 368,714 368,714 Provision for depreciation 75,163 75,163 98,711 98,711 Amortization of regulatory assets 278,559 278,559 263,227 263,227 Deferral of new regulatory assets - - - - General taxes 62,792 62,792 53,481 53,481 Income taxes 89,425 91,518 41,839 44,008 Total operating expenses and taxes 2,023,078 2,025,171 2,212,871 2,215,040
OPERATING INCOME 183,909 181,816 146,775 144,606
OTHER INCOME (NET OF INCOME TAXES) 7,761 7,761 7,026 7,026
NET INTEREST CHARGES 80,031 81,951 85,784 87,355
NET INCOME 111,639 107,626 68,017 64,277
PREFERRED STOCK DIVIDEND REQUIREMENTS 500 500 500 500
GAIN ON PREFERRED STOCK REACQUISITION - - (612) (612) EARNINGS ON COMMON STOCK 111,139$ 107,126$ 68,129$ 64,389$
As Previously AsCONSOLIDATED BALANCE SHEETS Reported Restated
CURRENT ASSETS 361,930$ 361,930$
PROPERTY, PLANT AND EQUIPMENT 2,425,004 2,425,004
INVESTMENTS 337,716 337,716
DEFERRED CHARGES AND OTHER ASSETS: Regulatory assets 2,168,554 2,168,554 Goodwill 1,985,036 1,998,350 Other 4,978 4,978
4,158,568 4,171,882 7,283,218$ 7,296,532$
CURRENT LIABILITIES 488,851$ 513,973$
CAPITALIZATION: Common stockholder's equity 3,155,362 3,143,554 Preferred stock not subject to mandatory redemption 12,649 12,649 Long-term debt and other long-term obligations 1,238,984 1,238,984
4,406,995 4,395,187 NONCURRENT LIABILITIES: Power purchase contract loss liability 1,268,478 1,268,478 Accumulated deferred income taxes 645,741 645,741 Nuclear fuel disposal costs 169,884 169,884 Asset retirement obligation 72,655 72,655 Retirement benefits 103,036 103,036 Other 127,578 127,578
2,387,372 2,387,372 7,283,218$ 7,296,532$
ASSETS
CAPITALIZATION AND LIABILITIES
2004 2003
(In thousands)
(In thousands)

26
2004 2003As Previously As As Previously As
CONSOLIDATED STATEMENTS OF CASH FLOWS Reported Restated Reported Restated
CASH FLOWS FROM OPERATING ACTIVITIES:Net income 111,639$ 107,626$ 68,017$ 64,277$ Adjustments to reconcile net income to net cash from operating activities - Provision for depreciation 75,163 75,163 98,711 98,711 Amortization of regulatory assets 278,559 278,559 263,227 263,227 Deferred purchased power and other costs (263,257) (263,257) (276,214) (276,214) Deferred income taxes and investment tax credits, net 54,887 54,887 62,372 62,372 Accrued retirement benefit obligation (2,986) (2,986) 8,381 8,381 Accrued compensation, net 1,014 1,014 19,864 19,864 NUG power contract restructuring 52,800 52,800 - - Cash collateral from suppliers 6,662 6,662 - - Pension trust contribution (62,499) (62,499) - - Revenue credits to customers - - (71,984) (71,984) Disallowed regulatory assets - - 152,500 152,500 Decrease (increase) in operating assets- Receivables (13,360) (13,360) 4,528 4,528 Materials and supplies 45 45 (1,139) (1,139) Prepayments and other current assets 17,870 17,870 (11,640) (11,640) Increase (decrease) in operating liabilities- Accounts payable (2,887) (2,887) (153,953) (153,953) Accrued taxes 1,707 3,800 (12,925) (10,756) Accrued interest (4,484) (2,564) (12,319) (10,748) Other 11,780 11,780 42,526 42,526 Net cash provided from operating activities 262,653$ 262,653$ 179,952$ 179,952$
CASH FLOWS FROM FINANCING ACTIVITIES (81,825)$ (81,825)$ (139,309)$ (139,309)$
CASH FLOWS FROM INVESTING ACTIVITIES (180,937)$ (180,937)$ (45,195)$ (45,195)$
(In thousands)

27
3. PENSION AND OTHER POSTRETIREMENT BENEFIT PLANS FirstEnergy provides noncontributory defined benefit pension plans that cover substantially all of the Company's employees. The trusteed plans provide defined benefits based on years of service and compensation levels. The Company's funding policy is based on actuarial computations using the projected unit credit method. In the fourth quarter of 2005, FirstEnergy made a $500 million voluntary contribution to its pension plan (the Company's share was $79 million). Projections indicated that absent this funding, cash contributions would have been required at some point prior to 2010. Pre-funding the pension plan is expected to eliminate this future funding requirement under current pension funding rules and should also minimize FirstEnergy's exposure to any funding requirements resulting from proposed pension reform. FirstEnergy provides a minimum amount of noncontributory life insurance to retired employees in addition to optional contributory insurance. Health care benefits, which include certain employee contributions, deductibles and co-payments, are also available upon retirement to employees hired prior to January 1, 2005, their dependents and, under certain circumstances, their survivors. The Company recognizes the expected cost of providing other postretirement benefits to employees and their beneficiaries and covered dependents from the time employees are hired until they become eligible to receive those benefits. In addition, FirstEnergy has obligations to former or inactive employees after employment, but before retirement for disability related benefits. Pension and OPEB costs are affected by employee demographics (including age, compensation levels, and employment periods), the level of contributions made to the plans, and earnings on plan assets. Such factors may be further affected by business combinations which impact employee demographics, plan experience and other factors. Pension and OPEB costs may also be affected by changes in key assumptions, including anticipated rates of return on plan assets, the discount rates and health care trend rates used in determining the projected benefit obligations and pension and OPEB costs. FirstEnergy uses a December 31 measurement date for most of its plans. Unless otherwise indicated, the following tables provide information applicable to FirstEnergy’s pension and OPEB plans. Obligations and Funded Status Pension Benefits Other Benefits As of December 31 2005 2004 2005 2004 (In millions) Change in benefit obligation Benefit obligation as of January 1 $ 4,364 $ 4,162 $ 1,930 $ 2,368 Service cost 77 77 40 36 Interest cost 254 252 111 112 Plan participants’ contributions - - 18 14 Plan amendments 15 - (312 ) (281) Actuarial (gain) loss 310 134 197 (211) Benefits paid (270) (261) (100 ) (108) Benefit obligation as of December 31 $ 4,750 $ 4,364 $ 1,884 $ 1,930 Change in fair value of plan assets Fair value of plan assets as of January 1 $ 3,969 $ 3,315 $ 564 $ 537 Actual return on plan assets 325 415 33 57 Company contribution 500 500 58 64 Plan participants’ contribution - - 18 14 Benefits paid (270) (261) (100 ) (108) Fair value of plan assets as of December 31 $ 4,524 $ 3,969 $ 573 $ 564 Funded status $ (226) $ (395) $ (1,311 ) $ (1,366) Unrecognized net actuarial loss 1,179 885 899 730 Unrecognized prior service cost (benefit) 70 63 (645 ) (378) Net asset (liability) recognized $ 1,023 $ 553 $ (1,057 ) $ (1,014)

28
Amounts Recognized in the Consolidated Balance Sheets As of December 31
Prepaid benefit cost $ 1,023 $ - $ - $ - Accrued benefit cost - (14) (1,057 ) (1,014) Intangible assets - 63 - - Accumulated other comprehensive loss - 504 - - Net amount recognized $ 1,023 $ 553 $ (1,057 ) $ (1,014) Company's share of net amount recognized $ 148 $ 68 $ (70 ) $ (79) Decrease in minimum liability included in other comprehensive income (net of tax)
$ (295) $ (4) - -
Assumptions Used to Determine Benefit Obligations As of December 31 Discount rate 5.75% 6.00% 5.75 % 6.00%Rate of compensation increase 3.50% 3.50% Allocation of Plan Assets As of December 31 Asset Category
Equity securities 63% 68% 71 % 74%Debt securities 33 29 27 25 Real estate 2 2 - - Cash 2 1 2 1 Total 100% 100% 100 % 100% Information for Pension Plans With an Accumulated Benefit Obligation in Excess of Plan Assets
2005
2004 (In millions) Projected benefit obligation $ 4,750 $ 4,364 Accumulated benefit obligation 4,327 3,983 Fair value of plan assets 4,524 3,969 Pension Benefits Other Benefits Components of Net Periodic Benefit Costs 2005 2004 2003 2005 2004 2003 (In millions) Service cost $ 77 $ 77 $ 66 $ 40 $ 36 $ 43 Interest cost 254 252 253 111 112 137 Expected return on plan assets (345) (286) (248) (45 ) (44 ) (43) Amortization of prior service cost 8 9 9 (45 ) (40 ) (9) Amortization of transition obligation - - - - - 9 Recognized net actuarial loss 36 39 62 40 39 40 Net periodic cost $ 30 $ 91 $ 142 $ 101 $ 103 $ 177 Company's share of net periodic cost (income) $ (1) $ 7 $ 12 $ 7 $ 5 $ 12 Weighted-Average Assumptions Used to Determine Net Periodic Benefit Cost Pension Benefits Other Benefits for Years Ended December 31 2005 2004 2003 2005 2004 2003 Discount rate 6.00% 6.25% 6.75% 6.00 % 6.25 % 6.75%Expected long-term return on plan assets 9.00% 9.00% 9.00% 9.00 % 9.00 % 9.00%Rate of compensation increase 3.50% 3.50% 3.50% In selecting an assumed discount rate, FirstEnergy considers currently available rates of return of high-quality fixed income investments expected to be available during the period to maturity of the pension and other postretirement benefit obligations. The assumed rates of return on pension plan assets consider historical market returns and economic forecasts for the types of investments held by the Company's pension trusts. The long-term rate of return is developed considering the portfolio’s asset allocation strategy.

29
FirstEnergy employs a total return investment approach whereby a mix of equities and fixed income investments are used to maximize the long-term return on plan assets for a prudent level of risk. Risk tolerance is established through careful consideration of plan liabilities, plan funded status, and corporate financial condition. The investment portfolio contains a diversified blend of equity and fixed-income investments. Furthermore, equity investments are diversified across U.S. and non-U.S. stocks, as well as growth, value, and small and large capitalization funds. Other assets such as real estate are used to enhance long-term returns while improving portfolio diversification. Derivatives may be used to gain market exposure in an efficient and timely manner; however, derivatives are not used to leverage the portfolio beyond the market value of the underlying investments. Investment risk is measured and monitored on a continuing basis through periodic investment portfolio reviews, annual liability measurements, and periodic asset/liability studies.
Assumed Health Care Cost Trend Rates As of December 31 2005 2004 Health care cost trend rate assumed for next year (pre/post-Medicare) 9-11%
9-11
%
Rate to which the cost trend rate is assumed to decline (the ultimate trend rate) 5%
5
%
Year that the rate reaches the ultimate trend rate (pre/post-Medicare) 2010-2012
2009-2011
Assumed health care cost trend rates have a significant effect on the amounts reported for the health care plans. A one-percentage-point change in assumed health care cost trend rates would have the following effects:
1-Percentage- 1-Percentage- Point Increase Point Decrease (In millions) Effect on total of service and interest cost $ 23 $ (19 ) Effect on postretirement benefit obligation $ 239 $ (209 )
As a result of its voluntary contribution and the increased market value of pension plan assets, the Company recognized a prepaid pension cost of $148 million as of December 31, 2005. As prescribed by SFAS 87, the Company eliminated its additional minimum liability of $90 million. In addition, the entire AOCL balance was credited by $53 million (net of $37 million of deferred taxes) as the fair value of trust assets exceeded the accumulated benefit obligation as of December 31, 2005. Taking into account estimated employee future service, FirstEnergy expects to make the following benefit payments from plan assets:
Pension Benefits
Other Benefits
(In millions) 2006 $ 228 $ 1062007 228 1092008 236 1122009 247 1152010 264 119Years 2011 - 2015 1,531 642
The Company also maintains an unfunded benefit plan under which non-qualified supplemental pension benefits are paid to certain employees in addition to amounts received under the Company's qualified retirement plan, which is subject to IRS limitations on covered compensation. The net liability recognized was $2 million as of December 31, 2005. 4. FAIR VALUE OF FINANCIAL INSTRUMENTS: Long-term Debt and Other Long-term Obligations- All borrowings with initial maturities of less than one year are defined as financial instruments under GAAP and are reported on the Consolidated Balance Sheets at cost, which approximates their fair market value. The following table provides the approximate fair value and related carrying amounts of long-term debt as of December 31:
2005 2004 Carrying Fair Carrying Fair Value Value Value Value (In millions) Long-term debt $ 1,191 $ 1,214 $ 1,264 $ 1,252
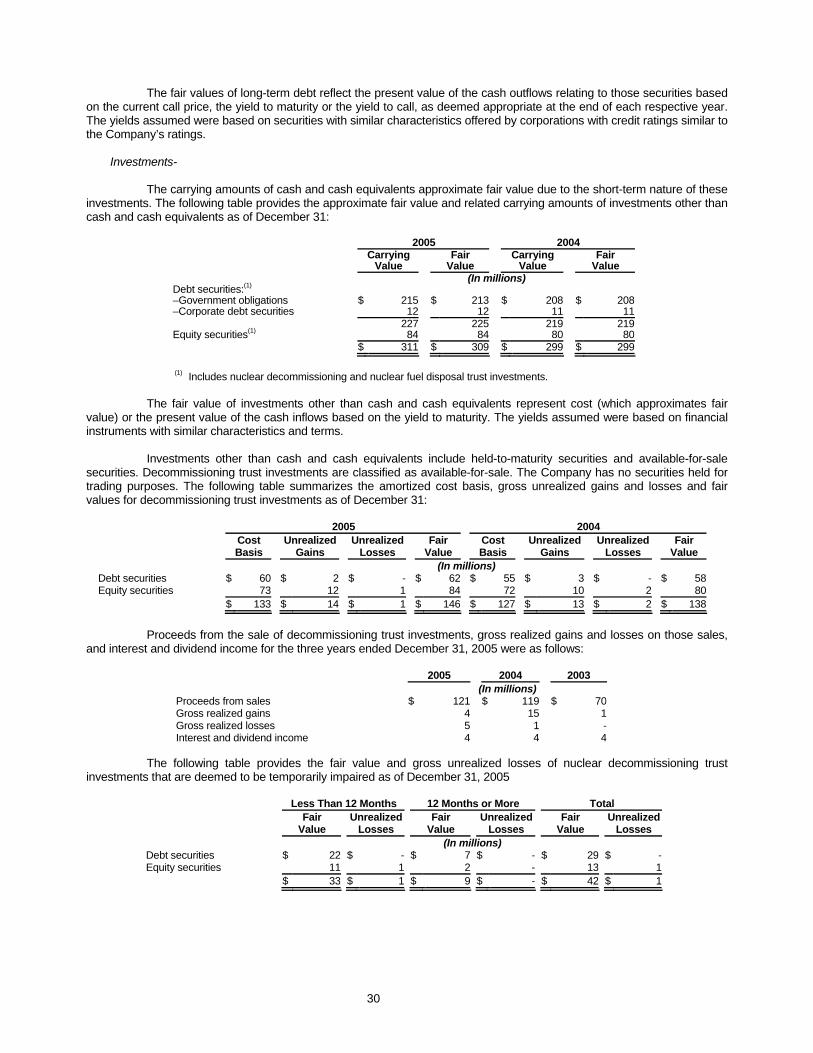
30
The fair values of long-term debt reflect the present value of the cash outflows relating to those securities based on the current call price, the yield to maturity or the yield to call, as deemed appropriate at the end of each respective year. The yields assumed were based on securities with similar characteristics offered by corporations with credit ratings similar to the Company’s ratings. Investments- The carrying amounts of cash and cash equivalents approximate fair value due to the short-term nature of these investments. The following table provides the approximate fair value and related carrying amounts of investments other than cash and cash equivalents as of December 31:
2005 2004 Carrying Fair Carrying Fair Value Value Value Value (In millions) Debt securities:(1) –Government obligations $ 215 $ 213 $ 208 $ 208 –Corporate debt securities 12 12 11 11 227 225 219 219 Equity securities(1) 84 84 80 80 $ 311 $ 309 $ 299 $ 299
(1) Includes nuclear decommissioning and nuclear fuel disposal trust investments.
The fair value of investments other than cash and cash equivalents represent cost (which approximates fair value) or the present value of the cash inflows based on the yield to maturity. The yields assumed were based on financial instruments with similar characteristics and terms. Investments other than cash and cash equivalents include held-to-maturity securities and available-for-sale securities. Decommissioning trust investments are classified as available-for-sale. The Company has no securities held for trading purposes. The following table summarizes the amortized cost basis, gross unrealized gains and losses and fair values for decommissioning trust investments as of December 31:
2005 2004 Cost Unrealized Unrealized Fair Cost Unrealized Unrealized Fair Basis Gains Losses Value Basis Gains Losses Value (In millions) Debt securities $ 60 $ 2 $ - $ 62 $ 55 $ 3 $ - $ 58 Equity securities 73 12 1 84 72 10 2 80 $ 133 $ 14 $ 1 $ 146 $ 127 $ 13 $ 2 $ 138
Proceeds from the sale of decommissioning trust investments, gross realized gains and losses on those sales, and interest and dividend income for the three years ended December 31, 2005 were as follows:
2005 2004 2003 (In millions) Proceeds from sales $ 121 $ 119 $ 70 Gross realized gains 4 15 1 Gross realized losses 5 1 - Interest and dividend income 4 4 4
The following table provides the fair value and gross unrealized losses of nuclear decommissioning trust investments that are deemed to be temporarily impaired as of December 31, 2005
Less Than 12 Months 12 Months or More Total Fair Unrealized Fair Unrealized Fair Unrealized Value Losses Value Losses Value Losses (In millions) Debt securities $ 22 $ - $ 7 $ - $ 29 $ -Equity securities 11 1 2 - 13 1 $ 33 $ 1 $ 9 $ - $ 42 $ 1

31
The Company periodically evaluates the securities held by its nuclear decommissioning trusts for other-than-temporary impairment. The Company considers the length of time and the extent to which the security's fair value has been less than its cost basis and other factors to determine whether an impairment is other than temporary. The Company's decommissioning trusts are subject to regulatory accounting in accordance with SFAS 71. Net unrealized gains and losses are recorded as regulatory liabilities or assets since the difference between investments held in trust and the decommissioning liabilities are recovered from or refunded to customers. The investment policy for the nuclear decommissioning trust funds restricts or limits the ability to hold certain types of assets including private or direct placements, warrants, securities of FirstEnergy, investments in companies owning nuclear power plants, financial derivatives, preferred stocks, securities convertible into common stock and securities of the trust fund's custodian or managers and their parents or subsidiaries. 5. LEASES: Consistent with the regulatory treatment, the rentals for operating leases are charged to operating expenses on the Consolidated Statements of Income. The Company's most significant operating leases relate to the sale and leaseback of a portion of its ownership interest in the Merrill Creek Reservoir project and the lease of vehicles. Such costs for the three years ended December 31, 2005 are summarized as follows:
2005 2004 2003 (In millions) Operating leases Interest element $ 2.6 $ 2.6 $ 3.1 Other 3.2 3.7 5.1 Total rentals $ 5.8 $ 6.3 $ 8.2
The future minimum lease payments as of December 31, 2005 are:
Operating Leases
(In millions)2006 $ 6.52007 6.42008 6.22009 6.42010 5.8Years thereafter 72.0
Total minimum lease payments 103.3
6. VARIABLE INTEREST ENTITIES: FIN 46R addresses the consolidation of VIEs, including special-purpose entities, that are not controlled through voting interests or in which the equity investors do not bear the residual economic risks and rewards. FirstEnergy adopted FIN 46R for special-purpose entities as of December 31, 2003 and for all other entities in the first quarter of 2004. The Company consolidates VIEs when it is determined to be the VIE's primary beneficiary as defined by FIN 46R. The Company has evaluated its power purchase agreements and determined that certain NUG entities may be VIEs to the extent they own a plant that sells substantially all of its output to the Company and the contract price for power is correlated with the plant’s variable costs of production. The Company maintains several long-term power purchase agreements with NUG entities. The agreements were structured pursuant to the Public Utility Regulatory Policies Act of 1978. The Company was not involved in the creation of, and has no equity or debt invested in, these entities. The Company has determined that for all but five of these entities, the Company has no variable interests in the entities or the entities are governmental or not-for-profit organizations not within the scope of FIN 46R. The Company may hold variable interests in the remaining five entities, which sell their output at variable prices that correlate to some extent with the operating costs of the plants.

32
As required by FIN 46R, the Company periodically requests the information necessary from these entities to determine whether they are VIEs or whether the Company is the primary beneficiary. The Company has been unable to obtain the requested information, which in most cases, was deemed by the requested entity to be proprietary. As such, the Company applied the scope exception that exempts enterprises unable to obtain the necessary information to evaluate entities under FIN 46R. The purchased power costs from these entities during 2005, 2004 and 2003, were $101 million, $94 million and $88 million, respectively. 7. REGULATORY MATTERS: In late 2003 and early 2004, a series of letters, reports and recommendations were issued from various entities, including governmental, industry and ad hoc reliability entities (PUCO, FERC, NERC and the U.S. – Canada Power System Outage Task Force) regarding enhancements to regional reliability. In 2004, FirstEnergy completed implementation of all actions and initiatives related to enhancing area reliability, improving voltage and reactive management, operator readiness and training and emergency response preparedness recommended for completion in 2004. On July 14, 2004, NERC independently verified that FirstEnergy had implemented the various initiatives to be completed by June 30 or summer 2004, with minor exceptions noted by FirstEnergy, which exceptions are now essentially complete. FirstEnergy is proceeding with the implementation of the recommendations that were to be completed subsequent to 2004 and will continue to periodically assess the FERC-ordered Reliability Study recommendations for forecasted 2009 system conditions, recognizing revised load forecasts and other changing system conditions which may impact the recommendations. Thus far, implementation of the recommendations has not required, nor is expected to require, substantial investment in new, or material upgrades to existing equipment. The FERC or other applicable government agencies and reliability coordinators may, however, take a different view as to recommended enhancements or may recommend additional enhancements in the future as the result of adoption of mandatory reliability standards pursuant to the EPACT that could require additional, material expenditures. Finally, the PUCO is continuing to review the FirstEnergy filing that addressed upgrades to control room computer hardware and software and enhancements to the training of control room operators before determining the next steps, if any, in the proceeding. As a result of outages experienced in the Company's service area in 2002 and 2003, the NJBPU had implemented reviews into the Company's service reliability. In 2004, the NJBPU adopted an MOU that set out specific tasks related to service reliability to be performed by the Company and a timetable for completion and endorsed the Company's ongoing actions to implement the MOU. On June 9, 2004, the NJBPU approved a Stipulation that incorporates the final report of a Special Reliability Master who made recommendations on appropriate courses of action necessary to ensure system-wide reliability. The Stipulation also incorporates the Executive Summary and Recommendation portions of the final report of a focused audit of the Company's Planning and Operations and Maintenance programs and practices (Focused Audit). A final order in the Focused Audit docket was issued by the NJBPU on July 23, 2004. On February 11, 2005, the Company met with the Ratepayer Advocate to discuss reliability improvements. The Company continues to file compliance reports reflecting activities associated with the MOU and Stipulation. The EPACT provides for the creation of an ERO to establish and enforce reliability standards for the bulk power system, subject to FERC review. On February 3, 2006, the FERC adopted a rule establishing certification requirements for the ERO, as well as regional entities envisioned to assume monitoring responsibility for the new reliability standards. The NERC has been preparing the implementation aspects of reorganizing its structure to meet the FERC’s certification requirements for the ERO. The NERC will make a filing with the FERC to obtain certification as the ERO and to obtain FERC approval of delegation agreements with regional entities. The new FERC rule referred to above, further provides for reorganizing regional reliability organizations (regional entities) that would replace the current regional councils and for rearranging the relationship with the ERO. The “regional entity” may be delegated authority by the ERO, subject to FERC approval, for enforcing reliability standards adopted by the ERO and approved by the FERC. NERC also intends to make a parallel filing with the FERC seeking approval of mandatory reliability standards. These reliability standards are expected to be based on the current NERC Version 0 reliability standards with some additional standards. The two filings are expected to be made in the second quarter of 2006. The ECAR, Mid-Atlantic Area Council, and Mid-American Interconnected Network reliability councils have completed the consolidation of these regions into a single new regional reliability organization known as ReliabilityFirst Corporation. ReliabilityFirst began operations as a regional reliability council under NERC on January 1, 2006 and intends to file and obtain certification consistent with the final rule as a “regional entity” under the ERO during 2006. All of FirstEnergy’s facilities are located within the ReliabilityFirst region. On a parallel path, the NERC is establishing working groups to develop reliability standards to be filed for approval with the FERC following the NERC’s certification as an ERO. These reliability standards are expected to build on the current NERC Version 0 reliability standards. It is expected that the proposed reliability standards will be filed with the FERC in early 2006.

33
FirstEnergy believes it is in compliance with all current NERC reliability standards. However, it is expected that the FERC will adopt stricter reliability standards than those contained in the current NERC Version 0 standards. The financial impact of complying with the new standards cannot be determined at this time. However, the EPACT required that all prudent costs incurred to comply with the new reliability standards be recovered in rates. The Company is permitted to defer for future collection from customers the amounts by which its costs of supplying BGS to non-shopping customers and costs incurred under NUG agreements exceed amounts collected through BGS and MTC rates and market sales of NUG energy and capacity. As of December 31, 2005, the accumulated deferred cost balance totaled approximately $541 million. New Jersey law allows for securitization of the Company's deferred balance upon application by the Company and a determination by the NJBPU that the conditions of the New Jersey restructuring legislation are met. On February 14, 2003, the Company filed for approval to securitize the July 31, 2003 deferred balance. The Company is in discussions with the NJBPU staff as a result of the stipulated settlement agreements (as further discussed below) which recommended that the NJBPU issue an order regarding the Company's application. On July 20, 2005, the Company requested the NJBPU to set a procedural schedule for this matter and is awaiting NJBPU action. On February 1, 2006, the NJBPU selected Bear Stearns as the financial advisor. On December 2, 2005, the Company filed a request for recovery of $165 million of actual above-market NUG costs incurred from August 1, 2005 through October 31, 2005 and forecasted above-market NUG costs for November and December 2005. The filing also includes a request for recovery of $49 million for above-market NUG costs incurred prior to August 1, 2003, to the extent those costs are not recoverable through securitization. The 2003 NJBPU decision on the Company's base electric rate proceeding (the Phase I Order) disallowed certain regulatory assets and provided for an interim return on equity of 9.5% on the Company's rate base. The Phase I order also provided for a Phase II proceeding in which the NJBPU would review whether the Company is in compliance with current service reliability and quality standards and determine whether the expenditures and projects undertaken by the Company to increase its system's reliability are prudent and reasonable for rate recovery. Depending on its assessment of the Company's service reliability, the NJBPU could have increased the Company's return on equity to 9.75% or decreased it to 9.25%. On July 16, 2004, the Company filed the Phase II petition and testimony with the NJBPU, requesting an increase in base rates of $36 million for the recovery of system reliability costs and a 9.75% return on equity. The filing also requested an increase to the MTC deferred balance recovery of approximately $20 million annually. On May 25, 2005, the NJBPU approved two stipulated settlement agreements. The first stipulation between the Company and the NJBPU staff resolves all of the issues associated with the Company's motion for reconsideration of the Phase I Order. The second stipulation between the Company, the NJBPU staff and the Ratepayer Advocate resolves all of the issues associated with the Company's Phase II proceeding. The stipulated settlements provide for, among other things, the following:
• An annual increase in distribution revenues of $23 million effective June 1, 2005, associated with the Phase I Order reconsideration;
• An annual increase in distribution revenues of $36 million effective June 1, 2005, related to the Company's
Phase II Petition;
• An annual reduction in both rates and amortization expense of $8 million, effective June 1, 2005, in anticipation of an NJBPU order regarding the Company's request to securitize up to $277 million of its deferred cost balance;
• An increase in the Company's authorized return on common equity from 9.5% to 9.75%; and
• A commitment by the Company, through December 31, 2006 or until related legislation is adopted,
whichever occurs first, to maintain a target level of customer service reliability with a reduction in the Company's authorized return on common equity from 9.75% to 9.5% if the target is not met for two consecutive quarters. The authorized return on common equity would then be restored to 9.75% if the target is met for two consecutive quarters.
The Phase II stipulation included an agreement that the distribution revenue increase also reflects a three-year amortization of the Company's one-time service reliability improvement costs incurred in 2003-2005. This resulted in the creation of a regulatory asset associated with accelerated tree trimming and other reliability costs which were expensed in 2003 and 2004. The establishment of the new regulatory asset of approximately $28 million resulted in an increase to net income of approximately $16 million in the second quarter of 2005.

34
The Company sells all self-supplied energy (NUGs and owned generation) to the wholesale market with offsetting credits to its deferred energy balance with the exception of 300 MW from the Company's NUG committed supply currently being used to serve BGS customers pursuant to NJBPU order for the period June 1, 2005 through May 31, 2006. New BGS tariffs reflecting the results of a February 2005 auction for the BGS supply became effective June 1, 2005. The NJBPU decision approving the BGS procurement proposal for the period beginning June 1, 2006 was issued on October 12, 2005. The Company submitted a compliance filing on October 26, 2005, which was approved on November 10, 2005. The written Order was dated December 8, 2005. The auction took place in early February 2006 and the results have been approved by the NJBPU. In accordance with an April 28, 2004 NJBPU order, the Company filed testimony on June 7, 2004 supporting a continuation of the current level and duration of the funding of TMI-2 decommissioning costs by New Jersey customers without a reduction, termination or capping of the funding. On September 30, 2004, the Company filed an updated TMI-2 decommissioning study. This study resulted in an updated total decommissioning cost estimate of $729 million (in 2003 dollars) compared to the estimated $528 million (in 2003 dollars) from the prior 1995 decommissioning study. The Ratepayer Advocate filed comments on February 28, 2005. On March 18, 2005, the Company filed a response to those comments. A schedule for further proceedings has not yet been set. On August 1, 2005, the NJBPU established a proceeding to determine whether additional ratepayer protections are required at the state level in light of the recent repeal of PUHCA under the EPACT. An NJBPU proposed rulemaking to address the issues was published in the NJ Register on December 19, 2005. The proposal would prevent a holding company that owns a gas or electric public utility from investing more than 25% of the combined assets of its utility and utility-related subsidiaries into businesses unrelated to the utility industry. A public hearing was held on February 7, 2006 and comments may be submitted to the NJBPU by February 17, 2006. JCP&L is not able to predict the outcome of this proceeding at this time. The Company, ATSI, Met-Ed, Penelec, and FES continue to be involved in FERC hearings concerning the calculation and imposition of Seams Elimination Cost Adjustment (SECA) charges to various load serving entities. Pursuant to its January 30, 2006 Order, the FERC has compressed both phases of this proceeding into a single hearing scheduled to begin May 1, 2006, with an initial decision on or before August 11, 2006. On January 31, 2005, certain PJM transmission owners made three filings pursuant to a settlement agreement previously approved by the FERC. The Company, Met-Ed and Penelec were parties to that proceeding and joined in two of the filings. In the first filing, the settling transmission owners submitted a filing justifying continuation of their existing rate design within the PJM RTO. In the second filing, the settling transmission owners proposed a revised Schedule 12 to the PJM tariff designed to harmonize the rate treatment of new and existing transmission facilities. Interventions and protests were filed on February 22, 2005. In the third filing, Baltimore Gas and Electric Company and Pepco Holdings, Inc. requested a formula rate for transmission service provided within their respective zones. On May 31, 2005, the FERC issued an order on these cases. First, it set for hearing the existing rate design and indicated that it will issue a final order within six months. Second, the FERC approved the proposed Schedule 12 rate harmonization. Third, the FERC accepted the proposed formula rate, subject to referral and hearing procedures. On June 30, 2005, the PJM transmission owners filed a request for rehearing of the May 31, 2005 order. The rate design and formula rate proceedings are currently being litigated before the FERC. If FERC accepts AEP’s proposal to create a “postage stamp” rate for high voltage transmission facilities across PJM, significant additional transmission revenues would be imposed on the Company, Met-Ed, Penelec, and other transmission zones within PJM. 8. CAPITALIZATION: (A) RETAINED EARNINGS- In general, the Company’s first mortgage indenture restricts the payment of dividends or distributions on or with respect to the Company’s common stock to amounts credited to earned surplus since the date of its indenture. As of December 31, 2005, the Company had retained earnings available to pay common stock dividends of $54 million, net of amounts restricted under the Company’s first mortgage indenture. (B) PREFERRED AND PREFERENCE STOCK- Preferred stock may be redeemed by the Company, in whole or in part, with 30-90 days’ notice.

35
(C) LONG-TERM DEBT AND OTHER LONG-TERM OBLIGATIONS- Securitized Transition Bonds JCP&L Transition (Issuer), a wholly owned limited liability company of the Company, sold $320 million of transition bonds to securitize the recovery of the Company’s bondable stranded costs associated with the previously divested Oyster Creek Nuclear Generating Station. The Company did not purchase and does not own any of the transition bonds. As of December 31, 2005, $264 million of transition bonds are outstanding and included in long-term debt on the Company’s Consolidated Balance Sheet. The transition bonds represent obligations only of the Issuer and are collateralized solely by the equity and assets of the Issuer, which consist primarily of bondable transition property. The bondable transition property is solely the property of the Issuer. Bondable transition property represents the irrevocable right of a utility company to charge, collect and receive from its customers, through a non-bypassable TBC, the principal amount and interest on the transition bonds and other fees and expenses associated with their issuance. The Company, as servicer, manages and administers the bondable transition property, including the billing, collection and remittance of the TBC, pursuant to a servicing agreement with the Issuer. The Company is entitled to a quarterly servicing fee of $100,000 that is payable from TBC collections. Other Long-term Debt The Company’s first mortgage indenture, which secures all of the Company’s FMB, serves as a direct first mortgage lien on substantially all of the Company’s property and franchises, other than specifically excepted property. The Company has various debt covenants under its financing arrangements. The most restrictive of these relate to the nonpayment of interest and/or principal on debt, which could trigger a default. Cross-default provisions also exist between FirstEnergy and the Company. Based on the amount of bonds authenticated by the Trustee through December 31, 2005, the Company’s annual sinking fund requirements for all bonds issued under the mortgage amount to $16 million. The Company could fulfill its sinking fund obligation by providing refundable bonds, property additions or cash to the Trustee. Sinking fund requirements for FMB and maturing long-term debt for the next five years are:
(In millions) 2006 $ 2072007 182008 192009 202010 21
9. ASSET RETIREMENT OBLIGATION: In January 2003, the Company implemented SFAS 143, which provides accounting guidance for retirement obligations associated with tangible long-lived assets. This standard requires recognition of the fair value of a liability for an ARO in the period in which it is incurred. The associated asset retirement costs are capitalized as part of the carrying amount of the long-lived asset. Over time the capitalized costs are depreciated and the present value of the ARO increases, resulting in a period expense. However, rate-regulated entities may recognize a regulatory asset or liability instead of an expense if the criteria for such treatment are met. Upon retirement, a gain or loss would be recognized if the cost to settle the retirement obligation differs from the carrying amount. The Company initially identified applicable legal obligations as defined under the standard for nuclear power plant decommissioning of TMI-2. The ARO liability as of the date of adoption was $104 million, including accumulated accretion for the period from the date the liability was incurred to the date of adoption. The Company expects substantially all nuclear decommissioning costs to be recoverable through regulated rates. Therefore, a regulatory liability of $26 million was recognized upon adoption of SFAS 143. The Company’s share of the obligation to decommission these units was developed based on site specific studies performed by an independent engineer. The Company utilized an expected cash flow approach to measure the fair value of the nuclear decommissioning ARO. In 2004, the Company revised the ARO associated with TMI-2 as the result of an updated study and the anticipated operating license extension for TMI-1. The abandoned TMI-2 is adjacent to TMI-1 and the units are expected to be decommissioned concurrently. The net decrease in the TMI-2 ARO liability and corresponding regulatory asset was $43 million.

36
The Company maintains the nuclear decommissioning trust funds that are legally restricted for purposes of settling the nuclear decommissioning ARO. As of December 31, 2005, the fair value of the decommissioning trust assets was $146 million. The Company implemented FIN 47, "Accounting for Conditional Asset Retirement Obligations", an interpretation of SFAS 143 on December 31, 2005. FIN 47 provides accounting standards for conditional retirement obligations associated with tangible long-lived assets, requiring recognition of the fair value of a liability for an ARO in the period in which it is incurred if a reasonable estimate can be identified. FIN 47 states that an obligation exists even though there may be uncertainty about timing or method of settlement and further clarifies SFAS 143, stating that the uncertainty surrounding the timing and method of settlement when settlement is conditional on a future event occurring should be reflected in the measurement of the liability not in the recognition of the liability. Accounting for conditional ARO under FIN 47 is the same as described above for SFAS 143. The adoption of FIN 47 had an immaterial impact on the Company’s year ended December 31, 2005 results.
The following table describes the changes to the ARO balances during 2005 and 2004.
2005 2004 ARO Reconciliation (In millions) Balance at beginning of year $ 73 110 Accretion 5 5 Revisions in estimated cash flows - (42) FIN 47 ARO 2 - Balance at end of year $ 80 73
10. SHORT-TERM BORROWINGS: Short-term borrowings outstanding as of December 31, 2005, consisted of $181 million of borrowings from affiliates. In June 2005, the Company, FirstEnergy, OE, Penn, CEI, TE, Met-Ed, Penelec, FES and ATSI, as Borrowers, entered into a syndicated $2 billion five-year revolving credit facility. Borrowings under the facility are available to each Borrower separately and mature on the earlier of 364 days from the date of borrowing or the commitment termination date, as the same may be extended. The Company's borrowing limit under the facility is $425 million. The average interest rate on short-term borrowings outstanding as of December 31, 2005 and 2004, was 4.0% and 2.0%, respectively. 11. COMMITMENTS, GUARANTEES AND CONTINGENCIES: (A) NUCLEAR INSURANCE- The Price-Anderson Act limits the public liability relative to a single incident at a nuclear power plant to $10.8 billion. The amount is covered by a combination of private insurance and an industry retrospective rating plan. Based on its present ownership interest in TMI-2, the Company is exempt from any potential assessment under the industry retrospective rating plan. The Company is also insured as to its interest in TMI-2 under a policy issued to the operating company for the plant. Under this policy, $150 million is provided for property damage and decontamination and decommissioning costs. Under this policy, the Company can be assessed a maximum of approximately $0.2 million for incidents at any covered nuclear facility occurring during a policy year which are in excess of accumulated funds available to the insurer for paying losses. The Company intends to maintain insurance against nuclear risks as described above as long as it is available. To the extent that property damage, decontamination, decommissioning, repair and replacement costs and other such costs arising from a nuclear incident at TMI-2 exceed the policy limits of the insurance in effect with respect to that plant, to the extent a nuclear incident is determined not to be covered by the Company’s insurance policies, or to the extent such insurance becomes unavailable in the future, the Company would remain at risk for such costs. (B) ENVIRONMENTAL MATTERS- The Company accrues environmental liabilities only when it concludes that it is probable that it has an obligation for such costs and can reasonably estimate the amount of such costs. Unasserted claims are reflected in the Company’s determination of environmental liabilities and are accrued in the period that they are both probable and reasonably estimable.

37
The Company has been named as a PRP at waste disposal sites, which may require cleanup under the Comprehensive Environmental Response, Compensation, and Liability Act of 1980. Allegations of disposal of hazardous substances at historical sites and the liability involved are often unsubstantiated and subject to dispute; however, federal law provides that all PRPs for a particular site are liable on a joint and several basis. Therefore, environmental liabilities that are considered probable have been recognized on the Consolidated Balance Sheet as of December 31, 2005, based on estimates of the total costs of cleanup, the Company’s proportionate responsibility for such costs and the financial ability of other unaffiliated entities to pay. In addition, the Company has accrued liabilities for environmental remediation of former manufactured gas plants in New Jersey; those costs are being recovered by the Company through a non-bypassable SBC. Total liabilities of approximately $47.3 million have been accrued through December 31, 2005. On December 1, 2005, FirstEnergy issued a comprehensive report to shareholders regarding air emissions regulations and an assessment of its future risks and mitigation efforts. (C) OTHER LEGAL PROCEEDINGS- Power Outages and Related Litigation In July 1999, the Mid-Atlantic States experienced a severe heat wave, which resulted in power outages throughout the service territories of many electric utilities, including the Company's territory. In an investigation into the causes of the outages and the reliability of the transmission and distribution systems of all four of New Jersey’s electric utilities, the NJBPU concluded that there was not a prima facie case demonstrating that, overall, the Company provided unsafe, inadequate or improper service to its customers. Two class action lawsuits (subsequently consolidated into a single proceeding) were filed in New Jersey Superior Court in July 1999 against the Company, GPU and other GPU companies, seeking compensatory and punitive damages arising from the July 1999 service interruptions in the Company's territory. In August 2002, the trial court granted partial summary judgment to the Company and dismissed the plaintiffs' claims for consumer fraud, common law fraud, negligent misrepresentation, and strict product liability. In November 2003, the trial court granted the Company's motion to decertify the class and denied plaintiffs' motion to permit into evidence their class-wide damage model indicating damages in excess of $50 million. These class decertification and damage rulings were appealed to the Appellate Division. The Appellate Division issued a decision on July 8, 2004, affirming the decertification of the originally certified class, but remanding for certification of a class limited to those customers directly impacted by the outages of the Company's transformers in Red Bank, New Jersey. On September 8, 2004, the New Jersey Supreme Court denied the motions filed by plaintiffs and the Company for leave to appeal the decision of the Appellate Division. The Company has filed a motion for summary judgment. FirstEnergy is unable to predict the outcome of these matters and no liability has been accrued as of December 31, 2005. On August 14, 2003, various states and parts of southern Canada experienced widespread power outages. The outages affected approximately 1.4 million customers in FirstEnergy's service area. The U.S. – Canada Power System Outage Task Force’s final report in April 2004 on the outages concluded, among other things, that the problems leading to the outages began in FirstEnergy’s Ohio service area. Specifically, the final report concluded, among other things, that the initiation of the August 14, 2003 power outages resulted from an alleged failure of both FirstEnergy and ECAR to assess and understand perceived inadequacies within the FirstEnergy system; inadequate situational awareness of the developing conditions; and a perceived failure to adequately manage tree growth in certain transmission rights of way. The Task Force also concluded that there was a failure of the interconnected grid's reliability organizations (MISO and PJM) to provide effective real-time diagnostic support. The final report is publicly available through the Department of Energy’s website (www.doe.gov). FirstEnergy believes that the final report does not provide a complete and comprehensive picture of the conditions that contributed to the August 14, 2003 power outages and that it does not adequately address the underlying causes of the outages. FirstEnergy remains convinced that the outages cannot be explained by events on any one utility's system. The final report contained 46 “recommendations to prevent or minimize the scope of future blackouts.” Forty-five of those recommendations related to broad industry or policy matters while one, including subparts, related to activities the Task Force recommended be undertaken by FirstEnergy, MISO, PJM, ECAR, and other parties to correct the causes of the August 14, 2003 power outages. FirstEnergy implemented several initiatives, both prior to and since the August 14, 2003 power outages, which were independently verified by NERC as complete in 2004 and were consistent with these and other recommendations and collectively enhance the reliability of its electric system. FirstEnergy’s implementation of these recommendations in 2004 included completion of the Task Force recommendations that were directed toward FirstEnergy. FirstEnergy also is proceeding with the implementation of the recommendations regarding enhancements to regional reliability that were to be completed subsequent to 2004 and will continue to periodically assess the FERC-ordered Reliability Study recommendations for forecasted 2009 system conditions, recognizing revised load forecasts and other changing system conditions which may impact the recommendations. Thus far, implementation of the recommendations has not required, nor is expected to require, substantial investment in new or material upgrades to existing equipment, and therefore FirstEnergy has not accrued a liability as of December 31, 2005 for any expenditures in excess of those actually incurred through that date. The FERC or other applicable government agencies and reliability coordinators may, however, take a different view as to recommended enhancements or may recommend additional enhancements in the future that could require additional, material expenditures. Finally, the PUCO is continuing to review FirstEnergy’s filing that addressed upgrades to control room computer hardware and software and enhancements to the training of control room operators, before determining the next steps, if any, in the proceeding.

38
In addition to the above proceedings, FirstEnergy was named in a complaint filed in Michigan State Court by an individual who is not a customer of any FirstEnergy company. A responsive pleading to this matter has been filed. FirstEnergy was also named, along with several other entities, in a complaint in New Jersey State Court. The allegations against FirstEnergy are based, in part, on an alleged failure to protect the citizens of Jersey City from an electrical power outage. No FirstEnergy entity serves any customers in Jersey City. A responsive pleading has been filed. No estimate of potential liability has been undertaken in either of these matters. FirstEnergy is vigorously defending these actions, but cannot predict the outcome of any of these proceedings or whether any further regulatory proceedings or legal actions may be initiated against the Companies. Although unable to predict the impact of these proceedings, if FirstEnergy or its subsidiaries were ultimately determined to have legal liability in connection with these proceedings, it could have a material adverse effect on FirstEnergy's or its subsidiaries' financial condition, results of operations and cash flows. Legal Matters There are various lawsuits, claims (including claims for asbestos exposure) and proceedings related to FirstEnergy's normal business operations pending against FirstEnergy and its subsidiaries. The other potentially material items not otherwise discussed above are described below. The Company’s bargaining unit employees filed a grievance challenging the Company’s 2002 call-out procedure that required bargaining unit employees to respond to emergency power outages. On May 20, 2004, an arbitration panel concluded that the call-out procedure violated the parties' collective bargaining agreement. At the conclusion of the June 1, 2005 hearing, the Arbitrator decided not to hear testimony on damages and closed the proceedings. On September 9, 2005, the Arbitrator issued an opinion to award approximately $16 million to the bargaining unit employees. On February 6, 2006, the federal court granted a Union motion to dismiss the Company’s appeal of the award as premature. The Company will file its appeal again in federal district court once the damages associated with this case are identified at an individual employee level. The Company recognized a liability for the potential $16 million award in 2005. If it were ultimately determined that FirstEnergy or its subsidiaries have legal liability or are otherwise made subject to liability based on the above matters, it could have a material adverse effect on FirstEnergy's or its subsidiaries' financial condition, results of operations and cash flows. 12. NEW ACCOUNTING STANDARDS AND INTERPRETATIONS: FSP FAS 115-1 and FAS 124-1, "The Meaning of Other-Than-Temporary Impairment and its Application to Certain
Investments" Issued in November 2005, FSP 115-1 and FAS 124-1 addresses the determination as to when an investment is considered impaired, whether that impairment is other than temporary, and the measurement of an impairment loss. The FSP finalized and renamed EITF 03-1 and 03-1-a to FSP FAS 115-1. This FSP will (1) nullify certain requirements of Issue 03-1 and supersedes EITF topic No. D-44, "Recognition of Other Than Temporary Impairment upon the Planned Sale of a Security Whose Cost Exceeds Fair Value," (2) clarify that an investor should recognize an impairment loss no later than when the impairment is deemed other than temporary, even if a decision to sell has not been made, and (3) be effective for other-than-temporary impairment and analyses conducted in periods beginning after September 15, 2005. The FSP requires prospective application with an effective date for reporting periods beginning after December 15, 2005. The Company is currently evaluating this FSP and any impact on its investments. EITF Issue 04-13, "Accounting for Purchases and Sales of Inventory with the Same Counterparty" In September 2005, the EITF reached a final consensus on Issue 04-13 concluding that two or more legally separate exchange transactions with the same counterparty should be combined and considered as a single arrangement for purposes of applying APB 29, when the transactions were entered into "in contemplation" of one another. If two transactions are combined and considered a single arrangement, the EITF reached a consensus that an exchange of inventory should be accounted for at fair value. Although electric power is not capable of being held in inventory, there is no substantive conceptual distinction between exchanges involving power and other storable inventory. Therefore, the Company will adopt this EITF effective for new arrangements entered into, or modifications or renewals of existing arrangements, in interim or annual periods beginning after March 15, 2006. SFAS 154 – “Accounting Changes and Error Corrections – a replacement of APB Opinion No. 20 and FASB
Statement No. 3”

39
In May 2005, the FASB issued SFAS 154 to change the requirements for accounting and reporting a change in accounting principle. It applies to all voluntary changes in accounting principle and to changes required by an accounting pronouncement when that pronouncement does not include specific transition provisions. This Statement requires retrospective application to prior periods’ financial statements of changes in accounting principle, unless it is impracticable to determine either the period-specific effects or the cumulative effect of the change. In those instances, this Statement requires that the new accounting principle be applied to the balances of assets and liabilities as of the beginning of the earliest period for which retrospective application is practicable and that a corresponding adjustment be made to the opening balance of retained earnings (or other appropriate components of equity or net assets in the statement of financial position) for that period rather than being reported in the Consolidated Statements of Income. This Statement also requires that a change in depreciation, amortization, or depletion method for long-lived, nonfinancial assets be accounted for as a change in accounting estimate affected by a change in accounting principle. The provisions of this Statement are effective for accounting changes and corrections of errors made in fiscal years beginning after December 15, 2005. The Company adopted this Statement effective January 1, 2006. SFAS 153, “Exchanges of Nonmonetary Assets – an amendment of APB Opinion No. 29” In December 2004, the FASB issued SFAS 153 amending APB 29, which was based on the principle that nonmonetary assets should be measured based on the fair value of the assets exchanged. The guidance in APB 29 included certain exceptions to that principle. SFAS 153 eliminates the exception from fair value measurement for nonmonetary exchanges of similar productive assets and replaces it with an exception for exchanges that do not have commercial substance. This Statement specifies that a nonmonetary exchange has commercial substance if the future cash flows of the entity are expected to change significantly as a result of the exchange. The provisions of this Statement are effective January 1, 2006 for the Company. This FSP is not expected to have a material impact on the Company’s financial statements.
SFAS 151, “Inventory Costs – an amendment of ARB No. 43, Chapter 4” In November 2004, the FASB issued SFAS 151 to clarify the accounting for abnormal amounts of idle facility expense, freight, handling costs and wasted material (spoilage). Previous guidance stated that in some circumstances these costs may be “so abnormal” that they would require treatment as current period costs. SFAS 151 requires abnormal amounts for these items to always be recorded as current period costs. In addition, this Statement requires that allocation of fixed production overheads to the cost of conversion be based on the normal capacity of the production facilities. The provisions of this statement are effective for inventory costs incurred by the Company beginning January 1, 2006. The Company does not expect this statement to have a material impact on its financial statements.

40
13. SUMMARY OF QUARTERLY FINANCIAL DATA (UNAUDITED): Three Months Ended March 31, 2005(a) June 30, 2005(a) September 30, 2005(a) December 31, 2005 As Previously As As Previously As As Previously As As Reported Restated Reported Restated Reported Restated Reported (In millions) Operating Revenues $ 529.1 $ 529.1 $ 595.3 $ 595.3 $ 900.3 $ 900.3 $ 577.6 Operating Expenses and
Taxes 494.7 495.2 521.2 521.6 809.2 809.8 519.9 Operating Income 34.4 33.9 74.1 73.7 91.1 90.5 57.7 Other Income - - 0.3 0.3 3.0 3.0 3.6 Net Interest Charges 19.9 20.5 19.1 19.7 18.9 19.5 20.1 Net Income (Loss) $ 14.5 $ 13.4 $ 55.3 $ 54.3 $ 75.2 $ 74.0 $ 41.2 Earnings (Loss) Applicable
to Common Stock $ 14.4 $ 13.3 $ 55.2 $ 54.2 $ 75.0 $ 73.7 $ 41.2
Three Months Ended March 31, 2004(a) June 30, 2004(a) September 30, 2004(a) December 31, 2004(a) As Previously As As Previously As As Previously As As Previously As Reported Restated Reported Restated Reported Restated Reported Restated (In millions) Operating Revenues $ 498.1 $ 498.1 $ 549.7 $ 549.7 $ 706.7 $ 706.7 $ 452.6 $ 452.6 Operating Expenses and
Taxes 466.2 466.7 494.7 495.2 634.5 635.2 427.7 428.2 Operating Income 31.9 31.4 55.0 54.5 72.2 71.5 24.9 24.4 Other Income 1.5 1.5 1.1 1.1 2.0 2.0 3.2 3.2 Net Interest Charges 20.1 20.6 19.2 19.7 21.8 22.3 19.0 19.4 Net Income (Loss) $ 13.3 $ 12.3 $ 36.9 $ 35.9 $ 52.4 $ 51.2 $ 9.1 $ 8.2 Earnings (Loss) Applicable
to Common Stock $ 13.3 $ 12.2 $ 36.7 $ 35.8 $ 52.2 $ 51.1 $ 8.9 $ 8.0
(a) See Note 2(I) to the Consolidated Financial Statements.