Embed Size (px)
Citation preview
Statistics Unit
States of Jersey Statistics Unit
Jersey Economic Trends 2013
0
Foreword This publication brings together a wide range of statistics relating to the Island’s economy which have been published by the States of Jersey Statistics Unit during 2013. This edition presents annual data up to 2012 and quarterly series up to the third quarter of 2013. Section 1 looks at economic indicators and particularly focuses on Gross Value Added (GVA) which measures the size and performance of the Island’s economy as a whole and also at sectoral level. Since the Finance sector accounts for two-fifths of all economic activity in Jersey, this sector is considered separately in further detail. Also in this section, the value and volume of retail sales are presented, providing a complementary perspective of economic activity in Jersey. Section 2 provides information on employment and unemployment in Jersey. Again, the Finance sector is analysed in detail as this sector accounts for around a quarter of Jersey’s workforce. Section 3 covers prices and earnings; trends in the Retail Prices Index, House Price Index and the Index of Average Earnings are reported. Whilst this publication provides a summary of the data produced by the Statistics Unit in 2013 more information on each of the topics covered can be found in individual, detailed reports. These publications can be viewed and downloaded from the Statistics Unit website www.gov.je/statistics.
Front cover photo: Gareth Wheatley
2
Contents Page
Foreword 2 Section 1: Economic Indicators 4
GVA and GNI 4
GVA analysis by sector 5
GVA per capita 8 GVA per FTE employee 8 Finance sector profits 10 Retail sales 14
Section 2: Employment 17
Overview 17
Employment by sector 19
Unemployment 21 Section 3: Prices and earnings 24 Retail Prices Index (RPI) 24
Other inflation measures 25
Average earnings 27
House Prices 30 Earnings and prices 33
Appendix:
Table A1a: Gross Value Added by sector in current year values 36
Table A1b: Gross Value Added by sector in real terms 36
Table A2a: GVA per full-time equivalent employee in real terms 37 Table A2b: GVA per FTE employee in real terms; index (2000 = 100) 37 Table A3a: Employment by sector – full-time equivalents 38
Table A3b: Private sector employment by sector – headcount 38
Table A4: RPI group level indices and RPI(X) 39
Table A5: Average earnings by sector 40
Table A6: Schedule of Statistics Unit publications for 2014 41
3
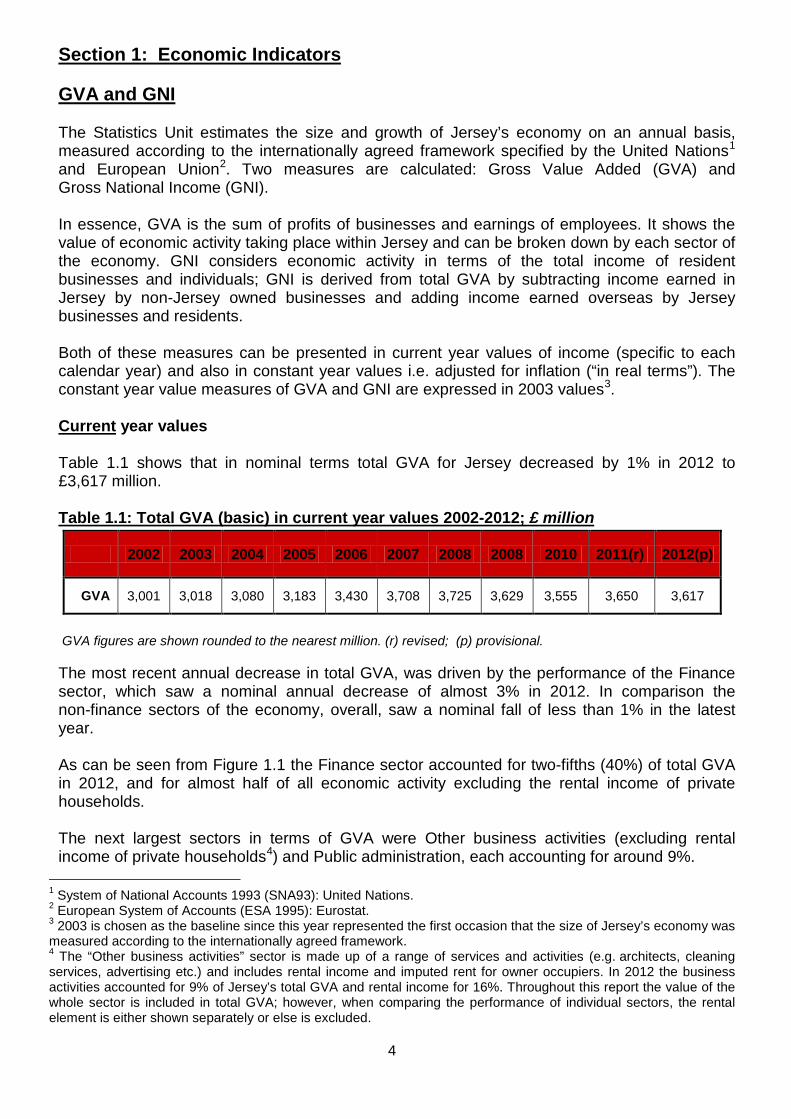
Section 1: Economic Indicators GVA and GNI The Statistics Unit estimates the size and growth of Jersey’s economy on an annual basis, measured according to the internationally agreed framework specified by the United Nations1 and European Union2. Two measures are calculated: Gross Value Added (GVA) and Gross National Income (GNI). In essence, GVA is the sum of profits of businesses and earnings of employees. It shows the value of economic activity taking place within Jersey and can be broken down by each sector of the economy. GNI considers economic activity in terms of the total income of resident businesses and individuals; GNI is derived from total GVA by subtracting income earned in Jersey by non-Jersey owned businesses and adding income earned overseas by Jersey businesses and residents. Both of these measures can be presented in current year values of income (specific to each calendar year) and also in constant year values i.e. adjusted for inflation (“in real terms”). The constant year value measures of GVA and GNI are expressed in 2003 values3. Current year values Table 1.1 shows that in nominal terms total GVA for Jersey decreased by 1% in 2012 to £3,617 million. Table 1.1: Total GVA (basic) in current year values 2002-2012; £ million
GVA figures are shown rounded to the nearest million. (r) revised; (p) provisional. The most recent annual decrease in total GVA, was driven by the performance of the Finance sector, which saw a nominal annual decrease of almost 3% in 2012. In comparison the non-finance sectors of the economy, overall, saw a nominal fall of less than 1% in the latest year. As can be seen from Figure 1.1 the Finance sector accounted for two-fifths (40%) of total GVA in 2012, and for almost half of all economic activity excluding the rental income of private households. The next largest sectors in terms of GVA were Other business activities (excluding rental income of private households4) and Public administration, each accounting for around 9%.
1 System of National Accounts 1993 (SNA93): United Nations. 2 European System of Accounts (ESA 1995): Eurostat. 3 2003 is chosen as the baseline since this year represented the first occasion that the size of Jersey’s economy was measured according to the internationally agreed framework. 4 The “Other business activities” sector is made up of a range of services and activities (e.g. architects, cleaning services, advertising etc.) and includes rental income and imputed rent for owner occupiers. In 2012 the business activities accounted for 9% of Jersey’s total GVA and rental income for 16%. Throughout this report the value of the whole sector is included in total GVA; however, when comparing the performance of individual sectors, the rental element is either shown separately or else is excluded.
2002 2003 2004 2005 2006 2007 2008 2008 2010 2011(r) 2012(p)
GVA 3,001 3,018 3,080 3,183 3,430 3,708 3,725 3,629 3,555 3,650 3,617
4
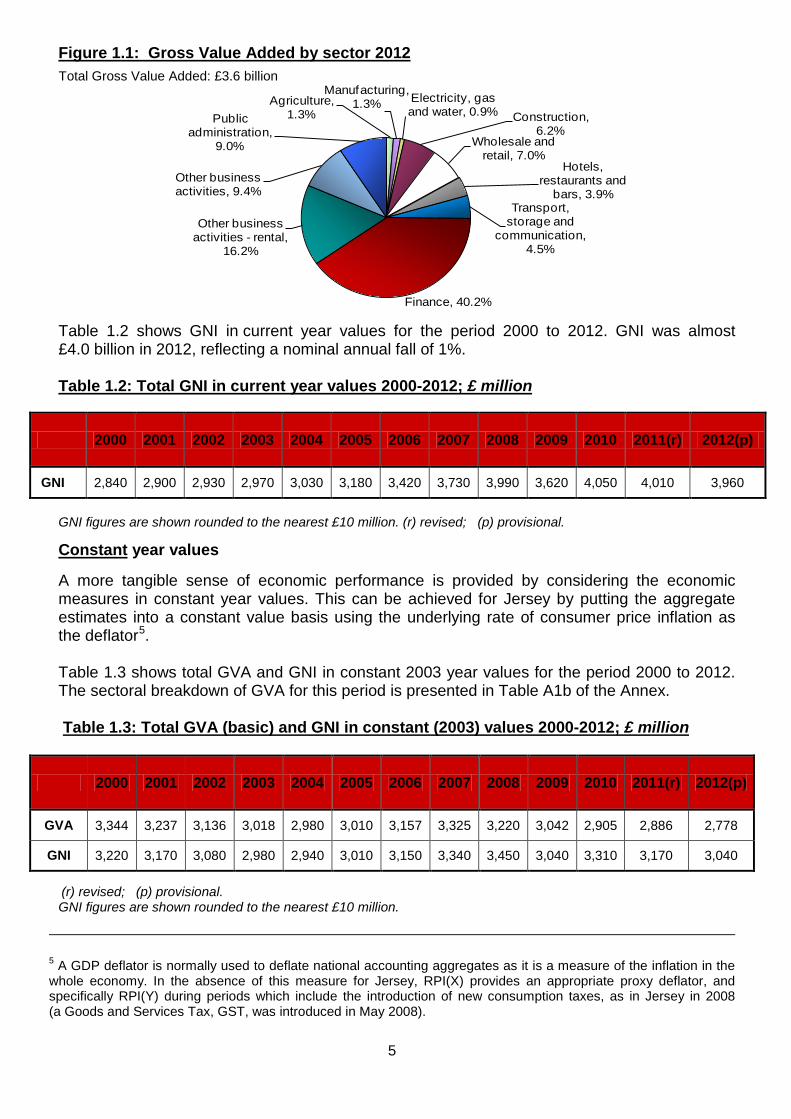
Figure 1.1: Gross Value Added by sector 2012
Agriculture, 1.3%
Manufacturing, 1.3% Electricity, gas
and water, 0.9% Construction, 6.2%
Wholesale and retail, 7.0%
Hotels, restaurants and
bars, 3.9%Transport,
storage and communication,
4.5%
Finance, 40.2%
Other business activities - rental,
16.2%
Other business activities, 9.4%
Public administration,
9.0%
Table 1.2 shows GNI in current year values for the period 2000 to 2012. GNI was almost £4.0 billion in 2012, reflecting a nominal annual fall of 1%. Table 1.2: Total GNI in current year values 2000-2012; £ million
2000 2001 2002 2003 2004 2005 2006 2007 2008 2009 2010 2011(r) 2012(p)
GNI 2,840 2,900 2,930 2,970 3,030 3,180 3,420 3,730 3,990 3,620 4,050 4,010 3,960
GNI figures are shown rounded to the nearest £10 million. (r) revised; (p) provisional.
Constant year values A more tangible sense of economic performance is provided by considering the economic measures in constant year values. This can be achieved for Jersey by putting the aggregate estimates into a constant value basis using the underlying rate of consumer price inflation as the deflator5. Table 1.3 shows total GVA and GNI in constant 2003 year values for the period 2000 to 2012. The sectoral breakdown of GVA for this period is presented in Table A1b of the Annex. Table 1.3: Total GVA (basic) and GNI in constant (2003) values 2000-2012; £ million
2000 2001 2002 2003 2004 2005 2006 2007 2008 2009 2010 2011(r) 2012(p)
GVA 3,344 3,237 3,136 3,018 2,980 3,010 3,157 3,325 3,220 3,042 2,905 2,886 2,778
GNI 3,220 3,170 3,080 2,980 2,940 3,010 3,150 3,340 3,450 3,040 3,310 3,170 3,040
(r) revised; (p) provisional. GNI figures are shown rounded to the nearest £10 million.
5 A GDP deflator is normally used to deflate national accounting aggregates as it is a measure of the inflation in the whole economy. In the absence of this measure for Jersey, RPI(X) provides an appropriate proxy deflator, and specifically RPI(Y) during periods which include the introduction of new consumption taxes, as in Jersey in 2008 (a Goods and Services Tax, GST, was introduced in May 2008).
Total Gross Value Added: £3.6 billion
5
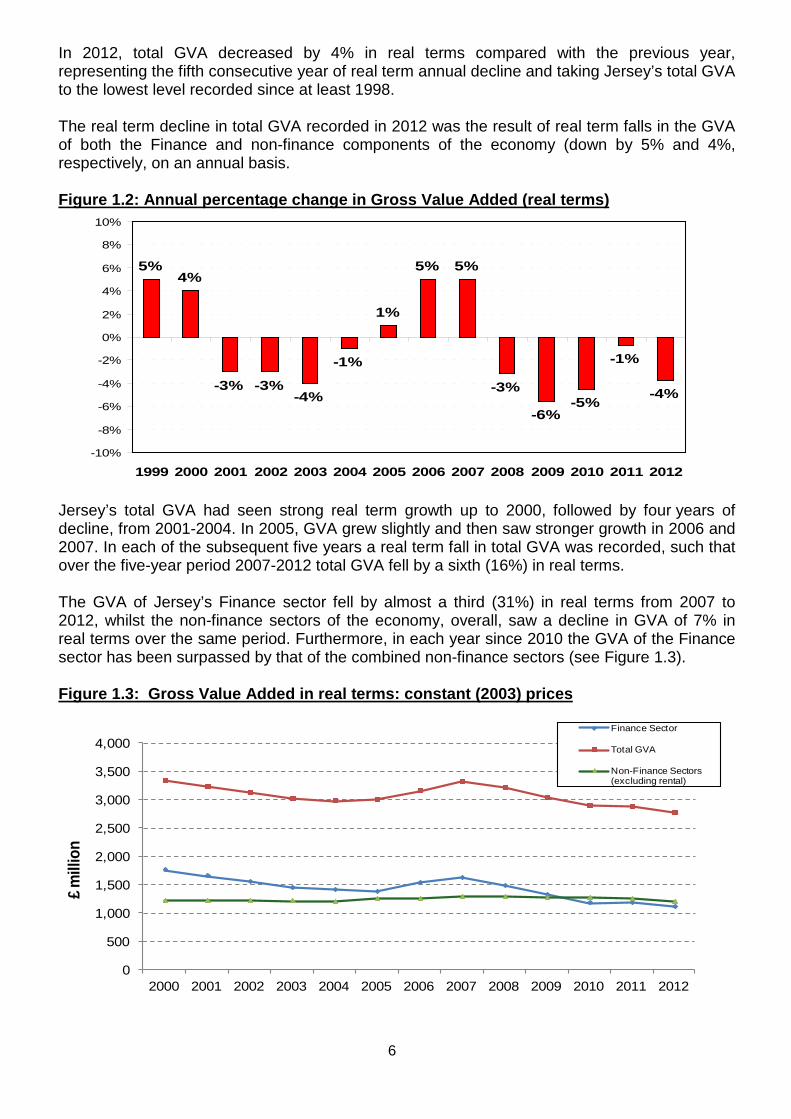
In 2012, total GVA decreased by 4% in real terms compared with the previous year, representing the fifth consecutive year of real term annual decline and taking Jersey’s total GVA to the lowest level recorded since at least 1998. The real term decline in total GVA recorded in 2012 was the result of real term falls in the GVA of both the Finance and non-finance components of the economy (down by 5% and 4%, respectively, on an annual basis.
Figure 1.2: Annual percentage change in Gross Value Added (real terms)
5%4%
-3% -3%-4%
-1%
1%
5% 5%
-3%
-6%-5%
-1%
-4%
-10%
-8%
-6%
-4%
-2%
0%
2%
4%
6%
8%
10%
1999 2000 2001 2002 2003 2004 2005 2006 2007 2008 2009 2010 2011 2012
Jersey’s total GVA had seen strong real term growth up to 2000, followed by four years of decline, from 2001-2004. In 2005, GVA grew slightly and then saw stronger growth in 2006 and 2007. In each of the subsequent five years a real term fall in total GVA was recorded, such that over the five-year period 2007-2012 total GVA fell by a sixth (16%) in real terms. The GVA of Jersey’s Finance sector fell by almost a third (31%) in real terms from 2007 to 2012, whilst the non-finance sectors of the economy, overall, saw a decline in GVA of 7% in real terms over the same period. Furthermore, in each year since 2010 the GVA of the Finance sector has been surpassed by that of the combined non-finance sectors (see Figure 1.3). Figure 1.3: Gross Value Added in real terms: constant (2003) prices
0
500
1,000
1,500
2,000
2,500
3,000
3,500
4,000
2000 2001 2002 2003 2004 2005 2006 2007 2008 2009 2010 2011 2012
£ mill
ion
Finance Sector
Total GVA
Non-Finance Sectors (excluding rental)
6
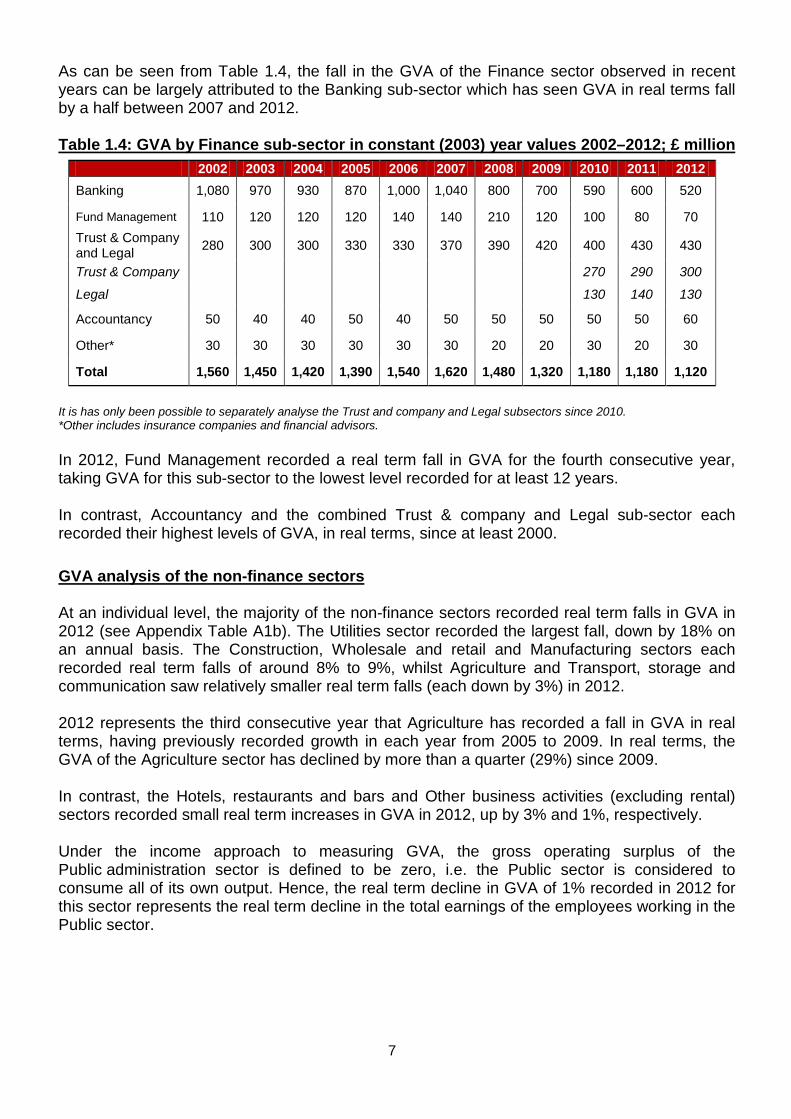
As can be seen from Table 1.4, the fall in the GVA of the Finance sector observed in recent years can be largely attributed to the Banking sub-sector which has seen GVA in real terms fall by a half between 2007 and 2012.
Table 1.4: GVA by Finance sub-sector in constant (2003) year values 2002–2012; £ million
It is has only been possible to separately analyse the Trust and company and Legal subsectors since 2010. *Other includes insurance companies and financial advisors.
In 2012, Fund Management recorded a real term fall in GVA for the fourth consecutive year, taking GVA for this sub-sector to the lowest level recorded for at least 12 years. In contrast, Accountancy and the combined Trust & company and Legal sub-sector each recorded their highest levels of GVA, in real terms, since at least 2000. GVA analysis of the non-finance sectors At an individual level, the majority of the non-finance sectors recorded real term falls in GVA in 2012 (see Appendix Table A1b). The Utilities sector recorded the largest fall, down by 18% on an annual basis. The Construction, Wholesale and retail and Manufacturing sectors each recorded real term falls of around 8% to 9%, whilst Agriculture and Transport, storage and communication saw relatively smaller real term falls (each down by 3%) in 2012. 2012 represents the third consecutive year that Agriculture has recorded a fall in GVA in real terms, having previously recorded growth in each year from 2005 to 2009. In real terms, the GVA of the Agriculture sector has declined by more than a quarter (29%) since 2009. In contrast, the Hotels, restaurants and bars and Other business activities (excluding rental) sectors recorded small real term increases in GVA in 2012, up by 3% and 1%, respectively.
Under the income approach to measuring GVA, the gross operating surplus of the Public administration sector is defined to be zero, i.e. the Public sector is considered to consume all of its own output. Hence, the real term decline in GVA of 1% recorded in 2012 for this sector represents the real term decline in the total earnings of the employees working in the Public sector.
2002 2003 2004 2005 2006 2007 2008 2009 2010 2011 2012 Banking 1,080 970 930 870 1,000 1,040 800 700 590 600 520
Fund Management 110 120 120 120 140 140 210 120 100 80 70 Trust & Company and Legal 280 300 300 330 330 370 390 420 400 430 430
Trust & Company 270 290 300
Legal 130 140 130
Accountancy 50 40 40 50 40 50 50 50 50 50 60
Other* 30 30 30 30 30 30 20 20 30 20 30
Total 1,560 1,450 1,420 1,390 1,540 1,620 1,480 1,320 1,180 1,180 1,120
7
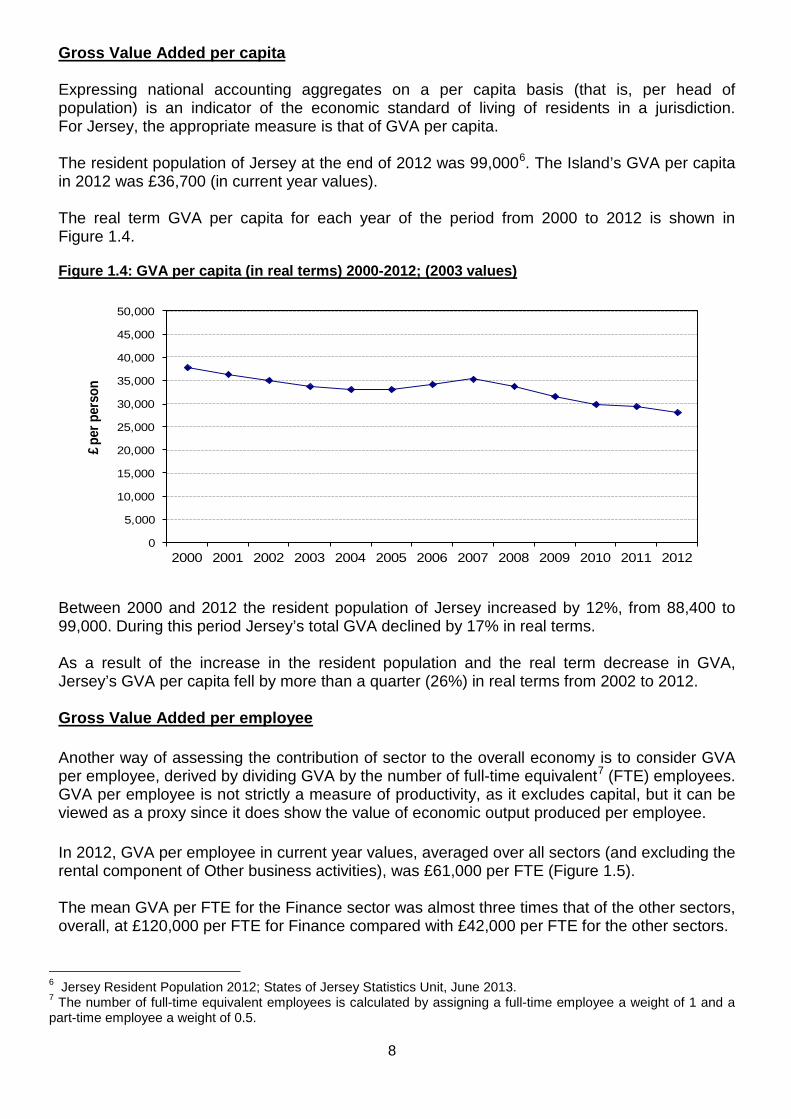
Gross Value Added per capita Expressing national accounting aggregates on a per capita basis (that is, per head of population) is an indicator of the economic standard of living of residents in a jurisdiction. For Jersey, the appropriate measure is that of GVA per capita. The resident population of Jersey at the end of 2012 was 99,0006. The Island’s GVA per capita in 2012 was £36,700 (in current year values). The real term GVA per capita for each year of the period from 2000 to 2012 is shown in Figure 1.4. Figure 1.4: GVA per capita (in real terms) 2000-2012; (2003 values)
0
5,000
10,000
15,000
20,000
25,000
30,000
35,000
40,000
45,000
50,000
2000 2001 2002 2003 2004 2005 2006 2007 2008 2009 2010 2011 2012
£ per
per
son
Between 2000 and 2012 the resident population of Jersey increased by 12%, from 88,400 to 99,000. During this period Jersey’s total GVA declined by 17% in real terms. As a result of the increase in the resident population and the real term decrease in GVA, Jersey’s GVA per capita fell by more than a quarter (26%) in real terms from 2002 to 2012. Gross Value Added per employee Another way of assessing the contribution of sector to the overall economy is to consider GVA per employee, derived by dividing GVA by the number of full-time equivalent7 (FTE) employees. GVA per employee is not strictly a measure of productivity, as it excludes capital, but it can be viewed as a proxy since it does show the value of economic output produced per employee. In 2012, GVA per employee in current year values, averaged over all sectors (and excluding the rental component of Other business activities), was £61,000 per FTE (Figure 1.5). The mean GVA per FTE for the Finance sector was almost three times that of the other sectors, overall, at £120,000 per FTE for Finance compared with £42,000 per FTE for the other sectors.
6 Jersey Resident Population 2012; States of Jersey Statistics Unit, June 2013. 7 The number of full-time equivalent employees is calculated by assigning a full-time employee a weight of 1 and a part-time employee a weight of 0.5.
8

The lowest values of GVA per employee were in the Hotels, restaurants and bars (£28,000 per FTE), Agriculture (£29,000 per FTE) and Wholesale and retail (£34,000 per FTE) sectors. Figure 1.5: GVA per FTE in 2012 (current values)
0
20
40
60
80
100
120
140Ag
ricul
ture
Man
ufac
turin
g
Elec
trici
ty, g
as
and
wat
er
Cons
truct
ion
Who
lesa
le a
nd
reta
il
Hote
ls,
rest
aura
nts
and
bars
Tran
spor
t, st
orag
e an
d co
mm
unic
atio
n
Fina
nce
Oth
er b
usin
ess
activ
ities
Publ
ic
adm
inis
tratio
n
Tota
l GVA
£,00
0 pe
r FTE
GVA per FTE can also be considered in terms of constant values of income. The longer term behaviour of real term GVA per employee for the Finance and non-finance sectors are shown in Figure 1.6; the underlying data is in Appendix Table A2. In real terms, GVA per FTE in Jersey fell by more than a quarter between 2000 and 2012.
Figure 1.6: GVA per FTE in constant (2003) values
0
20
40
60
80
100
120
140
160
180
2000 2001 2002 2003 2004 2005 2006 2007 2008 2009 2010 2011 2012
GVA
per F
TE (£
,000)
Finance Sector
All Sectors
Over the last decade, the Finance sector has seen the greatest change in GVA per FTE, falling by more than two-fifths, from £159,000 in 2000 to £92,000 in 2012 (constant 2003 year values). In contrast, Appendix 2b shows that real term growth in GVA per FTE has been recorded by Manufacturing and Public administration (up 3% and 4% respectively) over the 12-year period.
9
Finance sector
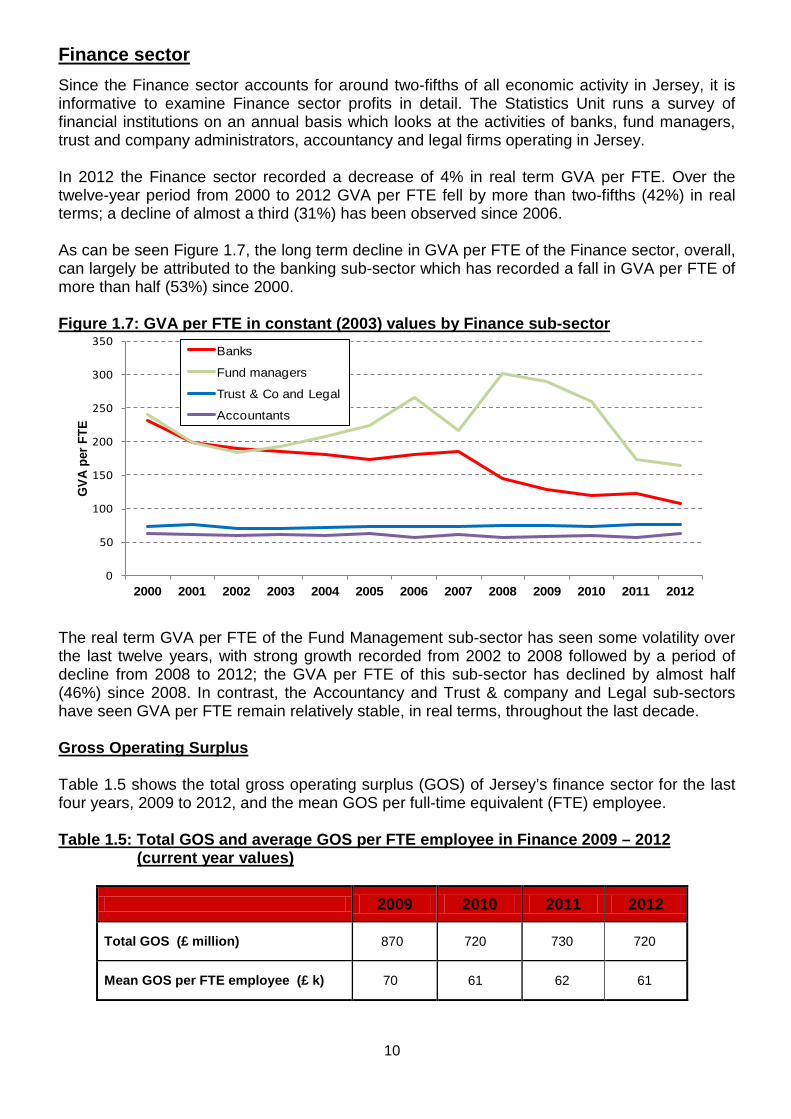
Since the Finance sector accounts for around two-fifths of all economic activity in Jersey, it is informative to examine Finance sector profits in detail. The Statistics Unit runs a survey of financial institutions on an annual basis which looks at the activities of banks, fund managers, trust and company administrators, accountancy and legal firms operating in Jersey. In 2012 the Finance sector recorded a decrease of 4% in real term GVA per FTE. Over the twelve-year period from 2000 to 2012 GVA per FTE fell by more than two-fifths (42%) in real terms; a decline of almost a third (31%) has been observed since 2006. As can be seen Figure 1.7, the long term decline in GVA per FTE of the Finance sector, overall, can largely be attributed to the banking sub-sector which has recorded a fall in GVA per FTE of more than half (53%) since 2000. Figure 1.7: GVA per FTE in constant (2003) values by Finance sub-sector
0
50
100
150
200
250
300
350
2000 2001 2002 2003 2004 2005 2006 2007 2008 2009 2010 2011 2012
GVA
per
FTE
Banks
Fund managers
Trust & Co and Legal
Accountants
The real term GVA per FTE of the Fund Management sub-sector has seen some volatility over the last twelve years, with strong growth recorded from 2002 to 2008 followed by a period of decline from 2008 to 2012; the GVA per FTE of this sub-sector has declined by almost half (46%) since 2008. In contrast, the Accountancy and Trust & company and Legal sub-sectors have seen GVA per FTE remain relatively stable, in real terms, throughout the last decade. Gross Operating Surplus Table 1.5 shows the total gross operating surplus (GOS) of Jersey’s finance sector for the last four years, 2009 to 2012, and the mean GOS per full-time equivalent (FTE) employee. Table 1.5: Total GOS and average GOS per FTE employee in Finance 2009 – 2012 (current year values)
2009 2010 2011 2012
Total GOS (£ million) 870 720 730 720
Mean GOS per FTE employee (£ k) 70 61 62 61
10
Having declined by more than a sixth on an annual basis in 2010, the total GOS of Jersey’s finance sector has been essentially flat, in nominal terms, during the latest three years (2010 to 2012). Total GOS in 2012 (£720 million) was nominally 1% lower than in 2011.
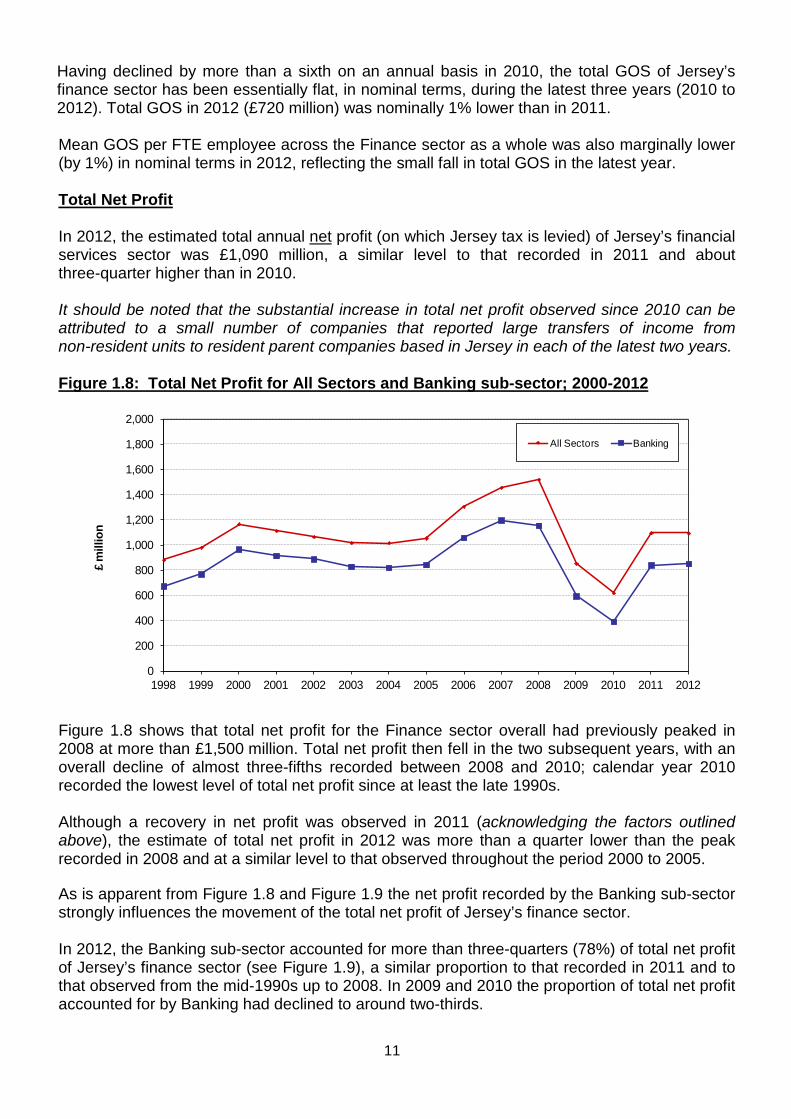
Mean GOS per FTE employee across the Finance sector as a whole was also marginally lower (by 1%) in nominal terms in 2012, reflecting the small fall in total GOS in the latest year. Total Net Profit In 2012, the estimated total annual net profit (on which Jersey tax is levied) of Jersey’s financial services sector was £1,090 million, a similar level to that recorded in 2011 and about three-quarter higher than in 2010. It should be noted that the substantial increase in total net profit observed since 2010 can be attributed to a small number of companies that reported large transfers of income from non-resident units to resident parent companies based in Jersey in each of the latest two years. Figure 1.8: Total Net Profit for All Sectors and Banking sub-sector; 2000-2012
0
200
400
600
800
1,000
1,200
1,400
1,600
1,800
2,000
1998 1999 2000 2001 2002 2003 2004 2005 2006 2007 2008 2009 2010 2011 2012
£ m
illio
n
All Sectors Banking
Figure 1.8 shows that total net profit for the Finance sector overall had previously peaked in 2008 at more than £1,500 million. Total net profit then fell in the two subsequent years, with an overall decline of almost three-fifths recorded between 2008 and 2010; calendar year 2010 recorded the lowest level of total net profit since at least the late 1990s.
Although a recovery in net profit was observed in 2011 (acknowledging the factors outlined above), the estimate of total net profit in 2012 was more than a quarter lower than the peak recorded in 2008 and at a similar level to that observed throughout the period 2000 to 2005. As is apparent from Figure 1.8 and Figure 1.9 the net profit recorded by the Banking sub-sector strongly influences the movement of the total net profit of Jersey’s finance sector. In 2012, the Banking sub-sector accounted for more than three-quarters (78%) of total net profit of Jersey’s finance sector (see Figure 1.9), a similar proportion to that recorded in 2011 and to that observed from the mid-1990s up to 2008. In 2009 and 2010 the proportion of total net profit accounted for by Banking had declined to around two-thirds.
11
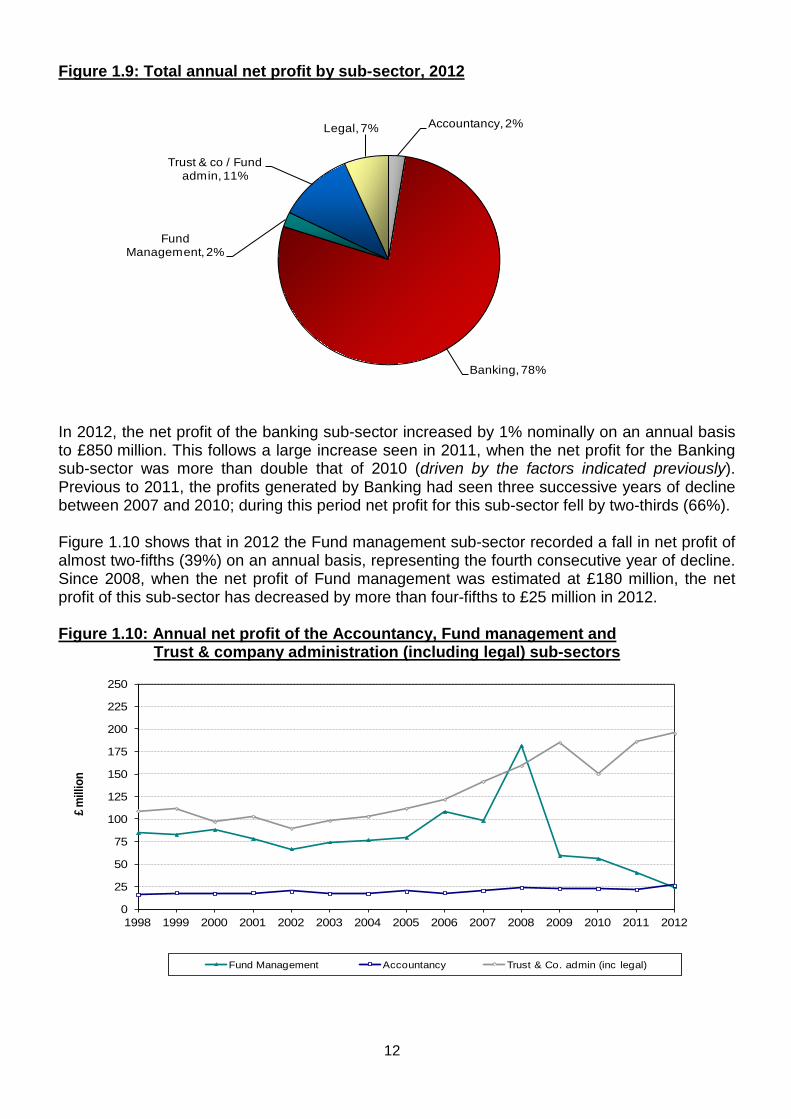
Figure 1.9: Total annual net profit by sub-sector, 2012
Accountancy, 2%
Banking, 78%
Fund Management, 2%
Trust & co / Fund admin, 11%
Legal, 7%
In 2012, the net profit of the banking sub-sector increased by 1% nominally on an annual basis to £850 million. This follows a large increase seen in 2011, when the net profit for the Banking sub-sector was more than double that of 2010 (driven by the factors indicated previously). Previous to 2011, the profits generated by Banking had seen three successive years of decline between 2007 and 2010; during this period net profit for this sub-sector fell by two-thirds (66%). Figure 1.10 shows that in 2012 the Fund management sub-sector recorded a fall in net profit of almost two-fifths (39%) on an annual basis, representing the fourth consecutive year of decline. Since 2008, when the net profit of Fund management was estimated at £180 million, the net profit of this sub-sector has decreased by more than four-fifths to £25 million in 2012. Figure 1.10: Annual net profit of the Accountancy, Fund management and
Trust & company administration (including legal) sub-sectors
0
25
50
75
100
125
150
175
200
225
250
1998 1999 2000 2001 2002 2003 2004 2005 2006 2007 2008 2009 2010 2011 2012
£ mill
ion
Fund Management Accountancy Trust & Co. admin (inc legal)
12
In 2012 the net profit of the Trust & company administration sub-sector increased by 6% on an annual basis, to £120 million; this latest annual growth follows an increase of more than a quarter in 2011. In contrast, the Legal sub-sector saw a decline in net profit of 9% in 2012; this latest annual decline follows increases in net profits recorded in both 2010 and 2011. Since 2009, when it was first possible to analyse this sub-sector separately, the net profit of the Legal sub-sector has increased by a third (33%).
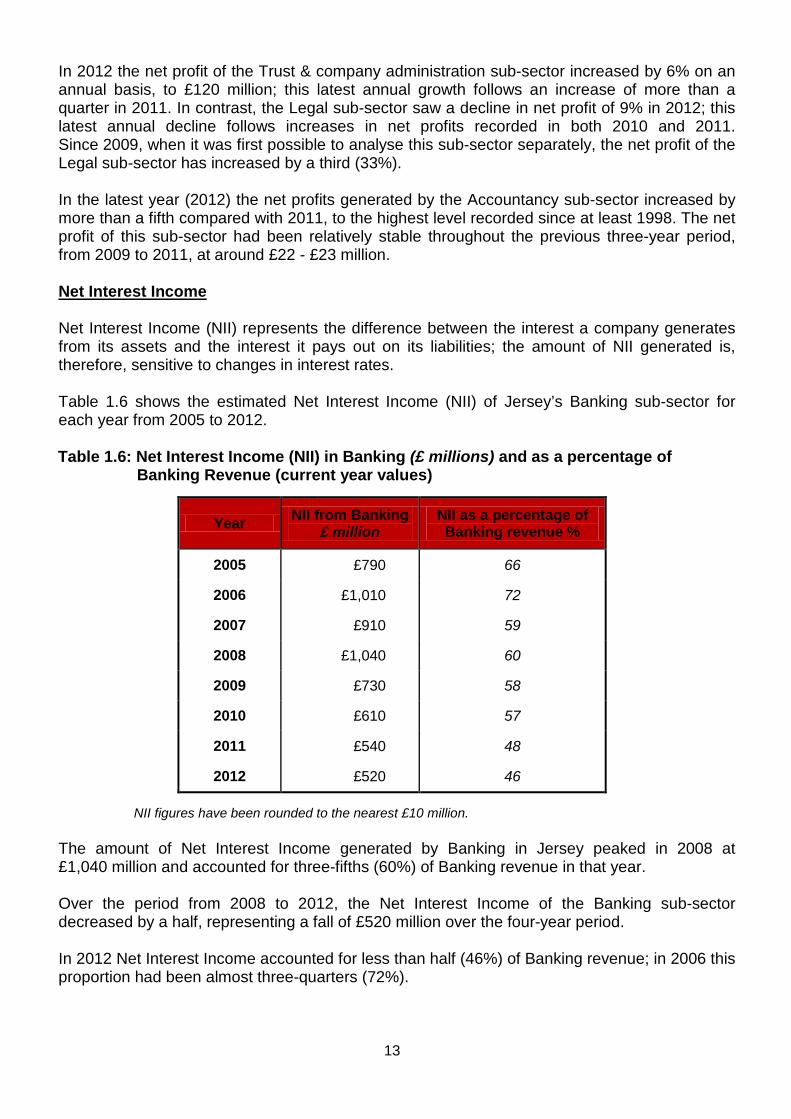
In the latest year (2012) the net profits generated by the Accountancy sub-sector increased by more than a fifth compared with 2011, to the highest level recorded since at least 1998. The net profit of this sub-sector had been relatively stable throughout the previous three-year period, from 2009 to 2011, at around £22 - £23 million. Net Interest Income Net Interest Income (NII) represents the difference between the interest a company generates from its assets and the interest it pays out on its liabilities; the amount of NII generated is, therefore, sensitive to changes in interest rates. Table 1.6 shows the estimated Net Interest Income (NII) of Jersey’s Banking sub-sector for each year from 2005 to 2012.
Table 1.6: Net Interest Income (NII) in Banking (£ millions) and as a percentage of
Banking Revenue (current year values)
Year NII from Banking £ million
NII as a percentage of Banking revenue %
2005 £790 66
2006 £1,010 72
2007 £910 59
2008 £1,040 60
2009 £730 58
2010 £610 57
2011 £540 48
2012 £520 46 NII figures have been rounded to the nearest £10 million.
The amount of Net Interest Income generated by Banking in Jersey peaked in 2008 at £1,040 million and accounted for three-fifths (60%) of Banking revenue in that year.
Over the period from 2008 to 2012, the Net Interest Income of the Banking sub-sector decreased by a half, representing a fall of £520 million over the four-year period.
In 2012 Net Interest Income accounted for less than half (46%) of Banking revenue; in 2006 this proportion had been almost three-quarters (72%).
13
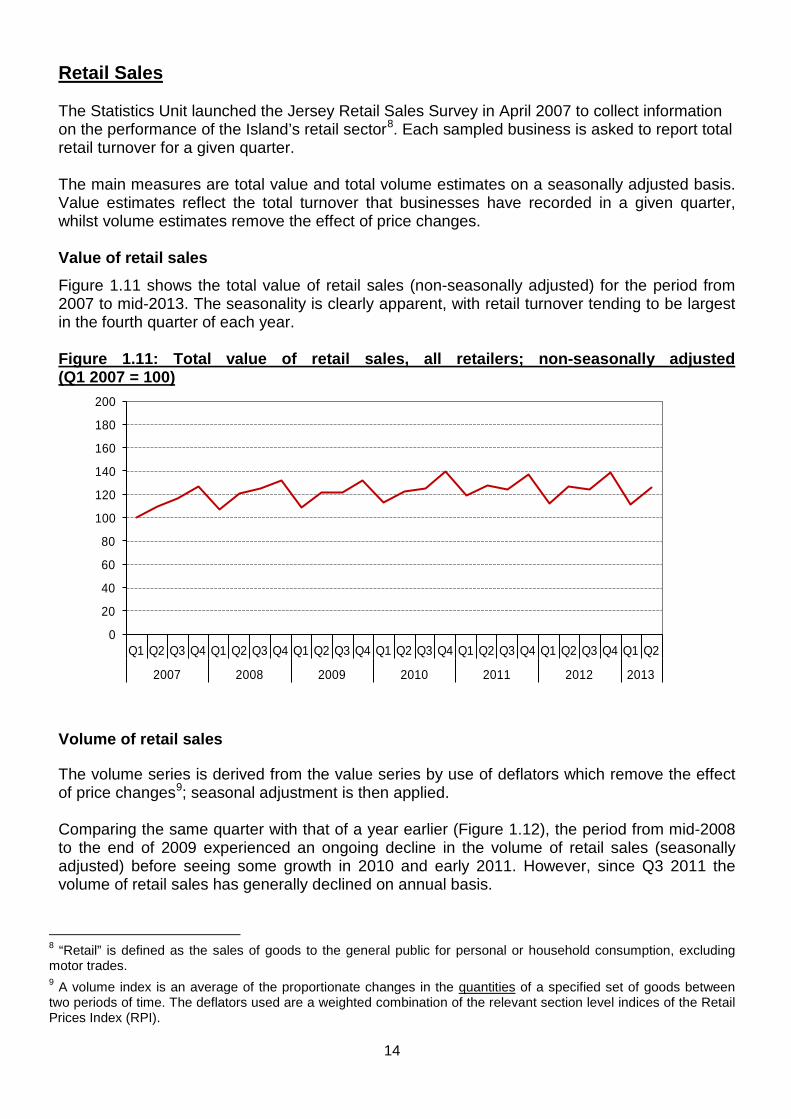
Retail Sales The Statistics Unit launched the Jersey Retail Sales Survey in April 2007 to collect information on the performance of the Island’s retail sector8. Each sampled business is asked to report total retail turnover for a given quarter. The main measures are total value and total volume estimates on a seasonally adjusted basis. Value estimates reflect the total turnover that businesses have recorded in a given quarter, whilst volume estimates remove the effect of price changes.
Value of retail sales
Figure 1.11 shows the total value of retail sales (non-seasonally adjusted) for the period from 2007 to mid-2013. The seasonality is clearly apparent, with retail turnover tending to be largest in the fourth quarter of each year.
Figure 1.11: Total value of retail sales, all retailers; non-seasonally adjusted (Q1 2007 = 100)
0
20
40
60
80
100
120
140
160
180
200
Q1 Q2 Q3 Q4 Q1 Q2 Q3 Q4 Q1 Q2 Q3 Q4 Q1 Q2 Q3 Q4 Q1 Q2 Q3 Q4 Q1 Q2 Q3 Q4 Q1 Q2
2007 2008 2009 2010 2011 2012 2013
Volume of retail sales The volume series is derived from the value series by use of deflators which remove the effect of price changes9; seasonal adjustment is then applied. Comparing the same quarter with that of a year earlier (Figure 1.12), the period from mid-2008 to the end of 2009 experienced an ongoing decline in the volume of retail sales (seasonally adjusted) before seeing some growth in 2010 and early 2011. However, since Q3 2011 the volume of retail sales has generally declined on annual basis.
8 “Retail” is defined as the sales of goods to the general public for personal or household consumption, excluding motor trades. 9 A volume index is an average of the proportionate changes in the quantities of a specified set of goods between two periods of time. The deflators used are a weighted combination of the relevant section level indices of the Retail Prices Index (RPI).
14
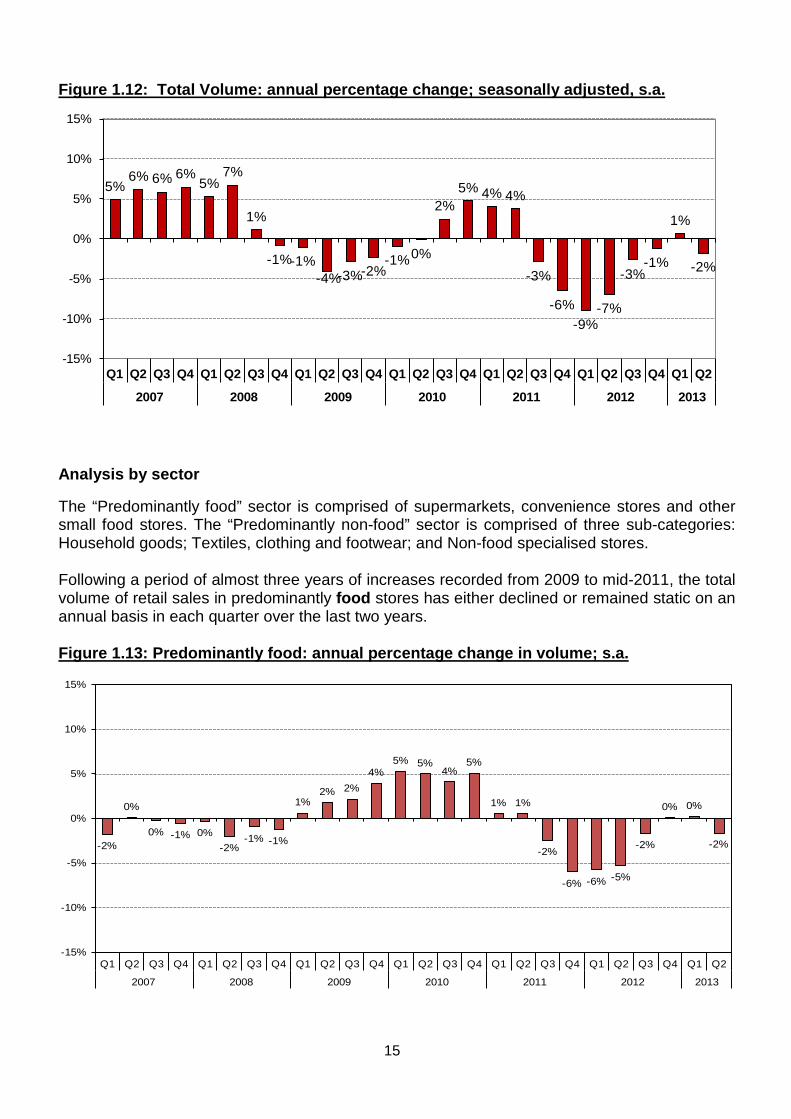
Figure 1.12: Total Volume: annual percentage change; seasonally adjusted, s.a.
5%6% 6% 6%
5%7%
1%
-1%-1%-4%-3%-2%
-1%0%
2%5% 4% 4%
-3%
-6%-9%
-7%
-3%-1%
1%
-2%
-15%
-10%
-5%
0%
5%
10%
15%
Q1 Q2 Q3 Q4 Q1 Q2 Q3 Q4 Q1 Q2 Q3 Q4 Q1 Q2 Q3 Q4 Q1 Q2 Q3 Q4 Q1 Q2 Q3 Q4 Q1 Q2
2007 2008 2009 2010 2011 2012 2013 Analysis by sector The “Predominantly food” sector is comprised of supermarkets, convenience stores and other small food stores. The “Predominantly non-food” sector is comprised of three sub-categories: Household goods; Textiles, clothing and footwear; and Non-food specialised stores. Following a period of almost three years of increases recorded from 2009 to mid-2011, the total volume of retail sales in predominantly food stores has either declined or remained static on an annual basis in each quarter over the last two years.
Figure 1.13: Predominantly food: annual percentage change in volume; s.a.
-2%
0%
0% -1% 0%-2%
-1% -1%
1%2% 2%
4%5% 5%
4%5%
1% 1%
-2%
-6% -6% -5%
-2%
0% 0%
-2%
-15%
-10%
-5%
0%
5%
10%
15%
Q1 Q2 Q3 Q4 Q1 Q2 Q3 Q4 Q1 Q2 Q3 Q4 Q1 Q2 Q3 Q4 Q1 Q2 Q3 Q4 Q1 Q2 Q3 Q4 Q1 Q2
2007 2008 2009 2010 2011 2012 2013
15
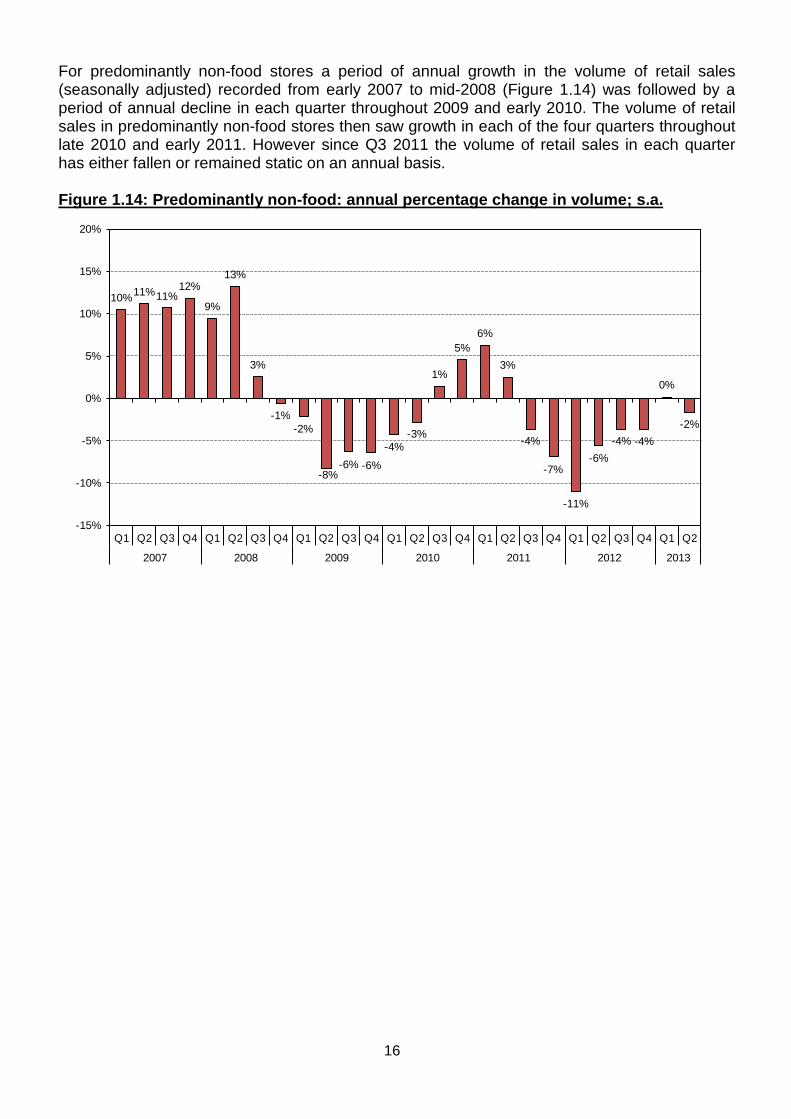
For predominantly non-food stores a period of annual growth in the volume of retail sales (seasonally adjusted) recorded from early 2007 to mid-2008 (Figure 1.14) was followed by a period of annual decline in each quarter throughout 2009 and early 2010. The volume of retail sales in predominantly non-food stores then saw growth in each of the four quarters throughout late 2010 and early 2011. However since Q3 2011 the volume of retail sales in each quarter has either fallen or remained static on an annual basis. Figure 1.14: Predominantly non-food: annual percentage change in volume; s.a.
10%11%11%12%
9%
13%
3%
-1%-2%
-8%-6% -6%
-4%-3%
1%
5%6%
3%
-4%
-7%
-11%
-6%-4% -4%
0%
-2%
-15%
-10%
-5%
0%
5%
10%
15%
20%
Q1 Q2 Q3 Q4 Q1 Q2 Q3 Q4 Q1 Q2 Q3 Q4 Q1 Q2 Q3 Q4 Q1 Q2 Q3 Q4 Q1 Q2 Q3 Q4 Q1 Q2
2007 2008 2009 2010 2011 2012 2013
16
Section 2: Employment Overview In relative terms, employment levels in Jersey are high. The “economic activity rate” gives the proportion of those people in employment, or actively seeking employment, as a percentage of all those of working age (between 16 and 64 years for men, and 16 and 59 for women, inclusive). As recorded by the 2011 Jersey census, the proportion of the working age population who were economically active was 82% (52,522 persons). Over three-quarters (77%) of working age women were economically active compared with 86% of men. The Jersey Annual Social Survey (JASS) of 2013 estimated the economic activity rate to be 88%, corresponding to 93% of working age men and 82% of working age women. However, due to a greater tendency for working adults to respond to JASS, the economic activity rate measured by this survey is slightly higher than that recorded by the Census. Table 2.1: Economic activity rate (men aged 16 to 64 years and women 16 to 59 years)
JASS 2013 Census 2011 Men 93% 86%
Women 82% 77%
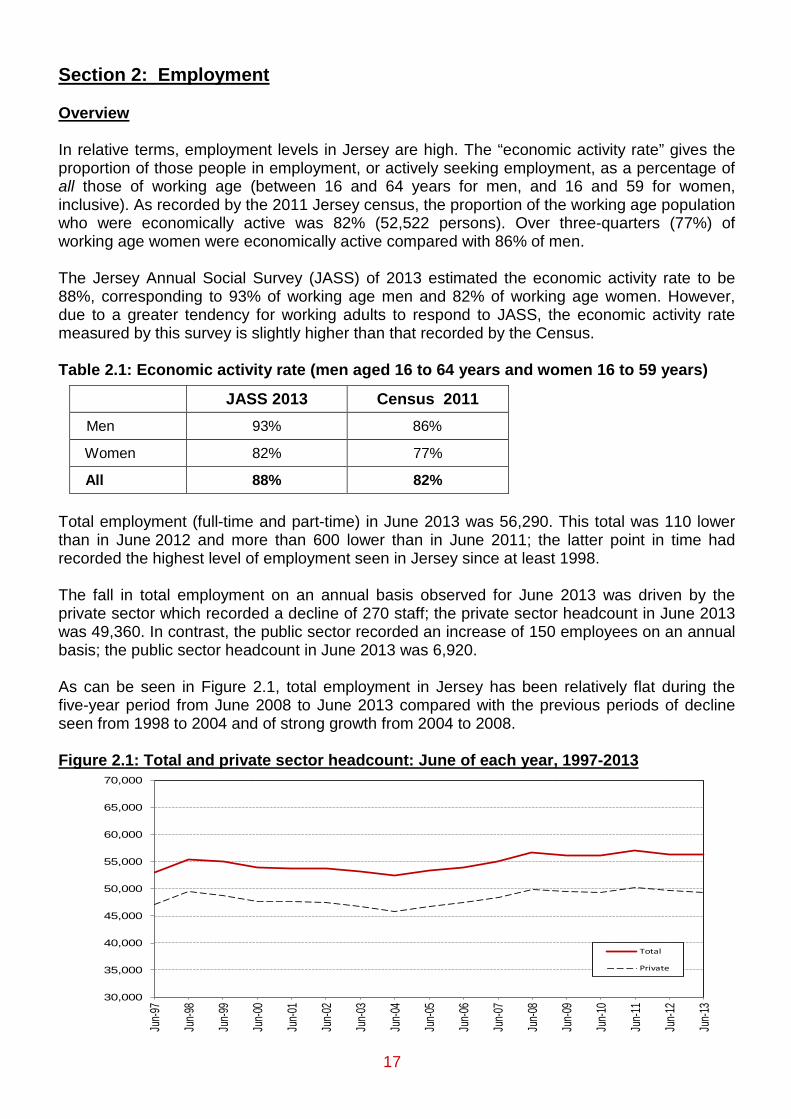
All 88% 82% Total employment (full-time and part-time) in June 2013 was 56,290. This total was 110 lower than in June 2012 and more than 600 lower than in June 2011; the latter point in time had recorded the highest level of employment seen in Jersey since at least 1998. The fall in total employment on an annual basis observed for June 2013 was driven by the private sector which recorded a decline of 270 staff; the private sector headcount in June 2013 was 49,360. In contrast, the public sector recorded an increase of 150 employees on an annual basis; the public sector headcount in June 2013 was 6,920. As can be seen in Figure 2.1, total employment in Jersey has been relatively flat during the five-year period from June 2008 to June 2013 compared with the previous periods of decline seen from 1998 to 2004 and of strong growth from 2004 to 2008. Figure 2.1: Total and private sector headcount: June of each year, 1997-2013
30,000
35,000
40,000
45,000
50,000
55,000
60,000
65,000
70,000
Jun-9
7
Jun-9
8
Jun-9
9
Jun-0
0
Jun-0
1
Jun-0
2
Jun-0
3
Jun-0
4
Jun-0
5
Jun-0
6
Jun-0
7
Jun-0
8
Jun-0
9
Jun-1
0
Jun-1
1
Jun-1
2
Jun-1
3
Total
Private
17
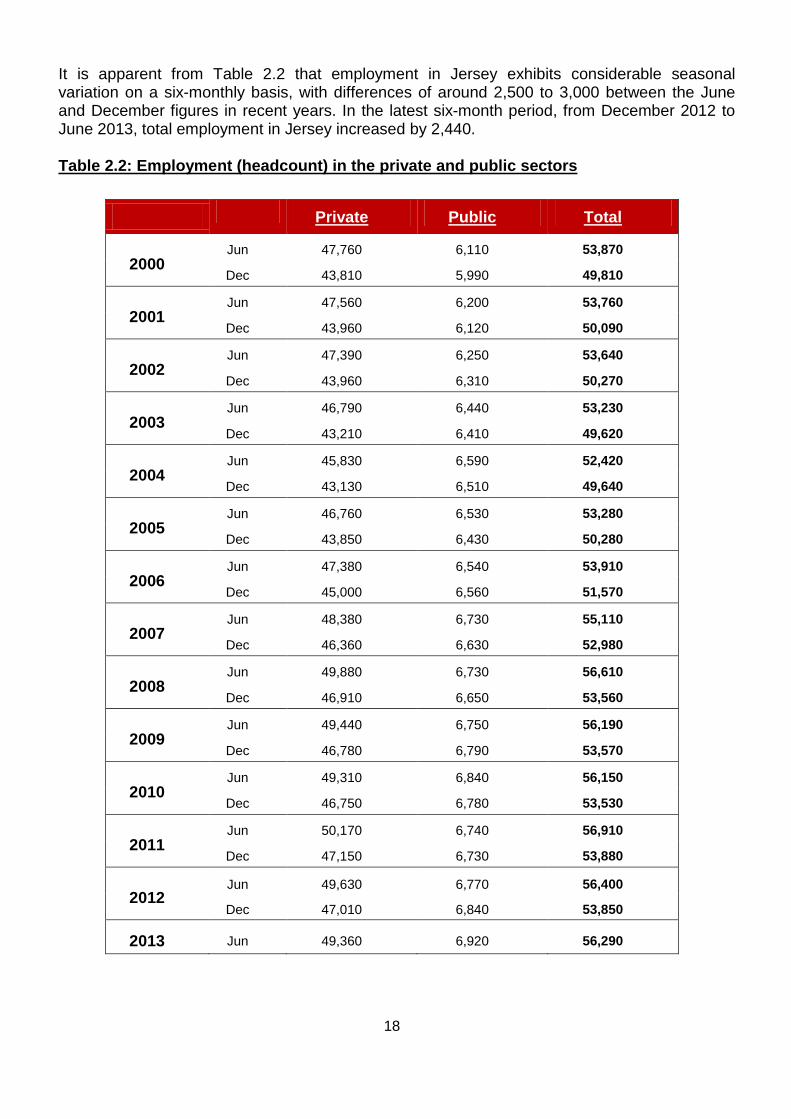
It is apparent from Table 2.2 that employment in Jersey exhibits considerable seasonal variation on a six-monthly basis, with differences of around 2,500 to 3,000 between the June and December figures in recent years. In the latest six-month period, from December 2012 to June 2013, total employment in Jersey increased by 2,440. Table 2.2: Employment (headcount) in the private and public sectors
Private Public Total
2000 Jun 47,760 6,110 53,870
Dec 43,810 5,990 49,810
2001 Jun 47,560 6,200 53,760
Dec 43,960 6,120 50,090
2002 Jun 47,390 6,250 53,640
Dec 43,960 6,310 50,270
2003 Jun 46,790 6,440 53,230
Dec 43,210 6,410 49,620
2004 Jun 45,830 6,590 52,420
Dec 43,130 6,510 49,640
2005 Jun 46,760 6,530 53,280
Dec 43,850 6,430 50,280
2006 Jun 47,380 6,540 53,910
Dec 45,000 6,560 51,570
2007 Jun 48,380 6,730 55,110
Dec 46,360 6,630 52,980
2008 Jun 49,880 6,730 56,610
Dec 46,910 6,650 53,560
2009 Jun 49,440 6,750 56,190
Dec 46,780 6,790 53,570
2010 Jun 49,310 6,840 56,150
Dec 46,750 6,780 53,530
2011 Jun 50,170 6,740 56,910
Dec 47,150 6,730 53,880
2012 Jun 49,630 6,770 56,400
Dec 47,010 6,840 53,850
2013 Jun 49,360 6,920 56,290
18
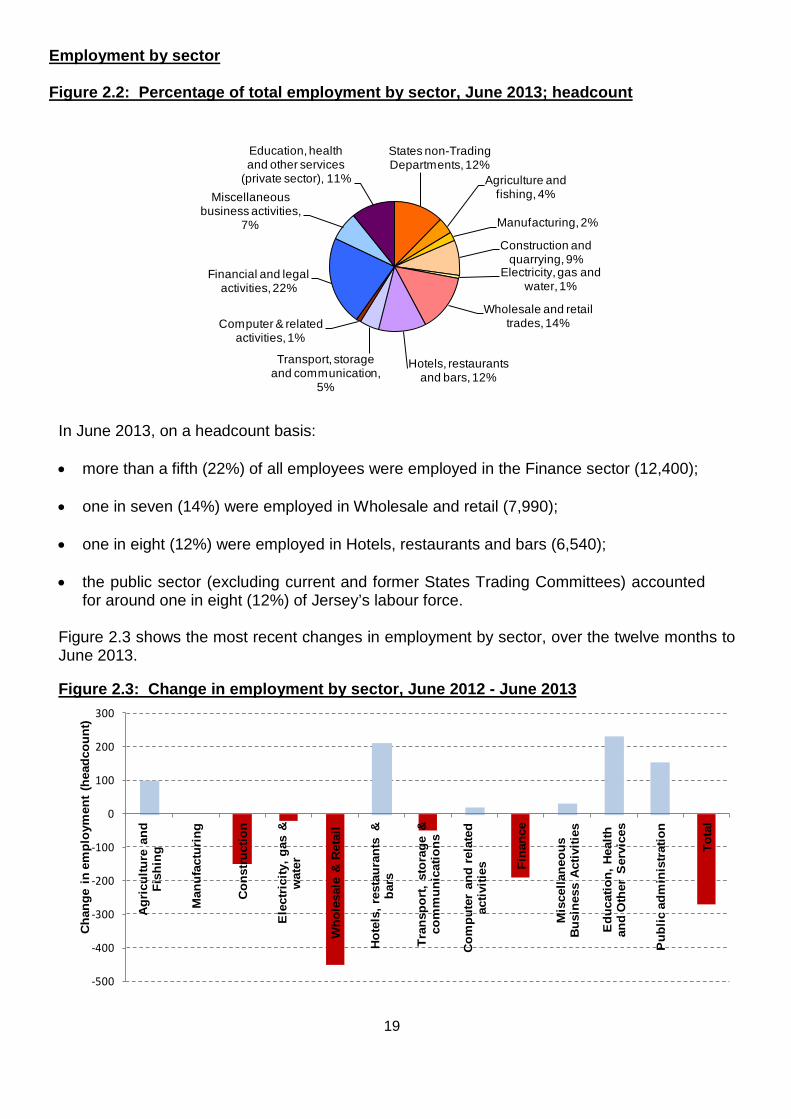
Employment by sector Figure 2.2: Percentage of total employment by sector, June 2013; headcount
States non-Trading Departments, 12%
Agriculture and fishing, 4%
Manufacturing, 2%
Construction and quarrying, 9%
Electricity, gas and water, 1%
Wholesale and retail trades, 14%
Hotels, restaurants and bars, 12%
Transport, storage and communication,
5%
Computer & related activities, 1%
Financial and legal activities, 22%
Miscellaneous business activities,
7%
Education, health and other services
(private sector), 11%
In June 2013, on a headcount basis: • more than a fifth (22%) of all employees were employed in the Finance sector (12,400); • one in seven (14%) were employed in Wholesale and retail (7,990); • one in eight (12%) were employed in Hotels, restaurants and bars (6,540); • the public sector (excluding current and former States Trading Committees) accounted
for around one in eight (12%) of Jersey’s labour force. Figure 2.3 shows the most recent changes in employment by sector, over the twelve months to June 2013. Figure 2.3: Change in employment by sector, June 2012 - June 2013
-500
-400
-300
-200
-100
0
100
200
300
Agr
icul
ture
and
Fi
shin
g
Man
ufac
turi
ng
Con
stru
ctio
n
Ele
ctri
city
, gas
&
wat
er
Who
lesa
le &
Ret
ail
Hot
els,
res
taur
ants
&
bars
Tran
spor
t, st
orag
e &
co
mm
unic
atio
ns
Com
pute
r an
d re
late
d ac
tiviti
es Fina
nce
Mis
cella
neou
s B
usin
ess
Act
iviti
es
Edu
catio
n, H
ealth
an
d O
ther
Ser
vice
s
Pub
lic a
dmin
istr
atio
n
Tota
l
Cha
nge
in e
mpl
oym
ent
(hea
dcou
nt)
19
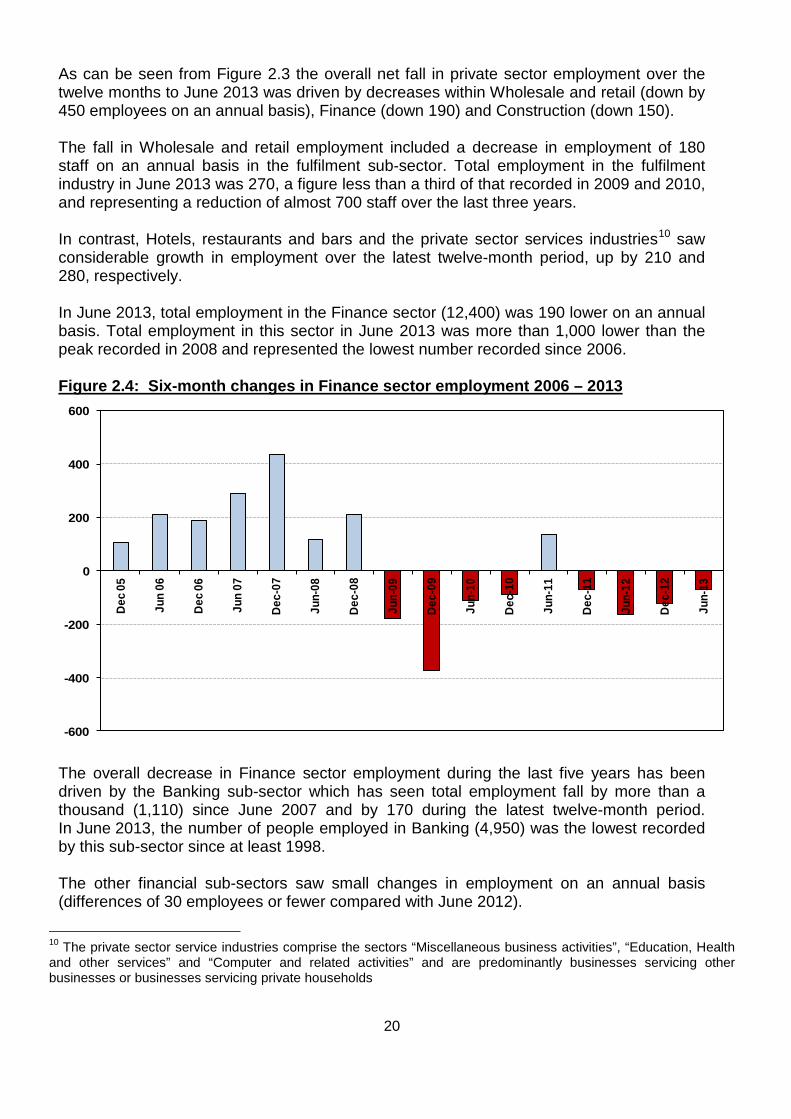
As can be seen from Figure 2.3 the overall net fall in private sector employment over the twelve months to June 2013 was driven by decreases within Wholesale and retail (down by 450 employees on an annual basis), Finance (down 190) and Construction (down 150). The fall in Wholesale and retail employment included a decrease in employment of 180 staff on an annual basis in the fulfilment sub-sector. Total employment in the fulfilment industry in June 2013 was 270, a figure less than a third of that recorded in 2009 and 2010, and representing a reduction of almost 700 staff over the last three years. In contrast, Hotels, restaurants and bars and the private sector services industries10 saw considerable growth in employment over the latest twelve-month period, up by 210 and 280, respectively. In June 2013, total employment in the Finance sector (12,400) was 190 lower on an annual basis. Total employment in this sector in June 2013 was more than 1,000 lower than the peak recorded in 2008 and represented the lowest number recorded since 2006.
Figure 2.4: Six-month changes in Finance sector employment 2006 – 2013
-600
-400
-200
0
200
400
600
Dec 0
5
Jun
06
Dec 0
6
Jun
07
Dec-
07
Jun-
08
Dec-
08
Jun-
09
Dec-
09
Jun-
10
Dec-
10
Jun-
11
Dec-
11
Jun-
12
Dec-
12
Jun-
13
The overall decrease in Finance sector employment during the last five years has been driven by the Banking sub-sector which has seen total employment fall by more than a thousand (1,110) since June 2007 and by 170 during the latest twelve-month period. In June 2013, the number of people employed in Banking (4,950) was the lowest recorded by this sub-sector since at least 1998. The other financial sub-sectors saw small changes in employment on an annual basis (differences of 30 employees or fewer compared with June 2012).
10 The private sector service industries comprise the sectors “Miscellaneous business activities”, “Education, Health and other services” and “Computer and related activities” and are predominantly businesses servicing other businesses or businesses servicing private households
20

Table 2.3: Employment in the Financial services sub-sectors: June 2006 to June 2013
Banking
Trust & Co. Admin.
and Fund Mgt
Legal Accountancy Other11 Total
Jun-06 5,390 2,830 2,300 780 880 12,180
Dec-06 5,810 2,520 2,320 800 920 12,370
Jun-07 5,840 2,670 2,390 830 940 12,660
Dec-07 6,100 2,790 2,500 870 840 13,100
Jun-08 6,060 2,850 2,560 880 870 13,220
Dec-08 6,050 2,880 2,580 980 950 13,430
Jun-09 5,900 2,950 2,490 940 950 13,250
Dec-09 5,600 2,870 2,490 970 960 12,880
Jun-10 5,470 3,32012 2,040 990 950 12,770
Dec-10 5,310 3,350 2,070 960 980 12,680
Jun-11 5,350 3,410 2,110 970 980 12,820
Dec-11 5,250 3,420 2,130 980 980 12,750
Jun-12 5,120 3,400 2,120 990 970 12,590
Dec-12 4,970 3,380 2,170 1,010 950 12,470
Jun-13 4,950 3,370 2,130 1,000 950 12,400
All numbers are independently rounded to the nearest ten Unemployment The internationally comparable unemployment rate for Jersey (as defined by the International Labour Organisation, ILO) is measured through the Census and the Jersey Annual Social Survey (JASS). The ILO unemployment rate for Jersey on the 27 March 2011, as measured by the 2011 census, was 4.7%; this rate corresponded to 2,570 people being unemployed at that point of time. In June 2013, the ILO unemployment rate measured by JASS was estimated to be 5.7%. This rate corresponded to 3,200 people being unemployed and looking for work.
11 Other includes insurance (general, life and non-life), pension funding and investment and unit trusts. 12 The increase apparent in Table 2 for Trust & Co. Admin and Fund management between December 2009 and June 2010 was predominantly due to the reclassification of companies previously in the Legal sub-sector; the latter sub-sector thus recorded a complementary decrease in employment between these two points in time.
21
Data on people registered as actively seeking work (ASW) in Jersey is compiled and administered by the Social Security Department. When interpreting the numbers of people registered as ASW it should be kept in mind that there is no legal requirement for all unemployed residents to register as actively seeking work with the Social Security Department. The number of individuals registered as ASW includes people who are on the Advance to Work, Advance Plus and Workwise schemes. The ASW figures also include individuals who are working fewer than the 35 hours per week as required under the terms of Income Support; such individuals will be both working and actively seeking work simultaneously.
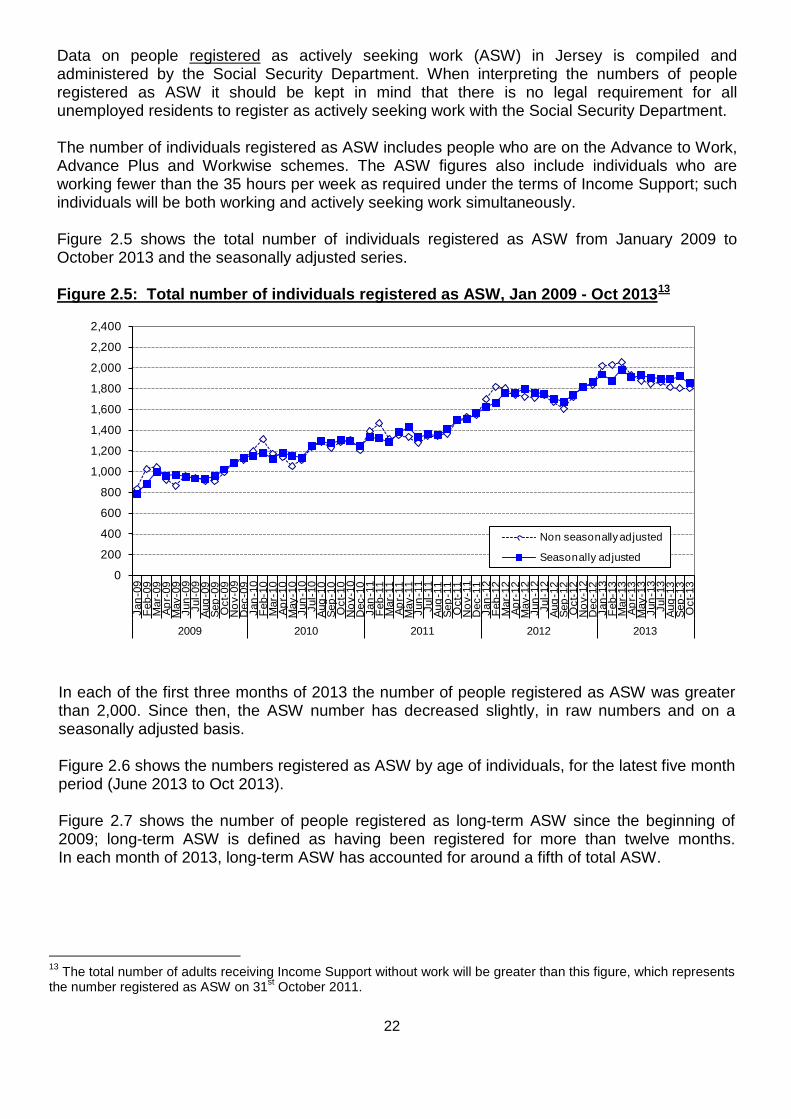
Figure 2.5 shows the total number of individuals registered as ASW from January 2009 to October 2013 and the seasonally adjusted series.
Figure 2.5: Total number of individuals registered as ASW, Jan 2009 - Oct 201313
0
200
400
600
800
1,000
1,200
1,400
1,600
1,800
2,000
2,200
2,400
Jan-
09Fe
b-09
Mar
-09
Apr-
09M
ay-0
9Ju
n-09
Jul-0
9Au
g-09
Sep-
09O
ct-0
9N
ov-0
9D
ec-0
9Ja
n-10
Feb-
10M
ar-1
0Ap
r-10
May
-10
Jun-
10Ju
l-10
Aug-
10Se
p-10
Oct
-10
Nov
-10
Dec
-10
Jan-
11Fe
b-11
Mar
-11
Apr-
11M
ay-1
1Ju
n-11
Jul-1
1Au
g-11
Sep-
11O
ct-1
1N
ov-1
1D
ec-1
1Ja
n-12
Feb-
12M
ar-1
2Ap
r-12
May
-12
Jun-
12Ju
l-12
Aug-
12Se
p-12
Oct
-12
Nov
-12
Dec
-12
Jan-
13Fe
b-13
Mar
-13
Apr-
13M
ay-1
3Ju
n-13
Jul-1
3Au
g-13
Sep-
13O
ct-1
3
2009 2010 2011 2012 2013
Non seasonally adjusted
Seasonally adjusted
In each of the first three months of 2013 the number of people registered as ASW was greater than 2,000. Since then, the ASW number has decreased slightly, in raw numbers and on a seasonally adjusted basis. Figure 2.6 shows the numbers registered as ASW by age of individuals, for the latest five month period (June 2013 to Oct 2013). Figure 2.7 shows the number of people registered as long-term ASW since the beginning of 2009; long-term ASW is defined as having been registered for more than twelve months. In each month of 2013, long-term ASW has accounted for around a fifth of total ASW.
13 The total number of adults receiving Income Support without work will be greater than this figure, which represents the number registered as ASW on 31st October 2011.
22
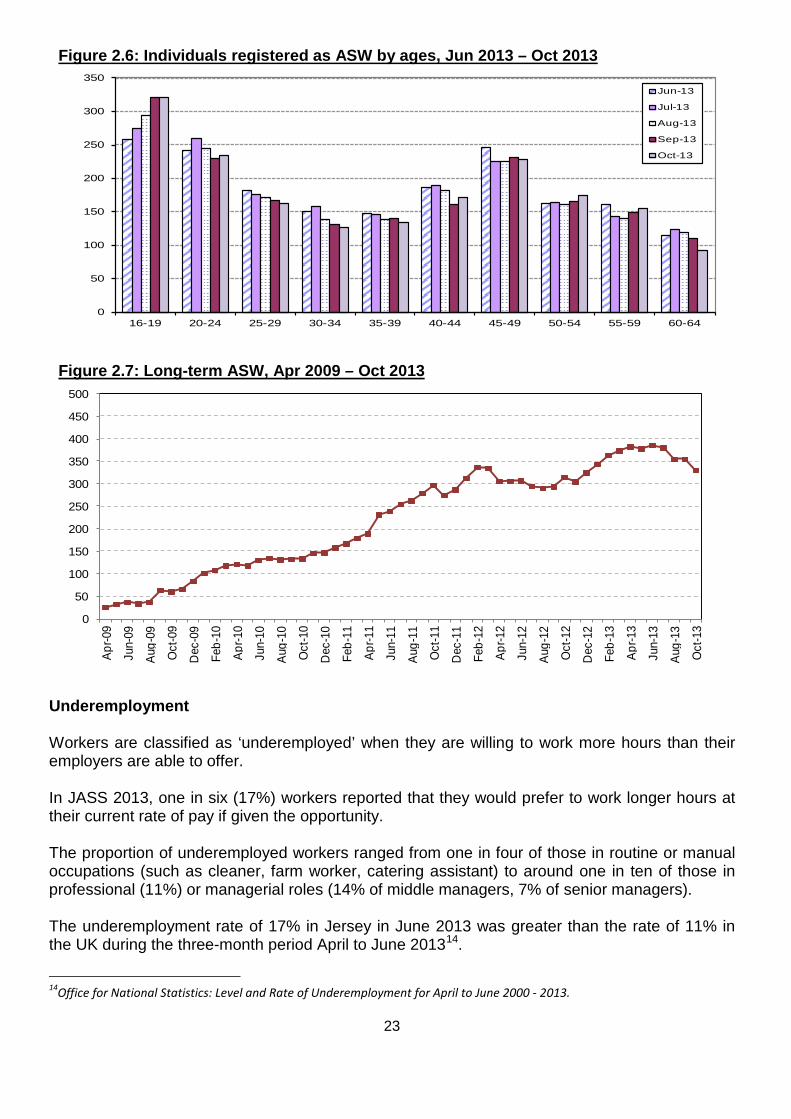
Figure 2.6: Individuals registered as ASW by ages, Jun 2013 – Oct 2013
0
50
100
150
200
250
300
350
16-19 20-24 25-29 30-34 35-39 40-44 45-49 50-54 55-59 60-64
Jun-13
Jul-13
Aug-13
Sep-13
Oct-13
Figure 2.7: Long-term ASW, Apr 2009 – Oct 2013
0
50
100
150
200
250
300
350
400
450
500
Apr-0
9
Jun-
09
Aug-
09
Oct
-09
Dec
-09
Feb-
10
Apr-1
0
Jun-
10
Aug-
10
Oct
-10
Dec
-10
Feb-
11
Apr-1
1
Jun-
11
Aug-
11
Oct
-11
Dec
-11
Feb-
12
Apr-1
2
Jun-
12
Aug-
12
Oct
-12
Dec
-12
Feb-
13
Apr-1
3
Jun-
13
Aug-
13
Oct
-13
Underemployment Workers are classified as ‘underemployed’ when they are willing to work more hours than their employers are able to offer. In JASS 2013, one in six (17%) workers reported that they would prefer to work longer hours at their current rate of pay if given the opportunity. The proportion of underemployed workers ranged from one in four of those in routine or manual occupations (such as cleaner, farm worker, catering assistant) to around one in ten of those in professional (11%) or managerial roles (14% of middle managers, 7% of senior managers). The underemployment rate of 17% in Jersey in June 2013 was greater than the rate of 11% in the UK during the three-month period April to June 201314.
14Office for National Statistics: Level and Rate of Underemployment for April to June 2000 - 2013.
23
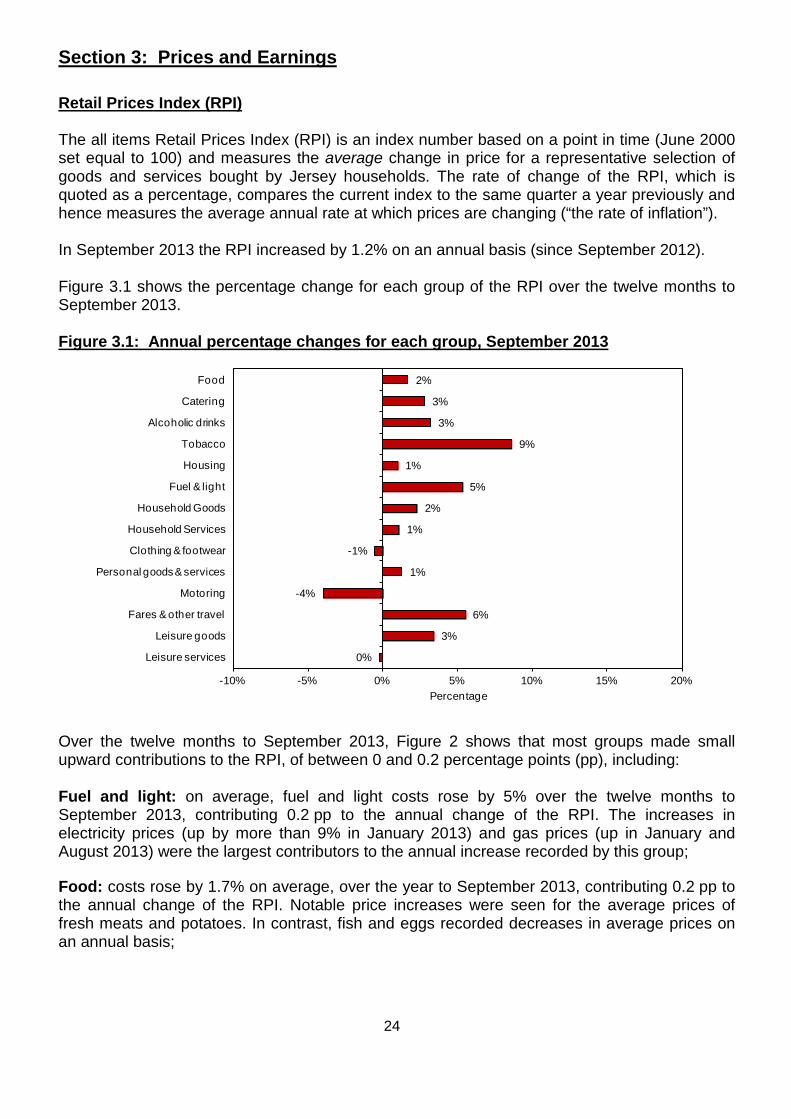
Section 3: Prices and Earnings Retail Prices Index (RPI) The all items Retail Prices Index (RPI) is an index number based on a point in time (June 2000 set equal to 100) and measures the average change in price for a representative selection of goods and services bought by Jersey households. The rate of change of the RPI, which is quoted as a percentage, compares the current index to the same quarter a year previously and hence measures the average annual rate at which prices are changing (“the rate of inflation”). In September 2013 the RPI increased by 1.2% on an annual basis (since September 2012). Figure 3.1 shows the percentage change for each group of the RPI over the twelve months to September 2013. Figure 3.1: Annual percentage changes for each group, September 2013
2%
3%
3%
9%
1%
5%
2%
1%
-1%
1%
-4%
6%
3%
0%
-10% -5% 0% 5% 10% 15% 20%
Food
Catering
Alcoholic drinks
Tobacco
Housing
Fuel & light
Household Goods
Household Services
Clothing & footwear
Personal goods & services
Motoring
Fares & other travel
Leisure goods
Leisure services
Percentage
Over the twelve months to September 2013, Figure 2 shows that most groups made small upward contributions to the RPI, of between 0 and 0.2 percentage points (pp), including: Fuel and light: on average, fuel and light costs rose by 5% over the twelve months to September 2013, contributing 0.2 pp to the annual change of the RPI. The increases in electricity prices (up by more than 9% in January 2013) and gas prices (up in January and August 2013) were the largest contributors to the annual increase recorded by this group;
Food: costs rose by 1.7% on average, over the year to September 2013, contributing 0.2 pp to the annual change of the RPI. Notable price increases were seen for the average prices of fresh meats and potatoes. In contrast, fish and eggs recorded decreases in average prices on an annual basis;
24
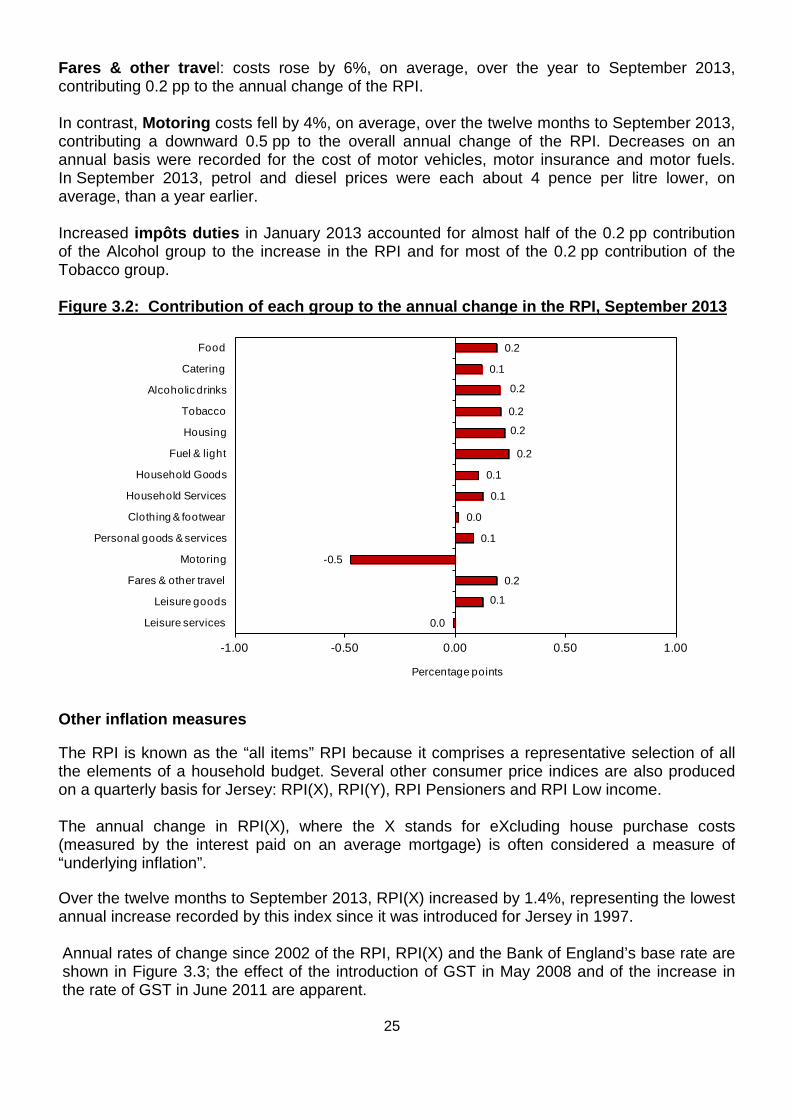
Fares & other travel: costs rose by 6%, on average, over the year to September 2013, contributing 0.2 pp to the annual change of the RPI. In contrast, Motoring costs fell by 4%, on average, over the twelve months to September 2013, contributing a downward 0.5 pp to the overall annual change of the RPI. Decreases on an annual basis were recorded for the cost of motor vehicles, motor insurance and motor fuels. In September 2013, petrol and diesel prices were each about 4 pence per litre lower, on average, than a year earlier. Increased impôts duties in January 2013 accounted for almost half of the 0.2 pp contribution of the Alcohol group to the increase in the RPI and for most of the 0.2 pp contribution of the Tobacco group. Figure 3.2: Contribution of each group to the annual change in the RPI, September 2013
0.2
0.1
0.2
0.2
0.2
0.2
0.1
0.1
0.0
0.1
-0.5
0.2
0.1
0.0
-1.00 -0.50 0.00 0.50 1.00
Food
Catering
Alcoholic drinks
Tobacco
Housing
Fuel & light
Household Goods
Household Services
Clothing & footwear
Personal goods & services
Motoring
Fares & other travel
Leisure goods
Leisure services
Percentage points
Other inflation measures The RPI is known as the “all items” RPI because it comprises a representative selection of all the elements of a household budget. Several other consumer price indices are also produced on a quarterly basis for Jersey: RPI(X), RPI(Y), RPI Pensioners and RPI Low income. The annual change in RPI(X), where the X stands for eXcluding house purchase costs (measured by the interest paid on an average mortgage) is often considered a measure of “underlying inflation”. Over the twelve months to September 2013, RPI(X) increased by 1.4%, representing the lowest annual increase recorded by this index since it was introduced for Jersey in 1997. Annual rates of change since 2002 of the RPI, RPI(X) and the Bank of England’s base rate are shown in Figure 3.3; the effect of the introduction of GST in May 2008 and of the increase in the rate of GST in June 2011 are apparent.
25
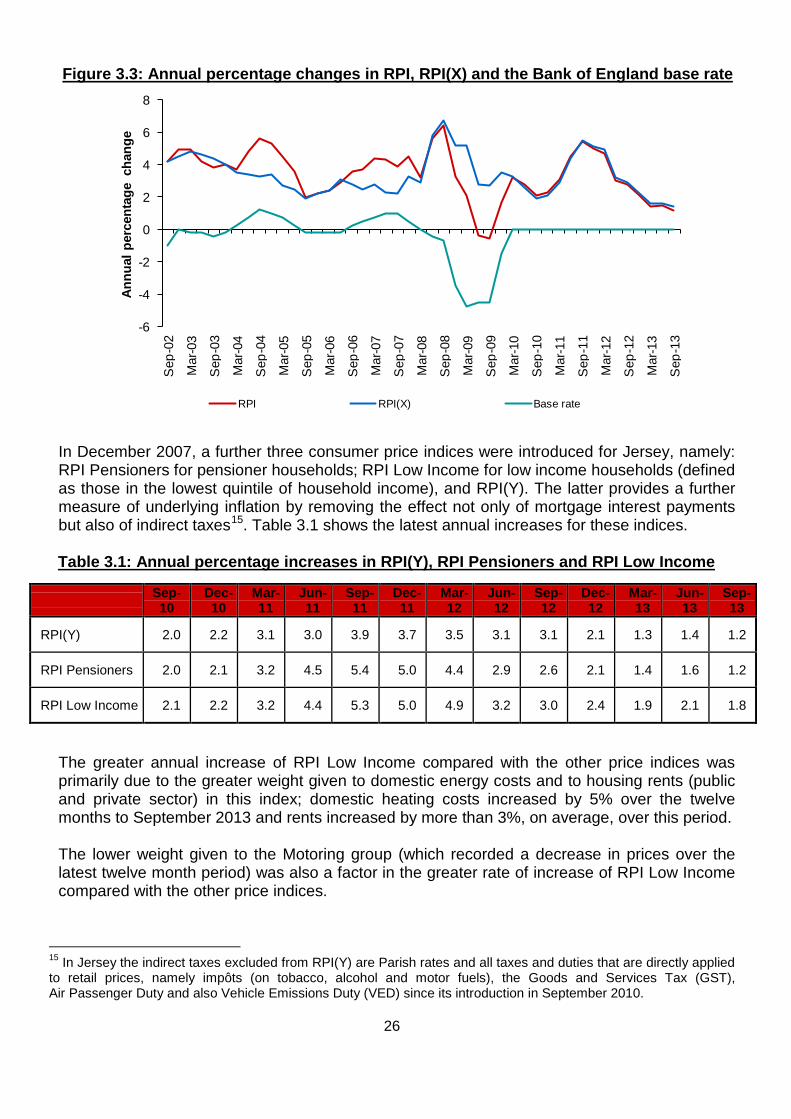
Figure 3.3: Annual percentage changes in RPI, RPI(X) and the Bank of England base rate
-6
-4
-2
0
2
4
6
8
Sep
-02
Mar
-03
Sep
-03
Mar
-04
Sep
-04
Mar
-05
Sep
-05
Mar
-06
Sep
-06
Mar
-07
Sep
-07
Mar
-08
Sep
-08
Mar
-09
Sep
-09
Mar
-10
Sep
-10
Mar
-11
Sep
-11
Mar
-12
Sep
-12
Mar
-13
Sep
-13
Annu
al p
erce
ntag
e ch
ange
RPI RPI(X) Base rate
In December 2007, a further three consumer price indices were introduced for Jersey, namely: RPI Pensioners for pensioner households; RPI Low Income for low income households (defined as those in the lowest quintile of household income), and RPI(Y). The latter provides a further measure of underlying inflation by removing the effect not only of mortgage interest payments but also of indirect taxes15. Table 3.1 shows the latest annual increases for these indices.
Table 3.1: Annual percentage increases in RPI(Y), RPI Pensioners and RPI Low Income
Sep- 10
Dec-10
Mar-11
Jun-11
Sep-11
Dec-11
Mar-12
Jun-12
Sep-12
Dec-12
Mar-13
Jun-13
Sep-13
RPI(Y) 2.0 2.2 3.1 3.0 3.9 3.7 3.5 3.1 3.1 2.1 1.3 1.4 1.2
RPI Pensioners 2.0 2.1 3.2 4.5 5.4 5.0 4.4 2.9 2.6 2.1 1.4 1.6 1.2
RPI Low Income 2.1 2.2 3.2 4.4 5.3 5.0 4.9 3.2 3.0 2.4 1.9 2.1 1.8
The greater annual increase of RPI Low Income compared with the other price indices was primarily due to the greater weight given to domestic energy costs and to housing rents (public and private sector) in this index; domestic heating costs increased by 5% over the twelve months to September 2013 and rents increased by more than 3%, on average, over this period. The lower weight given to the Motoring group (which recorded a decrease in prices over the latest twelve month period) was also a factor in the greater rate of increase of RPI Low Income compared with the other price indices.
15 In Jersey the indirect taxes excluded from RPI(Y) are Parish rates and all taxes and duties that are directly applied to retail prices, namely impôts (on tobacco, alcohol and motor fuels), the Goods and Services Tax (GST), Air Passenger Duty and also Vehicle Emissions Duty (VED) since its introduction in September 2010.
26
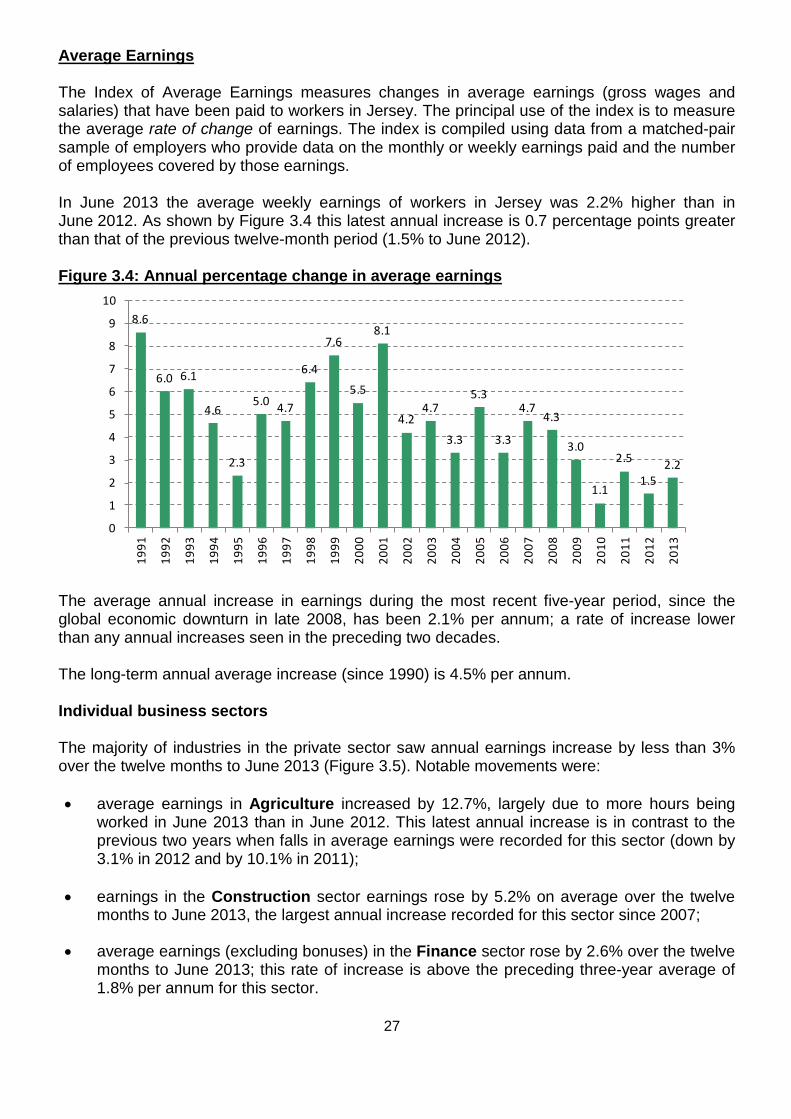
Average Earnings The Index of Average Earnings measures changes in average earnings (gross wages and salaries) that have been paid to workers in Jersey. The principal use of the index is to measure the average rate of change of earnings. The index is compiled using data from a matched-pair sample of employers who provide data on the monthly or weekly earnings paid and the number of employees covered by those earnings. In June 2013 the average weekly earnings of workers in Jersey was 2.2% higher than in June 2012. As shown by Figure 3.4 this latest annual increase is 0.7 percentage points greater than that of the previous twelve-month period (1.5% to June 2012). Figure 3.4: Annual percentage change in average earnings
8.6
6.0 6.1
4.6
2.3
5.0 4.7
6.4
7.6
5.5
8.1
4.24.7
3.3
5.3
3.3
4.74.3
3.0
1.1
2.5
1.52.2
0
1
2
3
4
5
6
7
8
9
10
1991
1992
1993
1994
1995
1996
1997
1998
1999
2000
2001
2002
2003
2004
2005
2006
2007
2008
2009
2010
2011
2012
2013
The average annual increase in earnings during the most recent five-year period, since the global economic downturn in late 2008, has been 2.1% per annum; a rate of increase lower than any annual increases seen in the preceding two decades.
The long-term annual average increase (since 1990) is 4.5% per annum. Individual business sectors The majority of industries in the private sector saw annual earnings increase by less than 3% over the twelve months to June 2013 (Figure 3.5). Notable movements were: • average earnings in Agriculture increased by 12.7%, largely due to more hours being
worked in June 2013 than in June 2012. This latest annual increase is in contrast to the previous two years when falls in average earnings were recorded for this sector (down by 3.1% in 2012 and by 10.1% in 2011);
• earnings in the Construction sector earnings rose by 5.2% on average over the twelve
months to June 2013, the largest annual increase recorded for this sector since 2007;
• average earnings (excluding bonuses) in the Finance sector rose by 2.6% over the twelve months to June 2013; this rate of increase is above the preceding three-year average of 1.8% per annum for this sector.
27
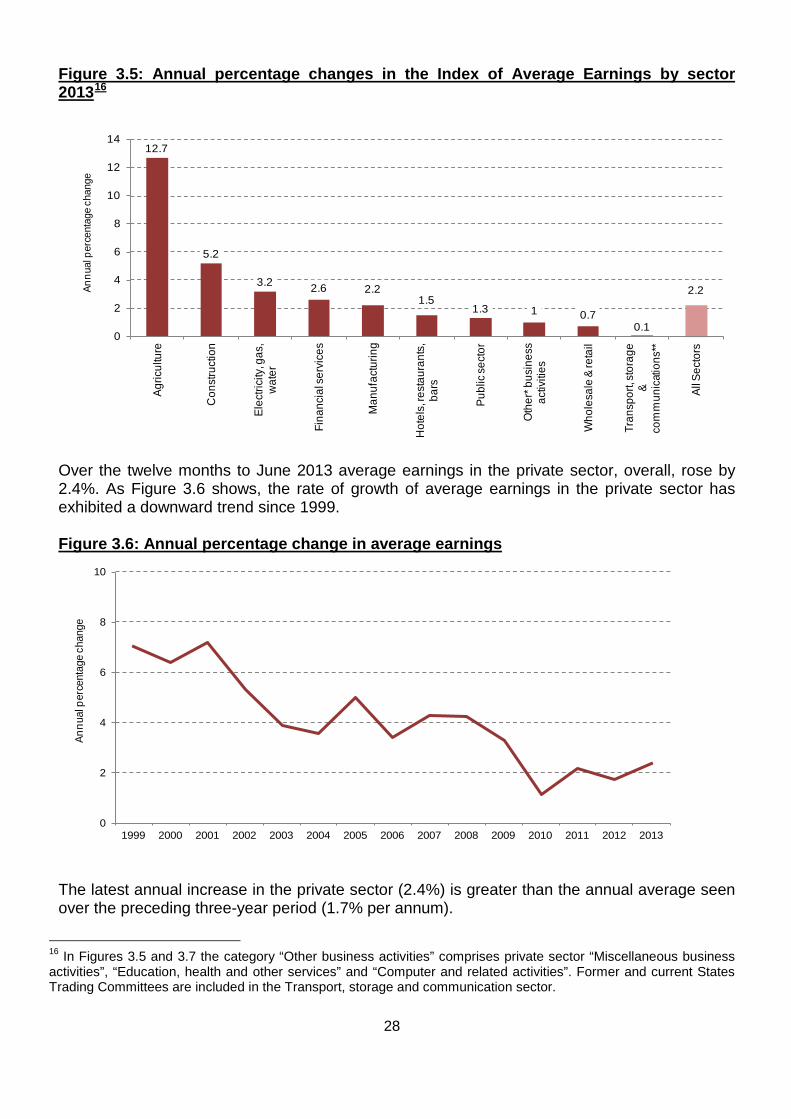
Figure 3.5: Annual percentage changes in the Index of Average Earnings by sector 201316
12.7
5.2
3.2 2.6 2.21.5
1.3 1 0.70.1
2.2
0
2
4
6
8
10
12
14Ag
ricul
ture
Con
stru
ctio
n
Elec
trici
ty, g
as,
wat
er
Fina
ncia
l ser
vice
s
Man
ufac
turin
g
Hot
els,
rest
aura
nts,
ba
rs
Publ
ic se
ctor
Oth
er* b
usin
ess
activ
ities
Who
lesa
le &
reta
il
Tran
spor
t, sto
rage
&
com
mun
icat
ions
**
All S
ecto
rs
Annu
al p
erce
ntag
e ch
ange
Over the twelve months to June 2013 average earnings in the private sector, overall, rose by 2.4%. As Figure 3.6 shows, the rate of growth of average earnings in the private sector has exhibited a downward trend since 1999. Figure 3.6: Annual percentage change in average earnings
0
2
4
6
8
10
1999 2000 2001 2002 2003 2004 2005 2006 2007 2008 2009 2010 2011 2012 2013
Annu
al p
erce
ntag
e ch
ange
The latest annual increase in the private sector (2.4%) is greater than the annual average seen over the preceding three-year period (1.7% per annum).
16 In Figures 3.5 and 3.7 the category “Other business activities” comprises private sector “Miscellaneous business activities”, “Education, health and other services” and “Computer and related activities”. Former and current States Trading Committees are included in the Transport, storage and communication sector.
28
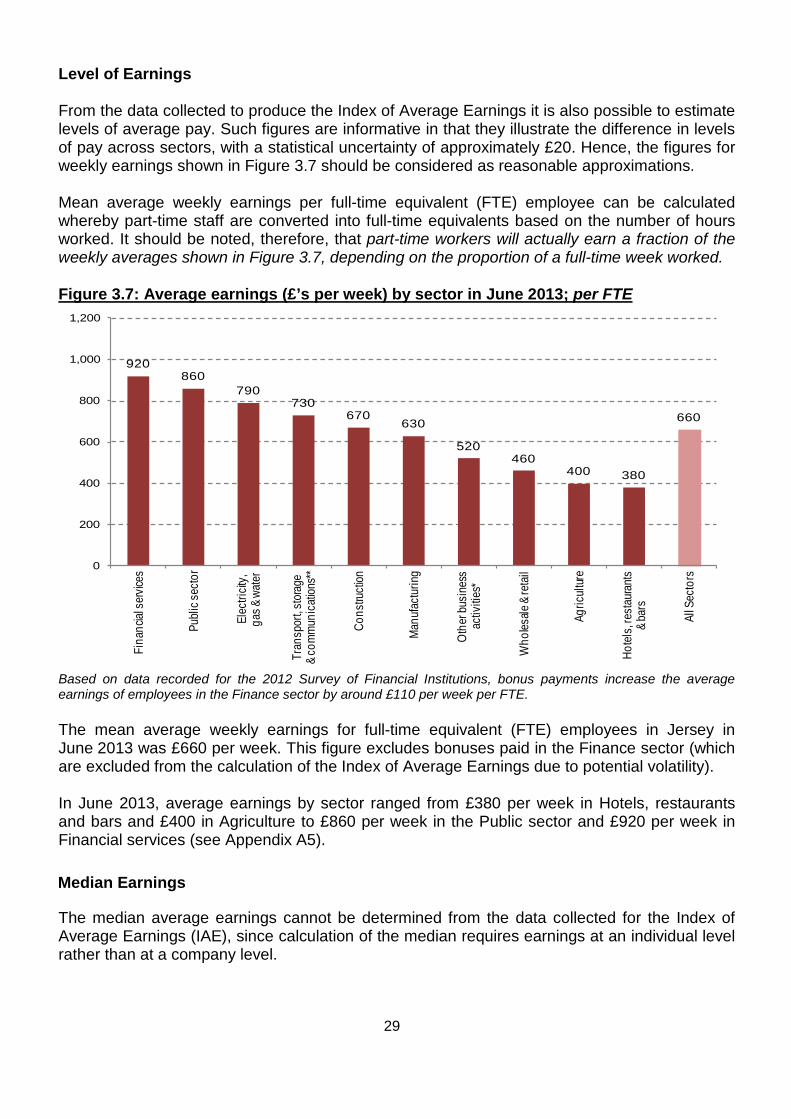
Level of Earnings From the data collected to produce the Index of Average Earnings it is also possible to estimate levels of average pay. Such figures are informative in that they illustrate the difference in levels of pay across sectors, with a statistical uncertainty of approximately £20. Hence, the figures for weekly earnings shown in Figure 3.7 should be considered as reasonable approximations. Mean average weekly earnings per full-time equivalent (FTE) employee can be calculated whereby part-time staff are converted into full-time equivalents based on the number of hours worked. It should be noted, therefore, that part-time workers will actually earn a fraction of the weekly averages shown in Figure 3.7, depending on the proportion of a full-time week worked. Figure 3.7: Average earnings (£’s per week) by sector in June 2013; per FTE
920860
790730
670630
520460
400 380
660
0
200
400
600
800
1,000
1,200
Fina
ncial
serv
ices
Publ
ic se
ctor
Elec
tricit
y,ga
s & w
ater
Tran
spor
t, sto
rage
& co
mm
unic
ation
s**
Cons
truct
ion
Man
ufac
turin
g
Oth
er bu
sine
ss
activ
ities
*
Who
lesale
& re
tail
Agric
ultur
e
Hote
ls, r
esta
uran
ts
& ba
rs
All S
ecto
rs
Based on data recorded for the 2012 Survey of Financial Institutions, bonus payments increase the average earnings of employees in the Finance sector by around £110 per week per FTE. The mean average weekly earnings for full-time equivalent (FTE) employees in Jersey in June 2013 was £660 per week. This figure excludes bonuses paid in the Finance sector (which are excluded from the calculation of the Index of Average Earnings due to potential volatility). In June 2013, average earnings by sector ranged from £380 per week in Hotels, restaurants and bars and £400 in Agriculture to £860 per week in the Public sector and £920 per week in Financial services (see Appendix A5).
Median Earnings
The median average earnings cannot be determined from the data collected for the Index of Average Earnings (IAE), since calculation of the median requires earnings at an individual level rather than at a company level.
29
The Jersey Income Distribution Survey (IDS), which was carried out over the twelve-month period from May 2009 to May 2010, collected the necessary household and individual income information required to determine median income from earnings. The results derived from the IDS data have been up-rated from the survey period to June 2013 using the Jersey Index of Average Earnings.
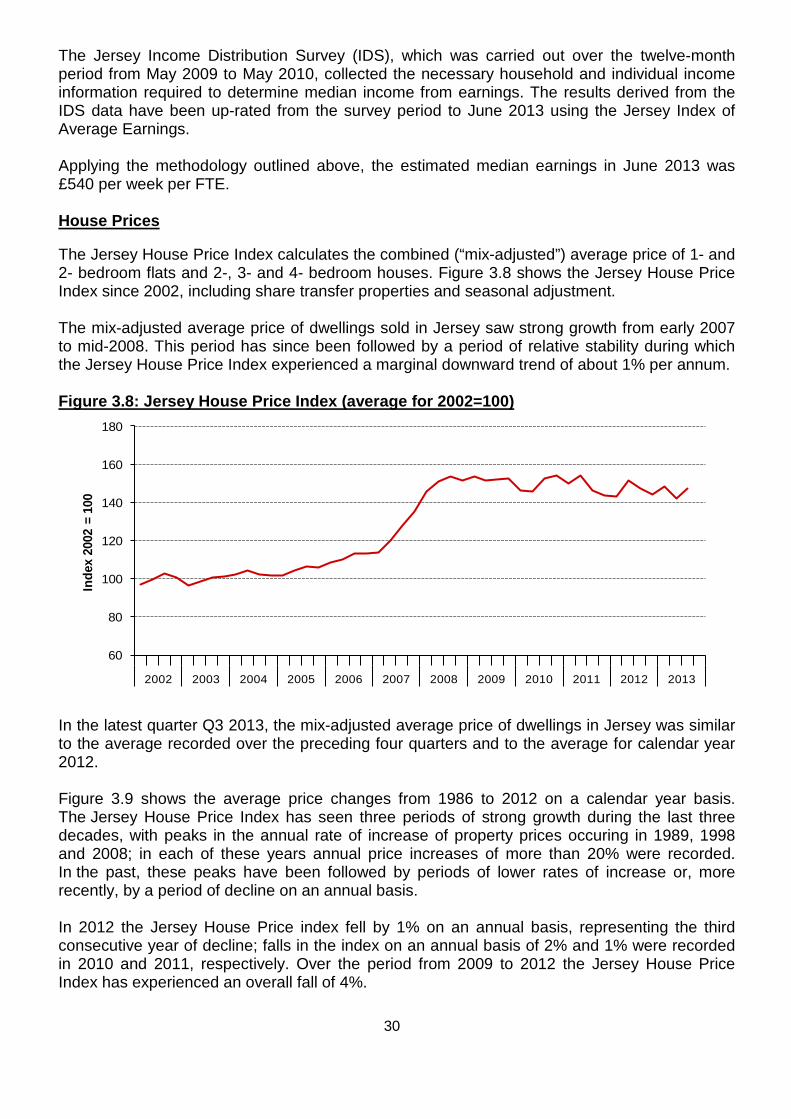
Applying the methodology outlined above, the estimated median earnings in June 2013 was £540 per week per FTE. House Prices The Jersey House Price Index calculates the combined (“mix-adjusted”) average price of 1- and 2- bedroom flats and 2-, 3- and 4- bedroom houses. Figure 3.8 shows the Jersey House Price Index since 2002, including share transfer properties and seasonal adjustment. The mix-adjusted average price of dwellings sold in Jersey saw strong growth from early 2007 to mid-2008. This period has since been followed by a period of relative stability during which the Jersey House Price Index experienced a marginal downward trend of about 1% per annum. Figure 3.8: Jersey House Price Index (average for 2002=100)
60
80
100
120
140
160
180
2002 2003 2004 2005 2006 2007 2008 2009 2010 2011 2012 2013
Inde
x 20
02 =
100
In the latest quarter Q3 2013, the mix-adjusted average price of dwellings in Jersey was similar to the average recorded over the preceding four quarters and to the average for calendar year 2012.
Figure 3.9 shows the average price changes from 1986 to 2012 on a calendar year basis. The Jersey House Price Index has seen three periods of strong growth during the last three decades, with peaks in the annual rate of increase of property prices occuring in 1989, 1998 and 2008; in each of these years annual price increases of more than 20% were recorded. In the past, these peaks have been followed by periods of lower rates of increase or, more recently, by a period of decline on an annual basis. In 2012 the Jersey House Price index fell by 1% on an annual basis, representing the third consecutive year of decline; falls in the index on an annual basis of 2% and 1% were recorded in 2010 and 2011, respectively. Over the period from 2009 to 2012 the Jersey House Price Index has experienced an overall fall of 4%.
30
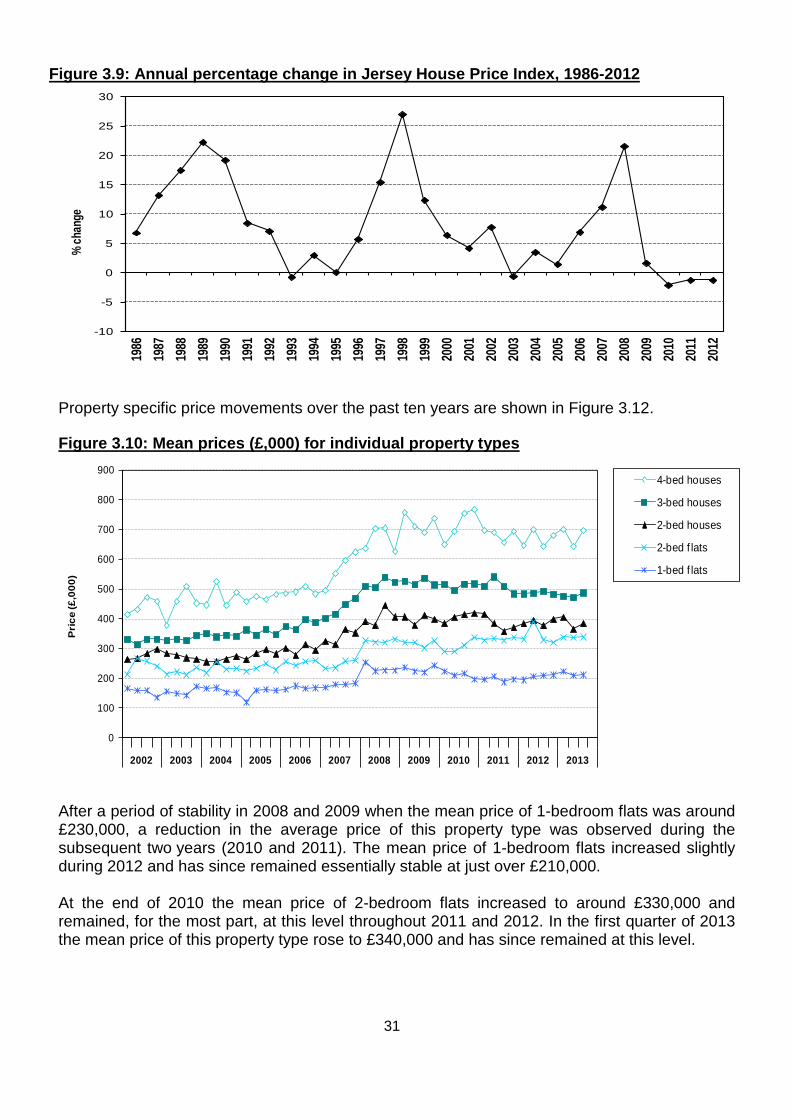
Figure 3.9: Annual percentage change in Jersey House Price Index, 1986-2012
-10
-5
0
5
10
15
20
25
30
1986
1987
1988
1989
1990
1991
1992
1993
1994
1995
1996
1997
1998
1999
2000
2001
2002
2003
2004
2005
2006
2007
2008
2009
2010
2011
2012
% ch
ange
Property specific price movements over the past ten years are shown in Figure 3.12. Figure 3.10: Mean prices (£,000) for individual property types
0
100
200
300
400
500
600
700
800
900
2002 2003 2004 2005 2006 2007 2008 2009 2010 2011 2012 2013
Pri
ce (£
,000
)
4-bed houses
3-bed houses
2-bed houses
2-bed f lats
1-bed f lats
After a period of stability in 2008 and 2009 when the mean price of 1-bedroom flats was around £230,000, a reduction in the average price of this property type was observed during the subsequent two years (2010 and 2011). The mean price of 1-bedroom flats increased slightly during 2012 and has since remained essentially stable at just over £210,000. At the end of 2010 the mean price of 2-bedroom flats increased to around £330,000 and remained, for the most part, at this level throughout 2011 and 2012. In the first quarter of 2013 the mean price of this property type rose to £340,000 and has since remained at this level.
31
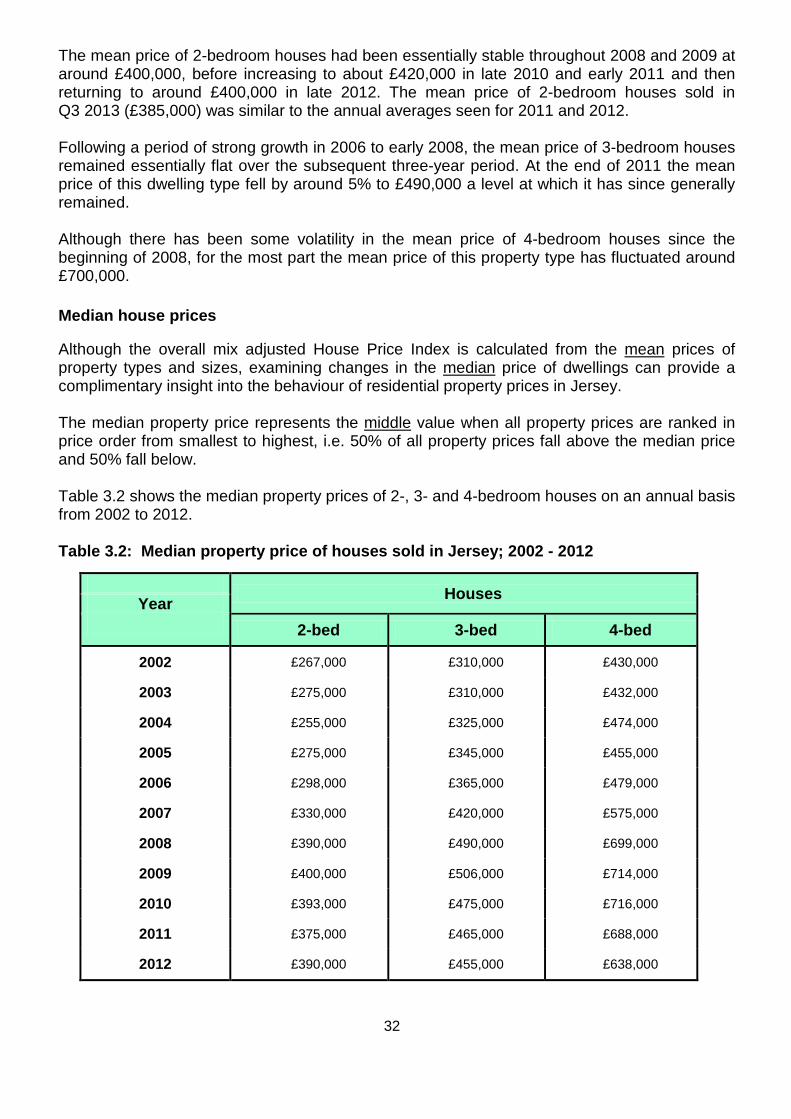
The mean price of 2-bedroom houses had been essentially stable throughout 2008 and 2009 at around £400,000, before increasing to about £420,000 in late 2010 and early 2011 and then returning to around £400,000 in late 2012. The mean price of 2-bedroom houses sold in Q3 2013 (£385,000) was similar to the annual averages seen for 2011 and 2012.
Following a period of strong growth in 2006 to early 2008, the mean price of 3-bedroom houses remained essentially flat over the subsequent three-year period. At the end of 2011 the mean price of this dwelling type fell by around 5% to £490,000 a level at which it has since generally remained. Although there has been some volatility in the mean price of 4-bedroom houses since the beginning of 2008, for the most part the mean price of this property type has fluctuated around £700,000. Median house prices
Although the overall mix adjusted House Price Index is calculated from the mean prices of property types and sizes, examining changes in the median price of dwellings can provide a complimentary insight into the behaviour of residential property prices in Jersey.
The median property price represents the middle value when all property prices are ranked in price order from smallest to highest, i.e. 50% of all property prices fall above the median price and 50% fall below. Table 3.2 shows the median property prices of 2-, 3- and 4-bedroom houses on an annual basis from 2002 to 2012. Table 3.2: Median property price of houses sold in Jersey; 2002 - 2012
Houses Year 2-bed 3-bed 4-bed
2002 £267,000 £310,000 £430,000
2003 £275,000 £310,000 £432,000
2004 £255,000 £325,000 £474,000
2005 £275,000 £345,000 £455,000
2006 £298,000 £365,000 £479,000
2007 £330,000 £420,000 £575,000
2008 £390,000 £490,000 £699,000
2009 £400,000 £506,000 £714,000
2010 £393,000 £475,000 £716,000
2011 £375,000 £465,000 £688,000
2012 £390,000 £455,000 £638,000
32
The median price of 2-bedroom houses saw strong growth from 2002 to 2008 such that in 2008 the median price of this property type (£390,000) was 46% greater than in 2002. Since 2008 the median price of this property type has remained relatively stable, with 2012 recording an annual median price at the same level as that recorded four years previously, in 2008. Following a period of annual increases in the median price of 3-bedroom houses from 2003 to 2009, the most recent three-year period (2010 to 2012) has seen the median price of this property type fall in each subsequent year. In 2012 the median price of 3-bedroom houses (£455,000) was 10% lower than at the peak in 2009, corresponding to a fall in price of about £50,000 in three years. The median price of 4-bedroom houses also saw strong growth from 2003 to 2009, with an increase of almost £300,000 over the six-year period. Since 2010 the median price of this property type has decreased by more than 10%. In 2012 the median price of 4-bedroom houses (£638,000) was almost £80,000 lower than in 2009 and 2010. From the perspective of turnover, the number of properties sold in Q3 2013 was more than a quarter (28%) greater than in the previous quarter (Q2 2012) and was at the highest level recorded since 2006. The latest quarterly increase was driven by an increase the sale of 3-bedroom houses; about double the number of 3-bedroom houses were sold in Q3 2013 compared with each of the first two quarters of 2013. In Q3 2013 share transfer properties accounted for almost half (49%) of all eligible sales of flats, a notably smaller proportion than that observed throughout 2011 and 2012 when this proportion was closer to three-quarters of all such sales.
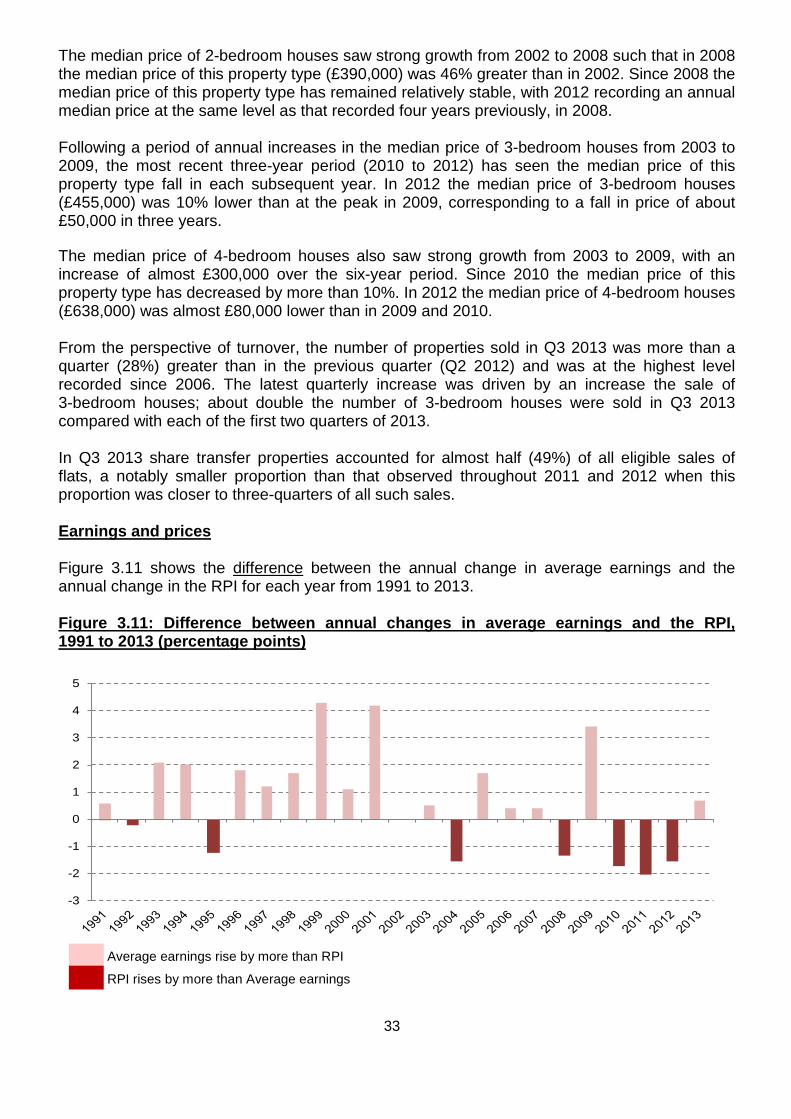
Earnings and prices Figure 3.11 shows the difference between the annual change in average earnings and the annual change in the RPI for each year from 1991 to 2013. Figure 3.11: Difference between annual changes in average earnings and the RPI, 1991 to 2013 (percentage points)
-3
-2
-1
0
1
2
3
4
5
Average earnings rise by more than RPI
RPI rises by more than Average earnings
33
It is apparent from Figure 3.11 that recent years have constituted a different period in the relative behaviour of prices and earnings than that seen prior to 2003. In four of the last six years, earnings have risen by less than prices. Over the latest year twelve-month period (June 2012 to June 2013), earnings increased by 0.7 percentage points more than prices, representing the first time in four years that earnings have risen at a greater rate than prices in Jersey.
Changes in earnings and prices during the most recent ten-year period are shown in Table 3.3. The changes in retail prices are presented in terms of headline inflation, as measured by RPI, and underlying inflation, as measured by RPI(X). Table 3.3: Changes in retail price indices and average earnings; percentages
Index 1-year 2012-2013
3-year 2010-2013
5-year 2008-2013
10-year 2003-2013
RPI 1.5 9.3 11.9 37.8
RPI(X) 1.6 9.5 15.5 36.5
Average Earnings 2.2 6.3 10.7 35.8
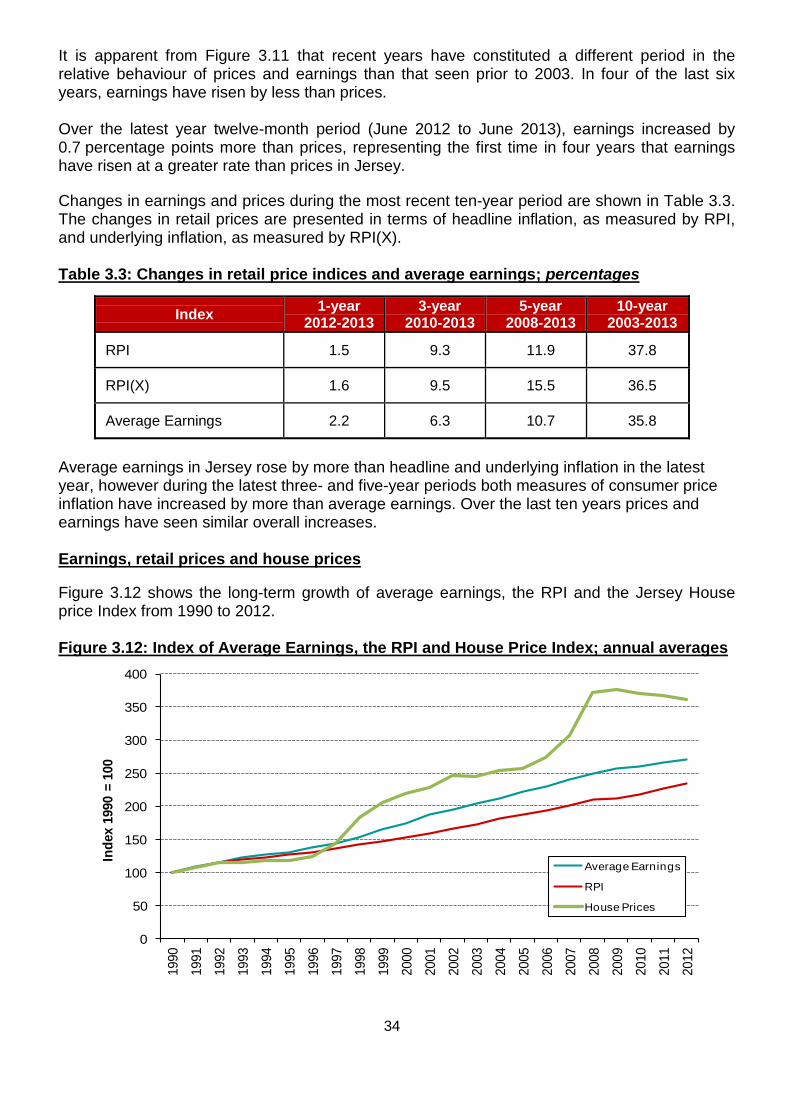
Average earnings in Jersey rose by more than headline and underlying inflation in the latest year, however during the latest three- and five-year periods both measures of consumer price inflation have increased by more than average earnings. Over the last ten years prices and earnings have seen similar overall increases. Earnings, retail prices and house prices Figure 3.12 shows the long-term growth of average earnings, the RPI and the Jersey House price Index from 1990 to 2012. Figure 3.12: Index of Average Earnings, the RPI and House Price Index; annual averages
0
50
100
150
200
250
300
350
400
1990
1991
1992
1993
1994
1995
1996
1997
1998
1999
2000
2001
2002
2003
2004
2005
2006
2007
2008
2009
2010
2011
2012
Inde
x 19
90 =
100
Average Earnings
RPI
House Prices
34
It is apparent from Figure 3.12 that the growth of property prices in Jersey has, historically, increased at a greater rate than both earnings and inflation over the long-term (1990 to 2012). Since 1990:
• the Jersey RPI has increased by 137% (i.e. prices have more than doubled), corresponding to an average annual rate of increase of 3.9% per annum;
• earnings have increased by 177% over the same period, corresponding to an average annual rate of increase of 4.6% per annum.
• the Jersey House Price Index has more than tripled since 1990 (increased by 260%), corresponding to property prices in Jersey having increased at an average annual rate of 6.0% per annum.
However, more recently, the relative behaviour of the three indices has been different to that of the long-term. Since 2009:
o the Jersey House Price Index has fallen by 4%, corresponding to an average annual decrease of 1% per annum and representing the first sustained period of property price decline seen in Jersey during the last three decades;
o earnings and retail prices, on the other hand, have continued to rise during the four-year
period from 2009 to 2013, up by 7% and 12% respectively.
35
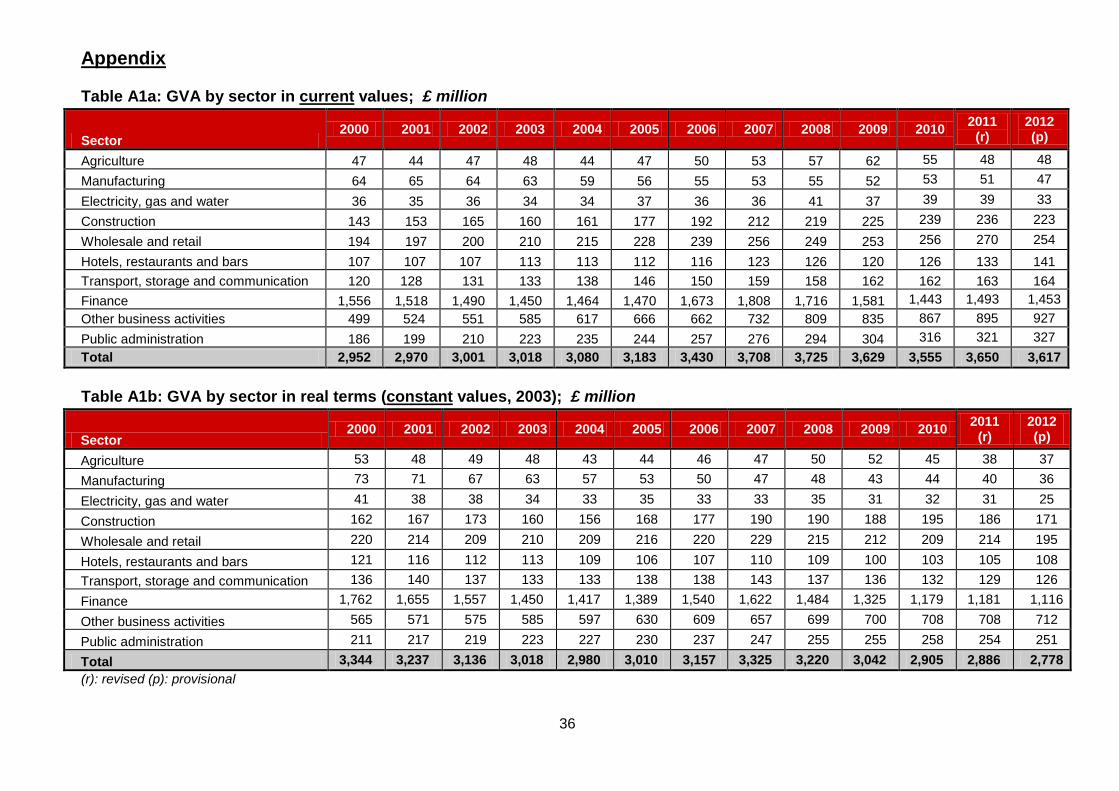
Appendix Table A1a: GVA by sector in current values; £ million
Table A1b: GVA by sector in real terms (constant values, 2003); £ million
(r): revised (p): provisional
Sector 2000 2001 2002 2003 2004 2005 2006 2007 2008 2009 2010 2011
(r) 2012 (p)
Agriculture 47 44 47 48 44 47 50 53 57 62 55 48 48 Manufacturing 64 65 64 63 59 56 55 53 55 52 53 51 47
Electricity, gas and water 36 35 36 34 34 37 36 36 41 37 39 39 33 Construction 143 153 165 160 161 177 192 212 219 225 239 236 223 Wholesale and retail 194 197 200 210 215 228 239 256 249 253 256 270 254 Hotels, restaurants and bars 107 107 107 113 113 112 116 123 126 120 126 133 141 Transport, storage and communication 120 128 131 133 138 146 150 159 158 162 162 163 164 Finance 1,556 1,518 1,490 1,450 1,464 1,470 1,673 1,808 1,716 1,581 1,443 1,493 1,453 Other business activities 499 524 551 585 617 666 662 732 809 835 867 895 927 Public administration 186 199 210 223 235 244 257 276 294 304 316 321 327 Total 2,952 2,970 3,001 3,018 3,080 3,183 3,430 3,708 3,725 3,629 3,555 3,650 3,617
Sector 2000 2001 2002 2003 2004 2005 2006 2007 2008 2009 2010 2011
(r) 2012 (p)
Agriculture 53 48 49 48 43 44 46 47 50 52 45 38 37 Manufacturing 73 71 67 63 57 53 50 47 48 43 44 40 36
Electricity, gas and water 41 38 38 34 33 35 33 33 35 31 32 31 25
Construction 162 167 173 160 156 168 177 190 190 188 195 186 171
Wholesale and retail 220 214 209 210 209 216 220 229 215 212 209 214 195
Hotels, restaurants and bars 121 116 112 113 109 106 107 110 109 100 103 105 108 Transport, storage and communication 136 140 137 133 133 138 138 143 137 136 132 129 126 Finance 1,762 1,655 1,557 1,450 1,417 1,389 1,540 1,622 1,484 1,325 1,179 1,181 1,116
Other business activities 565 571 575 585 597 630 609 657 699 700 708 708 712
Public administration 211 217 219 223 227 230 237 247 255 255 258 254 251 Total 3,344 3,237 3,136 3,018 2,980 3,010 3,157 3,325 3,220 3,042 2,905 2,886 2,778
36
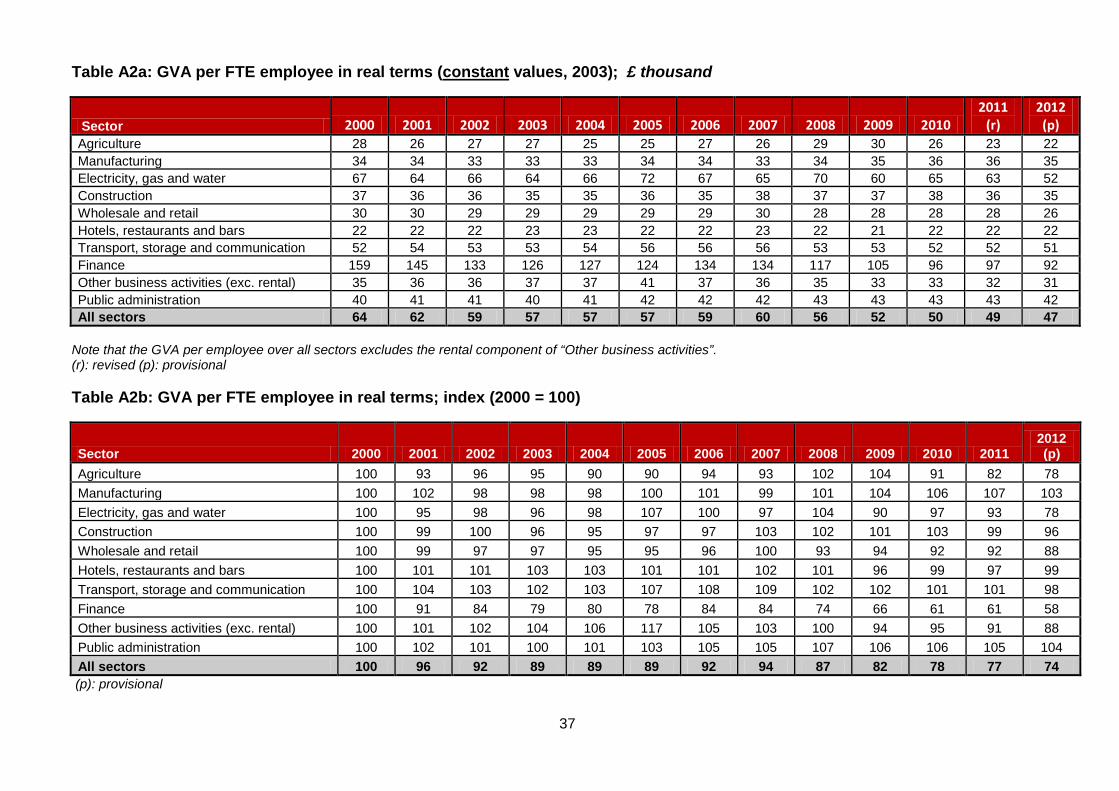
Table A2a: GVA per FTE employee in real terms (constant values, 2003); £ thousand
Sector 2000 2001 2002 2003 2004 2005 2006 2007 2008 2009 2010 2011
(r) 2012 (p)
Agriculture 28 26 27 27 25 25 27 26 29 30 26 23 22 Manufacturing 34 34 33 33 33 34 34 33 34 35 36 36 35 Electricity, gas and water 67 64 66 64 66 72 67 65 70 60 65 63 52 Construction 37 36 36 35 35 36 35 38 37 37 38 36 35 Wholesale and retail 30 30 29 29 29 29 29 30 28 28 28 28 26 Hotels, restaurants and bars 22 22 22 23 23 22 22 23 22 21 22 22 22 Transport, storage and communication 52 54 53 53 54 56 56 56 53 53 52 52 51 Finance 159 145 133 126 127 124 134 134 117 105 96 97 92 Other business activities (exc. rental) 35 36 36 37 37 41 37 36 35 33 33 32 31 Public administration 40 41 41 40 41 42 42 42 43 43 43 43 42 All sectors 64 62 59 57 57 57 59 60 56 52 50 49 47
Note that the GVA per employee over all sectors excludes the rental component of “Other business activities”. (r): revised (p): provisional Table A2b: GVA per FTE employee in real terms; index (2000 = 100)
Sector 2000 2001 2002 2003 2004 2005 2006 2007 2008 2009 2010 2011 2012 (p)
Agriculture 100 93 96 95 90 90 94 93 102 104 91 82 78 Manufacturing 100 102 98 98 98 100 101 99 101 104 106 107 103 Electricity, gas and water 100 95 98 96 98 107 100 97 104 90 97 93 78 Construction 100 99 100 96 95 97 97 103 102 101 103 99 96 Wholesale and retail 100 99 97 97 95 95 96 100 93 94 92 92 88 Hotels, restaurants and bars 100 101 101 103 103 101 101 102 101 96 99 97 99 Transport, storage and communication 100 104 103 102 103 107 108 109 102 102 101 101 98 Finance 100 91 84 79 80 78 84 84 74 66 61 61 58 Other business activities (exc. rental) 100 101 102 104 106 117 105 103 100 94 95 91 88 Public administration 100 102 101 100 101 103 105 105 107 106 106 105 104 All sectors 100 96 92 89 89 89 92 94 87 82 78 77 74
(p): provisional
37
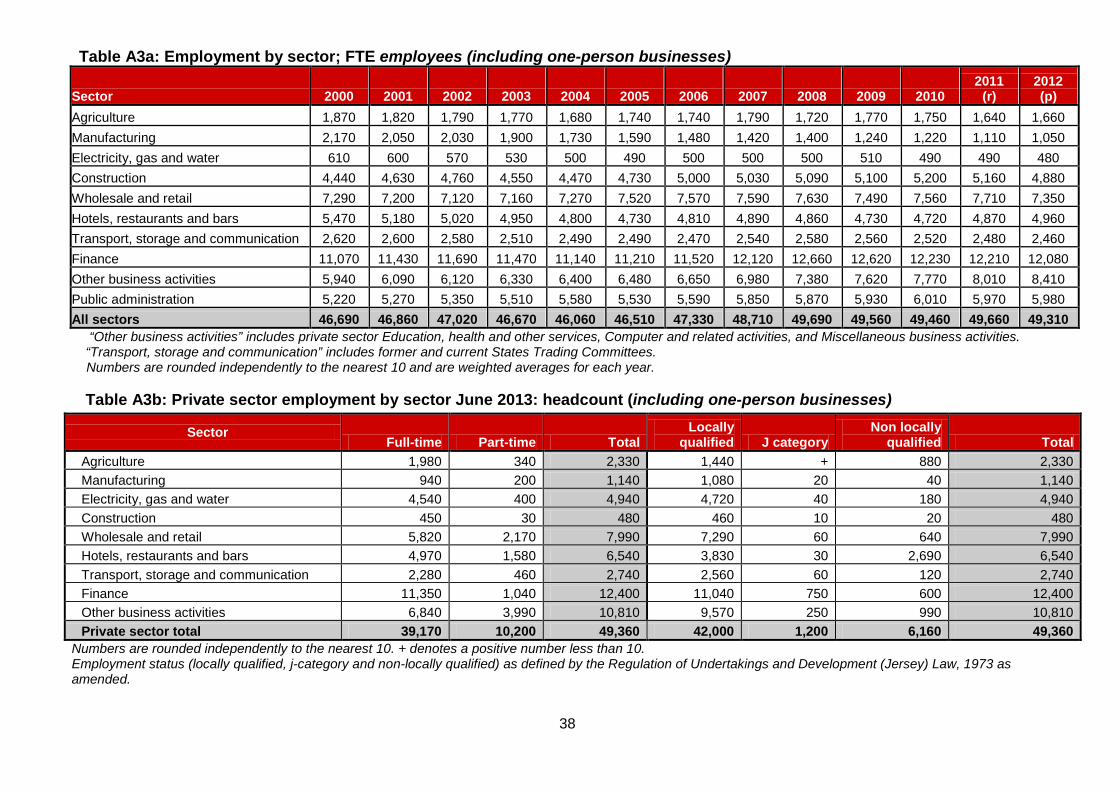
Table A3a: Employment by sector; FTE employees (including one-person businesses)
Sector 2000 2001 2002 2003 2004 2005 2006 2007 2008 2009 2010 2011
(r) 2012 (p)
Agriculture 1,870 1,820 1,790 1,770 1,680 1,740 1,740 1,790 1,720 1,770 1,750 1,640 1,660 Manufacturing 2,170 2,050 2,030 1,900 1,730 1,590 1,480 1,420 1,400 1,240 1,220 1,110 1,050 Electricity, gas and water 610 600 570 530 500 490 500 500 500 510 490 490 480 Construction 4,440 4,630 4,760 4,550 4,470 4,730 5,000 5,030 5,090 5,100 5,200 5,160 4,880 Wholesale and retail 7,290 7,200 7,120 7,160 7,270 7,520 7,570 7,590 7,630 7,490 7,560 7,710 7,350 Hotels, restaurants and bars 5,470 5,180 5,020 4,950 4,800 4,730 4,810 4,890 4,860 4,730 4,720 4,870 4,960 Transport, storage and communication 2,620 2,600 2,580 2,510 2,490 2,490 2,470 2,540 2,580 2,560 2,520 2,480 2,460 Finance 11,070 11,430 11,690 11,470 11,140 11,210 11,520 12,120 12,660 12,620 12,230 12,210 12,080 Other business activities 5,940 6,090 6,120 6,330 6,400 6,480 6,650 6,980 7,380 7,620 7,770 8,010 8,410 Public administration 5,220 5,270 5,350 5,510 5,580 5,530 5,590 5,850 5,870 5,930 6,010 5,970 5,980 All sectors 46,690 46,860 47,020 46,670 46,060 46,510 47,330 48,710 49,690 49,560 49,460 49,660 49,310
“Other business activities” includes private sector Education, health and other services, Computer and related activities, and Miscellaneous business activities. “Transport, storage and communication” includes former and current States Trading Committees.
Numbers are rounded independently to the nearest 10 and are weighted averages for each year. Table A3b: Private sector employment by sector June 2013: headcount (including one-person businesses)
Numbers are rounded independently to the nearest 10. + denotes a positive number less than 10. Employment status (locally qualified, j-category and non-locally qualified) as defined by the Regulation of Undertakings and Development (Jersey) Law, 1973 as amended.
Sector Full-time Part-time Total
Locally qualified J category
Non locally qualified Total
Agriculture 1,980 340 2,330 1,440 + 880 2,330 Manufacturing 940 200 1,140 1,080 20 40 1,140 Electricity, gas and water 4,540 400 4,940 4,720 40 180 4,940 Construction 450 30 480 460 10 20 480 Wholesale and retail 5,820 2,170 7,990 7,290 60 640 7,990 Hotels, restaurants and bars 4,970 1,580 6,540 3,830 30 2,690 6,540 Transport, storage and communication 2,280 460 2,740 2,560 60 120 2,740 Finance 11,350 1,040 12,400 11,040 750 600 12,400 Other business activities 6,840 3,990 10,810 9,570 250 990 10,810 Private sector total 39,170 10,200 49,360 42,000 1,200 6,160 49,360
38
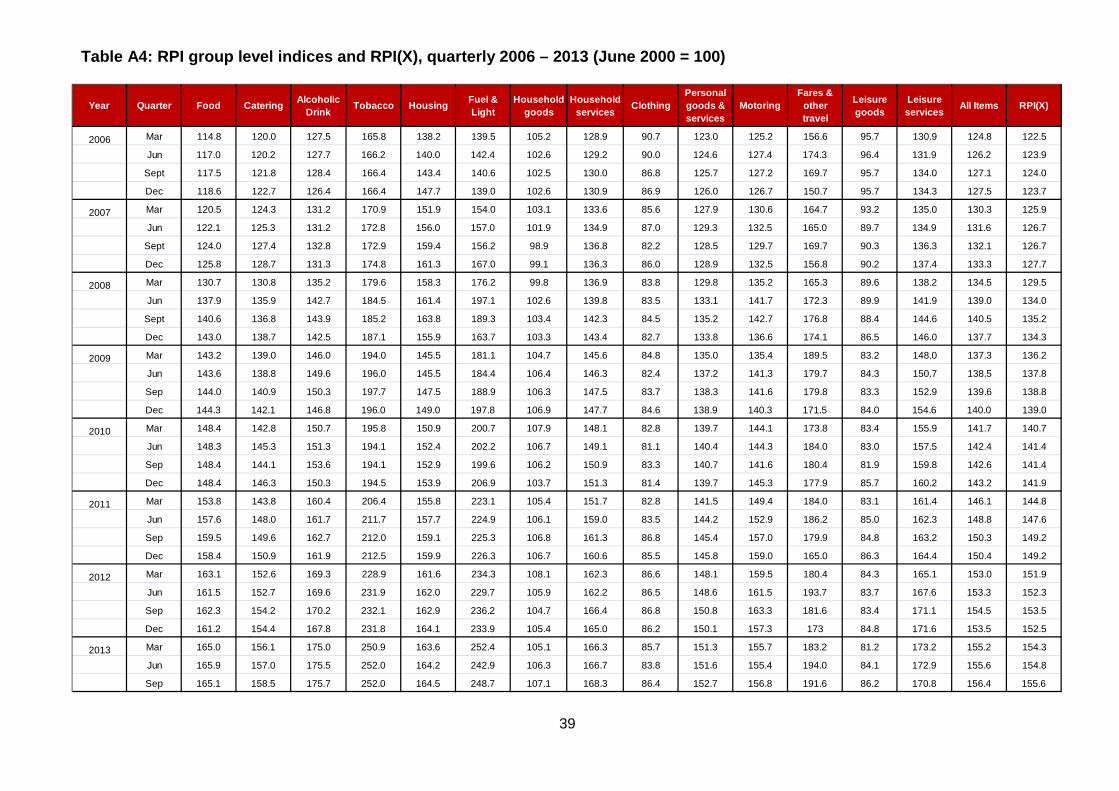
Table A4: RPI group level indices and RPI(X), quarterly 2006 – 2013 (June 2000 = 100)
Year Quarter Food Catering Alcoholic Drink Tobacco Housing Fuel &
LightHousehold
goodsHousehold
services ClothingPersonal goods & services
MotoringFares &
other travel
Leisure goods
Leisure services All Items RPI(X)
2006 Mar 114.8 120.0 127.5 165.8 138.2 139.5 105.2 128.9 90.7 123.0 125.2 156.6 95.7 130.9 124.8 122.5
Jun 117.0 120.2 127.7 166.2 140.0 142.4 102.6 129.2 90.0 124.6 127.4 174.3 96.4 131.9 126.2 123.9
Sept 117.5 121.8 128.4 166.4 143.4 140.6 102.5 130.0 86.8 125.7 127.2 169.7 95.7 134.0 127.1 124.0
Dec 118.6 122.7 126.4 166.4 147.7 139.0 102.6 130.9 86.9 126.0 126.7 150.7 95.7 134.3 127.5 123.7
2007 Mar 120.5 124.3 131.2 170.9 151.9 154.0 103.1 133.6 85.6 127.9 130.6 164.7 93.2 135.0 130.3 125.9
Jun 122.1 125.3 131.2 172.8 156.0 157.0 101.9 134.9 87.0 129.3 132.5 165.0 89.7 134.9 131.6 126.7
Sept 124.0 127.4 132.8 172.9 159.4 156.2 98.9 136.8 82.2 128.5 129.7 169.7 90.3 136.3 132.1 126.7
Dec 125.8 128.7 131.3 174.8 161.3 167.0 99.1 136.3 86.0 128.9 132.5 156.8 90.2 137.4 133.3 127.7
2008 Mar 130.7 130.8 135.2 179.6 158.3 176.2 99.8 136.9 83.8 129.8 135.2 165.3 89.6 138.2 134.5 129.5
Jun 137.9 135.9 142.7 184.5 161.4 197.1 102.6 139.8 83.5 133.1 141.7 172.3 89.9 141.9 139.0 134.0
Sept 140.6 136.8 143.9 185.2 163.8 189.3 103.4 142.3 84.5 135.2 142.7 176.8 88.4 144.6 140.5 135.2
Dec 143.0 138.7 142.5 187.1 155.9 163.7 103.3 143.4 82.7 133.8 136.6 174.1 86.5 146.0 137.7 134.3
2009 Mar 143.2 139.0 146.0 194.0 145.5 181.1 104.7 145.6 84.8 135.0 135.4 189.5 83.2 148.0 137.3 136.2
Jun 143.6 138.8 149.6 196.0 145.5 184.4 106.4 146.3 82.4 137.2 141.3 179.7 84.3 150.7 138.5 137.8
Sep 144.0 140.9 150.3 197.7 147.5 188.9 106.3 147.5 83.7 138.3 141.6 179.8 83.3 152.9 139.6 138.8
Dec 144.3 142.1 146.8 196.0 149.0 197.8 106.9 147.7 84.6 138.9 140.3 171.5 84.0 154.6 140.0 139.0
2010 Mar 148.4 142.8 150.7 195.8 150.9 200.7 107.9 148.1 82.8 139.7 144.1 173.8 83.4 155.9 141.7 140.7
Jun 148.3 145.3 151.3 194.1 152.4 202.2 106.7 149.1 81.1 140.4 144.3 184.0 83.0 157.5 142.4 141.4
Sep 148.4 144.1 153.6 194.1 152.9 199.6 106.2 150.9 83.3 140.7 141.6 180.4 81.9 159.8 142.6 141.4
Dec 148.4 146.3 150.3 194.5 153.9 206.9 103.7 151.3 81.4 139.7 145.3 177.9 85.7 160.2 143.2 141.9
2011 Mar 153.8 143.8 160.4 206.4 155.8 223.1 105.4 151.7 82.8 141.5 149.4 184.0 83.1 161.4 146.1 144.8
Jun 157.6 148.0 161.7 211.7 157.7 224.9 106.1 159.0 83.5 144.2 152.9 186.2 85.0 162.3 148.8 147.6
Sep 159.5 149.6 162.7 212.0 159.1 225.3 106.8 161.3 86.8 145.4 157.0 179.9 84.8 163.2 150.3 149.2
Dec 158.4 150.9 161.9 212.5 159.9 226.3 106.7 160.6 85.5 145.8 159.0 165.0 86.3 164.4 150.4 149.2
2012 Mar 163.1 152.6 169.3 228.9 161.6 234.3 108.1 162.3 86.6 148.1 159.5 180.4 84.3 165.1 153.0 151.9
Jun 161.5 152.7 169.6 231.9 162.0 229.7 105.9 162.2 86.5 148.6 161.5 193.7 83.7 167.6 153.3 152.3
Sep 162.3 154.2 170.2 232.1 162.9 236.2 104.7 166.4 86.8 150.8 163.3 181.6 83.4 171.1 154.5 153.5
Dec 161.2 154.4 167.8 231.8 164.1 233.9 105.4 165.0 86.2 150.1 157.3 173 84.8 171.6 153.5 152.5
2013 Mar 165.0 156.1 175.0 250.9 163.6 252.4 105.1 166.3 85.7 151.3 155.7 183.2 81.2 173.2 155.2 154.3
Jun 165.9 157.0 175.5 252.0 164.2 242.9 106.3 166.7 83.8 151.6 155.4 194.0 84.1 172.9 155.6 154.8
Sep 165.1 158.5 175.7 252.0 164.5 248.7 107.1 168.3 86.4 152.7 156.8 191.6 86.2 170.8 156.4 155.6
39
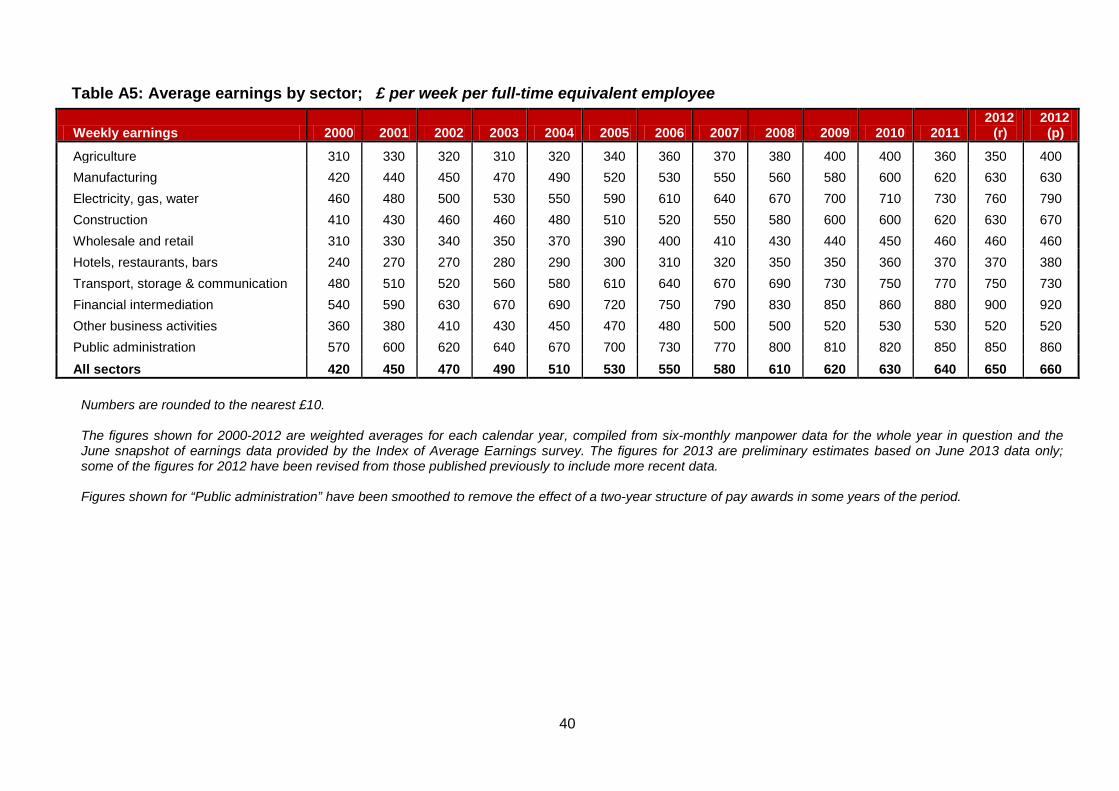
Table A5: Average earnings by sector; £ per week per full-time equivalent employee
Numbers are rounded to the nearest £10. The figures shown for 2000-2012 are weighted averages for each calendar year, compiled from six-monthly manpower data for the whole year in question and the June snapshot of earnings data provided by the Index of Average Earnings survey. The figures for 2013 are preliminary estimates based on June 2013 data only; some of the figures for 2012 have been revised from those published previously to include more recent data. Figures shown for “Public administration” have been smoothed to remove the effect of a two-year structure of pay awards in some years of the period.
Weekly earnings 2000 2001 2002 2003 2004 2005 2006 2007 2008 2009 2010 2011 2012
(r) 2012 (p)
Agriculture 310 330 320 310 320 340 360 370 380 400 400 360 350 400 Manufacturing 420 440 450 470 490 520 530 550 560 580 600 620 630 630 Electricity, gas, water 460 480 500 530 550 590 610 640 670 700 710 730 760 790 Construction 410 430 460 460 480 510 520 550 580 600 600 620 630 670 Wholesale and retail 310 330 340 350 370 390 400 410 430 440 450 460 460 460 Hotels, restaurants, bars 240 270 270 280 290 300 310 320 350 350 360 370 370 380 Transport, storage & communication 480 510 520 560 580 610 640 670 690 730 750 770 750 730 Financial intermediation 540 590 630 670 690 720 750 790 830 850 860 880 900 920 Other business activities 360 380 410 430 450 470 480 500 500 520 530 530 520 520 Public administration 570 600 620 640 670 700 730 770 800 810 820 850 850 860 All sectors 420 450 470 490 510 530 550 580 610 620 630 640 650 660
40
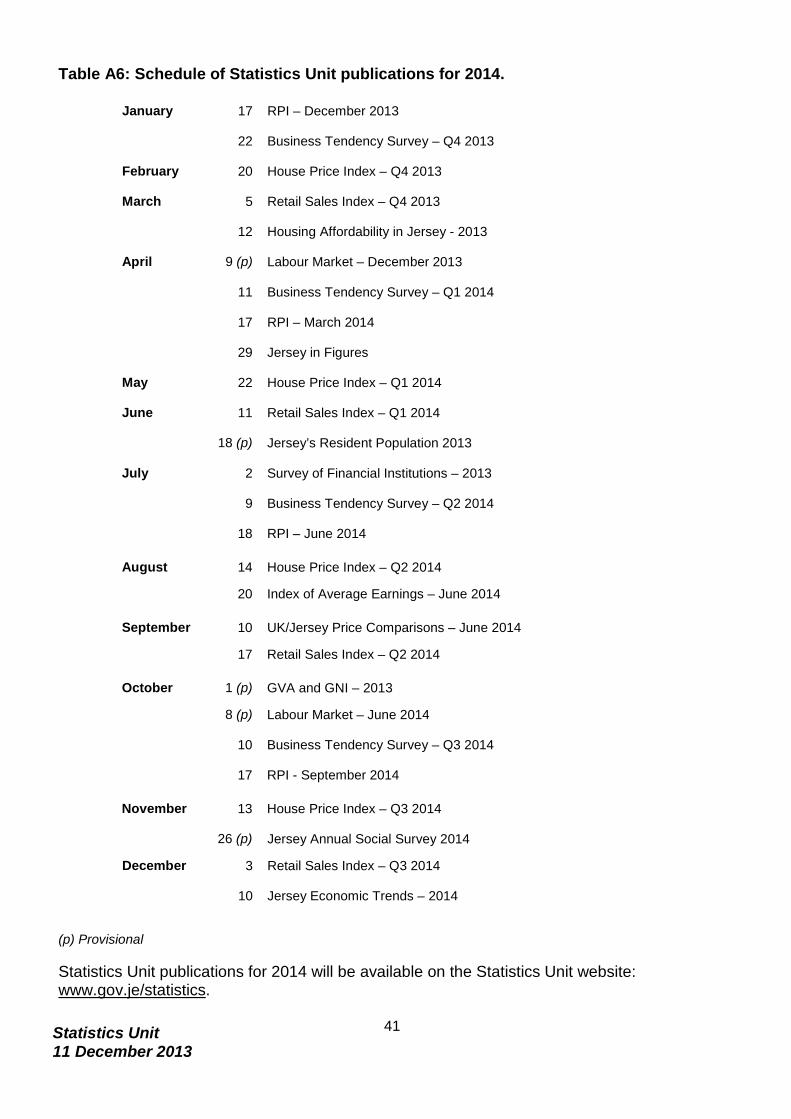
Table A6: Schedule of Statistics Unit publications for 2014.
January 17 RPI – December 2013
22 Business Tendency Survey – Q4 2013
February 20 House Price Index – Q4 2013
March 5 Retail Sales Index – Q4 2013
12 Housing Affordability in Jersey - 2013
April 9 (p) Labour Market – December 2013
11 Business Tendency Survey – Q1 2014
17 RPI – March 2014
29 Jersey in Figures
May 22 House Price Index – Q1 2014
June 11 Retail Sales Index – Q1 2014
18 (p) Jersey’s Resident Population 2013
July 2 Survey of Financial Institutions – 2013
9 Business Tendency Survey – Q2 2014
18 RPI – June 2014
August 14 House Price Index – Q2 2014
20 Index of Average Earnings – June 2014
September 10 UK/Jersey Price Comparisons – June 2014
17 Retail Sales Index – Q2 2014
October 1 (p) GVA and GNI – 2013
8 (p) Labour Market – June 2014
10 Business Tendency Survey – Q3 2014
17 RPI - September 2014
November 13 House Price Index – Q3 2014
26 (p) Jersey Annual Social Survey 2014
December 3 Retail Sales Index – Q3 2014
10 Jersey Economic Trends – 2014
(p) Provisional Statistics Unit publications for 2014 will be available on the Statistics Unit website: www.gov.je/statistics.
Statistics Unit 11 December 2013
41
![DIGEST OF EMAILS FROM HONG KONG - GOV UK...DIGEST OF EMAILS FROM HONG KONG From: [FCO OFFICIAL] Sent: 20 January 2015 08:18 To: [FCO OFFICIALS] Subject: First Minister visit to China](https://img.pdfslide.net/doc/110x75/6001c8fbe046cc2e1c5316b2/digest-of-emails-from-hong-kong-gov-uk-digest-of-emails-from-hong-kong-from.jpg)