Embed Size (px)
Citation preview
Jersey Mortality Statistics 2016
Statistics Unit
1
Table of Contents
Summary ........................................................................................................................................................................... 3
Main points ....................................................................................................................................................................... 3
Introduction ...................................................................................................................................................................... 3
Total deaths ...................................................................................................................................................................... 4
Main causes of death ........................................................................................................................................................ 6
Infant deaths ..................................................................................................................................................................... 8
Premature deaths (under 75 years of age) ....................................................................................................................... 8
Working age deaths .......................................................................................................................................................... 8
Old age deaths .................................................................................................................................................................. 9
Seasonality ........................................................................................................................................................................ 9
Place of death ................................................................................................................................................................. 10
Comparison to England and Wales and English regions ................................................................................................. 11
Background Notes ........................................................................................................................................................... 12
Data Sources ............................................................................................................................................................... 12
Comparisons ............................................................................................................................................................... 12
Timeliness ................................................................................................................................................................... 12
Methods ...................................................................................................................................................................... 12
Accuracy and reliability ............................................................................................................................................... 13
Confidence Intervals and statistical significance ........................................................................................................ 13
Data quality and completeness ................................................................................................................................... 13
Contact details ............................................................................................................................................................ 13
2
3
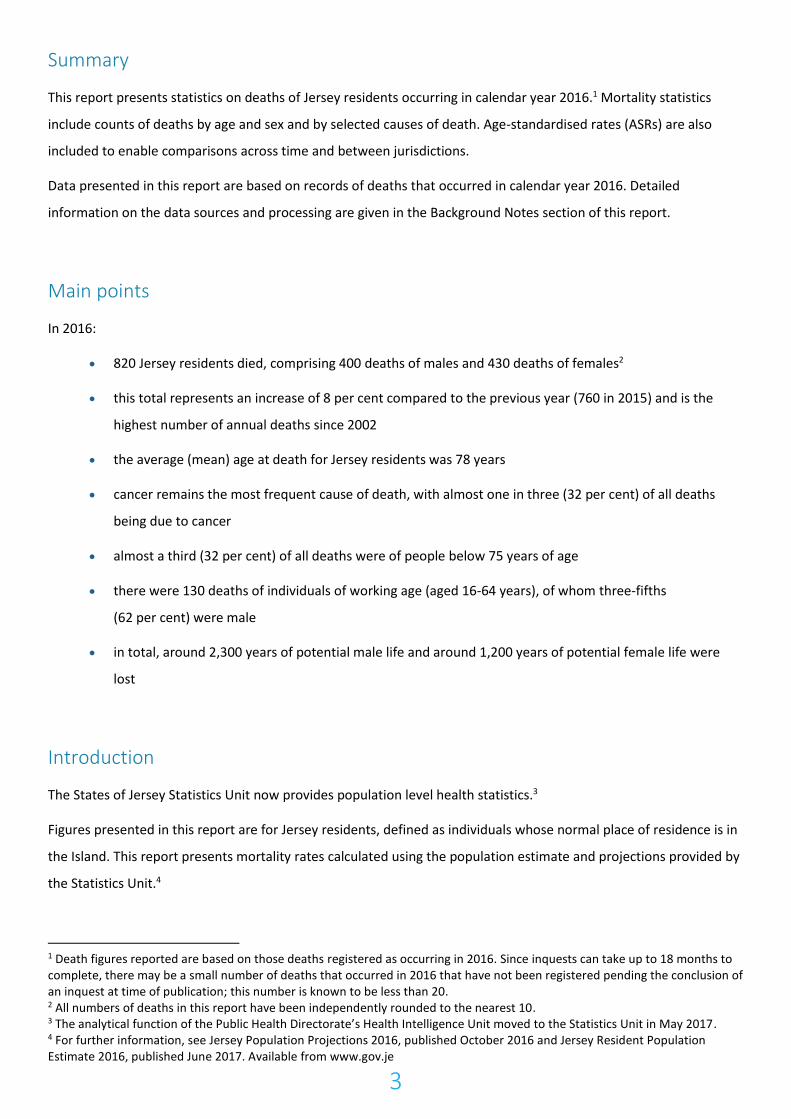
Summary
This report presents statistics on deaths of Jersey residents occurring in calendar year 2016.1 Mortality statistics
include counts of deaths by age and sex and by selected causes of death. Age-standardised rates (ASRs) are also
included to enable comparisons across time and between jurisdictions.
Data presented in this report are based on records of deaths that occurred in calendar year 2016. Detailed
information on the data sources and processing are given in the Background Notes section of this report.
Main points
In 2016:
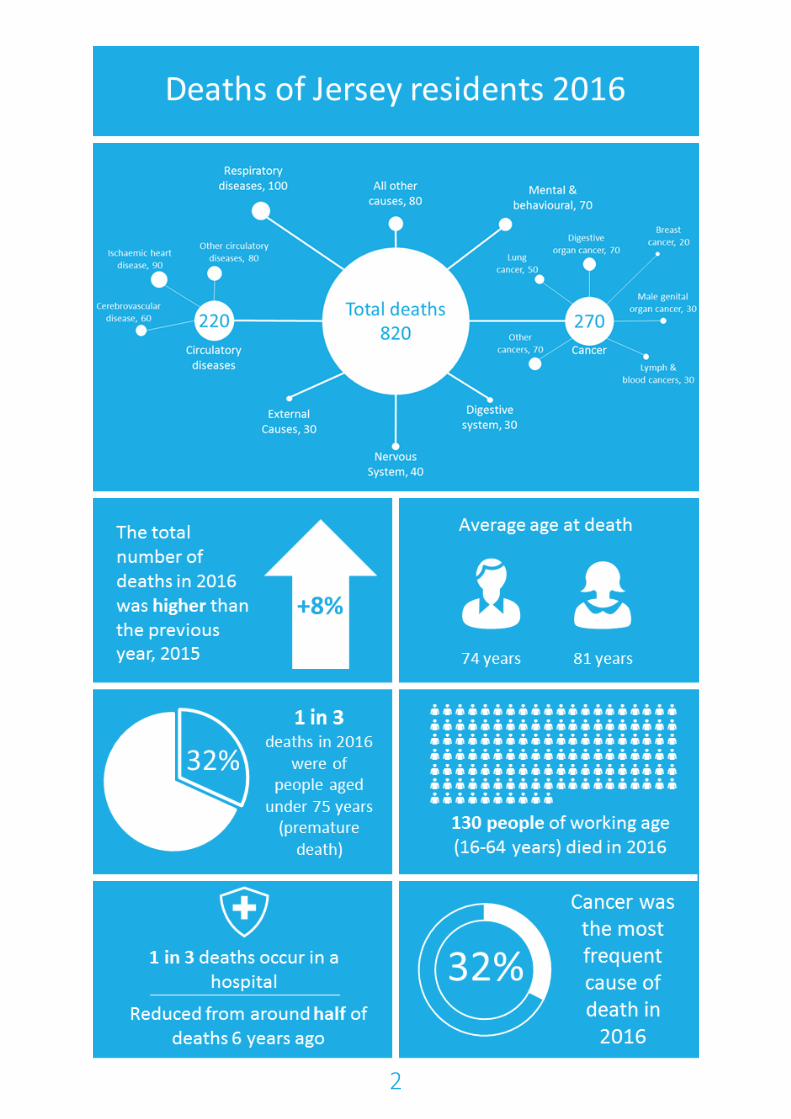
820 Jersey residents died, comprising 400 deaths of males and 430 deaths of females2
this total represents an increase of 8 per cent compared to the previous year (760 in 2015) and is the
highest number of annual deaths since 2002
the average (mean) age at death for Jersey residents was 78 years
cancer remains the most frequent cause of death, with almost one in three (32 per cent) of all deaths
being due to cancer
almost a third (32 per cent) of all deaths were of people below 75 years of age
there were 130 deaths of individuals of working age (aged 16-64 years), of whom three-fifths
(62 per cent) were male
in total, around 2,300 years of potential male life and around 1,200 years of potential female life were
lost
Introduction
The States of Jersey Statistics Unit now provides population level health statistics.3
Figures presented in this report are for Jersey residents, defined as individuals whose normal place of residence is in
the Island. This report presents mortality rates calculated using the population estimate and projections provided by
the Statistics Unit.4
1 Death figures reported are based on those deaths registered as occurring in 2016. Since inquests can take up to 18 months to complete, there may be a small number of deaths that occurred in 2016 that have not been registered pending the conclusion of an inquest at time of publication; this number is known to be less than 20. 2 All numbers of deaths in this report have been independently rounded to the nearest 10. 3 The analytical function of the Public Health Directorate’s Health Intelligence Unit moved to the Statistics Unit in May 2017. 4 For further information, see Jersey Population Projections 2016, published October 2016 and Jersey Resident Population Estimate 2016, published June 2017. Available from www.gov.je

4
Total deaths
In 2016, there were a total of 820 deaths of Jersey residents. This total represents an increase of 8 per cent
compared to the previous year (760 in 2015) and is the highest number of annual deaths since 2002 (Figure 1).
Figure 1: Annual number of deaths of Jersey residents, 2000 - 2016
Table 1 shows that a greater number of deaths of females occurred in 2016 than deaths of males. Compared to the
previous year, similar numbers of males died in 2016 as in 2015 (400) while the number of deaths of females
increased by 70, from 360 in 2015 to 430 in the latest year.
In 2016, the average (mean) age at death of males (74 years) was 7 years below that of females (81 years). The
greater difference between average age of death and life expectancy at birth for males is reflected in the higher age-
standardised mortality rate for males compared to the crude death rate, as shown in Table 1.
The age-standardised rate for males was significantly higher than that for females in 2016.
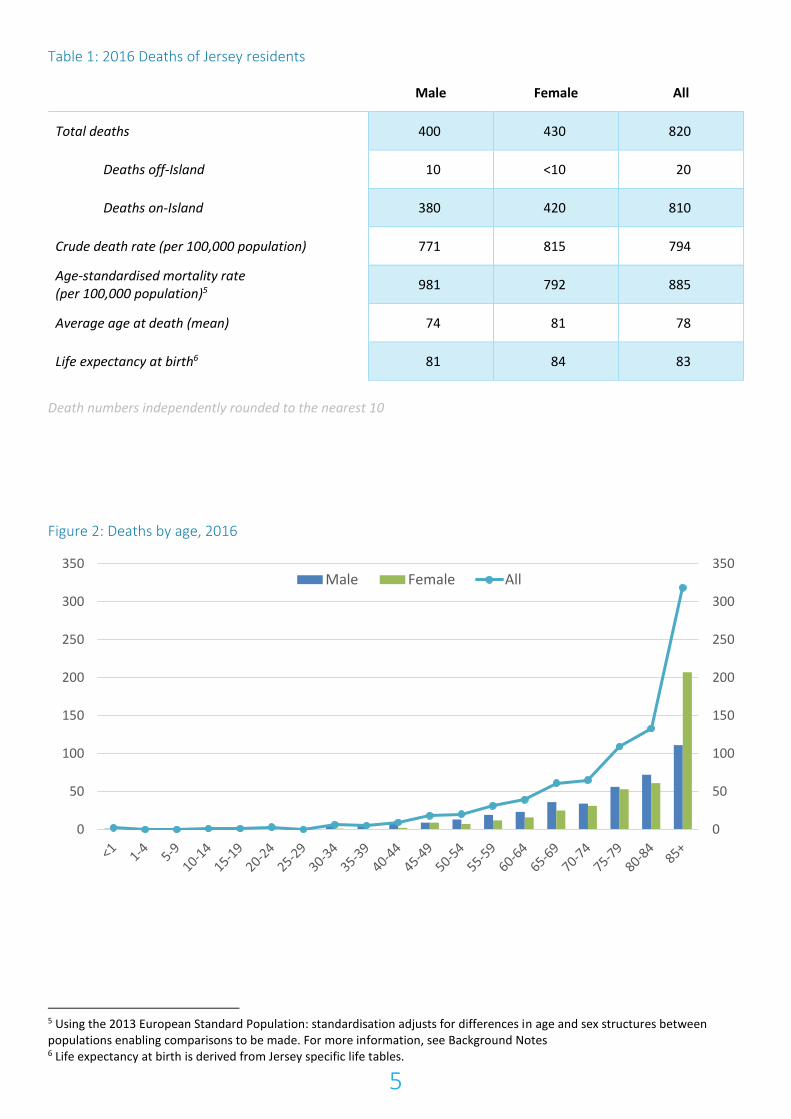
The age and gender breakdown of the 2016 deaths is presented in Figure 2. In each age group up to 85 years of age,
the number of deaths of males was greater than the number of deaths of females. In contrast, there were a greater
number of deaths of females in the over 85 age group, due to there being more females aged 85 or over (driven by
greater life expectancy).
Highest 2002: 830
Lowest 2014: 700
Latest 2016: 820
0
200
400
600
800
1,000
Nu
mb
er
of d
ea
ths
5
Table 1: 2016 Deaths of Jersey residents
Male Female All
Total deaths 400 430 820
Deaths off-Island 10 <10 20
Deaths on-Island 380 420 810
Crude death rate (per 100,000 population) 771 815 794
Age-standardised mortality rate (per 100,000 population)5 981 792 885
Average age at death (mean) 74 81 78
Life expectancy at birth6 81 84 83
Death numbers independently rounded to the nearest 10
Figure 2: Deaths by age, 2016
5 Using the 2013 European Standard Population: standardisation adjusts for differences in age and sex structures between populations enabling comparisons to be made. For more information, see Background Notes 6 Life expectancy at birth is derived from Jersey specific life tables.
0
50
100
150
200
250
300
350
0
50
100
150
200
250
300
350Male Female All
6
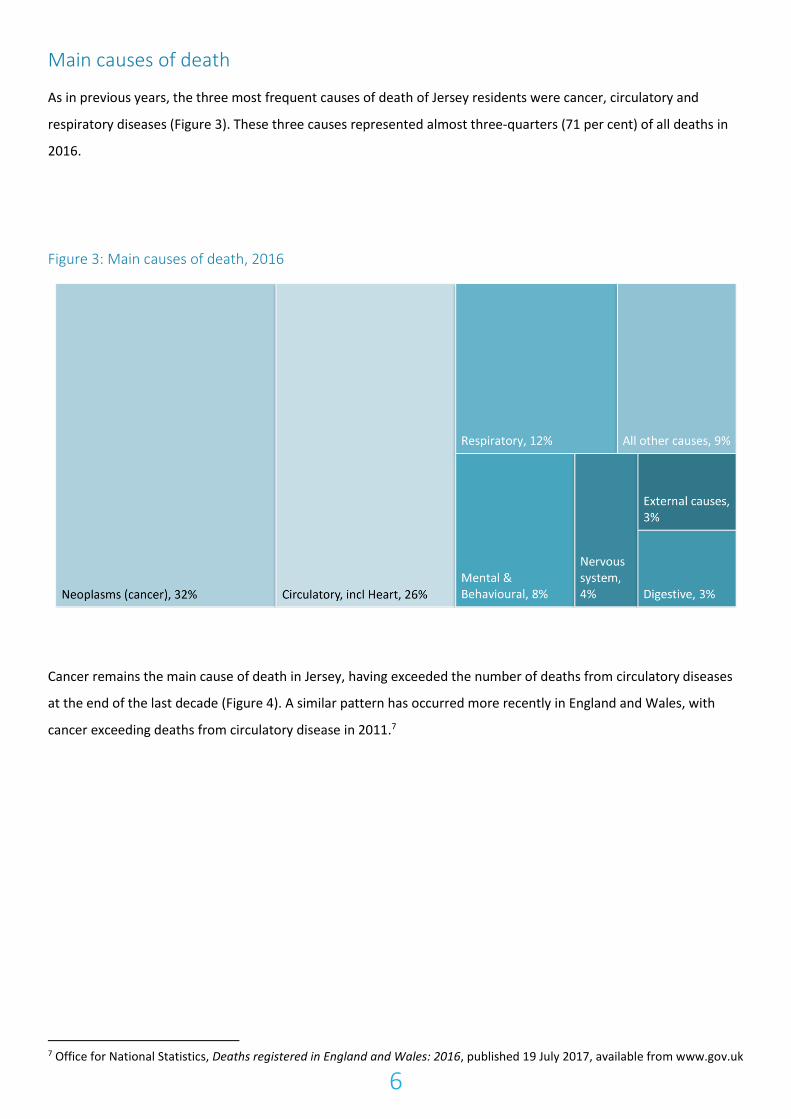
Main causes of death
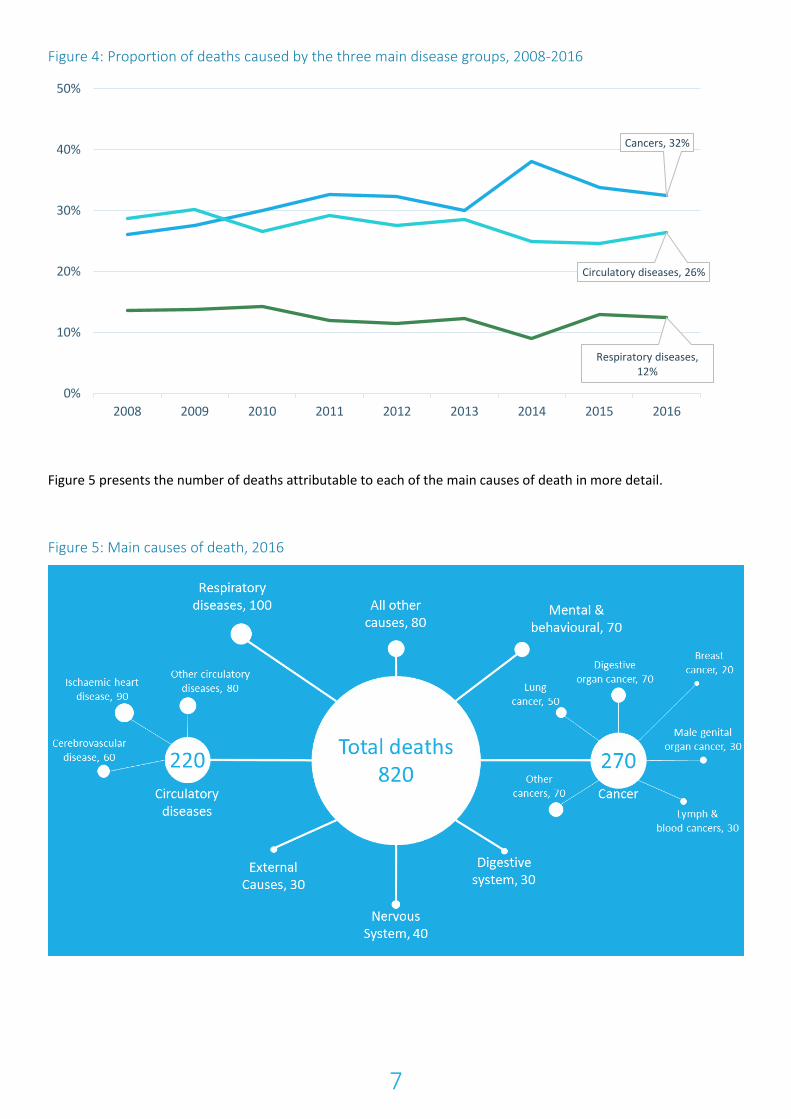
As in previous years, the three most frequent causes of death of Jersey residents were cancer, circulatory and
respiratory diseases (Figure 3). These three causes represented almost three-quarters (71 per cent) of all deaths in
2016.
Figure 3: Main causes of death, 2016
Cancer remains the main cause of death in Jersey, having exceeded the number of deaths from circulatory diseases
at the end of the last decade (Figure 4). A similar pattern has occurred more recently in England and Wales, with
cancer exceeding deaths from circulatory disease in 2011.7
7 Office for National Statistics, Deaths registered in England and Wales: 2016, published 19 July 2017, available from www.gov.uk
7
Figure 4: Proportion of deaths caused by the three main disease groups, 2008-2016
Figure 5 presents the number of deaths attributable to each of the main causes of death in more detail.
Figure 5: Main causes of death, 2016
Cancers, 32%
Circulatory diseases, 26%
Respiratory diseases, 12%
0%
10%
20%
30%
40%
50%
2008 2009 2010 2011 2012 2013 2014 2015 2016
8
Infant deaths
In 2016, there were fewer than five deaths of residents aged less than 1 year.
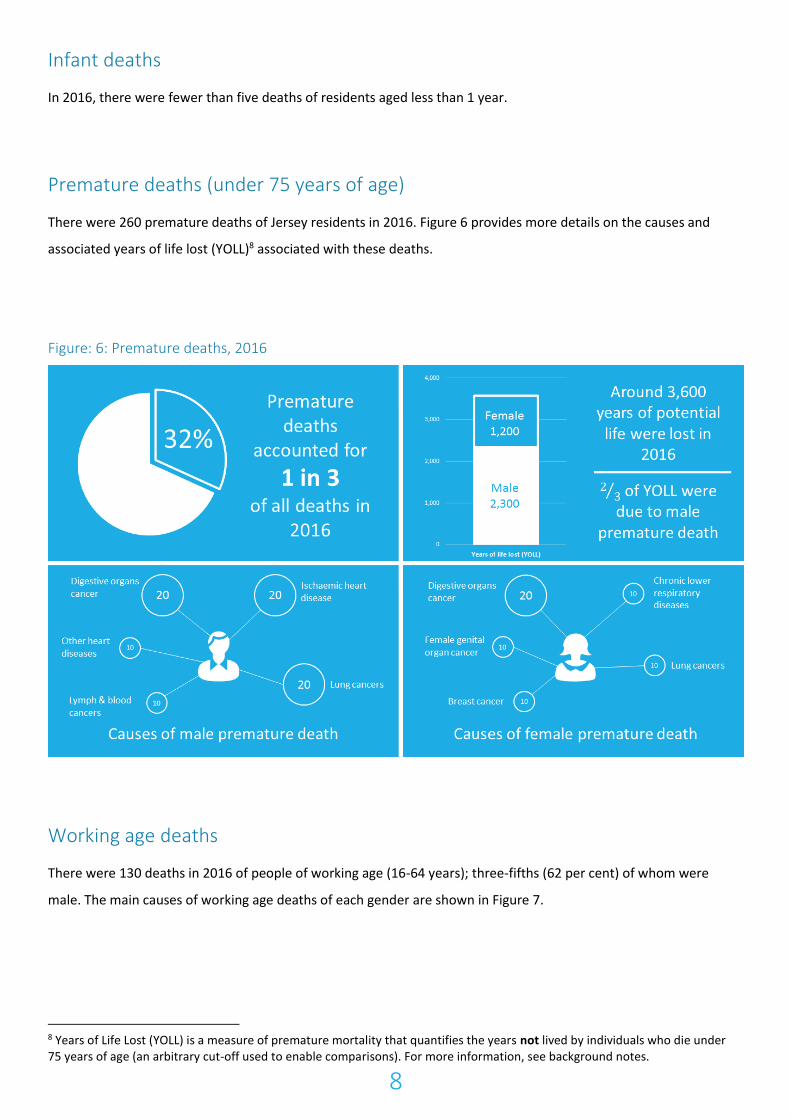
Premature deaths (under 75 years of age)
There were 260 premature deaths of Jersey residents in 2016. Figure 6 provides more details on the causes and
associated years of life lost (YOLL)8 associated with these deaths.
Figure: 6: Premature deaths, 2016
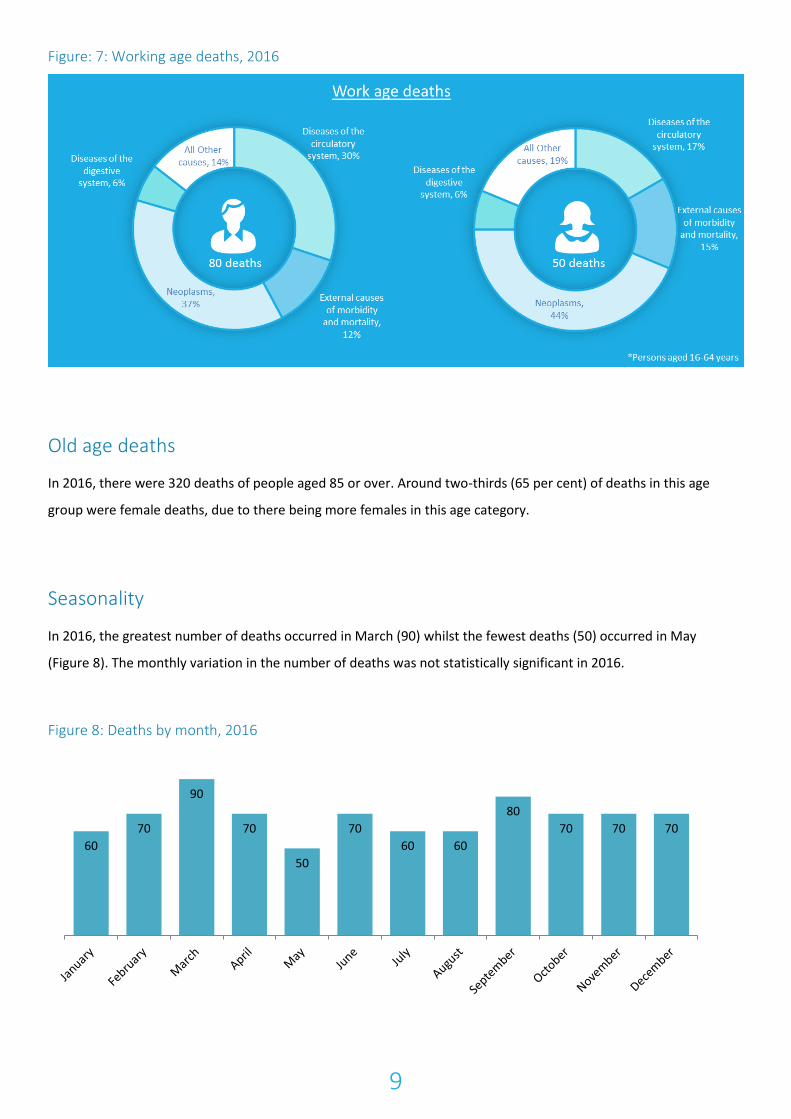
Working age deaths
There were 130 deaths in 2016 of people of working age (16-64 years); three-fifths (62 per cent) of whom were
male. The main causes of working age deaths of each gender are shown in Figure 7.
8 Years of Life Lost (YOLL) is a measure of premature mortality that quantifies the years not lived by individuals who die under 75 years of age (an arbitrary cut-off used to enable comparisons). For more information, see background notes.
9
Figure: 7: Working age deaths, 2016
Old age deaths
In 2016, there were 320 deaths of people aged 85 or over. Around two-thirds (65 per cent) of deaths in this age
group were female deaths, due to there being more females in this age category.
Seasonality
In 2016, the greatest number of deaths occurred in March (90) whilst the fewest deaths (50) occurred in May
(Figure 8). The monthly variation in the number of deaths was not statistically significant in 2016.
Figure 8: Deaths by month, 2016
60
70
90
70
50
70
60 60
80
70 70 70
10
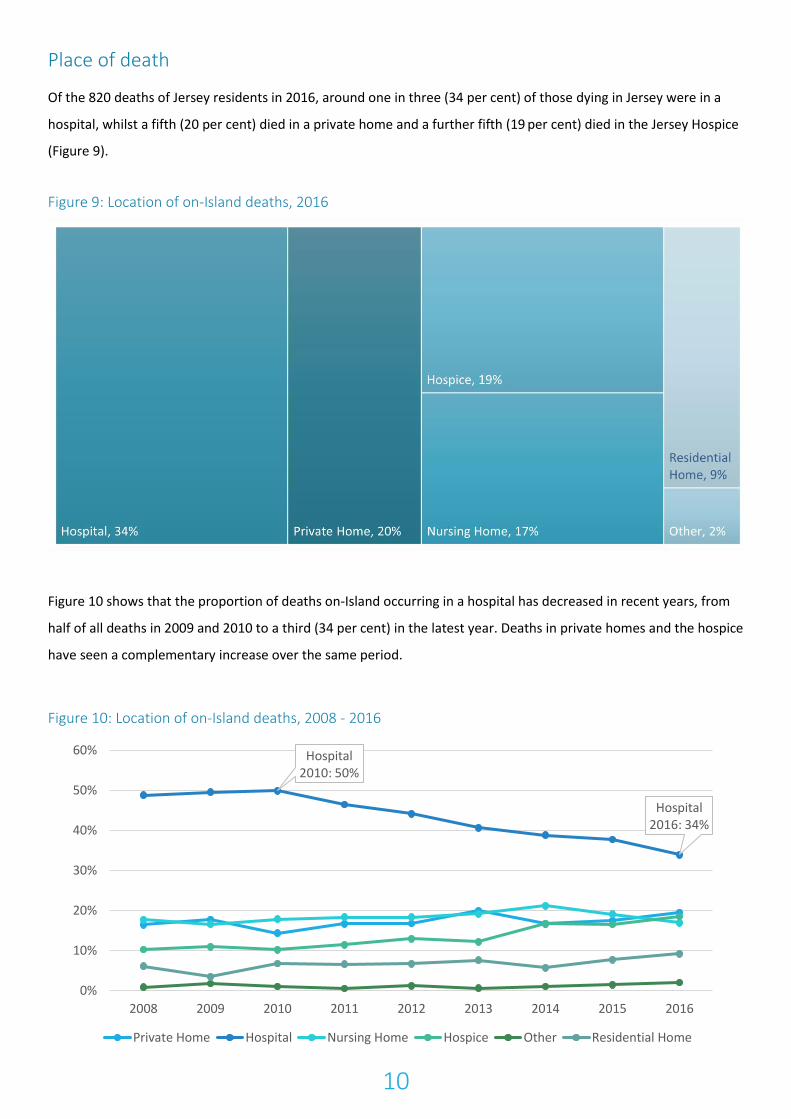
Place of death
Of the 820 deaths of Jersey residents in 2016, around one in three (34 per cent) of those dying in Jersey were in a
hospital, whilst a fifth (20 per cent) died in a private home and a further fifth (19 per cent) died in the Jersey Hospice
(Figure 9).
Figure 9: Location of on-Island deaths, 2016
Figure 10 shows that the proportion of deaths on-Island occurring in a hospital has decreased in recent years, from
half of all deaths in 2009 and 2010 to a third (34 per cent) in the latest year. Deaths in private homes and the hospice
have seen a complementary increase over the same period.
Figure 10: Location of on-Island deaths, 2008 - 2016
Hospital2010: 50%
Hospital2016: 34%
0%
10%
20%
30%
40%
50%
60%
2008 2009 2010 2011 2012 2013 2014 2015 2016
Private Home Hospital Nursing Home Hospice Other Residential Home
11
Comparison to England and Wales and English regions
The Office for National Statistics have reported a 0.9 per cent decrease in the annual numbers of deaths registered in
England and Wales in 2016 compared to 2015.9 This compares to an 8 per cent increase in the number of deaths of
Jersey residents occurring in 2016 compared to the previous year, 2015.
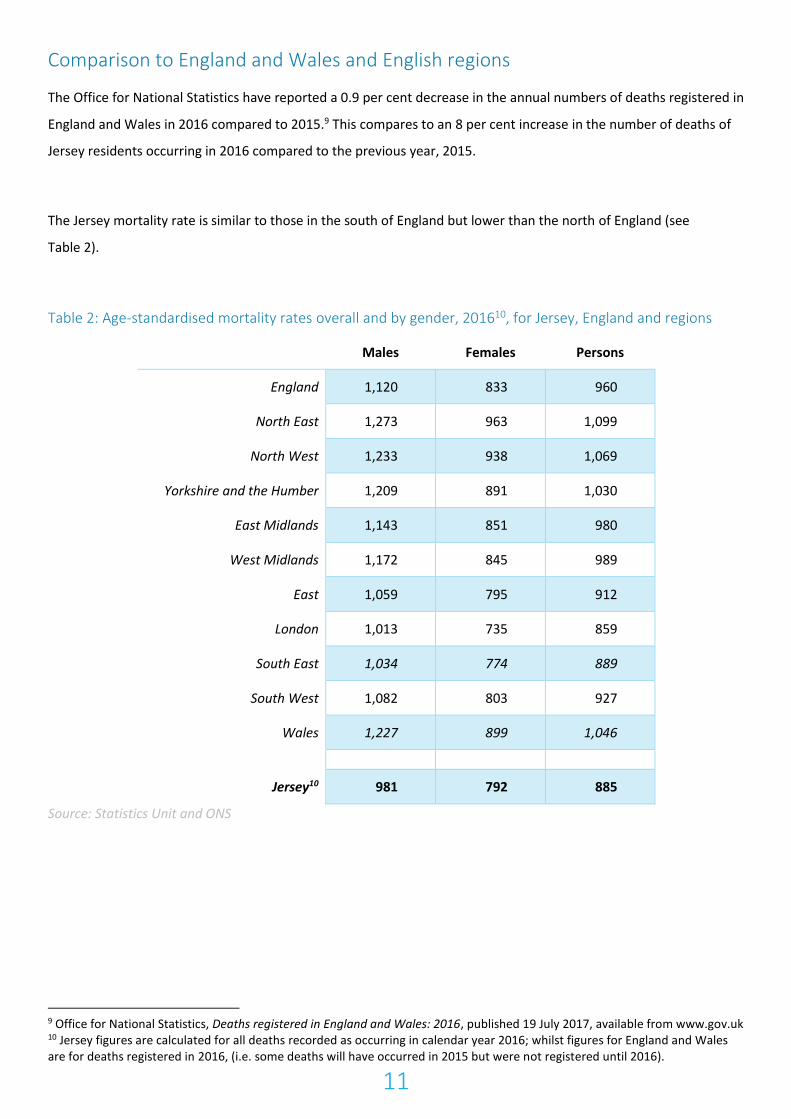
The Jersey mortality rate is similar to those in the south of England but lower than the north of England (see
Table 2).
Table 2: Age-standardised mortality rates overall and by gender, 201610, for Jersey, England and regions
Males Females Persons
England 1,120 833 960
North East 1,273 963 1,099
North West 1,233 938 1,069
Yorkshire and the Humber 1,209 891 1,030
East Midlands 1,143 851 980
West Midlands 1,172 845 989
East 1,059 795 912
London 1,013 735 859
South East 1,034 774 889
South West 1,082 803 927
Wales 1,227 899 1,046
Jersey10 981 792 885
Source: Statistics Unit and ONS
9 Office for National Statistics, Deaths registered in England and Wales: 2016, published 19 July 2017, available from www.gov.uk 10 Jersey figures are calculated for all deaths recorded as occurring in calendar year 2016; whilst figures for England and Wales are for deaths registered in 2016, (i.e. some deaths will have occurred in 2015 but were not registered until 2016).
12
Background Notes
Data Sources
The Marriage and Civil Status (Jersey) Law 2001 requires all deaths to be notified within 5 days of the date of death.
Each parish Registrar in Jersey reports these notifications and registrations to the Superintendent Registrar and
updates the population register. Data on deaths is compiled by the Statistics Unit from these sources into a database
and clerically checked against other States of Jersey administrative sources to ensure that all deaths have been
accurately detailed.
Cause of death is classified using the International Statistical Classification of Diseases, Injuries and Causes of Death
(tenth revision, ICD-10).
Coding of deaths of Jersey residents is undertaken by the Office for National Statistics on a quarterly basis.
Comparisons
Comparisons to other jurisdictions are presented in this report to enable benchmarking and to explore where similar
trends are being seen elsewhere. Data are extracted from published reports from the Office for National Statistics.
All data are referenced and the time periods are noted in the report sections.
Timeliness
The results are based on analysis of all deaths of Jersey residents registered as having occurred in calendar year
2016. The Statistics Unit extracts data in August of the following year in order to enable comparisons to the Office
for National Statistics report on deaths registered in England and Wales, which is published in July each year.
Methods
Age-standardised rates have been calculated using the number of deaths occurring each year as the numerator and
the mid-year population estimate for that year as the denominator. The rates have been standardised using the
2013 European Standard Population. The directly age-standardised rates adjust for differences in age and sex
structures between populations to allow comparisons across time and place.
Annual mortality rates for Jersey are calculated using the average of the two corresponding end-year population
estimates as published by the States of Jersey Statistics Unit. The resulting estimate of the mid-year population
assumes that half of births, deaths and migration occurs in the first half of the calendar year.
Potential years of life lost (YOLL) estimates the number of years a person would have lived had they not died
prematurely. It is based on the assumption that every individual could expect to live until the age of 75 and
premature death before that age may be preventable.
13
Accuracy and reliability
The data covers all deaths of residents living in Jersey on- and off-Island. A small number of inquests may still be
outstanding for deaths occurring in calendar year 2016; therefore, numbers here should be treated as provisional.
All death numbers have been independently rounded to the nearest 10, to reflect the provisional nature of these
statistics at time of publication.
When the observed total number of deaths is fewer than 25, mortality rates are not calculated, as there are too few
deaths to calculate directly standardised rates reliably.
Confidence Intervals and statistical significance
Confidence intervals have been used in this report to compare Jersey mortality rates with those of England, Wales
and the English regions. Confidence intervals are a measure of the statistical precision of an estimate and show the
range of uncertainty around the estimated figure. Calculations based on small numbers of events are often subject
to random fluctuations. The confidence interval indicates the range within which the true value for the population as
a whole can be expected to lie, taking natural random variation into account.
Comparisons between rates or over time have been statistically tested to determine whether differences are likely
to be statistically significant or the result of natural random variation. For instance, a chi-square test was used to
determine whether the pattern of deaths occurring each month was statistically significant or not. Only those
differences deemed as statistically significant have been described in this report using terms such as ‘increase’,
‘decrease’, ‘higher’ or ‘lower’.
Data quality and completeness
The number of deaths may differ from previously published figures due to the inclusion of data from inquests which
can take up to 18 months to complete and register. Data on deaths of Jersey residents that occur outside of the
Island may also result in a delay in registering the death with the Superintendent Registrar. This means that total
deaths in a given year should be treated as provisional and used with caution.
Contact details
All enquiries and feedback should be directed to:
Statistics Unit
Chief Minister’s Department
Cyril Le Marquand House
St Helier
JE4 8QT


![Presentation - Statistics Jersey [Read-Only] and... · Microsoft PowerPoint - Presentation - Statistics Jersey [Read-Only] Author: EdwardsM Created Date: 4/29/2019 3:08:01 PM](https://img.pdfslide.net/doc/110x75/5fb0027b6eef3b20c63ac8bb/presentation-statistics-jersey-read-only-and-microsoft-powerpoint-presentation.jpg)