Embed Size (px)
Citation preview

University of Nevada, Reno
A Study of the Adanac Porphyry Molybdenum Deposit and Surrounding Placer Gold Mineralization in Northwest British Columbia With a Comparison to
Porphyry Molybdenum Deposits in the North American Cordillera and Igneous Geochemistry of the Western United States
A thesis submitted in partial fulfillment of the
requirements for the degree of Master of Science in
Geology
by
Jessica Leigh Smith
Dr. Greg B. Arehart/Thesis Advisor
December, 2009

UMI Number: 1478532
All rights reserved
INFORMATION TO ALL USERS The quality of this reproduction is dependent upon the quality of the copy submitted.
In the unlikely event that the author did not send a complete manuscript and there are missing pages, these will be noted. Also, if material had to be removed,
a note will indicate the deletion.
UMT Dissertation Publishing
UMI 1478532 Copyright 2010 by ProQuest LLC.
All rights reserved. This edition of the work is protected against unauthorized copying under Title 17, United States Code.
ProQuest LLC 789 East Eisenhower Parkway
P.O. Box 1346 Ann Arbor, Ml 48106-1346

THE GRADUATE SCHOOL University of Nevada, Reno
We recommend that the thesis prepared under our supervision by
JESSICA LEIGH SMITH
entitled
A Study Of The Adanac Porphyry Molybdenum Deposit And Surrounding Placer Gold Mineralization In Northwest British Columbia With A Comparison To
Porphyry Molybdenum Deposits In The North American Cordillera And Igneous Geochemistry Of The Western United States
be accepted in partial fulfillment of the requirements for the degree of
MASTER OF SCIENCE
Greg B. Arehart, Ph.D., Advisor
John Mccormack, Ph.D., Committee Member
Danny Taylor, Ph.D., Graduate School Representative
Marsha H. Read, Ph. D., Associate Dean, Graduate School
December, 2009

I
Abstract
The Adanac molybdenum deposit has been studied in detail in this thesis in order
to classify the deposit as Climax-type or Endako-type. Placer gold from a nearby Creek
that drains the Adanac deposit was sampled in order to compare initial Os signatures with
that of magnetite from the porphyry deposit, so that it may be determined whether some
of the placer gold is from eroded margins of the porphyry molybdenum deposit.
Characteristics of porphyry molybdenum deposits throughout the North American
Cordillera were summarized and tabulated. Finally, some of the geochemical
characteristics of porphyry molybdenum deposits were used to query igneous rock
databases for the Western United States to identify areas that may be host to more
molybdenum deposits.
The Adanac deposit is hosted in multiple intrusions of alkalic magma with high
silica and K and moderately high Rb/Sr ratios. The Westra and Keith classification of
1981 using the K2O value at 57.5 wt% SiC«2 is 5, meaning the Adanac deposit is classified
as the alkalic, high F, Climax-type molybdenum deposit. The trace element and
alteration patterns conform to this classification as well. Adanac has a high-Mo zone as
disseminated large to medium sized molybdenite rosettes in a smoky quartz vein
stockwork that straddles and blankets at least 2 intrusions. There is a zone of high W
(huebnerite) that is smaller than the molybdenite zone and coincides with it. A high F
zone exists above and peripheral to the Mo and W. Small amounts of Pb and Zn (galena
and sphalerite) occur primarily in faults. No other base metals or trace elements exist in
appreciable amounts in the deposit. Alteration consists of a high silica core and potassic

II
alteration as feldspar floods and potassic envelopes around veins that coincide with
mineralization. QSP alteration and stilbite-calcite alteration is weak and occurs in veins
or fractures that extend outward from Mo mineralization. A weak propylitic overprint
(chlorite, kaolinite) occurs with mineralization but grows stronger outward from
mineralization. Illite and kaolinite occur in the core of the deposit. Montmorillonite
occurs in faults.
Re-Os dating of molybdenite confirmed at least two episodes of mineralization at
70.87 ± 0.36 Ma and 69.66 ± 0.35 Ma, and also confirmed very low Re concentrations (5-
39 ppm) in the molybdenite, which is typical of Climax-type molybdenites. X-ray
diffraction of the molybdenite confirms it is the 2H polytype, which is also typical of
Climax-type molybdenites and may be linked to the low Re concentrations. U-Pb dating
of zircons confines the magmatism at Adanac from 81.6 ± 1.1 Ma to 69 ± 1.2 Ma, giving
the Mount Leonard stock a lifespan of 13.9 Ma. No appropriate age match was found for
an intrusion and mineralization episode using a weighted mean of 30 zircon analyses for
each lithology, which is the standard for reporting U-Pb zircon ages. There are too many
inherited zircons in Adanac lithologies for a mean age to be reliable, and statistical
methods for determining lead loss discredit ages that are most likely valid. It is likely
true that most, if not all, of the lithologies that were dated at Adanac were still
undergoing some crystallization just before (1 Ma) or during mineralization.
The isotopic comparison of the gold sample from Ruby Creek and magnetite from
Adanac does not provide a link between the deposits. The gold has a primitive initial Os
signature (0.1249) that clearly points to an origin associated with mantle rocks such as

Ill
peridotites. The magnetite sample has an initial Os of 1.237 that has been enriched from
terrestrial Os reservoirs. If any placer gold from the Atlin camp is intrusion related it was
not identified in this study, but the possibility that some of the gold is intrusion-related
still exists.
For exploration purposes, the North American Volcanic and Intrusive Database
(NAVDAT) was queried for rock types with high silica (>70 wt%) and high Rb/Sr (>1)
and locations of suitable intrusive lithologies for porphyry molybdenum deposits were
plotted on a map of the western United States, and compared with locations of known
porphyry molybdenum deposits. The resulting areas highlighted numerous potential
porphyry molybdenum camps. Some of these areas could be extensions of known camps,
such as those in Colorado or in Idaho. Other areas, such as in southern Arizona, have no
known porphyry molybdenum deposits but descriptive characteristics of rock types
clearly enumerate potential for new discoveries.

IV
Acknowledgements
The author wishes to thank John Chesley of the University of Arizona at Tucson for his
expertise and guidance concerning the Re-Os study of molybdenite and the Os
comparison of magnetite and gold. Fernando Barra of the University of Arizona at
Tucson also provided guidance in this area and contributed the figure comparing the Os
concentration of gold compared with that of other gold deposits in the world. Much
appreciation is felt for the financial support provided by Geoscience BC of Canada.
Above all, the author wishes to thank both Adanac Molybdenum Corporation for access
to their deposit and data and financial support for this thesis, and Robert Pinsent, Adanac
Molybdenum Corporation's head consulting geologist, for sharing his years of acquired
wisdom and knowledge of the Adanac deposit.

V
Table of Contents
Introduction 1
Geochemistry of Host Rocks 15
Trace Element Zoning 36
Hydrothermal Alteration 65
Molybdenite Polytype Study 84
Geochronology 88
The Relationship of Placer Gold on Ruby Creek with Adanac 108
Characteristics of Porphyry Molybdenum Deposits in The North American Cordillera And Some
Possible Areas That May Be Host To More 115
Conclusions 134
Appendix of Figures and Tables 137
References 178

vi
List of Figures
Figure 1: Plot ofFe content vs. oxidation state 3
Figure 2: Location map for the Adanac molybdenum deposit 7
Figure 3: Regional geologic map of 104N/11W, 12E (Atlin area) 8
Figure 4: Boulder Creek and Ruby Creek area map showing main mineral occurrences 9
Figure 5: Surface geology of the Adanac molybdenum deposit 10
Figure 6: Large molybdenite rosettes in a smoky, ribbon textured quartz vein 12
Figure 7: Molybdenite rosettes on the plane of a quartz vein 12
Figure 8: Relative rock ages based on observed cross cutting relationships 15
Figure 9: CGQM in core sample 17
Figure 10: A typical twinned and perthitic feldspar phenocryst in CGQM, in photomicrograph 17
Figure 11: CGQM-T in core sample 19
Figure 12: CQFP in core sample 19
Figure 13: SQFP grading to CQFP in core sample 19
Figure 14: Graphic intergrowth of quartz and feldspar in photomicrograph 20
Figure 15: MQMP in core sample .....21
Figure 16: SQMP in core sample 22
Figure 17: CQMP in core sample 23
Figure 18: Selective clay alteration on feldspars (photomicrograph) 23
Figure 19: Selective clay alteration of plagioclase (photomicrograph) 24
Figure 20: MEQM in core sample 25
Figure 21: MFP in core sample 26

vii
Figure 22: Finely crystalline quartz and biotite in the matrix of MFP (photomicrograph) 26
Figure 23: Small plagioclase crystal inside a larger alkali feldspar phenocryst (photomicrograph) 27
Figure 24: FGQM in core sample 28
Figure 25:1UGS classification scheme of igneous intrusive rocks showing all Adanac lithologies 29
Figure 26: Alkali lime index for lithologies at Adanac 30
Figure 27: K20 value at 57.5 wt% Si02vs. Rb and Sr for Adanac and other porphyry deposits 34
Figure 28: Example diagram of natural statistical breaks used to calculate geochemical breaks 37
Figure 29: Surface geologic map of Adanac showing the location of cross-sections 38
Figure 30: Geology of cross section A-A' 41
Figure 31: Geology of cross section B-B' 42
Figure 32: Geology of cross section C-C' 43
Figure 33: Geology of cross section D-D' 44
Figure 34: Molybdenum contours overlaid on the geology of cross section A-A' 47
Figure 35: Molybdenum contours overlaid on the geology of cross section B-B' 48
Figure 36: Molybdenum contours overlaid on the geology of cross section C-C 49
Figure 37: Molybdenum contours overlaid on the geology of cross section D-D' 50
Figure 38: Tungsten contours for cross section A-A' 52
Figure 39: Tungsten contours for cross section B-B' 53
Figure 40: Tungsten contours for cross section C-C 54
Figure 41: Tungsten contours for cross section D-D' 55
Figure 42: Fluorine contours for cross section A-A' 59
Figure 43: Fluorine contours for cross section B-B' 60

viii
Figure 44: Fluorine contours for cross section C-C 61
Figure 45: Fluorine contours for cross section D-D' 62
Figure 46: Alteration zoning for an ore body at Climax 66
Figure 47: Silicification in drill core 69
Figure 48: Silicification of biotite in thin section 69
Figure 49: Photomicrograph of opaque minerals in a silicified zone 70
Figure 50: Hydrothermal alteration on cross section A-A' 71
Figure 51: Hydrothermal alteration zones on cross section C-C 72
Figure 52: Hydrothermal alteration zones in cross section D-D' 73
Figure 53: Feldspar flooding in drill core 75
Figure 54: A typical feldspar envelope around a quartz vein (drill core) 75
Figure 55: Primary and secondary feldspar in photomicrograph 76
Figure 56: Secondary biotite in photomicrograph 77
Figure 57: QSP fracture fill (drill core) 78
Figure 58: Appearance common of clay alteration in core 79
Figure 59: Stilbite-calcite alteration (drill core) 80
Figure 60: Stilbite-calcite alteration (photomicrograph) 81
Figure 61: Clay replacement in faults (photomicrograph) 82
Figure 62: Schematic diagram of paragenetic relationships of molybdenite samples 91
Figure 63: Results of U-Pb age dating using the weighted mean 101
Figure 64: Hypothetical diagram of magnetite from Adanac and gold from Ruby Creek that are related. 111
Figure 65: Os and Re concentrations of some gold deposits compared with gold from Ruby Creek 113

ix
Figure 66: Porphyry Deposits of the North American Cordillera 117
Figure 67: Intrusive rocks of the North American Cordillera with Rb/Sr > 1 and silica > 70wt% 127
List of Tables
Table 1: Proposed new names for Adanac lithologies 35
Table 2: Results of molybdenite X-ray diffraction polytype study 87
Table 3: Molybdenite Re-Os samples, and predicted paragenesis 90
Table 4: Re-Os molybdenite mineralization age dates 93
Table 5: K-Ar Ages (Ma) for lithologies as determined by Christopher and Pinsent 96
Table 6: Lowest reported age of all zircons from each lithology 104
Table 7: Average U concentration (ppm) for zircons from each lithology 106
Table 8: Results of the gold and magnetite analyses 112
Table 9: Characteristics of porphyry molybdenum deposits throughout the NA Cordillera 118-123

1
Chapter 1
Introduction
At the beginning of this thesis in 2006, there was a surge of research into and
exploration for molybdenum deposits in Canada and elsewhere because the price of
molybdenum (and other metals) revived from the slump experienced in the 1980s. There
was also renewed economic interest in increasing production (Kitsault) or resuming
production in historic mines (i.e., the proposed reopening of Climax and Endako).
Industrialization in developing nations like China was driving the need for metals like
molybdenum. Because of the current economic downturn it appears that this demand has
ebbed for a while, but because industrialization is still ongoing in other parts of the world
the current decline in demand for metals may reverse itself in the near future. Currently,
there are numerous poorly understood, relatively under-explored molybdenum deposits
and occurrences in the North American Cordillera that may be explored over the next
several years. It would be of great benefit to the exploration community if more was
known about certain high and low-fluorine type molybdenum deposits in British
Columbia and the United States.
In addition, there are geochemical similarities (e.g., redox state of the associated
pluton; trace and major element chemistry of associated plutons; mineral and elemental
assemblages such as high Bi, Te, W and low and peripheral Cu, Pb, Zn) between
porphyry molybdenum deposits and "intrusion-hosted" gold deposits (e.g., Tombstone
Belt) (Stephens et al., 2004) (Fig. 1) suggesting a possible genetic link. The Adanac
molybdenum deposit belongs to an important class of occurrences that lie within the

2
Atlin gold camp. The Adanac deposit contains no gold itself, but placer gold is still being
mined on the lower reaches of Ruby Creek below the deposit. Historically, it has always
been assumed that the molybdenum deposit post-dates gold mineralization, which occurs
in quartz-carbonate-bearing shears in Paleozoic Cache Creek Group volcanic strata and
as placers. However, a study by Mihalynuk et al. (1992) suggests that this may not be the
case. Mihalynuk's work on Feather Creek suggests that at least some of the placer gold
in the Atlin area may have been derived from the Cretaceous Surprise Lake Batholith
because some of the gold nuggets are associated with thorite and cassiterite. This is
consistent with the presence of gold- and tungsten-bearing quartz veins in the Boulder
Creek drainage immediately to the south of the Adanac Molybdenum deposit, because
wolframite is commonly associated with porphyry molybdenum deposits, peripheral to
the molybdenite zone (Wallace et al., 1968). Thus the presence of gold in those
wolframite veins raises the question of a potential linkage between gold-depleted
molybdenum and gold-bearing tungsten "intrusion related" deposits. Understanding the
association (or lack thereof) is an important step toward focusing further exploration in
the North American Cordillera for both of these deposit types.

10
in ro E CD
E Vfc -
O
E 5
a c 8
oxidized. ' •,"***». chalcop.hile NA,<?> ( 1 Au association
reduced, lithophile
Au association
^ V /
XL
C
<3
Sn
Continental arc-rift °-30 -20 -10 relatively reduced log fo 2 relatively oxidized
Figure 1. Plot of Fe content vs. oxidation state for plutons and associated "porphyry" mineral deposits. Note that Au is found in both oxidized (porphyry Cu) and reduced (porphyry Sn-W-Mo) environments. The Surprise Lake pluton plots approximately at the solid triangle. Fields from Thompson et al., 1999.
History of the Adanac Porphyry Molybdenum Deposit and Atlin Gold Camp
Placer gold mining in the area dates back to 1898, and by the turn of the century,
mining camps centered on this activity flourished in the surrounding areas of the Adanac
deposit (See Figure 2). The three most productive creeks were Spruce, Boulder, and Pine
Creek (Ballantyne and Littlejohn, 1982), which are still being actively mined. Some
placers were protected from Quaternary glacial stripping by being buried under older
Quaternary basalts, and so some pay gravels were reached by underground tunneling,
especially on Ruby Creek (also currently being mined for gold). Boulder Creek, which
drains the western side of the Adanac deposit, also produced minor amounts of tungsten
and tin from placer deposits.

4
Searches for lode gold in the area led to the discovery of quartz veins, usually
located at the contacts between ultramafic and volcanic rocks, and these veins contained
carbonate, pyrite, sphalerite, galena, chalcopyrite, and native gold in the form of electrum
and argentiferous gold (Bloodgood, 1988).
The Adanac molybdenum deposit was discovered in 1905 but serious drilling and
exploration did not begin until the 1960s. In 1967-1970, Adanac Mining and Exploration
Limited staked the valley at the head of Ruby Creek and completed 13,000 meters of core
drilling. From 1970-1971, Kerr Addison Mines Limited acquired interest in the property
and completed some drilling and underground exploration. During the period from 1971-
1978, Adanac Mining and Exploration Limited, Noranda Exploration Company Limited,
and Climax Molybdenum Company all further explored the deposit, delineating most of
the major rock units, cross-cutting relationships, and mineralization types. In 1978,
Placer Development Limited optioned the Adanac property and submitted stage 1 and 2
feasibility reports to the Ministry of Energy, Mines, and Petroleum Resources in Canada.
This resulted in defining open pit mineable reserves of 152 million tonnes at 0.063% Mo
at a cut-off of 0.04% Mo. Molybdenum prices plummeted shortly thereafter and the
claims were allowed to lapse after 1980. Adanac Molybdenum Corporation staked
claims at the property in 2000. In 2004, Adanac completed 9,022 m of drilling and in
2005 they completed 4,984 m of drilling. In April of 2005 the property was in National
Instrument 43-101 compliance. In 2006, Adanac completed 2,668 m of drilling in the
proposed main pit area, as well as 1,333 m of drilling in a newly-discovered zone of
mineralization on the southwest end of the property. This newly-discovered zone,
together with the main proposed pit area, resulted in a total resource in 2007 of 218

5
million tonnes at 0.063% Mo. To date, the Adanac property has a total of 49,786 m
(163,300 ft) of drilling in 283 holes completed since exploration commenced in 1969.
Construction of the processing plant and infrastructure also commenced in 2007. In
2008, the company received mining permits, but at the time of this writing is still waiting
for approval of environmental permits. Production was slated to begin in 2010, and
Adanac would have been the world's first large-scale open pit primary molybdenum mine
in 25 years. Due to the current economic slump, the immediate future of the deposit is
uncertain.
Geological Background:
Regional Geology
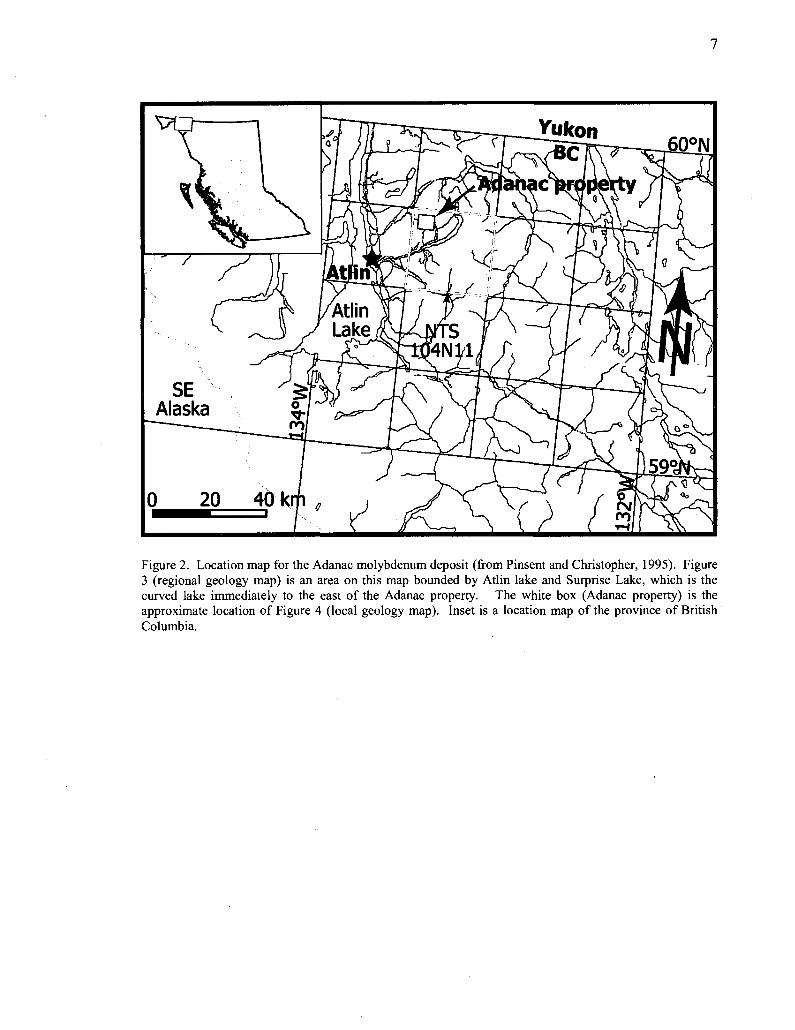
The Adanac molybdenum deposit is located in the northwestern corner of British
Columbia, near the town of Atlin (Fig. 2). The geology of the Atlin area was mapped by
Aitken (1959), and the regional setting of the deposit is discussed by Christopher and
Pinsent (1982). The Atlin area (Fig. 3) is underlain by deformed and weakly
metamorphosed ophiolitic rocks of the Pennsylvanian and/or Permian-aged Cache Creek
Group (Monger, 1975). These rocks, which include chert, clastic sediments, marble and
limestone, mafic volcanic rocks, peridotite, serpentinites, dunite, and gabbro, have long
been thought to be the source of much of the placer gold found in the Atlin area
(Mihalynuk et al, 1992). The Cache Creek group rocks in the area are typically
metamorphosed to sub-greenschist grade (Kikauka, 2002). In the Atlin area, the
sedimentary and volcanic rocks are cut by two younger batholiths. North of Pine Creek,
they are cut by a Jurassic granodiorite to diorite intrusion (Fourth of July batholith), and
north and south of Surprise Lake they are cut by a Late Cretaceous granitic intrusion

6
(Surprise Lake batholith and Mount Leonard stock). The Surprise Lake batholith is a
highly differentiated, fluorine-rich (0.27% F), uranium-rich (14.6 ppm), peraluminous
granite (Ballantyne and Littlejohn, 1982). The batholith is a known host of quartz vein
stockworks (especially associated with the multi-phased Mount Leonard stock) and skarn
alteration that hosts base and precious metal mineralization including W, Sn, Mo, Cu, Co,
Pb, Zn, U, F, Ag, and Au that occur as both sulfides and oxides (Ballantyne and
Littlejohn, 1982). One skarn, the Silver Diamond, is associated with a marginal quartz-
rich phase of the batholith and is hosted in Paleozoic marble and chert, greenstone, and
ultramafic rocks (Figure 4). The mineralization is largely pyrrhotite and sphalerite with
minor pyrite, chalcopyrite, scheelite, galena, cassiterite, and tetrahedrite. Another
important deposit related to the batholith and occurring within 3 miles of the Adanac
deposit is the Black Diamond tungsten vein (Figure 4). The Black Diamond is a N60°E-
trending and 60°NW-dipping quartz vein containing pyrite, scheelite, wolframite, and
minor chalcopyrite, arsenopyrite, and molybdenite, and anomalous tellurium (Kikauka,
2002). This vein lies mostly within coarse granite of the Mount Leonard Stock, except
for the eastern portion which is in Paleozoic marble. Elevated gold values along with Pb,
As, and Sb anomalies also occur in this eastern portion. A soil sample survey in this area
showed anomalous Cu, Pb, Ag, Sb, Bi, and Au (Kikauka, 2002).
Structures in the area consist of a series of ENE faults, such as the Adera, and
another series of north-trending fault systems such as the Boulder Creek fault (Figure 3).
There have also been periods of intense brittle deformation resulting in crack-seal
textures in plutonic rocks and zones of brecciation. Most of the fault systems are normal
and result in horizontal dilation zones (Kikauka, 2002).
7
Figure 2. Location map for the Adanac molybdenum deposit (from Pinsent and Christopher, 1995). Figure 3 (regional geology map) is an area on this map bounded by Atlin lake and Surprise Lake, which is the curved lake immediately to the east of the Adanac property. The white box (Adanac property) is the approximate location of Figure 4 (local geology map). Inset is a location map of the province of British Columbia.

8
Figure 3. Regional geologic map of 104N/11W, 12E (Atlin area). The drainage and fault cutting the Mount Leonard stock are Boulder Creek and Boulder Creek Fault, respectively. The drainage cutting Ruby Mountain Quaternary volcanic rocks is Ruby Creek. Both creeks have their headwaters on opposite sides of the Adanac molybdenum deposit and drain into Surprise Lake. The Adera Fault bounds the Adanac deposit at surface, and has dropped the mineralization down to the north. From Bloodgood, 1988.

9
,? A " C i ~
i '• ' -' ' *
' ' ,- '0 1 ' . -KX' . •" ' 1/5/ '••
" • • - • '
Southwest Mo Zone^Jg^ }
/ ( Tungsten Veins l
. y\^, - .>ti \ Vki •: ..<
N ? i.' '-X'.-
^ ^ • - • ; - t \ \ \ -
-a
la 1 3 1 ** I ' l l .
" V I i A Mo in Veins 4 r 1 § ? h}\ ' J/ •- - J 'i_A_< 1 ° I /' Silver Diamond Skarn'W: J «
/ "'" ftp -11 i/f IVJ \ ^\/iK "
• y.% ll "•:, "' 1 ' I i | ' /
,§T\5? rC- - ' / ' ' ' P / N /
~~~r •" / . -VA
1 o 100
I
/A ^ y*r&r
i£r • \ ; : ^^^*
^i^^ j£ ' "^ ...j-Ss^x J|plRuby Creek Mo Main Zone r
i. - - - — - r —
i Black Diamond Trenches
\c
A t ^
w, ^ v - .
. ' • ' • : • . , ' - ^
, '
iL'i ' • ' ' L'
' • ' i ' -
„ . ' : ' e ' - B p . w _...
Surprise Lake
Figure 4. Boulder Creek and Ruby Creek area map showing main mineral occurrences discussed throughout this thesis, and faults. The Ruby Creek Mo Main Zone is the approximate location of Figure 5. The base map is a regional aeromagnetic survey from GSC, 2002. Warmer colors (pink, red, orange, and yellow) show higher gravity values while cool colors (green and blue) show lower gravity values. Grid shows UTM Zone 9, NAD 83 coordinates.
Local Geology
The deposit area was described by Sutherland Brown (1970), White et al. (1976),
Christopher and Pinsent (1982), and Pinsent and Christopher (1995). The Adanac
molybdenum deposit underlies the valley floor near the head of Ruby Creek. It is largely
buried and has very little surface expression. There is little outcrop in the lower part of

10
the valley and molybdenite is only rarely found in float and/or veins in outcrop in the bed
of the creek. The geology underlying the valley floor is largely derived from drill data
(Fig. 5). Adanac has a single flat-lying to steeply-dipping "shell" of mineralization as
described by White et al. (1976) and Pinsent and Christopher (1995).
^620750 mil
-ۥ320250 m?l
•A
• s' Jr-zr^i * • . /* CQMP N
MQMP
1
f ! COQM \ 1
. 1 . •• •
. • / s
IK
MFP
\CGQM
N I I 0 I
>)J
0 125
miles
Figure 5. Surface geology of the Adanac molybdenum deposit (Mo main zone in Fig 4). The black dots are drillholes, and the black dashed lines are strong faults that cause displacement, such as the Adera, and the grey dashed lines are weak faults, or faults that cause no discernable displacement. CGQM (crowded quartz monzonite porphyry), CGQM-T (transitional phase), MQMP (mafic quartz monzonite porphyry), and SQFP (sparse quartz feldspar porphyry) are all the first phase of intrusion. The second phase is SQMP and CQMP (sparse and crowded quartz monzonite porphyry). The third phase of intrusion, the fine grained aplite dikes, is not represented on the map, but cuts other lithologies at more localized scales. The grid shows coordinates in UTM Zone 8, WGS 84.

11
The deposit is near the western margin of the Surprise Lake batholith (Ballantyne
and Littlejohn, 1982). It is hosted within the multi-phased Mount Leonard Stock, and
entirely within plutonic rock. There were three stages of intrusion: an early, generally
coarse-grained, stage that was deformed prior to intrusion of second-stage porphyry
domes, and a late fine-grained phase that was injected through the porphyry domes. The
deposit itself is a disrupted blanket-shape deposit that formed late in the development of
the plutonic suite. The deposit is partially controlled by the Adera fault system which
trends approximately NE-SW and defines much of the southern boundary of the pre-ore
Fourth of July batholith. This fault is a normal fault dipping approximately 80 degrees
northwest. The approximately N-S Boulder Creek fault system appears to have localized
emplacement of the late, third stage porphyritic and aplitic plutonic rocks which are
thought to have generated the majority of mineralization (Pinsent and Christopher, 1995).
Mineralization is in the form of 3-4 cm sized molybdenite rosettes in a stockwork of
smoky, ribbon textured quartz veins (Figures 6 and 7). Some late-stage milky white
quartz veins carry smaller and less frequent rosettes, but are typically barren. There is
very little fine molybdenite, and some molybdenite paint on fractures and in faults.

Figure 6. Large molybdenite rosettes in a smoky, ribbon textured quartz vein.
Figure 7. Molybdenite rosettes on the plane of a quartz vein from a boulder at Adanac.
13
Research Objectives
The first goal of this thesis is to refine exploration models for porphyry
molybdenum deposits in the North American Cordillera, both at the deposit level and
regional scale. To accomplish this, the Adanac (Ruby Creek) Molybdenum deposit has
been analyzed in terms of trace element, mineralogical, and alteration zonation, as these
are common considerations for classifying low-fluorine versus high-fluorine
molybdenum deposits (Clark, 1972). Trace elements present were determined by ICP-
MS analysis of drill core. Mineralization and alteration observations were both
determined from megascopic analysis of drill core (core logging). Studies on alteration at
Adanac were further enhanced by petrographic analysis and X-ray diffraction analysis of
clays. Standard whole rock geochemical measurements (ICP-MS) were completed in
order to compare the plutonic suite responsible for mineralization at Adanac (Mount
Leonard stock) to other plutonic suites hosting molybdenum mineralization throughout
the cordillera. Another important aspect of comparing molybdenum deposits in the
Cordillera is their age. To this end, a geochronologic study of mineralization versus
magmatism by using Re-Os isotopic dating of molybdenite and U-Pb zircon dating of
major lithologies in the deposit was completed. This indicates how long the
hydrothermal system at Adanac was active, and also was intended to help determine
which lithologic phase was responsible for mineralization. Molybdenite samples from
the deposit were also analyzed for polytype and Re concentration, as these characteristics
can also shed light on similarities and differences between Mo-bearing porphyry deposits
in the Cordillera.

14
The second goal of the thesis is to determine if there is a connection between
porphyry molybdenum deposits and intrusion-hosted gold deposits. As there is a possible
link between the molybdenite mineralization and gold mineralization in the Ruby Creek
vicinity, the Adanac deposit provides a unique opportunity to investigate a possible
continuum between these deposit types. Trace element and whole rock data at Adanac
was compared with descriptions of chemically-reduced intrusion-hosted gold deposits.
Os isotopic signatures in magnetite have been used from Adanac and from placer gold
samples in Ruby Creek (downstream) to test for a possible genetic link and to see if these
deposits have a common origin.

15
Chapter 2
Geochemistry of Host Rocks at Adanac
Summary of Lithologies at Adanac
Each fresh lithology in the deposit was described according to hand sample and
thin section analyses, and samples of rock that had undergone the least amount of
alteration were chosen. These data complement the whole-rock geochemical data and are
utilized for comparison to other molybdenite deposits. Lithologies are described roughly
in order from oldest to youngest based on observed cross-cutting relationships (Figure 8).
Because cross-cutting relationships were not observed between a few lithologies, some
relationships are uncertain. Isotope geochronological data are presented later in this
document.
FGQM
MFP
MEQM
SQMP
?
7
CQMP
MQMP
CQFP CGQM-T CGQM CGQM-H SQFP
Figure 8: Relative rock ages based on observed cross cutting relationships in the deposit. Question marks are placed by MFP and MEQM because the relative ages of these two lithologies is unknown, as there are no cross-cutting relationships.

16
Coarse-grained quartz monzonite (Figure 9) (CGQM - field term used by
previous workers) is the oldest and most common rock in the Mount Leonard Stock,
comprising roughly 50 percent of the stock in the mine area. It is a weakly to moderately
deformed, pink or grey, equigranular, coarse-grained (0.5-3.0 cm) granite. In hand
specimen, it contains roughly equal amounts of potassium feldspar, plagioclase, and
quartz, with minor biotite. Two samples of fresh CGQM were examined in thin section.
Quartz is the dominant mineral in both sections, at 45-50%, with potassium feldspar and
plagioclase present roughly equal amounts at about 20-25% each. Biotite comprises 3-
10% of the rock. Quartz is generally anhedral and equant in appearance and typically
ranges from 0.5-3 mm in maximum dimension. Feldspars are equant to tabular and up to
5 mm in maximum dimension, and often perthitic (Figure 10). Orthoclase is generally
larger than plagioclase, and may occasionally reach 15 mm in size. Plagioclase is
typically albite twinned, and has an anorthite content of 13 percent, based on CIPW
normative calculations. Larger plagioclase and orthoclase phenocrysts are typically
concentrically zoned, displaying varying extinction angles within a crystal. In a few
instances, myrmekitic textures between quartz and orthoclase were observed. Biotite is
usually brown in uncrossed polars and generally tabular to platy in nature with maximum
long dimensions of 10 mm and short dimensions of about 3 mm. Under crossed polars,
biotite exhibits classic birds-eye extinction in various shades of brown. Typically biotite
is slightly altered to green chlorite on the margins or cleavages. Small (less than 0.1mm),
euhedral apatite is also present within quartz and biotite crystals, comprising less than 1%
of the rock. Other minerals that were observed (probably secondary hydrothermal
alteration) included: fine-grained chlorite replacing biotite; very fine-grained sericite and

17
kaolinite (up to 10% by volume) replacing feldspars; euhedral pyrite replacing or
overprinting chlorite or replacing magnetite; and magnetite (<0.05 mm rounded blebs)
replacing chlorite; and traces of calcite, usually replacing feldspars or surrounding biotite.
Total secondary minerals comprise from 1 to 5% of the rock.
Figure 9. CGQM in core sample. On the right hand side of the core is aFGQM dike. From drill hole A-04-14, 705ft.
• ' 321=142=1

18
Figure 10 (previous page). A typical twinned and perthitic feldspar phenocryst in CGQM, in photomicrograph, crossed polars, from drill hole A-06-321, 142ft.
Transitional and hybrid coarse-grained quartz monzonite (CGQM-T and CGQM-H)
and sparse and crowded quartz feldspar porphyry (SQFP and CQFP) are porphyritic
varieties of CGQM that contain increased groundmass, approximately 25% in transitional
and 50% in the hybrid type (Figure 11 shows CGQM-T, Figure 12 shows CQFP, and
Figure 13 shows a transition between some of these lithologies). Groundmass comprises
the same mineral assemblage and relative percentages as in CGQM, but grains are 2-
4mm in size. CGQM-T and CGQM-H occur at contacts where CGQM grades into
SQFP. All of these phases occur as preore dikes that are cut by mineralized quartz veins,
but also occur as separate and mappable units on the outer margins of the CGQM.
CGQM-T, CGQM-H, SQFP and CQFP all have the same modal mineralogy as CGQM.
In thin section, CGQM-H is 50% quartz, 20% each of alkali feldspar and plagioclase, 5%
biotite, and 5% secondary minerals. Anorthite content of plagioclase is estimated at 13%
based on CIPW normative calculations. Secondary minerals include calcite, pyrite,
magnetite, sericite, and chlorite (alteration product of biotite). Pyrite and calcite are
associated and occur together in the groundmass as 1-3 mm crystals. Pyrite also occurs
replacing chlorite along cleavage planes and replacing magnetite. Magnetite and chlorite
both occur as replacement products of biotite. Sericite and calcite occur as fine crystals
replacing the centers of feldspars. In one sample a 1 mm fluorite grain was noted
alongside calcite inside a plagioclase crystal. CGQM-T and CGQM-H commonly exhibit
graphic intergrowths and myrmekitic textures (Figure 14).

19
• r » . ;
••*-!itoa£^..
Figure 11. CGQM-T in core sample, from drill hole A-04-28, at 463 ft.
Figure 12. CQFP in core sample, from drill hole A-04-26, at 30ft.
.**•
v - » « "*»«' * ..
Figure 13. SQFP (on the left) grading to CQFP (on the right) in core sample, from drill hole A-04-15, at 79ft.

20
Figure 14. Graphic intergrowth of quartz and feldspar is often seen in thin section for Adanac lithologies. The texture seen here is from the rock "Fdiss", discussed in the geochemistry section. This particular lithology is found in float near the tungsten trenches (location of trenches shown in Figure 4 of introduction) and is part of the Mount Leonard stock, but is not found in the Adanac molybdenum deposit. The rock is unique because it has fluorite disseminated in amphibole crystals. Crossed polars.
Mafic quartz monzonite porphyry (MQMP) (Figure 15) is a grey-colored rock
unit distinguished from other rocks in the deposit by an elevated biotite content. This
unit cuts CGQM but is cut by SQMP and CQMP (described below). Biotite crystals are
fine-grained (1mm). Plagioclase and orthoclase phenocrysts are 7mm to 3cm in size.
Plagioclase crystals are chalky-white colored while orthoclase is typically grey. Quartz
phenocrysts are 6mm to 3cm. The matrix comprises a mixture of biotite, quartz, and
feldspar. In thin section, this rock has a slightly higher feldspar content than CGQM.
Quartz is 40%, while plagioclase and alkali feldspar make up 50%, with slightly more

21
plagioclase than alkali feldspar. Plagioclase feldspar has an anorthite content of 19%
based on CIPW calculations. Biotite makes up the other 10% of the rock with other
minerals such as apatite and zircon all comprising less than 1%. Chlorite typically
replaces margins of hiotite, and pyrite and magnetite replace both biotite and chlorite.
Pyrite is euhedral while magnetite is typically anhedral, and both are about 0.4mm in
size. Kaolinite and sericite occur as alteration products within feldspars. Anhedral
calcite was observed locally near the pyrite- and magnetite-altered biotite. Graphic
intergrowth textures were more common in MQMP than in other rocks. These textures
occurred over areas of about 0.2 mm diameter, and consisted of quartz and feldspar
intergrowths (Figure 14).
Figure 15. MQMP in core sample, from drill hole A-04-01, 469ft.
On the basis of cross-cutting relationships, sparse and crowded quartz monzonite
porphyry (SQMP and CQMP) (Figure 16 and 17) are younger than CGQM and MQMP.
They both consist of white plagioclase, pink orthoclase, quartz, and biotite phenocrysts
that are 2-6mm and set in a light brownish to pinkish aphanitic matrix. In the sparse
variety, phenocrysts make up 10-30% of the rock and in the crowded variety phenocryst
22
content increases to between 60-80%. SQMP may be slightly younger as it is seen to
sometimes cut the crowded version. In thin section, quartz makes up about 45% of the
rock with plagioclase and alkali feldspar about 25% each. One small area (0.3mm)
exhibited graphic intergrowth textures as mentioned above in the section for MQMP.
Anorthite content of plagioclase is 9% for SQMP and 11% for CQMP based on CIPW
calculations. Biotite is about 4% in some of the samples, and opaque (secondary)
minerals such as pyrite, magnetite, and molybdenite comprise the rest. One 0.5mm
zircon crystal was observed with a brownish to orange damage halo in the surrounding
rock. Chlorite commonly replaces biotite, and plagioclase feldspars have clays (these
appear to be kaolinite and sericite but are too fine-grained for clear identification)
clustered in the centers of crystals or in outer rings (Figure 18 and 19). In two thin
sections it was observed that molybdenite occurs in cleavage planes of biotite that is
altering to chlorite. Molybdenite crystals were large (1mm) and euhedral. Clustering
around the molybdenite and appearing to post-date it were small amounts of subhedral
0.3 mm sphalerite and galena.
Figure 16. SQMP in core sample, from drill hole A-04-06, 289ft, photo also shows a molybdenite vein.

23
Figure 17. CQMP in core sample, from drill hole A-07-338, 612ft.
Figure 18. Clay alteration is selective in feldspars. It will commonly replace the centers or occur in an outer ring (Figure 19). Photomicrograph, crossed polars, from drill hole A-07-318, 660ft.

24
Figure 19. Clay alteration (dark colored) selectively replacing an outer ring-shaped area of a plagioclase feldspar. Photomicrograph, plane light, from drill hole A-07-324, 863ft.
Medium-grained equigranular quartz monzonite (MEQM) (Figure 20) is a lithology
that apparently is not widespread in the deposit, and occurs as an intrusion only known in
drillholes in the southwest end of the deposit. It intrudes CGQM, but has no observed
cross-cutting relationships with most of the other lithologies in the deposit, except for
FGQM, which cuts the MEQM. It has a mosaic texture that is equigranular, and consists
of equal amounts of quartz, plagioclase, and alkali feldspar that are all about 1 -2 cm.
Biotite is present as well, with crystals being about 5 mm. In thin section, biotite is more
abundant than in CGQM or FGQM, comprising up to 15% of the rock. Quartz,
plagioclase, and alkali feldspar comprise roughly equal amounts at 25-30% each.
Anorthite content of plagioclase is 14%. Other minerals include trace small zircon and
apatite, plus fine-grained secondary minerals such as clay alteration of feldspars, plus

25
calcite, chlorite, pyrite and magnetite that are similar in occurrence to those described for
CGQM.
Figure 20. MEQM in core sample, from drill hole A-06-331, unknown footage.
Megacrystic feldspar porphyry (MFP) (Figure 21) is noticeably different from
other lithologies in the deposit. It consists of a very fine grained (< 0.2mm) dark blue
matrix, and contains small biotite crystals (0.5mm). Phenocrysts are rounded, 6mm
smoky quartz eyes, and larger, 1- to 4-cm euhedral plagioclase and alkali feldspar
crystals. It is not widespread and usually occurs as dikes or sills cutting CGQM and
MQMP at the southwest and south end of the deposit. In thin section, quartz is 40% of
the rock, biotite is 15%, and plagioclase and alkali feldspar are each approximately 20%.
Anorthite content of plagioclase is 22%. The matrix is mostly very small crystals
(0.1mm) of quartz and feldspar (<0.03mm) with intergrown biotite (Figure 22).
Feldspars are moderately altered to kaolinite and/or sericite. Feldspars sometimes exhibit
poikilitic textures, with randomly-oriented plagioclase crystals (1mm) inside larger (3 cm)
alkali feldspars (Figure 23). The rock has a larger percentage of opaque minerals relative

26
to other lithologies in the deposit. Opaque minerals are mostly pyrite and magnetite, with
minor chalcopyrite and pyrrhotite, and comprise up to 1% of the rock. Magnetite
commonly replaces chlorite, while pyrite, chalcopyrite, and pyrrhotite replace magnetite.
Figure 21. MFP in core sample, from drill hole A-06-333, 950ft.
Figure 22. Finely crystalline quartz and biotite in the matrix of MFP, crossed polars, photomicrograph from drill hole A-04-314, 212ft.

27
Figure 23. Small twinned plagioclase crystal inside a larger alkali feldspar phenocryst. Photomicrograph, crossed polars, from drill hole A-04-321, 340ft.
Fine-grained quartz monzonite (FGQM) (Figure 24) is the youngest known
lithology in the deposit as it is seen to cut all other units. This unit occurs as both dikes
and sills throughout the deposit. It also postdates mineralization-related silicification. It
is a brownish to pinkish lithology that is equigranular and is a mixture of white and pink
feldspar, quartz, and trace biotite. The grain size ranges from less than a millimeter to
about 3mm. In thin section, FGQM contains roughly equal amounts of quartz,
plagioclase, and alkali feldspar, the three of which comprise 90% of the rock. Anorthite
content of plagioclase is 11%. Biotite makes up 5-10%, with secondary minerals
comprising the rest. The secondary minerals include chlorite replacing biotite; clays and
calcite replacing feldspars; and small grains (0.2mm) of eu-subhedral pyrite or magnetite,
either in the matrix or replacing biotite or chlorite. In one thin section where the FGQM
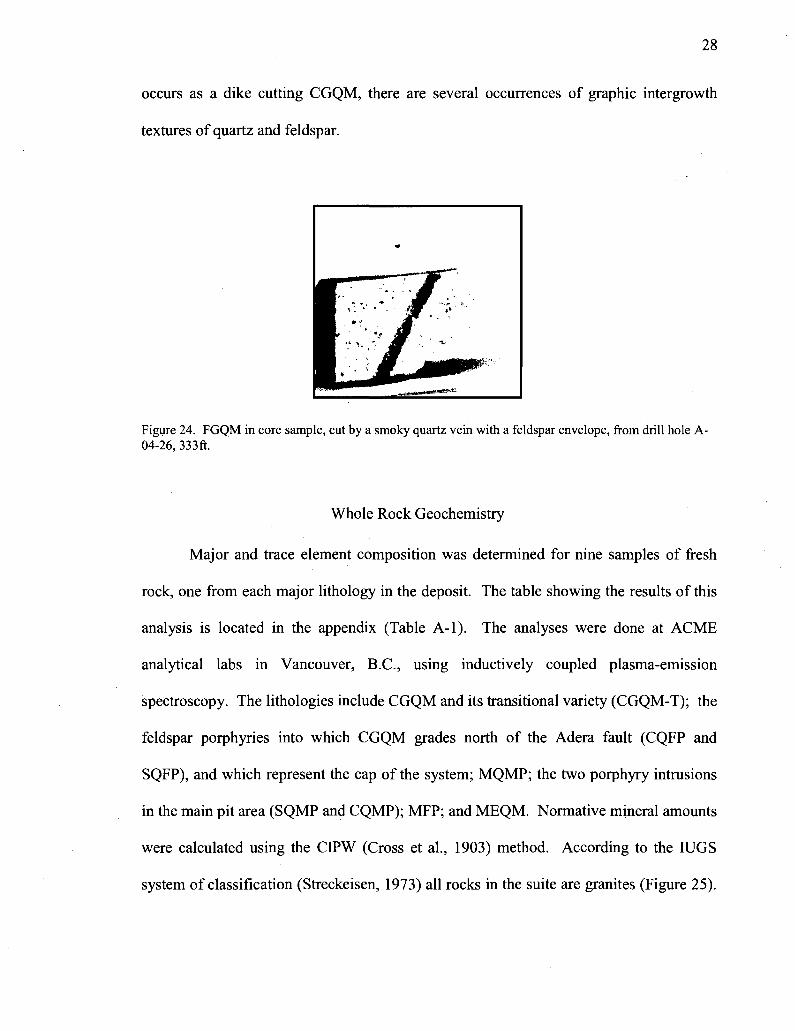
28
occurs as a dike cutting CGQM, there are several occurrences of graphic intergrowth
textures of quartz and feldspar.
Figure 24. FGQM in core sample, cut by a smoky quartz vein with a feldspar envelope, from drill hole A-04-26, 333ft.
Whole Rock Geochemistry
Major and trace element composition was determined for nine samples of fresh
rock, one from each major lithology in the deposit. The table showing the results of this
analysis is located in the appendix (Table A-l). The analyses were done at ACME
analytical labs in Vancouver, B.C., using inductively coupled plasma-emission
spectroscopy. The lithologies include CGQM and its transitional variety (CGQM-T); the
feldspar porphyries into which CGQM grades north of the Adera fault (CQFP and
SQFP), and which represent the cap of the system; MQMP; the two porphyry intrusions
in the main pit area (SQMP and CQMP); MFP; and MEQM. Normative mineral amounts
were calculated using the CIPW (Cross et al., 1903) method. According to the IUGS
system of classification (Streckeisen, 1973) all rocks in the suite are granites (Figure 25).

29
The rocks have an average of 35% normative quartz. Alkali-total feldspar ratios in all
lithologies were about 50. An alkali-lime index (Peacock, 1931) (defined as the wt%
silica where Na20 + K2O = CaO) of 50 wt% SiC>2 was calculated (Figure 26), meaning
the rocks are further classified as alkalic. On the basis of the ratio of the mole percent
alumina compared to the added sums of CaO, K2O, and Na20, it was also determined that
the suite is peraluminous (Shand, 1949).
Ouaitz
Granite Field: IUGS Classification
AIIAdanac M* • Lithologies
Alkali Feldspar —K K
Pla.qioclase
Figure 25. IUGS classification scheme of igneous intrusive rocks showing that all Adanac lithologies fall into the category of a granite.

10
50 55 60
Alkali Lime Index
R2 = 0.1324
R2 a 0.9423
30
65 Si02wt%
70 75 80
Figure 26. Alkali lime index (wt% silica where Na20 + K20 = CaO) graphed for lithologies at Adanac. Because of the limited and high silica range, the trends were extrapolated considerably.
A series of Harker diagrams (see Appendix) was also made to evaluate
differentiation trends and the genesis of the various rock units. The Harker diagrams
dealt with the principal fresh lithologies described above, and also with a textural variety
(coarser grained) of MQMP, a sample of FGQM from the west end of the deposit as
opposed to FGQM from the pit area, and another rock called "Fdiss", which stands for
"fluorine disseminated". The sample of Fdiss is a rock found in float west of the main
known mineralized area, where tungsten (wolframite) mineralization is exposed at
surface in a large (1-2 meters wide) quartz vein. The sample is unusual because it has

31
visible fluorite disseminated in amphibole crystals in hand specimen. These samples
were included in separate Harker diagram sets for the sake of consistency. With
increasing silica, AI2O3, FeaCb, and CaO decrease; U, F, Mo, Rb, MgO, Na20, FeO,
MnO, and Ti02 either remain constant or values are too scattered (poor, or less than 0.2
R2, i.e. correlation coefficient of a linear trend line and data points) to see any trend; and
K2O values increase.
Discussion
Although they encompass a limited silica range, the Harker diagrams indicate
Adanac lithologies are consistent with normal differentiation trends with respect to major
oxides. It was hoped that with increasing silica, there would be an increase in U content,
but no clear pattern emerged from the data (Figure A-5). It is highly interesting to note
the negative correlation between F and Mo (Figure A-8). Based on cross-cutting
relationships, it is well established that CGQM is the oldest lithology known in the stock,
and FGQM is the youngest. It might be suspected that since FGQM is the youngest, but
still is cut by mineralized veins, that it may be the source (or generated from the source)
of mineralization. If F is the ligand used for transport of Mo in hydrothermal solutions, it
would not be surprising to find that both elements decreased in content in lithologies that
were losing these elements to hydrothermal solutions. However, this is not what is seen.
F decreases fairly consistently with increasing silica (and decreasing age) and Mo
increases with increasing silica. This behaviour may somehow be related to the relative
abundance of the two elements in the different rocks, coupled with the efficiency of
extraction of the Mo using F as a ligand. Alternatively, it may be that the presence of F is
negatively affecting the compatibility of Mo in the rocks, and they are released into

32
hydrothermal fluids at different times (F first, Mo last). A third (much less likely)
possibility is that these rocks are not all from the same suite. This is not likely because
all of the lithologies (with the exception of "Fdiss") are in close proximity to each other,
and not near any other known intrusive suite and also yield virtually identical ages
(discussed below). It also may be a possibility that, while there is some difference in the
F content between these rocks based on how much of the element has been released in a
hydrothermal fluid, what the Harker diagrams are really reflecting is biotite content.
Fluorine should concentrate in biotite because the mineral allows for water and some
incompatible elements in its structure. Therefore, even if biotite F content is less for
older rocks, these same older rocks have more biotite and this obscures a lower F content
relative to the whole rock analysis. If this is the case, the opposite trend in F should be
seen when just the biotite is analyzed.
Classification of Adanac
Published literature on porphyry molybdenum deposits broadly outlines two basic
types of deposits, the "granite" and "quartz monzonite" types (White et al., 1981,
Sutherland Brown, 1969, Wallace, 1995). Westra and Keith (1981) recognized that these
two basic types can be separated based on the K2O value of unaltered igneous host rocks
at 57.5 weight % Si02. A natural dividing line occurs between those deposits with a K2O
value of less than 2.5% and those with values above that. If the K2O value is less than
2.5, the molybdenum deposits are classified as the "calc-alkaline" quartz-monzonite type,
which typically have low F values (0.1-0.25%). These deposits typically have lower
molybdenite grades (0.25% M0S2), little Sn, and W is present as scheelite. Source

33
(genetically related) plutons have between 100 to 350 ppm Rb, and 100 to 800 ppm Sr.
Those deposits with K2O values above 2.5% are broadly referred to as the Climax-type of
molybdenum deposit. Climax-type deposits are associated with alkali-calcic to alkalic
granites, and are enriched in F (0.5- >5%) and Sn. Rubidium content of the associated
plutons is typically 200-800 ppm, with less than 125 ppm Sr (Figure 27). The
molybdenite grades are typically higher than 0.30% M0S2 and W is present as
wolframite.
Since granite and quartz monzonite molybdenum deposits have these different
and predictable geochemical characteristics, those characteristics should be useful in
delineating the nature of the system at Adanac. Using the Westra and Keith (1981)
criteria for classification of porphyry molybdenum deposits, the K2O value at 57.5 weight
% Si02 (K2O57.5) was calculated to be ~5 for the rocks at Adanac, thus placing them
clearly in the Climax-type group. All of the rocks at Adanac contain between 70 and
76% silica, so the K2O value had to be extrapolated considerably. Even so, the calculated
value of 5% is well above the dividing point of 2.5%. Fresh lithologies at Adanac group
well with other Climax-type deposits based on Rb and Sr content, as well as on the basis
of the K2O57.5 value (Figure 27). It is not surprising that Climax-type and transitional
types of porphyry molybdenum deposits exhibit higher Rb contents than calc-alkaline
type porphyry molybdenum deposits and continental margin and island arc porphyry
copper deposits. The Climax-type and transitional type porphyry molybdenum deposits
are farther inboard of subduction zones than porphyry deposits associated with copper.
Rb content is reflective of the extent of mixing with continental crust. At Climax, the Rb
contents are especially high, and this may be due to flat-slab subduction which was the

34
tectonic environment there at the time of intrusion, unlike Adanac (Westra and Keith,
1981).
900 V
700-
ppmRbV jS
Unaltered igneous rocks
K20575>2.5
500-
300-!
100 A
K2057.5<2.5
o Climax-type molybdenum C "Transitional" molybdenum A Calk-alkaline molybdenum O Mt. Pleasant A Continental margin porphyry Cu O Island arc porphyry Cu ^Adanac
* . ^ - A r A A I s» A A A,
O
A A A
/£& A
A A
on "kR A A
' 200 ' 460 ' 660 860 ' IO'OO ' i2'oo ' i4bo '
ppm Sr Westra & Keith, 1981
Figure 27. Plot showing how the K20 value at 57.5 wt% Si02 is useful in dividing porphyry deposits,along with Rb and Sr content. Mt. Pleasant is a porphyry tungsten deposit. Diagram modified from Westra and Keith, 1981.
Conclusions
On the basis of the data presented here, it is clear that the rocks in the area of the
Adanac deposit should be reclassified as granites. More appropriate nomenclature for
these rocks is listed in Table 1. All of the rocks contain dominantly quartz, orthoclase,
and plagioclase feldspar, with minor amounts of mafic and accessory minerals. Modal
estimates establish that these fall into the granite field of Streckeisen (1973).
Geochemical data, when calculated to CIPW norms, yield similar results, with all rocks
falling into the granite field. On the basis of rock types, style of mineralization, and

whole-rock geochemistry, Adanac appears to
deposits.
Old Adanac Lithology Name
CGQM, -T, -H: coarse-grained quartz monzonite, -transitional, -hybrid
MQMP: mafic quartz monzonite porphyry
SQMP: sparse quartz monzonite porphyry
CQMP: crowded quartz monzonite porphyry
CQFP: crowded quartz feldspar porphyry
SQFP: sparse quartz feldspar porphyry
MFP: megacrystic feldspar porphyry
FGQM: fine-grained quartz monzonite
MEQM: medium-grained equigranular quartz monzonite
35
best be grouped with the Climax-type
Proposed New Name
CGG, -T, -H: coarse grained granite, - transitional, -hybrid
MGP: mafic granite porphyry
SGP: sparse granite porphyry
CGP: crowded granite porphyry
same
same
same
FGG: fine-grained granite
MEG: medium-grained equigranular granite
Table 1. Proposed new names for Adanac lithologies based on whole rock geochemistry study.

36
Chapter 3
Geology and Trace Element Zoning at Adanac
The type, amount, and zoning of trace elements are an important consideration for
understanding porphyry molybdenum deposits. To interpret trace element zonation, drill
core pulps (1835 samples from 22 drillholes) were composited at the lab based on similar
lithologies in intervals of 10-40 feet and analyzed for 41 trace elements plus fluorine by
inductively coupled plasma emission spectrometry (ICPMS) at ACME labs in
Vancouver, British Columbia. Trace element data have been studied for patterns and
anomalies of Mo, Pb, Zn, W, F, Sn, Cu, and Au (no other trace elements were present in
any amount above normal background contents for granites). The ranges of values for
trace elements were grouped based on natural statistical breaks, determined by using the
Geochem application of the GIS program Map Info. Values were distributed in their
respective groups so that the average of each group is as close as possible to each of the
values in that group. An example of how these ranges were broken out is shown in
Figure 28. For most elements analyzed, the bottom range (grey) represents normal
background contents for that element in granites. The exception is fluorine, where the
blue group represents normal background content and the grey group represents
depletion. Any group or range above these two bottom groups is always considered
anomalous or highly anomalous, a relative term applied for how far a statistical group
exists above the background content. There are no quantitative criteria for calling
elements "highly anomalous". This term is used only for fluorine and molybdenum, both
of which have very high contents in this deposit.

37
Four cross sections were chosen in the deposit to represent geology and trace
element zoning. One cross section (A-A') is oriented approximately in a northeast-
southwest direction, while the other three (B-B', C-C, and D-D') are oriented
approximately northwest-southeast (Figure 29). Full-color cross sections depict geology
(Figures 30-33). Black and white cross sections with colored overlays represent selected
trace element zonation (colors) against the backdrop of geology (black and white
patterns) (Figures 34-45).
lum
ppm
•5
1: b
ackg
roun
d
Gro
up
(gre
y c
(A 3 o CD £ o c CO ^ ^
(0 -C P ? .2>S
3 2:
ano
mal
ous
colo
red)
roup
3: a
nom
alc
reen
col
ored
)
• G
roup
4: h
•
(yel
low
col
y an
omal
ous
Gro
u|
(blu
e
^ ^-JHk^**
O 3
, * - * * * « •<• '
• ^
•
y
up 5
: hig
hl
colo
red)
G
ro
(red
Number of Samples
Figure 28. Example diagram of how natural statistical breaks were used to distribute samples into their respective groups. See text for discussion of terms. A change in slope marks the beginning of a new group.

38
- i . 1-
• AD-344
Approximate Proposed Main Pit ^0.345
• AO-346
/LD-34? )
miles
Figure 29. Surface geologic map of Adanac showing the location of cross-sections. The proposed main pit area approximately circles the CGP and SGP intrusion area on the map. The southwest end of the deposit, referred to commonly in this thesis, would begin near hole AD-333 (the far west end of cross section A-A') and continue west and south of this location. This area was being drilled in 2008, and mineralization was continuing to be discovered on this end. Lithologic units are labelled on the map, using the new names proposed in Chapter 2, Table 1. These include coarse-grained granite (CGG - orange), transitional coarsegrained granite (CGG-T - flesh colored), sparse quartz feldspar porphyry (SQFP - yellow), mafic granite porphyry (MGP - pink), megacrystic feldspar porphyry (MFP - purple), crowded granite porphyry (CGP -dark green) and sparse granite porphyry (SGP - light green). Strong faults (ones that cause obvious displacement) are shown as black dashed lines while weak faults (ones that cause no disceraable displacement) are shown in grey. Adanac (AD series) drill holes are labelled, and drill holes that appear in cross sections have a white halo around their label. Unlabelled drill holes are holes drilled by other companies in the past. Map coordinates are in UTM Zone 11, WGS 84.
Geology and Structure
Geology is shown below in Figures 30-33. Geology was determined based on
drill logs and is labelled according to the new terminology proposed at the end of Chapter
2.
CGG is the oldest lithology because all other units cut it or intrude it (Figure 30).
MGP intruded CGG on the east (Figure 30). SGP and CGP intrude CGG and MGP on

39
the eastern and central portions of the deposit (Figure 33). SGP and CGP have
gradational contacts and are therefore regarded as the same intrusion, the difference
between the two being the amount of phenocrysts present. CGP is known to occur as a
lens in SGP based on other numerous surrounding drill holes. CGP also occurs as a
cupola, or as the upper portion of the SGP intrusion on the eastern side of the deposit. On
the south end of the deposit, there is some undrilled fault that drops these- lithologies
(Figure 32).
MEG intruded CGG on the west side of the deposit (Figure 31). MFP is a dike
that occurs above the contact of MEG with CGG (Figure 30 and 31) where the CGG was
probably faulted and structurally weak due to this intrusion of MEG. MFP also occurs as
a dike in drill hole AD-314 (Figure 31). MFP is generally restricted to the west area of
the deposit, south of the Adera Fault. The CGG on this end of the deposit (both drill
holes in Figure 31, the west end) is typically labelled CGG-T because it is not as coarse
grained as the CGG to the east, and has some fine-grained crystals in between large
grains.
FGG dikes cut all lithologies in the deposit, and are commonly more abundant
stratigraphically above the SGP and CGP intrusions, and disappear with increasing depth
into these intrusions. This may be interpreted to mean that they are following structurally
weak zones in the CGG created by these intrusions. Some of these structurally weak
zones can be seen in Figure 32, where steeply oriented faults occur in the upper part of
the intrusion of SGP/CGP. Large FGG dikes generally have no dip to a slight dip (10
degrees) and can be traced from drill hole to drill hole. Large FGG dikes are considered
to be greater than 5 ft in drill core. Smaller FGG dikes have numerous orientations from

40
vertical to horizontal. Some of these dikes may be the matrix of SGP/CGP that got left
over to the final stages of crystallization, because in some drill holes FGG is seen to
grade into SGP or CGP, even though FGG cuts SGP and CGP most of the time. On the
west end, FGG dikes may be the matrix of CGG-T or -H that got left over in the final
stages of crystallization, as the FGG is sometimes seen to grade into the matrix of these
lithologies (CGG-T and -H). Thus there are several generations of FGG dikes from
different intrusions, and they are seen in drill core to cut each other.
Fault movement at Adanac has displaced some lithologies and disrupted some
trace element patterns. The faults logged in drill core may not have produced significant
movement but they can be coincident with trace element highs or alteration patterns and
are therefore still relevant. The fault between drill holes 323 and 301 (Figure 30) has
moved the MGP and lateral parts of the SGP and CGP intrusions to the north. The fault
between holes 314 and 321 (Figure 31) does not noticeably displace lithologies so much
as trace element patterns (Figure 35), from which the vertical movement direction was
interpreted.

41
Figure 30. Geology of cross section A-A'. Colored backgrounds and associated background grey patterns both depict different lithologies in the deposit. Dashed blue lines indicate faults, with arrows showing inferred direction of movement. The "X" next to the fault represents movement into the page (away from the viewer) and the arrow point on the west side of the fault represents movement out of the page (toward the viewer). If no movement is labeled on a fault, this means that the movement direction is not known and is probably insignificant with regard to dislocation of lithology or trace element patterns.

42
Figure 31. Geology of cross section B-B', symbology as in figure 30. MFP is a dike occurring on the west end of the deposit that probably exploited weak zones in CGG above the MEG intrusion. The dike at the top of drill hole 314 may be following a structurally weak zone related to the Adera fault, which is a regional-scale structure. The Adera fault system exists at surface just to the north of this section.

43
NW
DH323
Geology Cross Section C-C
DH326
SE
1500
1400 :
DH340
%..-? Silicified j
13001
Silicified
DH348 •
Silicified
Silicified ^ , --***
»*** . *****
Silicified
. 100 m |
200 400
Distance (ni> 600 800
Figure 32. Geology of cross section C-C. Drill holes 323 and 340 are consistent with each other and drill the top portion of the SGP and CGP intrusion. Faults in these two drill holes can be traced between holes and have the same dip and orientation as the tops of the SGP intrusion, the silicified zone, and the CGP lens within SGP. Between hole 340 and 326 there has been some movement that down-dropped the SE portion of the deposit.
44
NW
• 1400
—""—
ratio
n (m
l El
e* 1300
-1200
0
DH301 V
CGG
FGG
MGP
. -
• • • • -
Geology Cross Section D-D'
DH 305
^Kz3B&
~^> £BM
^^^K*^^^E*^F^
SGP
^ / '
100 200 Distance (m)
SE
DH 343 ^ n ^ — ^ •
^ S
I
. . ^ • ^ "
, 50 m .
.??p.
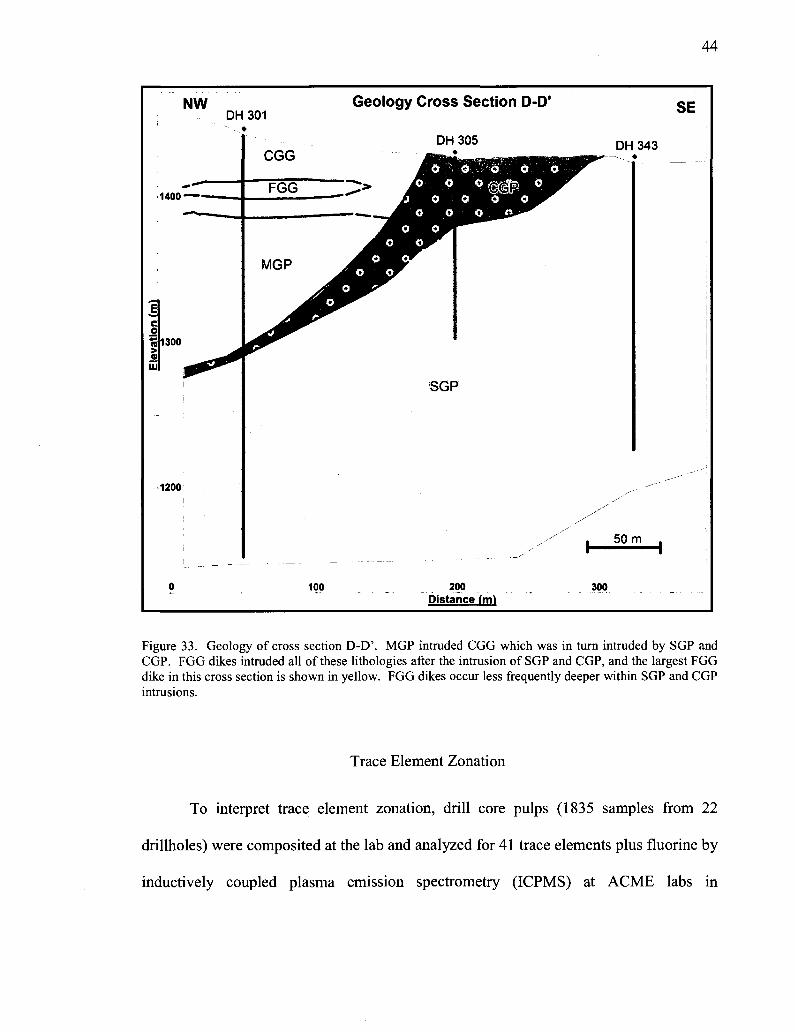
Figure 33. Geology of cross section D-D'. MGP intruded CGG which was in turn intruded by SGP and CGP. FGG dikes intruded all of these lithologies after the intrusion of SGP and CGP, and the largest FGG dike in this cross section is shown in yellow. FGG dikes occur less frequently deeper within SGP and CGP intrusions.
Trace Element Zonation
To interpret trace element zonation, drill core pulps (1835 samples from 22
drillholes) were composited at the lab and analyzed for 41 trace elements plus fluorine by
inductively coupled plasma emission spectrometry (ICPMS) at ACME labs in

45
Vancouver, British Columbia. Trace element data have been studied for patterns and
anomalies of Mo, Pb, Zn, W, F, Sn, Cu, and Au (no other trace elements were present in
any amount above normal background contents for granites). The ranges of values for
trace elements were grouped based on natural statistical breaks, described in the
introduction at the beginning of this chapter (Figure 28).
Molybdenum
The general pattern of molybdenite mineralization forms a blanket over and on
the flanks of porphyry intrusions in the deposit. The porphyry intrusions that the
mineralization straddle include CGP and SGP in the central portions of the deposit, and
MEG on the west end. Mineralization decreases within these intrusions.
Molybdenum is highest (670-1430 ppm) in drill holes 333 and 321 on the west
end directly above the MEG intrusion, in CGG (Figure 34 and 35). Molybdenum values
are also high in drill hole 301 in CGG and MGP above the SGP intrusion, and below this
higher grade zone on and within the flanks of the SGP intrusion (Figure 34 and 37). High
values also occur above and within the MGP in drill hole 301. Drill hole 301 may be
penetrating two different molybdenite blankets, one of which occurrs above MGP and the
other occurring on the flanks of the SGP intrusion (Figure 34). The difference in
molybdenum grades between drill holes 318, 304, and 323 is interpreted to represent
some lateral movement as well as vertical on the interpreted faults (Figure 34). It appears
that the block containing drill hole 304 is low-grade compared to drill hole 323 and drill
hole 318, but there has been relatively little displacement of lithology. This also may
46
indicate that the two faults bounding drill hole 304 are pre-mineralization and that
mineralization did not penetrate into this fault-bounded block.
Molybdenite mineralization is somewhat weaker in zones above the SGP and
CGP intrusions in the central part of the deposit (Figure 34). Molybdenum content
decreases within the SGP and CGP intrusions (Figure 37). On the southeast portion of
section C-C (Figure 36) past the fault, the drill hole 326 molybdenum pattern resembles
the top of drill hole 301, i.e., there is a highly anomalous blanket of mineralization above
the MGP intrusion. This may indicate that higher molybdenum grades exist on the flanks
of the SGP and CGP intrusions rather than directly above, as it would be expected to
encounter the flanks of SGP/CGP if one drilled deeper in this area. It may appear as if
the mineralization is post-faulting since the molybdenum shells are at the same elevation
and seem to continue undisrupted across the fault. This seems unlikely because the
faulting would have had to occur only in a very narrow time frame between the SGP and
CGP intrusion (which is clearly offset or affected by the movement) and the
mineralization event. It is much more likely that the mineralization here is pre-fault
movement, and that the portion of the deposit drilled by hole 326 was originally farther
south and has been moved northward.

47
w Molybdenum Cross Section A-A'
1600
1500
1400
i\
DH333 DH321
/ >
Silicified
Silicified
MFP
MEG
t
CGG
DH318
til
Silicified
J. L ^ IT CGP
DH301 DH 304 DH 323
FGG
SGP
xi 08)
MGP
CGP I
1200
<2O0 ppm 209-400 ppm
401-C00 ppm
M1-8M ppm :»®}C ppm
, 100 rn .
588700 589000 589300 UTM Easting (m)
589600
Figure 34. Molybdenum contents of cross section A-A'. High molybdenum values form a blanket over the MEG and SGP porphyries.

48
N W Molybdenum Cross Section on B-B'
DH314 SE
150a
1400
1300
100 Distance (m)
200
< 200 ppm
200-400 ppm
401-600 ppm
601-830 ppm
> 830 ppm
Figure 35. Molybdenum contents of cross section B-B'. Molybdenum is highest over the MEG intrusion.

49
Molybdenum Cross Section C-C
^ ^
t
200-400 ppm
00 Distance ( ™t)
401-600 ppm
600 I
, 100 m •
I 1601-830 I |
I |PP<" I I 800
I I
>830 ppm
Figure 36. Molybdenum contents of cross section C-C. Molybdenum high values occur as a blanket over SGP and CGP intrusions and also form a blanket within CGG towards the southeast, but die out towards the far southeast where drill hole 348 is. Molybdenum mineralization is weak but present over the SGP and CGP intrusions in holes 323 and 340.

50
NW Molybdenum Cross Section D-D' SE
-1200
<200 ppm 200-400 ppm
100
401-600 ppm
200 Distance (m)
601-830 ppm
i 5 0 m i
>830 ppm
300
Figure 37. Molybdenum contents of cross section D-D'. Molybdenum is highest above the SGP and CGP intrusions, but is less anomalous out towards the south (drill hole 343). Some slightly higher values do occur around the faults in drillhole 343. The slightly higher values in drillhole 343 are coincident with fault and fracture zones, likely following the trend of listric type faults on the flanks of SGP and CGP.
Tungsten
Tungsten, manifested as huebnerite, is coincident with the molybdenite
mineralization (Figures 38-41). It is not uncommon to see huebnerite mineralization in

51
drill core in the central part of the deposit where the pit is planned. The highest tungsten
values reported are 200 ppm, because that is the upper detection limit for the analytical
technique. In most of the drill holes, the upper detection limit for tungsten was reached
in at least one composited 10 ft trace element analysis.
Tungsten high values mimic the pattern of molybdenum, except for in drill hole
301 (Figure 38). In drill hole 301, tungsten only has high values above the SGP and
CGP, while molybdenum high values occur above and below this location. Tungsten
high values appear to occur slightly below (closer to the intrusion boundary) than does
molybdenum, for example in drillhole 321 and 318. It is not known whether the W
blanket over SGP/CGP would connect with that of the MEG intrusion, or would hug the
flanks of both. Tungsten high values in cross section B-B' and D-D' (Figure 39 and 41
respectively) show the same pattern as molybdenum. In cross section C-C (Figure 40),
tungsten anomalies do not appear to exist below the molybdenum shell as in A-A'. South
of the fault, tungsten anomalies are present surrounding, along the margins of, and within
silicified zones. It is possible that this is because the same hydrothermal fluids depositing
silica also deposited tungsten, or because the silicification increased brittleness of the
rock thereby allowing paragenetically later fluids to pass through and deposit tungsten.
In drillhole 326, there is a fractured zone (fractures not depicted) below the silicified zone
where the tungsten anomaly reaches >76 ppm. This anomaly is different from others
because there is a clear pattern of tungsten leaching or deficiency from the wallrock.

52
w Tungsten Cross Sect ion A-A'
o;
i\
1200
DH333 DH321
y' A
MFP
MEG
Silicified
Silicified
N>
CGG
DH318
til IT i i CGP
! i i i s i » C
! !
i •
DH301 DH 304 DH 323
eg> C G P l
E
SGP
MGP
< 30 ppm J30-75 ppm
76-150 ppm
>1S0 ppm , 100 m .
589000 689300
UTM Easting (ml
Figure 38. Tungsten contours for cross section A-A'.

53
NW Tungsten Cross Section on B-B'
DH314
1500
n > 1400
1300
100 Distance (m)
200
< 200 ppm
30-75 ppm
76-150 ppm
> 150 ppm
Figure 39. Tungsten contours for cross section B-B'.

54
NW Tungsten Cross Section C-C
DH326
-M500
o 5 a m
1400?
-11300
SE DH348 .
*
Silicifie<i
Silicitlei—t^- -^ "7
^ l O J H t ^ ^ .
k 30 ppm 30-75 ppm
76-150 ppm >150 ppm
200 400 600 Distance (m>
800
Figure 40. Tungsten contours for cross section C-C.

55
NW DH301
\ •
Tungsten Cross Section on D-D' SE
1400"
1300
1200
DH343 •
SGP
, 50 m ,
< 30 ppm
100
30-75 I ppm (
200 Distance (ml
76-150 J ppm
>150 ppm
300
Figure 41. Tungsten contours for cross section D-D'. Tungsten on cross section DD is coincident with molybdenum mineralization (Figure 9).
Other Base Metals (Pb, Zn, Cu, Sn) and Precious Metals (Au)
For low-Ca granitic rocks, the background metal contents are 39 ppm for Zn, 19
ppm for Pb, 10 ppm for Cu, 3 ppm for Sn, and 0.004 ppm for Au (Turekian and
Wedepohl, 1961). High values of Pb and Zn (150-250 ppm) occur in and are controlled
by faults in the areas of cross sections (no areas outside of cross sections were analyzed
for Pb or Zn). High values sometimes occur in silicified zones or above intrusions

56
possibly because increased late stage (post-mineralization) brittleness or fracturing
occurred in these areas. However, not all faults or fractured zones have anomalous Pb
and Zn. The value of 200 ppm was chosen as a "high value" in both cases based on
natural statistical breaks in the data. No visible galena or sphalerite mineralization is
regularly seen within the deposit. There are only trace (background) or slightly
anomalous amounts of Cu and Sn (5-15 ppm each) and Au values are constant throughout
the deposit at below the detection limit (0.1 ppm). Chalcopyrite mineralization is only
rarely seen, usually in a silicified zone alongside huebnerite.
It should be taken into consideration, however, that trace element cross sections
only cover ground within the main areas of molybdenite mineralization. Farther to the
south and west of the main pit, within one kilometer of the southwest Mo zone, and likely
within the same hydrothermal system (based on proximity and similarity of host rocks,
i.e., still the CGG and its associated units), the tungsten trenches exhibit large quartz
veins with visible but minor chalcopyrite, and abundant huebnerite mineralization (see
Figure 4). Within 4 kilometers of the deposit, roughly towards the south along the trace
of the Boulder Creek fault (Figures 3 and 4), another occurrence of molybdenite
mineralization (in large quartz veins still hosted in the Mount Leonard stock) along with a
tin and base metal skarn (the Silver Diamond, partially hosted within the Mount Leonard
stock) is known to occur (see Introduction of thesis). Both gold and silver mineralization
are known to occur as well within these smaller satellite deposits of Adanac. While the
Adanac deposit itself is not anomalous in these elements (except for W) it is clear that the
Mount Leonard stock produced a range of types of mineralization and trace element
anomalies.
57
Fluorine
Average F values are considered to be >800 ppm while high values are considered
to be >1420 ppm based on natural statistical breaks. The average F content of a low-Ca
granitic rock is 850 ppm (Turekian and Wedepohl, 1961). High F contents tend to extend
further out and above the SQMP and CQMP intrusions than does Mo (compare Figures
36 and 44) and are highest north of the Adera fault (not shown on cross sections), which
is the down dropped upper portion of cross section A-A' (Figure 29). At Adanac, there is
a consistent anomalous F content (801-1420 ppm) in certain rock types, such as CGG.
Because the F background is consistent over a certain rock type this would indicate that
the F is located within a common mineral (most likely biotite) rather than being
controlled by an alteration (like greisen) or veining pattern. The highest F located in the
cross sections is in MGP (mafic because of high biotite content), silicified zones, and
some FGG dykes. High values in silicified zones and FGG dykes may be due to
differentiation, or that the last fluids produced by the porphyry intrusions typically
contained the fluorine. Fluorine values are typically depleted (defined as <800 ppm, or
depleted relative to average low-Ca granitic rocks) within and surrounding the SGP,
CGP, and MEG intrusions.
In the cross sections, very high values of F (>1420 ppm) occur as a small shell in
the MGP above the CGP/SGP intrusion in drillhole 301 and in one FGG dyke in drill
hole 318 (Figure 42). The F pattern between drillhole 321 and 314 (Figure 43) has been
affected by vertical movement. Drillhole 314 is mostly low in F except near the surface,

58
while 321 is consistently high. This trace element pattern is the most compelling
evidence for fault movement between these two holes, and is likely part of the Adera
fault system. In cross section C-C (Figure 44) F shows the typical pattern of being
depleted in the SGP and CGP intrusions but being consistently high in CGG. Silicified
zones to the far south of the intrusions have very anomalous F values (>1420 ppm).
Drillhole 326 has some narrow zones of depletion in the same areas that show Mo and W
anomalies. In cross section D-D' (Figure 45), F is depleted towards the core of SGP and
CGP intrusions. There is one zone in drillhole 343 (fractured) that shows a F anomaly.

59
w Fluorine Cross Section on A-A"
1600
15001
1400 ^
1300
1200
OH 333 DH321 DH318
DH 304 DH 323 DH301
j<430 ppm 430-800 | 1801-1420 ppm I I ppm >1420 ppm
S89000 689300
UTM Easting (ml
689600
Figure 42. Fluorine contours for cross section A-A'. Fluorine anomalies may be lithologically controlled, as they tend to be consistently'high in one rock type (CGG) and low in others (any of the intrusions).

60
NW Fluorine Cross Section on B-B'
DH314
MFP
SE
1500.
c g A
> IU
1400
1300
50 m
DH321
HI
j /^ijieifiel;
T t l ! A ^ - " " "
r
\ \ \
100 200 Distance (m)
< 430 ppm
430-800 ppm
801-1420 ppm
> 1420 ppm
Figure 43. Fluorine contours for cross section B-B'. The F pattern between hole 321 and 314 has been affected by vertical movement.

61
NW Fluorine Cross Section C-C
DH 326
SE
JTHP Silicified
CGG
MGP
>1420 ppm 600
Silicified
Silicified
« l o p j n _ -
800 Distance (rnl
Figure 44. Fluorine contours for cross section C - C F has the typical pattern of being depleted in the SGP and CGP intrusions but being consistently high in CGG.
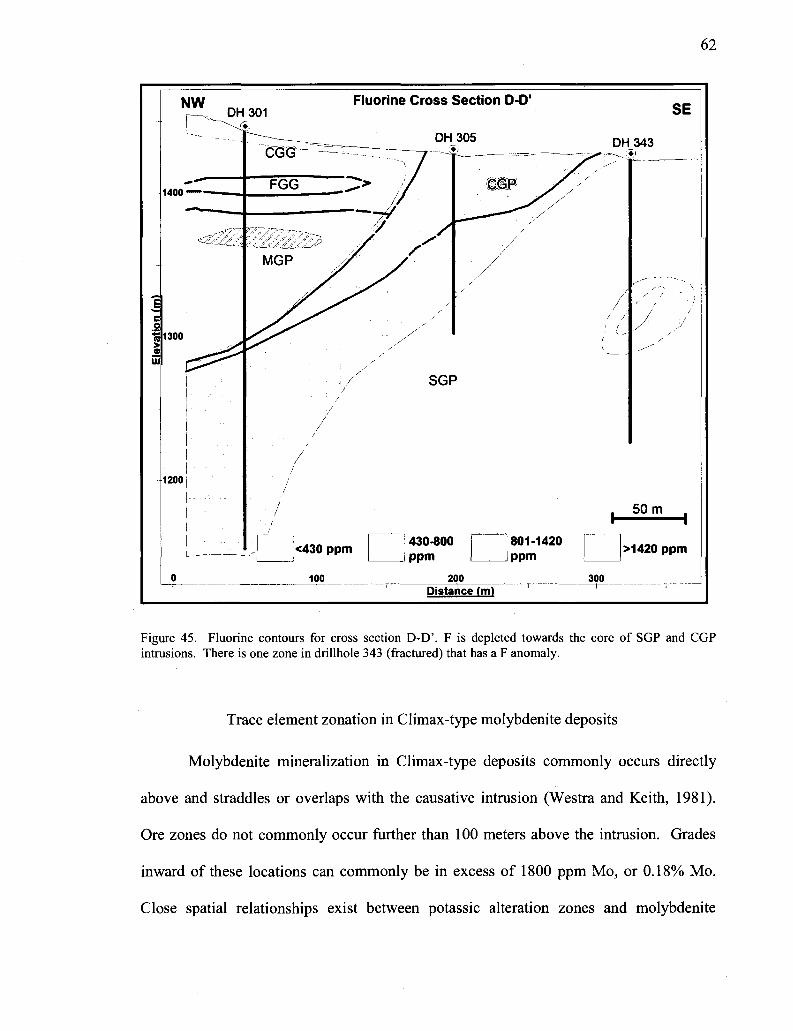
62
Figure 45. Fluorine contours for cross section D-D'. F is depleted towards the core of SGP and CGP intrusions. There is one zone in drillhole 343 (fractured) that has a F anomaly.
Trace element zonation in Climax-type molybdenite deposits
Molybdenite mineralization in Climax-type deposits commonly occurs directly
above and straddles or overlaps with the causative intrusion (Westra and Keith, 1981).
Ore zones do not commonly occur further than 100 meters above the intrusion. Grades
inward of these locations can commonly be in excess of 1800 ppm Mo, or 0.18% Mo.
Close spatial relationships exist between potassic alteration zones and molybdenite

63
mineralization zones. Strongly anomalous fluorine is present within and several hundred
meters peripheral to the molybdenite zone (Clark, 1972). Anomalous tungsten is due to
wolframite or huebnerite (rarely scheelite) mineralization above or coincident with the
molybdenite ore zone. A tin halo may be present with the tungsten halo, or may coincide
with an outer base metal halo. The outer base metal halo (300 - 600 meters above the ore
zone) at Climax has strongly anomalous Zn, Ag, and Mn, and weakly anomalous Pb, Cu,
Bi, and Sn (Westra and Keith, 1981).
Adanac does not have the variety of anomalous trace elements present at Climax
(elements such as Bi, Ag, Mn, and Sn are not anomalous at Adanac). The trace elements
that are anomalous (Pb, Zn, W, F) fit the above descriptions of Climax-type trace element
patterns, and are in similar positions relative to Mo mineralization. The base metal
concentrations of Pb and Zn at Climax are likely located above the main ore zone and
farther away from the causative intrusions because these minerals are deposited at later
paragenetic stages than Mo or W (Clark, 1972). Lead and Zn at Adanac are deposited
almost exclusively in faults or areas of intense fracturing, where it is likely that
paragenetically later and cooler fluids passed through, as evidenced by the abundance of
montmorillonite clays in these locations (see below). In this study which included
observations on 142 thin and polished sections, as well as in all of the field work, there
was no sample where molybdenite and base metal mineralization could be clearly seen to
have a paragenetic relationship, but, it is also likely that the Pb and Zn mineralization in
faults is younger than molybdenite mineralization because these faults always cut
molybdenite mineralization, and no molybdenite is known to have been deposited in
faults.

64
It is also important to note that the cross sections on which these elements were
contoured never really extended past the main ore zone because the deposit was drilled to
define the molybdenum ore body as opposed to the entire hydrothermal alteration zone.
Therefore, there are insufficient data on the potential peripheral zonation of base metals.

65
Chapter 4
Hydrothermal Alteration
Most porphyry molybdenum deposits have a potassic core, a quartz-sericite-pyrite
zone, and outer and upper argillic and propylitic zones (Westra and Keith, 1981). Calc-
alkaline type deposits have poorly-developed potassic zones compared with alkalic or
alkali-calcic type porphyry molybdenum deposits. Alkalic and alkali-calcic deposits are
also more likely to have high silica cores, or silicification zones. At Climax, alteration
zones are more complex and intense, because the deposit formed from multiple intrusions
which caused overprinting of alteration zones (White et al., 1981). Alteration at Climax
does include several high silica zones in the deepest parts of the intrusion, below
mineralized areas (Figure 46). Above silicification and straddling the deepest (and
youngest) intrusion is both the potassic zone and a blanket of tungsten mineralization.
Outward from this core of intrusion and mineralization are the argillic zone (kaolinite and
montmorillonite), QSP zone, and molybdenite ore body (White et al., 1981). The
propylitic zone of alteration is the largest zone of alteration, overprints other alteration
types and also occurs farthest out from the intrusion, and thus provides the exploration
geologist with a large target area to identify when looking for hydrothermal systems.

66
Figure 46. Alteration zoning for an ore body at Climax in relationship to molybdenite and tungsten mineralization, and causative intrusion. Starting at the porphyry intrusion and moving outwards would roughly be a high silica core, a K-feldspar or potassic alteration zone, a sericite-pyrite zone, and an argillic zone. A propylitic alteration assemblage would overprint all of these alteration packages and would also extend furthest out from the porphyry intrusion. Figure from paper by Hall et al., 1974, and originally from Wallace etal., 1968.
Characteristics and Zoning of Hydrothermal Alteration at Adanac
Alteration at Adanac was compared with that at Climax to aid in classification of
the Adanac deposit and to contribute to understanding and characterization of alteration
of these deposit types. The characteristics and spatial relationships of alteration packages
at Adanac are described below. Alteration characteristics were determined from analyses
of 35 polished thin sections, 22 X-ray diffraction analyses of clay altered and fresh rocks,

67
and hand sample (drill core) descriptions. Clay samples were prepared by deflocculation
of clays by grinding and mixing the sample in soapy water and allowing for settling out
of heavy particles for ten minutes. The top portion of the liquid was decanted and
allowed to evaporate, thus leaving behind the clay sample. Quartz impurities from the
original granite were used as an internal standard for X-ray diffraction. Clay samples
were analyzed on a Philips brand XRG 3100 X-ray generator and run for 25 minutes
using CuK radiation at 40 kilovolts and 30 milliamps, and reported at 2-theta. Tabulated
results for clay X-ray diffraction samples are located in the Appendix. Alteration zoning
was determined from drill holes re-logged over summer 2007 with a focus on alteration.
All of the alteration zones are described below in paragenetic order based on cross-
cutting relationships seen in drill core. In general, silicification zones occur closest to the
apices of porphyry intrusions, and potassic alteration zones occur above silicification
zones. Further out from intrusions, the QSP and stilbite-calcite zones occur, along with a
chlorite overprint.
Silicification is characterized by the addition of quartz and opaque minerals,
typically pyrite. Silicification occurs as patchy zones that extend for one foot to several
feet in drill core (Figure 47). Silica replacement is estimated from thin sections to be
anywhere from 70% to 25% of total mineralogy in thin section. Quartz is seen replacing
feldspars and biotite (Figure 48) or chlorite, suggesting there may have been some early
propylitic alteration before silicification. Opaque minerals added during silicification
include, in paragenetic order from oldest to youngest, 1) magnetite 2) pyrite 3)
chalcopyrite, and typically comprise 10% of total minerals in thin section (Figure 49).
There is rarely some pyrrhotite, galena, and sphalerite seen with chalcopyrite. Opaque

68
minerals are found disseminated and in veins. Magnetite commonly replaces biotite or
chlorite and pyrite and chalcopyrite replace the magnetite and biotite or chlorite. Pyrite
and magnetite are the most abundant opaque minerals. About one-third of the biotite is
altered to chlorite or (less commonly) sericite. Sericite also rarely occurs replacing
feldspars. Clay alteration occurs as replacements of feldspars in the center of the crystal,
but does not destroy textures, and clay minerals make up only about 5% of the rock.
XRD analyses of silicification zones indicate most clay alteration products are illite,
kaolinite and chlorite are common, and montmorillonite is absent.
Silicification zones occur at depth on the western end in cross section A-A'
(Figure 50). Zones of silicification in this area are common and may extend for up to 6
feet in drill core. Silicification extends to other areas in the cross sections as smaller
patchy zones that form sill-shaped bodies traceable from one drill hole to the next (Figure
51). They do, however, become less frequent and smaller (one foot) away from the
deeper western end, near hole 333. This likely means that drill hole 333 is approximately
centered over the most intense silicification. Silicification zones appear to drape over and
extend into the MEG intrusion on the west, and drape over the SGP and CGP intrusions
to the east (Figure 50 and 51), but have largely disappeared in the far SE (Figure 52).

69
* * > * . #
• ^ • e ^ f e l • • * - • » ' v. ^ • f c » i HI TT MIIT 1861
Figure 47. Silicification in drill core, drill hole 24, 544ft.
Figure 48. Silicification of biotite in thin section. Crossed polars, From drill hole 326, 132ft.

70
Klagnefflta
.^%i
w n
ommsm
Figure 49. Photomicrograph of opaque minerals in a silicified zone. Reflected light, drill hole 348,488ft.

71
Figure 50. Hydrothermal alteration on cross section A-A'. The colors represent geologic units and are the same as in Chapter 3.

72
NW Alteration Cross Section C-C"
DH326
SE
TTnTTT-T^-T;::^ -T^ -^ IWt i i
: :^i4-':::^+::::^ : : : : : : : : : : • : ' : : : • : • : • • . • . • • • - • . • . • • • • • . • . •
:: :^+::::^::::V " I " » * I ' • * I ' I * • *• " *•"*
j:i:::jii::::i4;:;
••^•'••'•^jiSSSSt
::: r^T+JjSSSSP?^
::-:-::-:-:-; ;i5j!BI
-^+- -B-f-
-3-f- -*-6-
-i- -*->• -«-
- i - i - -i-fr-
rs^TrTop1
• - T - - —
-T-T- ^ +
. J .
••:::^»::::V^: : • : • : • : • : • : • : • : • : •
::::::::::::::::::
lPPP* :::.*+: ^iiilHHiliiH -: = :H^::::*^*:: : • : • : * : • : • : • : • : - : •
4i^;: :^i»:::: i i
pi - - H - ^ « -
- * • + - * - • • •<
-*-+• -i-*- -«
- -»-+• •+-*-
&g£5&^ —r- ^— -i . - _ _ J .
- " - -t . - ^ - .i-L.
Distance (nfiT
Figure 51. Hydrothermal alteration zones on cross section C-C.

73
NW Alteration Cross Section D-D'
0 100 200 300 ' ' 1 Distahce (m> r
Figure 52. Hydrothermal alteration zones in cross section D-D'.
Potassic alteration is characterized by unaltered, pink potassic feldspar that occurs
as replacement of primary feldspars (Figure 53) and biotite in zones (floods) that extend
from 1-3 feet in drill core, or as a high frequency of pink feldspar envelopes around
quartz veins (Figure 54). Figure 55 shows both primary and secondary potassic feldspar
in photomicrograph. Secondary biotite occurs in the feldspar floods (Figure 56), and is
consistently fresh, or not altered to chlorite as in silicified zones or the stilbite-calcite
zone (described below). Secondary biotite is typically 2-3 mm in size. It is characterized

74
by shredded, anhedral crystals. In thin section, pyrite is typically absent, but magnetite
may be present. There is some clay alteration of feldspars which is most likely illite,
based on XRD analysis of several samples of feldspar flood zones. Kaolinite and chlorite
are rare, and montmorillonite is absent. Clay alteration products are least common in
potassic altered rocks, and clay minerals comprise only 2-3% of the total rock. Several
samples contain fluorite that appears to be cogenetic with secondary potassium feldspar,
based on the observation that fluorite has interlocking grain boundaries with these
feldspar crystals. Calcite grains (<0.1 mm) cluster around biotite, or occur with fluorite
grains and have common grain boundaries with fluorite. There are abundant calcite
grains in most samples, which appear to be cogenetic with potassic alteration because,
like fluorite, it was observed to have interlocking grain boundaries with secondary
feldspars.
Potassic zones occur above the main silicification zones on the western end of A-
A' and overlap with the upper sill-shaped bodies of silicification (Figure 50), and extend
towards the east and south (Figure 51). The potassic alteration zone is most pronounced
(largest, and has more intense replacement) on the SW end similar to the silicification,
and occurs coincident with and above the silicification zone here. The character of the
potassic alteration zone on the west end of the cross section (Figure 50, A-A') is distinct
from that of the east end, because on the west side of the deposit there are large zones (up
to 7 feet) of near total pink feldspar replacement of primary mineralogy. On the east and
south end, above the SGP intrusion and within the CGP and the SGP, potassic alteration
consists mostly of pink feldspar vein envelopes or selvages. On the far southeast, zones
of potassic alteration are not present (Figure 52).

75
Figure 53. Feldspar flooding in drill core. The pink area, about 5 cm wide, is a feldspar flood with small dark patches of secondary biotite. The arrows point to molybdenite crystals on either side of the flood. These molybdenite crystals may be cogenetic with feldspar flooding and were tested for a Re-Os mineralization age (see Chapter 6). This type of potassic alteration typically occurs in the western end of the deposit. From drill hole 369, 650ft.
Figure 54. A typical feldspar envelope (white-pink envelope) around a quartz vein (grey). This type of potassic alteration is typically found in the central pit area. From drill hole 351, 671 ft.

76
Figure 55. Primary and secondary feldspar in photomicrograph. Primary feldspar typically has defined and sharp crystal edges, while secondary feldspar has jagged or irregular edges, and replaces other feldspars. Drill hole 305, 343ft, crossed polars.

77
Figure 56. Secondary biotite in thin section. Drill hole 305, 343ft, plane light.
The phyllic. or quartz-sericite-pvrite (OSP) zone is characterized in hand sample
by 1 -3 mm veinlets or hairline fractures filled with minor quartz, abundant sericite, and
pyrite (Figure 57), with sericite and pyrite also extending into 1-6 cm envelopes around
the veins or fractures. In the QSP zone, which is peripheral to the zones containing
abundant silicification and feldspar flooding (for example, drill hole 348 on cross section
C-C, Figure 51), the rocks begin to appear greenish, olive-colored, or have a brown hue
(Figure 58). In thin section there is an increased amount of clay alteration in this zone
compared with silicified and potassic alteration zones, with most feldspars typically
having centers that are texturally destroyed. The total amount of clay alteration is
estimated to destroy 20% of original mineralogy. The alteration of biotite to chlorite is

78
common in the QSP zone. Clay minerals in the QSP zone are dominated by kaolinite and
chlorite, with illite also being common. Montmorillonite is absent.
The quartz-sericite-pyrite alteration zone occurs in the eastern portion of A-A',
and in the southern portions of the deposit, represented in cross sections C-C' on the
southeast side and the entire section D-D' (Figures 51 and 52). The QSP zone is seen in
drill hole 323 above and on the margins of the SGP, and overlapping and overprinting a
smaller zone of silicification (Figure 50). QSP alteration is typically absent in the deeper
portions of the SGP and CGP intrusions, and on the west side of cross section A-A'
where silicification and potassic alteration are most intense.
Figure 57. This core broke along the plane of QSP fracture fill. Most of the surface shown in the photo is sericite, but a small amount is pyrite. From drill hole 338, 105ft.

79
* *
Figure 58. Appearance common of clay alteration outside the potassic and silicification zones. Feldspars in this area are commonly texturally destroyed and altered to kaolinite, and biotite is altered to chlorite. This rock is cut by an open fluorite-filled fracture from the stilbite-calcite alteration phase. From drill hole 18, at 481ft.
The stilbite-calcite zone is characterized in hand sample by 2 mm to 3 cm-sized
fractures that are filled with calcite and stilbite, + fluorite (Figure 58, 59 and 60). These
fractures cut other alteration types including silicified zones and potassic zones.
Fractures may be completely filled with calcite and stilbite or sometimes are open and
contain only vuggy, euhedral stilbite. Wall rocks also have a greenish or bluish hue,
similar to the QSP alteration, probably the result of chlorite. Fluorite is present with this
stage of alteration, occurring as vein fill along with both calcite and stilbite. In thin
section, stilbite is confined to veins and fractures, but both calcite and fluorite are seen in
adjacent wall rock. Clay alteration in this zone is similar to that in the QSP zone. Clay
alteration is more common than in zones of silicification and potassic alteration. Centers
of feldspars are destroyed texturally, and replaced by clay minerals. These clays are

80
primarily kaolinite, with chlorite and illite being common as well. Clay alteration is
estimated from thin section to replace 20% of total primary minerals. The stilbite-calcite
zone overprints the phyllic zone further to the east in cross section A-A', and is entirely
coincident with the phyllic zone in the southern portions of the deposit. Neither the
phyllic or stilbite-calcite zones appear in deeper, fresher portions of the SGP/CGP
intrusion in cross section D-D'.
Figure 59. Stilbite-calcite alteration. The open fracture (horizontal in this photo) is filled with mostly stilbite (the yellow drusy mineral), but these fractures commonly contain a white powdery or yellow crystalline calcite, and more rarely fluorite. The fractures with the stilbite-calcite assemblage cut all other alteration types and mineralized veins. The fracture in the picture was probably an earlier mineralized vein (notice the feldspar envelope and the quartz running up the length of the fracture on the left side) that experienced displacement and dilation, and was later filled with the stilbite. From drill hole 01, at 981ft.

81
Figure 60. Fractures cut through a quartz crystal and are filled with calcite and stilbite. The grainy material in the middle of the calcite-filled fracture is brecciated quartz from faulting, which indicates that the calcite-stilbite alteration post-dates some faulting. From drill hole 314, 636 ft, crossed polars.
Faults, or rock that exhibits gouge or crumbling in the drill core, have a dirty
olive green or brown appearance. In thin section, the feldspars are texturally destroyed
and contain black, white, and dark brown patches (Figure 61). These rocks are always
dominated by montmorillonite and kaolinite, commonly contain chlorite, and less
commonly contain illite. These rocks almost certainly allowed (post-ore) low-
temperature fluids to pass through them, and montmorillonite may be the product of these
fluids based on its presence exclusively in faults.

82
Figure 61. In faults, clay replacement of certain minerals (likely a feldspar) can be complete. X-ray diffraction shows that kaolinite, chlorite, illite, and montmorillonite are all present in faults, montmorillonite being observed only in faults. From drill hole 326, at 618 ft.
Discussion
Based on the trace element patterns at Adanac compared with those of Climax-
type deposits, there are two possible causative intrusions for mineralization and
alteration. The CGP/SGP intrusion is a possible choice when one considers the eastern
end of the deposit at drill hole 301 because mineralization, silicification, and potassic
alteration straddle the outer contacts of the intrusion (Figure 34 an 50). However, drilling
in 2005 discovered a high-grade zone at the western end of the deposit (drill hole 333, for
example) where no SGP or CGP is known to exist, and this high-grade zone sits above

83
the MEG intrusion (Figure 34). It may be that both the CGP/SGP intrusion and MEG
intrusion caused mineralization and alteration at Adanac, and, given the similar
geochemical nature of CGP/SGP and MEG intrusions (see Chapter 2), they may be
different textural phases of the same intrusion. Since the two intrusions are straddled by
halos of mineralization and alteration, it is likely that hydrothermal fluids were generated
during the introduction of both of these intrusions.
The pattern of alteration zoning at Adanac conforms to that of Climax-type
molybdenum deposits, although alteration at Adanac is not as intense. At Climax,
alteration is more intense, and it commonly occurs as total replacement of minerals
except for quartz phenocrysts (Hall et al., 1974). Alteration at Climax is also more
intense than at Adanac because of multiple overlapping intrusions and resulting
overlapping alteration zones. While the trace element pattern at Adanac leaves the
observer to question whether either or both of the CGP/SGP intrusion and MEG intrusion
are the source of mineralization, the alteration pattern more clearly points to MEG as the
causative intrusion, because both silicification and potassic alteration are more
pronounced at the western end above the MEG, and this is evidence of a more intense
hydrothermal system being generated from this intrusion.
Because Adanac has both intense silicification and potassic alteration zones, the
Adanac deposit is more like an alkalic, or Climax-type porphyry molybdenum deposit
than a calc-alkalic molybdenum deposit. The alteration types and patterns seen at
Adanac thus is consistent with what would be expected based on geochemical
information described above from Adanac, such as high Rb and low Sr, high silica
contents, and the K2O value at 55 wt % silica.

84
Chapter 5
Molybdenite Polytype Study
Molybdenite Polytypism
Molybdenite occurs in one of two polytype structures: the common 2H type, or
the exotic 3R type (Newberry, 1979). The 2H polytype is a hexagonal mineral consisting
of two layers per unit cell. The rare 3R type is a rhombohedral mineral consisting of 3
layers per unit cell. Both types are closely stacked planar S-Mo-S layers that differ only
in the length of the c axis. Some studies suggest that the 3R polytype grows by a screw-
dislocation mechanism and is unstable relative to 2H but does not convert readily to the
latter because of kinetic barriers (Newberry, 1979). Screw dislocations occur most
frequently in nature due to internal strains caused by impurities, mainly rhenium when
considering molybdenite. The other more common impurities in molybdenite are tin,
titanium, bismuth, iron, and tungsten. Other authors suggest that the differences in
polytypes are the result of sulfur fugacities, i.e., the 3R polytype forms in exotic low
sulphur-fugacity environments and is sulfur-deficient relative to 2H (Clark, 1970). It has
also been suggested that molybdenite polytype plays a role in Re concentration (Ayres,
1974), and that temperature and depth of ore formation is a controlling factor of
polytypism (Ishihara, 1988).
Whatever the cause of polytypism, porphyry molybdenum deposits, tungsten-
molybdenum skarns, and pegmatites that bear molybdenum are generally associated with
low rhenium concentrations in molybdenite (10-100 ppm, 30-400 ppm, and 0.1 - 100

85
ppm, respectively) while molybdenite from porphyry copper-molybdenum deposits and
copper-molybdenum skarns has higher rhenium concentrations (100-3000 ppm, and 50-
800 ppm, respectively). This may be why molybdenum deposits with no copper have
almost exclusively the 2H type molybdenite. The latter group of copper-bearing
molybdenite systems typically have a mix of 2H and 3R polytype, and have been known
to have up to 95% of molybdenite in a deposit be of the 3R type (Newberry, 1979). The
purpose of testing whether or not molybdenite is exclusively 2H or is a mixture of 2H and
3R is to aid in classifying the deposit. If there is a mixture of the two polytypes at
Adanac, it may mean that there is more copper at Adanac than has been currently drilled.
Sample Analysis
Samples were prepared by extracting molybdenite from host rock using a hammer
and tweezers. Samples were ground and then floated in water to separate molybdenite
from other particles. The floating molybdenite was then scooped off the top of the water
and sprinkled onto a Vaseline-coated slide so that the mineral would be randomly
oriented. Seven samples of molybdenite were analyzed for polytype on a Philips brand
XRG 3100 series X-ray diffractometer for 30 minutes each using CuK alpha radiation at
40 kilovolts and 30 milliamps. Samples were run from 30 to 50 degrees two-theta with a
step of 0.1 degrees and a dwell time of 0.45 seconds. Pure NaCl was used as an internal
standard.

86
Results and Discussion
All molybdenite crystals analyzed on the X-ray diffractometer were of the 2H
type (Table 2), and therefore consistent with other porphyry molybdenum deposits with
no copper. There was no variation of polytype seen with age, location, vein type, or
original (pre-preparation) crystal size. The 2H polytype is easily distinguished from the
3R polytype in XRD scans due to two weak peaks at the start of the scan. The 3R
polytype has these same peaks, but the peaks are strong. One of the scans is shown in the
appendix (A-23) for example.
The Re concentration of molybdenite at Adanac was determined during Re-Os
analysis for dating of mineralization (Table 4 in Chapter 6) and ranges from 5.5 to 39
ppm. The lower end of the Re concentration at Adanac is actually below reported
average values for porphyry molybdenum deposits, which is 10-100 ppm (Newberry,
1979). This may actually mean that there is more molybdenite at Adanac than has been
discovered by drilling. This is because Re concentration in molybdenite may be
reflective of bulk molybdenite deposition: larger deposits like Climax have very low Re
concentrations presumably because the total Re in the hydrothermal system is contained
mostly within the molybdenite, and there is a lot of molybdenite. For a complete
discussion on this topic, refer to the Re-Os isotopic analysis and reported Re
concentrations in Chapter 6.

87
Sample ID:
(drill hole
and footage)
352-413
375-1036
375-1054
375-1125
313-110
314-858
364-501
Location and Description
N of the Adera fault in SQFP. Very fine molybdenite crystals in a smoky quartz vein.
Very fine molybdenite in a wispy, ribbon textured vein within 5 feet of the paragenetically later vein types (milky quartz, brittle and sharp contacts with host rock, not a ribbon textured vein).
Disseminated molybdenite in a feldspar flood
Large rosette molybdenite in a paragenetically late milky white quartz vein with brittle and sharp contact with host rock.
SW end of deposit, N of Adera fault. Coarse molybdenite in quartz vein.
West end of deposit, coarse molybdenite in quartz vein.
Central pit. Coarse molybdenite + other sulfides and oxides chalcopyrite, wolframite, magnetite, pyrite) in white quartz vein.
Polytype
. 2H
2H
2H
2H
2H
2H
2H
Table 2. Results and sample descriptions of molybdenite X-ray diffraction polytype study.

88
Chapter 6
Geochronology of the Adanac Molybdenum Deposit, British Columbia
Re-Os ages of molybdenite and U-Pb ages of various lithologies at Adanac were
determined in order to compare ages of mineralization and magmatism. One goal of this
study was to identify the causative, or mineralizing intrusion by matching a
mineralization age with a magmatic age. Another goal was to constrain the life span of
the hydrothermal system at Adanac. The results of this study can be also be used to
compare Adanac to other porphyry molybdenum deposits. Age and number of
mineralization events (multiple or single) are criteria commonly used to classify porphyry
deposits (Clark, 1970).
Re-Os Mineralization Ages
Four samples of molybdenite were analyzed for Re-Os isotopic age in order to
constrain mineralization ages at Adanac. Samples are listed below in Table 3, with a
description and an inferred relative age based on cross-cutting relationships or known
characteristics of Climax-type porphyry molybdenum deposits (i.e., molybdenite
associated with other base metals in porphyry deposits are usually later mineralization
events). Figure 62 shows a schematic diagram illustrating cross-cutting relationships
seen in drill-core. All samples were hosted in CGG.
The first 3 samples in the table are all from drillhole 375, which was drilled in the
western end of the deposit where the suspected mineralizing intrusion is located (see
Figure 29). They were selected based on differences in vein type (discussed below) or
89
other host (feldspar flood). Their location in one drill hole within 30 feet of each other
adds confidence to the assumption that any differences in ages are not correlated with
distance from each other in the deposit but represent temporal changes in vein type. The
last sample, 364-50, was chosen from the central part of the deposit, in the blanket of
mineralization located above the SGP and the CGP intrusions.
Sample 1: 375-1054. This molybdenite was disseminated in a feldspar flood in the
potassic-altered core of the deposit.
Sample 2: 375-1036. This molybdenite was in a ductile, ribbon-textured vein. The
quartz in these vein types is usually dark and sooty colored, either from fine molybdenite
or because it is smoky quartz. Veins that carry this type of molybdenite and exhibit dark,
sooty coloration are usually small (~ 2 cm) and consistently bear molybdenite. Other
quartz veins bearing molybdenite are commonly seen to cut these vein types.
Sample 3: 375-1125. This molybdenite was in a large, 4-6 cm milky-white quartz vein.
Molybdenite in these veins usually forms large 2-5 cm rosettes. The contact of the vein
with the host rock, in contrast to the previous sample, is sharp. These veins less
frequently carry mineralization and are sometimes barren. This vein type commonly cuts
other vein types.
Sample 4: 364-50. This molybdenite was taken from a vein cutting CGG that had an
abundance of other visible opaque minerals, such as pyrite, chalcopyrite, wolframite, and
magnetite. No distinct temporal relationships with other vein types were observed.
However, it is typical in Climax-type porphyry molybdenite deposits to have
mineralizing events that have specific temporal relationships that can be partially defined

90
by associated sulfides, such as early events that bear molybdenite only, and later events
that bear molybdenite + pyrite (Westra and Keith, 1981). Therefore, this sample was
dated to assess the possibility that this vein represents a separate and distinct late
mineralizing event.
Sample
375-1054
375-1036
375-1125
364-50
Location
southwest end
southwest end
southwest end
central mineralized
blanket
Host Rock
CGG
CGG
CGG
CGG
Vein Type
No vein, feldspar
flood
2cm ductile ribbon
textured vein with
fine molybdenite
large, 5cm milky white quartz vein
with molybdenite
rosettes
4 cm milky white quartz
vein
Associated Minerals
feldspar
none
none
pyrite, chalcopyrite, wolframite, magnetite.
Probable Paragenesis
1
2
3
4
Table 3. Molybdenite Re-Os samples. The sample ID refers to the drillhole and the depth
from which it was taken.

91
/ * / / J? /
/ £/ / f / <? / / / / / f* /
/ / / / / / / w / / O /
/ * /
/ / / / / /
/ / / A i f & A\ s / of AW
Jr / ^Aw 4 / if Aw / fAW / &Aw
/ #W / 4?W
375-1125 brittle, sharp
contact vein,
#3
J ^f^^^^^^r w
SAW^ A^T
AWT AW^
A*r W^ 374-1054
Feldspar Flood #1
Molybdenite Re-Os Samples Host Types and Cross-Cutting
Relationships (ordered oldest-youngest)
Figure 62. Schematic diagram showing paragenetic relationships (seen in drill core) of the four Re-Os molybdenite samples. Sample 364-50 may have no cross-cutting relationships with the other samples, but it is presumed to be last based on a high base metal content. Base metals are usually deposited after main molybdenite mineralization in alkalic porphyry molybdenum deposits.
Samples were prepared by breaking apart the host rock with a hammer on a clean
surface (a sheet of paper) and molybdenite was handpicked with a pair of tweezers. The
molybdenite was ground in a steel mortar and pestle and placed in a small dish of water.
Because molybdenite is a micaceous mineral, surface tension of water held the thin
mineral particles at the top of dish while feldspar, quartz, and other impurities sank to the
bottom of the dish. The water containing the floating molybdenite was decanted and
allowed to evaporate. Samples were then examined under a binocular microscope and
any other impurities were removed with tweezers. Tweezers, hammer, mortar and pestle,

92
and the dish were washed with soap and water between samples. Samples were then sent
to the Re-Os geochronology lab at the University of Arizona at Tucson.
At the lab, samples were handpicked and loaded in a Carius tube and dissolved
with 8 ml of reverse aqua regia. The tube was heated to 240°C overnight, and the
solution later treated in a two-stage distillation process for osmium separation (Nagler
and Frei 1997). Osmium was further purified using a microdistillation technique, similar
to that of Birck et al. (1997), and loaded on platinum filaments with Ba(OH)2 to enhance
ionization. After osmium separation, the remaining acid solution was dried and later
dissolved in 0.1 N HNO3. Rhenium was extracted and purified through a two-stage
column using AG1-X8 (100-200 mesh) resin and loaded on platinum filaments with
Ba(SO)4. Samples were analyzed by negative thermal ion mass spectrometry (NTIMS)
(Creaser et al., 1991) on a VG 54 mass spectrometer. Osmium was measured using a
Daly multiplier collector, and rhenium using a Faraday collector. Isochrons and weighted
means are calculated using Isoplot (Ludwig 2001).
Molybdenite ages are calculated using a Re decay constant of 1.666 x 10 year
(Smoliar et al. 1996). Uncertainties for molybdenite analysis include instrumental
counting statistics and in the 187Re decay constant (0.31%). In this work, uncertainties are
calculated using error propagation, taking in consideration uncertainty in the rhenium
decay constant.

93
Sample ID
375-1054
375-1036
364-50
375-1125
Total Re (ppm)
9.521
8.011
5.572
39.0
187Re (ppm)
5.96
5.015
3.488
24.42
1870s (ppb)
7.036
5.828
4.048
28.38
Age (Ma)
70.87
69.71
69.61
69.72
Error 2o
(0.5%)
0.36
0.35
0.35
0.35
Sample Host
Feldspar flood in
CGG Ductile ribbon vein, in CGG With base
metals, in CGG Large, brittle contact vein, in CGG
Expected Relative
Age (oldest -
youngest)
1
2
4
3
Measured Relative
Age (oldest-youngest)
1
2
2
2
Table 4. Summary of data for Re-Os mineralization dates.
Sample 375-1054 was molybdenite disseminated in a. feldspar flood on the western
end of the deposit and, as expected, was the oldest sample at 70.87 Ma. It was not
surprising that this was the oldest sample because this molybdenite was disseminated in a
feldspar flood, and potassic alteration is commonly early in the sequence of hydrothermal
events. There was no distinction in ages between the other 3 samples (375-1036, 364-50,
and 375-1125) when one considers the error of 0.35 Ma. All three mineralization events
occurred in a relatively restricted time of less than 1 m.y. Besides the calculated isotopic
age, there are other factors to consider when determining paragenetic sequence. First,
cross-cutting relationships cannot be ignored. The molybdenite in smoky quartz veins
with a ribbon texture and a ductile contact with host rock is consistently seen to be cut by
thicker milky white quartz veins that usually bear less molybdenite. Therefore, this vein

94
type (sample 375-1036) is clearly older than veins with milky white quartz, even if they
may be a part of the same mineralization event.
Based on the Re-Os results, 375-1125 should be placed as the last and youngest
sample, based on using the Re concentration as a proxy for fluid evolution. It makes
more geologic sense for molybdenite samples being deposited to maintain a somewhat
consistent Re concentration until there is some change in environment to force deposition
of the element within the molybdenite. In other words, it does NOT make sense for the
hydrothermal system to go from depositing molybdenite with 8 ppm Re, then to 39 ppm,
and then back to molybdenite containing 5.6 ppm Re. It makes more sense for the Re
concentration to jump at the end stages of mineralization because the element has
nowhere else to go, and molybdenite deposition at the end stage of the hydrothermal
system must incorporate all the remaining Re thus increasing the concentration.
It is a possibility that, because no cross-cutting relationships were observed between
the base metal-carrying vein and other samples, that the vein represents the same
paragenetic stage as sample 375-1125, but locally, the Re in the fluid may have been
divided between some of the other minerals: magnetite and chalcopyrite, although there
is no analysis at Adanac for Re content in minerals other than molybdenite. An addition
of Re to other minerals would explain the low Re concentration in sample 364-50. This
scenario puts the paragenetic order of the base metal vein in line with what is observed in
other porphyry molybdenum deposits, namely, that base metal stages usually occur last
(Westra and Keith, 1981).

95
The Re concentrations reported for these samples are among the lowest reported
for porphyry molybdenum deposits. Fleisher (1959) and Riley (1967) report that Climax-
type molybdenite deposits usually have less than 100 ppm Re in molybdenite, and are
more commonly under 20 ppm, while other molybdenite deposits (including low-fluorine
Endako type porphyries) contain hundreds to even thousands of parts per million Re.
The cause of Re concentration variability has been a source of debate. It has been
suggested that 1) molybdenite polytype plays a role in Re concentration (Ayres, 1974), 2)
bulk Re concentration in hydrothermal systems of Mo porphyry versus Cu-Mo
porphyries is a controlling factor (Schindler 1976), 3) temperature and depth of ore
formation is a controlling factor (Ishihara, 1988), and also that 4) oxygen fugacity
controls Re concentration and volatile transport (Bernard et al., 1990). Further discussion
of the true cause of Re concentration variability in porphyry molybdenum deposits is
beyond the scope of this paper, and may be a combination of one or more of the above
factors. As reported by Fleisher (1959) Re concentrations in molybdenite range from 5 -
28 ppm at Climax and 8 - 1 2 ppm at Questa, which are the lowest values reported and
similar to Adanac. Re concentrations for the Jinduicheng Climax - type porphyry
molybdenum deposit in China are reported at around 17 ppm (Stein et al., 1997).
However, recent analyses of the Endako porphyry molybdenum deposit do not
support the observation that Re concentration can always be correlated with porphyry
type (Selby et al., 2001). Eight molybdenite samples tested at Endako range from 9 ppm
to 38 ppm Re, but at the nearby Nithi Mountain molybdenite occurrence (geologically
and geochemically similar to Endako, but subeconomic) the Re concentration is higher
(77 ppm). In the Endako deposit proper, Re concentration could not be correlated with

96
alteration, vein type, polytype, or temperature of formation (Selby et al., 2001). This
suggests that if Re is present in the hydrothermal fluid, the amount of Re deposited in
molybdenite is controlled by bulk molybdenite deposition, regardless of other features of
the deposit.
This also suggests that Adanac, given its somewhat low reported Mo grade, may
actually be higher grade or larger than is currently thought. If bulk Re concentration is
usually high in porphyry deposits bearing molybdenite, then the low Re concentration in
molybdenite may be explained by postulating that there is more molybdenite elsewhere in
the deposit. This is entirely feasible, as the deposit is not fully explored, the mineralizing
intrusion is not identified yet, and the geographic limits and expanse of the deposit have
not been identified or drilled.
U-Th-Pb Magmatic Ages
There has been previous work on magmatic ages of the Mount Leonard Stock and
the Surprise Lake Batholith. Mihalynuk et al. (1992) report a U-Pb age of zircons from
the Surprise Lake Batholith as 83.8 Ma. Christopher and Pinsent (1979) obtained K-Ar
ages of biotites from some lithologies within the Adanac deposit. The average age was
70.6 Ma, and the individual ages of each lithology are shown below in Table 5.
CGG MGP SGP MEG
71.6 + 2.2 70.3 + 2.4 71.6 + 2.1 71.4±2.1
Table 5. K-Ar Ages (Ma) as determined by Christopher and Pinsent, 1979. Lithologies are using new terminology described above.

97
For this study, a total of seven samples from Adanac were analyzed for U-Th-Pb
ages in zircons in order to constrain the duration of magmatism of the Mount Leonard
stock, re-test some of the ages reported by Pinsent et al., determine ages of some new
lithologies not tested previously and for which relative ages were obscure, and to identify
the intrusion responsible for mineralization by comparing the ages of molybdenite to the
ages of lithologies. Predicted ages of lithologies at Adanac are summarized in Figure 8 in
Chapter 2.
Samples were collected on site at Adanac and crushed with a rock crusher before
being bagged. In between samples, the crusher was washed with soap and water and
vacuumed. Samples were then sent to the Arizona LaserChron Center in Tucson,
Arizona. Here, samples were run through a pulverizer to reduce the sample to sand-sized
grains. In between samples, the pulverizer was cleaned with soapy water, a wire brush,
and vacuumed. The samples then went through the first of two gravity separation steps, a
Wilfley table separation, after which a hand magnet was used to remove magnetic grains.
The sample was processed in methylene iodide, and then magnetic grains were removed
with a Franz magnetic separator. The zircons were stored and carefully labeled. Mounts
were made by selecting and arranging zircons and standards on a piece of tape, epoxying
the sample, sanding, labelling, and finally, imaging the sample with enough detail so that
individual grains can be seen.
U-Pb geochronology of zircons was conducted by laser ablation multicollector
inductively coupled plasma mass spectrometry (LA-MC-ICPMS) at the Arizona

98
LaserChron Center under the direction of Victor Valencia, during the month of June
2008. The ablation of zircons was done with a New Wave/Lambda Physik DUV193
Excimer laser operating at a wavelength of 193 nm, using a spot diameter of 25 microns.
Ablated material was carried into a GV Instruments Isoprobe, where U, Th, and Pb
isotopes are measured simultaneously in static mode. Each individual zircon analysis
began with a 20-second integration on peaks with the laser turned off (for backgrounds)
and then 20 one-second integrations were completed on each zircon with the laser firing.
The laser operated at 23 KV with a repetition rate of 8 Hz. The resulting ablation pit was
12 micrometers across. Inter-element fractionation was monitored by analyzing crystals
of SL-1, a large concordant zircon crystal from Sri Lanka with a known (isotope dilution
- thermal ionization mass spectrometry) age of 564 + 4 Ma (2a) (G. Gehrels, unpublished
data). The reported ages for zircons from Adanac are based entirely on 206Pb/238U
ratios. The errors of 207Pb/235U and 206Pb/207Pb analyses were too large for the ages
to be considered reliable because of the low intensity signal (<0.5 mV) of 207Pb from the
young (<lGa) zircons. The 206Pb/238U ratios were corrected for common Pb by using
the measured 206Pb/204Pb, the common Pb composition as reported from Stacey and
Kramers (1975), and an uncertainty of 1.0 unit on the common 206Pb/204Pb.
Zircon crystals that were analyzed by the laser but showed evidence of lead loss
or assumed to be metamictic were ignored. A crystal was determined to have suffered
lead loss if, as the laser analyzed successive layers of zircon crystallization deeper into
the center of the crystal these ages did not plateau or become stable (explained in more
detail below). Also, the crystal could be visually determined to be metamictic by

99
displaying a characteristic honey-brown color, indicating radiation damage to the crystal
and thus a mechanism for lead loss.
The reported age of each sample is the weighted mean of 30 individual zircon
analyses, excluding crystals that were then statistically assumed to have experienced lead
loss or statistically assumed to be inherited. A crystal was statistically identified as being
inherited or suffering lead loss if its reported age was outside of a coherent population of
ages (at the 95% level). The weighted mean of all of the crystals believed to have a
reliable age was calculated according to Ludwig (2003). The mean considers random
errors (i.e., measurement errors). Age of standard, calibration correction from standard,
composition of common Pb, and decay constant uncertainty are contributors to the error
in the final age determination. All of these uncertainties are grouped as the "systematic
error." Rocks at Adanac displayed a range of 0.9 -1.7% in systematic error. The error in
the actual age of the sample is determined by quadratically adding the systematic and
measurement error. All age uncertainties are reported at the 2-sigma (2a) level.
Dated lithologies include CGG, CGG-T, SQFP, MFP, MEQM, and two samples
of FGG. CGG, CGG-T, CGG-H, CQFP, and SQFP are all essentially the same intrusion.
They are certainly the oldest rocks (see Chapter 2). The contacts between them are
gradational, the coarse grained unit (CGG) grades upward and outward into both the
transitional and hybrid varieties with increasing groundmass content, or becomes more of
a porphyritic unit. Considered separately and slightly older than these three lithologies
are CQFP and SQFP, which are basically the porphyritic equivalents of CGG and its
transitional and hybrid varieties. They were at one time the upper margin of the intrusion
based on geographic location but the Adera fault has dropped these units to the north.

100
One sample of CGG, CGG-T, and one sample of SQFP were submitted for U-Pb zircon
dating to get an older limit on magmatic ages at Adanac.
Based on cross-cutting relationships, MGP and then the SGP and CGP intrusions
were emplaced. Like the CGG and -T and -H units, SGP and CGP are essentially the
same intrusion with gradational contacts, and their designation as a separate unit is based
on distinct geographic locations and differing phenocryst content. These three units were
not dated because units both older and younger were tested, and this constrains the ages
of these units to within a relatively small range of geologic time.
The relative ages of MEG and MFP are somewhat less certain than other units.
MEG occurs as an intrusion at depth on the southwest end of the deposit, and cuts both
CGG and CGG-T. The MFP unit is a dike that cuts the CGG, CGG-T, and the SGP and
CGP units. It is not known whether MEG is younger or older than SGP and CGP, nor is
the age relationship between MFP and MEG seen. Because the hydrothermal alteration is
the most intense in the southwest area above MEG, this unit is thought to have been
responsible for mineralization. Mineralizing intrusions in other porphyry deposits are
usually directly under the most intense hydrothermal alteration (Westra and Keith, 1981).
Because mineralization cuts the SGP, CGP and MGP, MEG was, therefore, assumed to
be younger than these units as well. MFP, because it is a dike that must have been
emplaced after most or all of the previous units is considered to be one of the younger
units. Both the MEG and MFP were dated by U-Pb. FGG exists in the deposit as dikes
that are always seen to cut everything else. However, two samples of FGG were dated,
one from the pit area and one from the southwest end, to see if there is more than one
generation of these dikes. It was recognized that if MEG and FGG have similar ages to

101
the mineralization it would mean that these units represented, or were at least
synchronous with, the mineralizing intrusion.
Summary results of the isotopic dating are shown in Figure 63. The complete
results, including element concentrations, isotopic ratios, and concordia diagrams are
included in the Appendix.
Sample Lithology Age Error
333-939 FGG(SW) 77.5 +/-1.0 Ma
364-162 MFP 78.5+/-1.4 Ma
314-367 CGG 79.4+/-1.1 Ma
352-1000 CGG-T 79.5+/-1.6 Ma
315-342 SQFP
333-324 MEG
79.9+/-1.5 Ma
80.2 +/-0.9 Ma
364-342 FGG(PIT) 81.6+/-1.1 Ma
75.0 77.0 79.0 81.0 83.0 85.0 Age (Ma)
Figure 63. Results of U-Pb zircon ages for each lithology tested. The sample IDs are the drill hole, the footage depth, and the rock tested. Uncertainties are reported at 2a.
The ages for lithologies at Adanac span 77.5 to 81.6 Ma, giving the Mount
Leonard stock a minimum lifespan of 1 Ma when factoring in errors. Most of the
lithologies ages are indistinguishable from one another due to uncertainties in the
reported age. However, several relationships are apparrent from these ages. On the basis
of the geochronology, FGG from the pit area is older than CGG. This cannot be the case,
as FGG cuts CGG. Also, FGG from the pit area has an age that is older than FGG from

102
the SW area, and these lithologies represent two different FGG intrusions or injections.
This relationship is uncertain, however, due to the fact that FGG (pit) has an incorrect
age. The U-Pb ages in Figure 63 also indicate that there is no intrusion that matches the
age range for the mineralization. The temporal gap between the oldest possible
mineralization (71.23 Ma) and youngest possible magmatism (74.5 Ma) is 3.3 Ma. From
the earliest possible start of magmatism to the latest (or youngest) close of mineralization
would be 13.4 Ma.
There are three possiblilities that could explain the difference in ages and the
relationship between mineralization and magmatism. One possibility is that all of the
reported magmatism ages are correct, and the mineralizing intrusion has not yet been
dated. This seems unlikely because the FGG (pit) age is incorrect relative to CGG. Also,
in porphyry molybdenum deposits, the mineralizing intrusion is usually directly under
mineralization itself. The bulk of molybdenite mineralization at Adanac forms blankets
directly above both MEG and SGP/CGP, and is therefore likely genetically related to
either or both of them.
The second possibility is that the ages are correct, but that the intrusion stayed hot
enough for long enough to account for the temporal gap between the mineralization and
magmatism. This possibility still seems unlikely because the FGG (pit) age cannot be
correct.
The third possibility is that several aspects of the statistically calculated ages are
not relevant or meaningful in this study. First, there is probably a high incidence of
inherited zircons in each lithology that shift the mean age to what is older than reasonably

103
expected. In any given 1000 ft drillhole at Adanac, there may be up to 5 different
igneous intrusive phases that would be passed through in close spatial relationship to
each other. It is unlikely that each of these lithologies did not inherit a significant amount
of zircons from lithologies older than it, including from the Surprise Lake Batholith.
Second, zircons that probably did not experience lead loss were tossed out as such,
further skewing the ages to what is older than reasonably expected. There were two ways
that a zircon could have been considered to have undergone lead loss. If a zircon age fell
statistically below 95% of the population, it was tossed out as anomalous and therefore
likely experiencing lead loss (for example, see figures A-23 - A-35 in the Appendix).
The other way to determine lead loss was more dependant on measurements taken
directly from the zircon crystal. When each zircon from a rock is analyzed for an age, the
laser fires many times and creates an ablation pit in the zircon. Each firing of the laser
reports an age and analyzes successively deeper layers of the zircon crystal. The outer
layers are expected to show some lead loss, and the ages get progressively older as the
laser analyzes closer to the core. If the ages plateau, then the core is considered to
represent a real crystallization age. If there is no plateau of ages, then the entire zircon is
considered to have experienced lead loss, and the particular zircon is not included in the
30 tallied zircons crystals for the weighted mean. Analyses continue until there are a
total of 30 crystals that show reliable core ages. What this means is that zircon crystals
that did show a diagnostically reliable core age were tossed out from the weighted mean
because they were outside of 95% of the population. However, 95% of the population is
not representative of an age for the rock because there are too many inherited zircons.

104
Table 6 shows the lowest reported age for a zircon from each lithology. All of the
zircons in the table had reliable plateau core ages.
Sample 333-939 333-324 -364-342 314-367
352-1000 315-342 364-162
Lithology FGG (SW)
MEG FGG (PIT)
CGG CGG-T SQFP MFP
Youngest Age (Ma) 72.1 +1.0 71.1 + 1.0 74.6 + 2.3 69.0 + 1,2 71.4 + 2.2 72.5 + 1.3 73.1 ±1.1
Table 6. Lowest reported age for a zircon from each lithology. Because they were the lowest reported, the ages were excluded from the statistical mean. Each zircon had a plateau core age.
Most of the ages in Table 6 are slightly older than the mineralization but
not a single zircon gave an age that is lower or younger than one would expect
considering the mineralization ages. If these zircons had experienced lead loss it would
be reasonable to expect that at least some of them would be younger than the
mineralization. What this probably means is that the ages seen here are real
crystallization ages. The two samples of the FGG dikes did not contain any zircons that
are younger than the other lithologies. This is not surprising because the FGG dikes are
low volume lithologies (not much of the rock exists at Adanac, relative to the volume of
other lithologies in the deposit) and this makes it less likely that a zircon that crystallized
completely within the dike would be sampled. Because the FGG dikes cut accross all
other rocks, they probably had a much higher incidence of inheritance relative to other
lithologies in the deposit.
Based on the fact that every lithology dated has some zircons that show no lead
loss and that closely resemble the age of mineralization, it is likely that all of the
105
lithological units at Adanac were experiencing some crystallization right before
mineralization occurred. Therefore, using U-Pb zircon dating does not reliably identify a
single intrusion that caused mineralization. What this does mean is that magmatism
probably began by 82.7 Ma, during the waning stages of crystallization of the Surprise
Lake Batholith, and continued until at least 69 Ma. This represents a time span of about
13.7 Ma. There were a number of inherited zircons from the Surprise Lake Batholith
spanning from 85 Ma to about 90 Ma. There were no inherited zircons from the Fourth
of July Batholith, which is Jurassic in age. The crystallization ages of biotite using the K-
Ar method from 1979 are likely recording the last hydrothermal event they were affected
by, since the closing temperature of biotite using this method is 300°C.
Heaman and Parrish (1991) report that the average U content for zircons in felsic
igneous rocks is 50 - 300 ppm. Most zircons analyzed from Adanac have U
concentrations well above this value (Table 7), making them very high-U zircons and
hinting at the highly evolved nature of the Surprise Lake Batholith and Mount Leonard
Stock. Uranium content in analyzed zircons from Adanac ranged from 250 ppm to
almost 12,000 ppm. This high U content is not surprising, as it was known beforehand
that the Adanac molybdenum deposit lithologies had above background U content.
Typical whole rock analyses of silicic rocks in general show that they contain on average
2-10 ppm U (Peterman, 1963). Adanac lithologies have an average whole-rock U value
of 18 ppm U, and a range of 7 - 34 ppm. It is well-known that U concentrates in magma
throughout the process of differentiation (Peterman, 1963). The average U concentration
in zircons determined in this study is listed in Table 7 for all the lithologies in order of

106
reported age from oldest to youngest, excluding any zircons that were inherited from the
Surprise Lake Batholith.
Sample
364-342 333-324 315-342 352-1000 314-367 364-162 333-939
Lithology
FGG (pit) MEG SQFP
CGG-T CGG MFP
FGG (SW).
Age (Ma)
81.6 80.2 79.9 79.5 79.4 78.5 77.5
Uncertainty (Ma)
1.1 0.9 1.5 1.6 1.1 1.4 1.0
U concentration (ppm) 3883 3812 3342 1855 2761 893
2811
Table 7. Average U concentration (ppm) for zircons that were used to determine ages.
There does not seem to be any correlation between U content and mean age of the
samples. There is also no correlation between age of a single zircon and U concentration,
as shown for each lithology and its associated zircons in the Appendix (Figures A-23 -
A-35). A correlation would have been expected since each successive phase of
magmatism should have concentrated more U. This may be due to the fact that U content
in zircons does not account for all of the U in the rock. Uranium probably exists in the
lattice of the feldspar crystals and in biotite (Peterman, 1963). Because U does not exist
in just one mineral, it is possible that a better analysis of U content related to age or
crystallization sequence can be made using whole rock geochemistry, discussed in more
detail in Chapter 2. The analysis of U concentration on a Harker diagram may
hypothetically be used as a proxy for age, because as a magma moves through its
successive phases of intrusion and crystallization, it should become more highly evolved,
contain more U, and contain a higher weight percent silica. The R2 value for the U

107
Harker diagram diagram was considerably low at <0.05, and therefore showed no real
linear trend at all (Figure A-14). It is important that rocks at Adanac showed no
correlation between age, silica content, and/or U content. For whatever reason, rocks
within the Adanac deposit cannot be shown to have age-related geochemical trends
concerning U.

108
Chapter 7
The Relationship of Placer Gold on Ruby Creek to the Adanac Deposit
There are many similarities between porphyry molybdenum deposits and
intrusion-hosted gold deposits such as Pogo, Donlin Creek, and Fort Knox. These
similarities include redox states and trace and major element chemistry of the host rocks,
and mineral and elemental assemblages of the deposits themselves. Porphyry
molybdenum deposits and intrusion-hosted gold deposits both are hosted in relatively
reduced and alkalic or felsic magmas, and host rocks typically belong to the S-type
magma series (Thompson et al 1999). The trace elements and mineral assemblages
present in intrusion-hosted gold deposits are characterized by bismuth, tungsten, arsenic,
tin, molybdenum, tellurium and antimony. While the Adanac deposit itself contains no
minerals or trace elements in significant quantities other than molybdenum and tungsten,
within 3 miles of the deposit and clearly related to the Mount Leonard Stock are several
deposits and veins (Figure 4) that have the same trace elements as intrusion-hosted gold
deposits. These include elevated tellurium, arsenic, and bismuth, along with wolframite,
gold (unknown whether its native gold or electrum), cassiterite, molybdenum and stibnite
in quartz veins hosted in the same igneous rocks that host Adanac. Gold in intrusion-
hosted deposits like Fort Knox can be concentrated in locations distal (1-3 km) to an
intrusion, is correlated with bismuth and tellurium, and typically occurs in sheeted veins
(Stephens et al, 2004). Molybdenum and tungsten can occur more closely to the
intrusion. Therefore, the mineral assemblage at and within the vicinity of Adanac is
consistent with that of intrusion-hosted gold deposits. Intrusion-hosted gold deposits are

109
also associated with Phanerozoic arc settings and tungsten-tin provinces (like Fort Knox)
(Thompson et al, 1999). This is consistent with the setting for the Adanac molybdenum
deposit, which is very close to Logtung (a porphyry tungsten deposit) and other tin
deposits such as the Germaine porphyry Sn deposit and the JC Sn skarn (Figure 66).
Sack and Mihalynuk (2004) showed that gold from the Atlin camp may be at least in
part derived from an intrusive source, because cassiterite, thorite, and granitoid clasts
were found to be intimately associated with some gold nuggets in the camp. The Surprise
Lake Batholith is enriched in tin and is known to contain thorite. Because the Adanac
deposit occurs at the head of two creeks (the Ruby and Boulder Creek) that have placer
gold deposits on their lower drainages, Adanac presents a good opportunity to test for a
possible genetic link between porphyry molybdenum deposits and intrusion-hosted gold
deposits.
In order to test this theory, Os isotopic contents of placer gold from Ruby Creek were
compared with Os isotopic contents of magnetite from drill core of the Adanac
molybdenum deposit. The placer gold was taken from the mouth of Ruby Creek, and
was an aggregate of small rounded grains (2-10 mm), and were never analyzed for trace
metal content (copper, silver, etc.). The color varied from rose-colored gold to highly
metallic, pure-appearing gold. The magnetite was a larger crystal (5 cm) taken from a
smoky quartz vein within the main pit area of Adanac, with no other vein minerals
present.
In both of these minerals, Re decays to Os, and the Os content is measured
and recorded in ratio to the stable 1880s isotope. The intended method was to take the

110
measured Re and measured Os concentrations and isotopic ratios and calculate
backwards for both samples. Because the age of the magnetite is known, the measured
Re and Os isotopic contents can be plugged into the age equation and generate what is
known as the inital or chondritic Os ratio, or the Os/ Os at the time of that Os
separating from the mantle. For the gold sample, we would have assumed an age (the age
of mineralization at Adanac), and calculated the initail Os. If the age assumption had
been correct, two lines representing the evolution of the Os isotopic ratio (plotted against
time) in the gold and the magnetite would have crossed at a geologically meaningful age
(the age of Adanac mineralization)(Figure 64).
This equation is possible because, if the gold and magnetite are from the same
hydrothermal system, at the time of their formation in the porphyry deposit their Os
isotopic ratios must be the same (even if they have differing Re and Os amounts), and
also must be greater than chondritic Os. The Os isotopic ratios evolve separately after
formation of the porphyry deposit because the different minerals (gold and magnetite)
187 1R7
incorporate different amounts of Re, and Re decays to Os.
If, in Figure 64, the lines had never intersected, the samples would not have been related
because there was never a time in the past that the Os ratios were the same. If they had
intersected but crossed below chondritic Os at the time the surrounding rocks were
formed, the samples could not possibly be related. If the lines had intersected at a
geologically meaningful age (the age of mineralization at Adanac), it would have been
safe to hypothesize they are from the same source.

Hypothetical Diagram of Magnetite and Gold from the Same Hydrothermal System
Measured Os ratio of magnetic M Assumed initial Os ratio of gold,
based on a geologic age of around 70 Ma, which is the age of molybdenite from Adanac
Measured Os ratio of gold
- Calculated initial Os ratio of magnetite
Evolution of mantle Os
90 60 50 40
Time in the Past, Ma
111
Figure 64. Hypothetical diagram showing magnetite from Adanac and gold from Ruby Creek that are from the same hydrothermal system. The measured 187Os/188Os of the magnetite would have been used to calculate the initial Os ratio, because the age of the sample is known. The measured Os ratio of the gold and an assumed age (that of Adanac) would have been used to calculate an initial Os ratio for the gold. If the assumed age of the gold was correct, the lines of Os evolution would have crossed at around 70 Ma. The line showing evolution of Os in the earth's mantle over time is taken from Chen et al. (1998).
Both the gold and magnetite samples were dissolved and homogenized using the
same Carius tube technique as described in Chapter 5 for the molybdenite ages and
analyzed by thermal ionization mass spectrometry. This was done at the Re-Os
geochronology lab at University of Arizona, Tucson, and the results are summarized in
Table 8.

112
Sample
Ruby Creek-1
Ruby Creek-1*
Adanac 351-957
Phase
Au
Au
Mt
187 188
Os/ Os 0.1249
0.1253
1.237
Error
0.0005
0.0005
0.011
187 188
Re/ Os 0.016
0.001
872.25
Os(ppb)
345
4538
0.015
Re(ppb)
1.16
0.82
2.42
Table 8. Results of the gold (Ruby Creek-1 and -1* ; - 1 * is a duplicate of the same gold sample) and magnetite (Mt, Adanac 351-957) analyses.
The gold analyzed had little Re and a resulting very small Re/Os ratio. No age
regression was possible for the gold. For the magnetite, there was not enough material
submitted for multiple analyses, even though the largest known single magnetite crystal
from Adanac was selected for the analysis. Therefore, no isochron could be made for
magnetite, because multiple analyses are needed for an isochron. Regardless of these
problems, the question of whether the gold is related to the hydrothermal system that
generated the Adanac deposit can still be answered with reasonable certainty. The gold
has a Os/ Os that is very primitive, even lower than the current mantle value of
0.129, and so is likely from the mantle, and not from a porphyry deposit (see Figure 65).
Also, the Os content of the gold sample is very large and variable, suggesting the
presence of osmiridium grains, which would be likely in a source associated with
chromites, or peridotites, and not a porphyry deposit. It is interesting that the Os and Re
concentrations of the gold are very high in relation to other porphyry gold deposits, and
actually quite similar to the mantle-derived Witwatersrand in South Africa (Figure 65).

113
100000 j
I I
10000 |
1000 j
3" a 3 100 ' (A o
10
1 )
0.1 -0.1
Re and Os Concentrations in gold samples
- - - • - • - • • • — • - • - - - - • - • - -
.
* • •
•
1 o
1 10
Re (ppb)
|
•
|
100
• Witwatersrand (WA)
• Witwatersrand (VR)
• Ruby Creek
o Grasberg
Figure 65. Os and Re concentrations of some gold deposits compared with gold from Ruby Creek. The Witwatersrand deposit is historically the largest gold deposit in the world, accounting for about 40% of total world production (Frimmel and Minter, 2002) and is mantle-derived (Kirk et al., 2002). The two Witwatersrand samples are from different formations: WA (Western Area) and VR (Vaal Reef). The Grasberg is a porphyry copper-gold deposit in Indonesia. Figure is modified from Kirk et al., (2002).
Although the results of this study suggest the gold on Ruby Creek is unrelated to the
hydrothermal system at Adanac, this does not mean that none of the gold in the Atlin
Camp is related to Adanac. Wallace et al., (1968) report the presence of gold and
wolframite in veins clearly related to the Mount Leonard hydrothermal system in the
Boulder Creek drainage area. Perhaps it would have been better to sample gold from
placers on Boulder Creek rather than Ruby Creek. Perhaps it would have been better to
get multiple samples as well, because if some of the gold is derived from the Surprise
Lake batholith (and the Mount Leonard stock) then this means that gold in the Atlin camp

114
is from mixed sources. Multiple samples would have increased the likelihood of
identifying at least one sample that is igneous-derived.

115
Chapter 8
Characteristics of Porphyry Molybdenum Deposits in the North American
Cordillera and Some Possible Areas that may be Host to More
Porphyry Molybdenum Deposits of the North American Cordillera
The purpose of the last study completed for this thesis is to list important
characteristics of porphyry molybdenum deposits throughout the North American
Cordillera, and determine areas in British Columbia and the United States that may host
more deposits. Several databases were queried for porphyry deposits to make the map
shown in Figure 66. These include the USGS Mineral Resources Data System, the
British Columbia Minfile Mineral Inventory, the Alaska Resource Data File (USGS), the
Yukon Geological Survey Minfile Mineral Inventory, and the paper of Mutschler et al.
(1999). Porphyry molybdenum deposits of low-F and high-F types, Pogo-type porphyry
Au deposits (Thompson et al., 1999), porphyry Cu (-+ Au and Mo), and porphyry Sn and
W deposits are shown on the map in Figure 66. Only those deposits with reserves (each
database listed whether or not there were proven or probable reserves associated with
each prospect) were included in order to increase some confidence about the level of
exploration completed and thus the level of certainty about their classification. The
important porphyry deposits discussed in this thesis are numbered in the Figure.
Descriptive characteristics of some important porphyry molybdenum deposits in the
North American Cordillera are listed in Table 9. References for these descriptions are
116
listed separately (page 195) from other references for this thesis and are linked to the
numbers at the end of each row in the table.
Figure 66 (next page). Porphyry Deposits of the North American cordillera that have reported reserves. Important deposits discussed in this thesis are numbered.
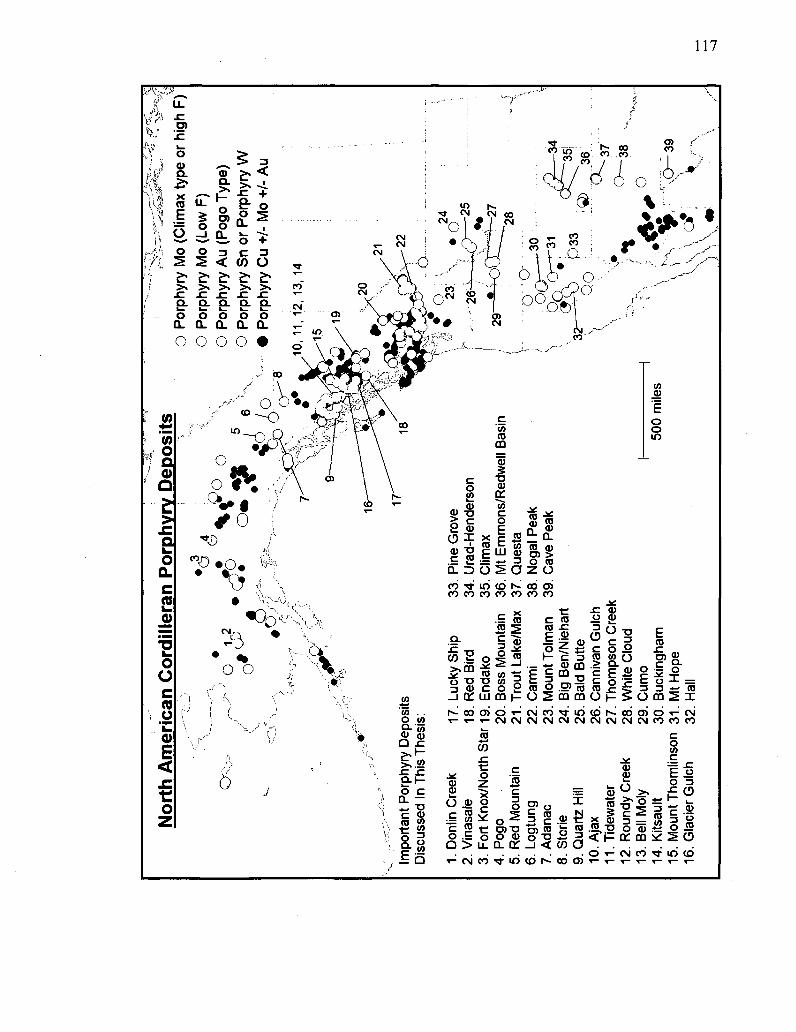
117

118
I
IP IIII:I _« s | l | S
l | f f | | a s j
i! i
3 i * * i tis IMS
s
lillif K .-- EP —» •§ T - j
| a 2 3 ? I § I S a I - 11 •S - ^ 1? s a .2
11 i i s 11 I f ! « ! «
E S «*• •
en
•s
s
•B c
i
Itfii
ii II 3 J § 8
3 1 I
f i 11: IIU ii 1 S 1
f 1 * I I I •i s -s
lit * i l II* ja 1 e it s
•tape
Ba
nd
dure
ngat
ed
lamina
al
sofra
S|? fii i'lii 8 ' s *Sl 2 E 5 811 liS *o s S "=
i a fl
aitz
,
I s
If I f f *
II i
II 1 i s if It
8 • a
• i s -! . . .
II e-Sff f S 1«"
Sfistlaij
!»i »i i l . 1111 iti II i! iff!
II lill HO in if Hi Hi V- III
111!: l! liSii 1 3
£ 3 £ Il ls
11 i i >gs 1*1 7J i 8 I I ?
[Il l •a a?
s

si
S
5 1
fi: '<:i
l i t
II 15 R-*
trunc
ated
Hi
gh te
mp
¥* Vs N=
exce
pl
an
.a. g- S. -3
lllifll* r l i i £
IP i S l
ii
i f a s
s
iff!
S as 3 S i s
« » H ill
i
B
3
3 £
s
111 HI
HI* 11 & e •a »
S 6
!l
3 :
r
11
ii tfl It II
II mm
ill ill Hill
Infilli I i f I 8" f I 1 i i f f | ! ;l . ... . *?....
s i s HI
II sf* «1 i f
Ilj{||J ,iHW
llliil.i S i '
Hu IM
g e s a «= •* T§
i « f | i I f ~ i l i i l l f i P ns
I: Mi I! inn
-H I s s
if' S3
l» 111
lit in
s i
*1 fill l| li •lmn» UIIUI
"iiii • «
91J

120
Ref
Repp
min
molyb
denit
e s |
Molyb
denit
e Po
lytyp
e
Altera
tion t
ype,
and z
oning
(mov
ing
away
from
caus
ative
intru
sion
or ore
body
] or p
ange
nesis
indic
ated b
y nu
mberi
ng
Fluori
ne
conte
nt To
nnag
e and
Grad
e Sh
ape
and C
harac
ter of
Ore B
ody
Gang
ue
ill
Intrud
es:
Rock
resp
onsib
le for
mine
raliza
tion
Agea
nd
metho
d of
Magm
atism
Datin
g
Loca
tion
I
a
early
: kfel
dspa
thize
d and
veins
flood
ed w
ith of
t mtb
iotite
. Nex
t is
phylli
c alt t
hat a
lso ha
s Suo
rite an
d or
thoda
se. L
ast is
pro
pyl:
vA
epido
te, ch
lorite
, calc
ite. P
hyllic
zone
conta
ins m
olybd
enite
.
1
155 m
illion s
hort
tons a
t 0.44
% Mo
S2
early
veins
conta
in mo
and
hueb
nertte
and l
ess p
yrite.
Late
.. ..
ore bo
dy dr
aped
over
stock
ve
ins co
ntain
po, p
y, an
d bas
e; '
metal
s.
intmd
es
carbo
nace
ous
shale
s
rhyoli
te po
rphyry
, gra
ding
down
ward
into
granit
e porp
hyry
(Red
Lady
Stoc
k)
I
Color
ado
Moun
t
Emmo
ns
5-
lowF,0
.09
v/t %
of
fresh
rock
, urh
ole ro
ck
analy
sis
tl
grano
diohte
:
relate
d to t
alc-
alkali
ne ba
tholith
s
I
Idaho
Th
omps
on
Cree
k
S i
highF
12
5 millio
n ton
nes
at 0.3
% mo
lybde
nite
molyb
denit
e ore
zone
conta
ins;
topaz
, fluo
rite,hu
ebne
rite.
quart
zites
and
shale
s of
Prec
ambri
anto
Camb
rian a
ge
multip
le mi
neral
izing
intrus
ions o
f high
sil
ica rh
yolite
, po
rphyri
es, a
nd
ashlo
w tu
ffs.
H' I
Pine C
reek,
also
know
n as
Pine
Gr
ove
»
1. ce
ntral
silici
fied z
one 2
. surr
ound
ed
by po
tassic
zone
3. ou
tward
of th
is is
weak
ly de
velop
ed a
rglc
and
prop
yl!: z
one s
uperi
mpos
ed o
n ho
mfels
. Silic
, pota
ssic,
and p
hytlic
alt
eratio
ns oc
cur a
s vein
enve
lopes
.
0.1%
(who
le roc
k an
alysis
, un
altere
d)
10,40
0 ton
s of
molyb
denu
m
4 stag
es of
mine
raliza
tion,
each
relate
d to a
n intr
usion
. <
Stock
work
of qtz
veins
wl
t
signif
icant
moly
and p
yrite,
I
mino
r sch
eeKe
, gale
na, s
i :
annu
lus in
plan
, vert
ical c
ylind
erin
in se
ction
cc
py, P
b-6i s
ulfos
alts,
and
:
carbo
nate.
Poa
ssoc
wl :
;
homf
els. S
ome a
plite
conta
ins
disse
mina
ted m
o. '
i
intrud
e Ju
rassic
gra
ywac
kes
anda
rgillit
es
sidou
sqtz
mo
nzon
itesa
nd
grano
diorft
es:
Lime C
reek S
tock.
Intrus
ions g
rade
from
more
to les
s ma
fic, i
ncrea
sing
alkali
conte
nt
54ma
,K-A
rof
biotrte
BC:n
ear
Ajax
and
Bell,
135
kmNE
of
Princ
e Ru
pert
1
«
1
907,0
00,00
0 ton
nes
at0.0S
%Mo
molyb
denit
e, py
rite, s
chee
nte, j
j
chalc
opyri
te. ar
genta
n ;
tetrah
edrite
, fer
rimoly
bden
ite+s
econ
dary
] Cu
mine
rals.
caba
lkalin
eroc
k Ne
vada
Bu
cking
ham
1,13
1 i
unkn
ov.Ti
, but
estim
ated t
o co
ntain
10% of
free
world
's kn
own
reserv
es of
mo
lybde
num
i Cr
etace
ous
quart
z dior
ite
and
gran
odior
iteof
the
coas
t rang
e ba
tholith
porp
hyrff
icand
ap
ic qu
artz
monz
onite
and
quart
z lati
te
mioc
eneo
r
oSgo
cene
, str
abgra
phic
age
Alask
a Qu
artz H
ill

121
If I
If i f , s s s -i H|i ill' I f f
I i g l
&
ll l lf i
lMi
ifflMJ * -8 • £
s a ° 1 -s 8
II s g
I'
£ J 11 f M f I = ^ -3 'S I ' l l f | I ' s § i p s l i t
6
i s f §
« 2 a
Is
i t s 11 s •» •» St. 8 1 &
" " i l l 3 : I | I f S i <= -1 B 2 2 I
! s l | s | §• @ ^
IS f
Pill 1 i 111 ! i l l
li II
If i t
I I
fi
11
S f
s 1 1 . S e l f s s s f l l l l ~ E3 s |f]l lift I s I I I I t l « i f f
1 •f I il
i
<3
I 1 - • ill 3 i?
* ! JI 8
mil ? l | l :
€ ~ | HI
ill f||l|llfil : * '
II' Hi Si i l l
& §
•5 '& j) & ? m E £;
1 " f i &f S"5 II 2 w
1 i
t« S '
tiiiiii I § § '1H11
iiiit IN ill II
illi si Hiii
If -8 g
= £ li Fit"*
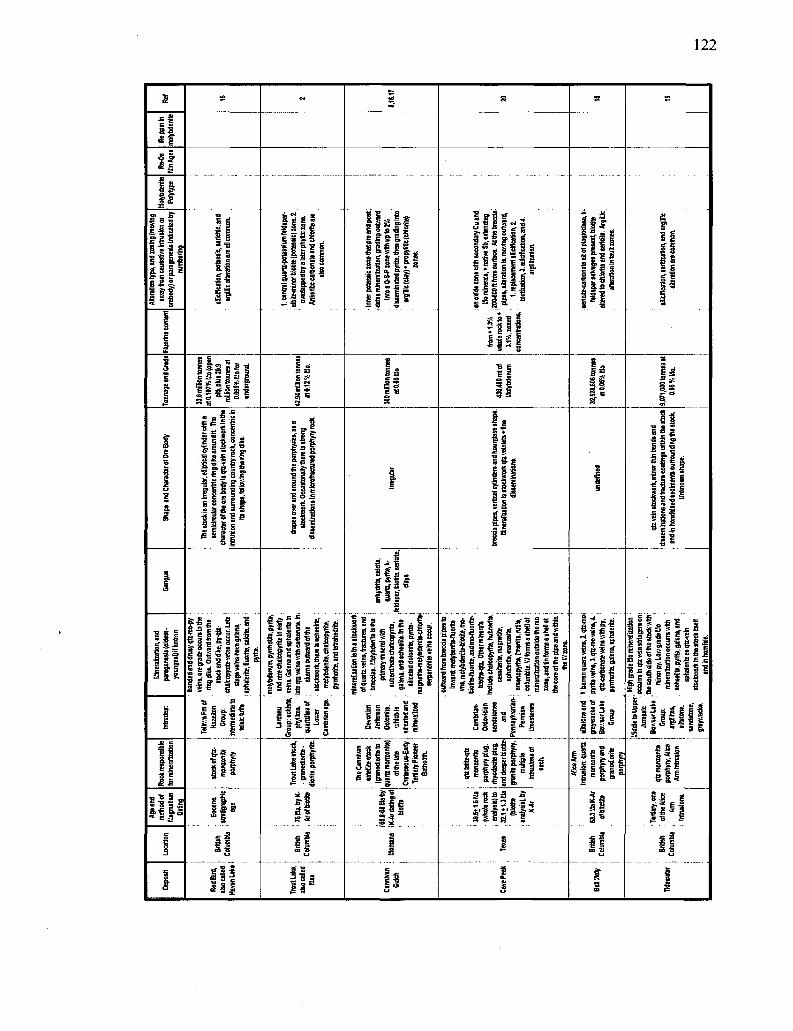
II
If
I s is -s
I! 1
ill! Ti, I f
i f iL 1 f» I ^ i I B S i i i f €
I f l - ' l I! ;-l
sf J S a l i l
II f i
3 ' !ii! 11 If II
I ^ < H
iiiif l i e s
f i IP 1|° 111
S f M I I I i f ! & S I 3 S
flu HI w E .s
iii *°it\ J *I
— e s "H 2* S 3 i
is s a- s « s •g
lip
f~ # - ^ jf V
„- £ S 1 « 1 1 1
lllfilll fllsltfi lessilsf Illelitl
* i fitfifIfifJ
•r'S _
Hill!
I Mil
•s a J 111 II
m
| | 5 5 a l l 1 .
E 5.s i i It£ !=i
iiiiiiii1
i» 3 * E "£ «j 8
il? « •
iijitill
III
HI P 14
Ri
i
i i i ^ *.* i ' l f r a t s
1115 f I! I !

123
II
1! II
8
1
IP
H s 5 a
mil f" a § § e
I * £ a B 5 # ? I I I I
III III! e s s e = » a s
E
s II
1 o I s. s
l« f | I f « 8 . Si f 1
&«
S i
i | * f 1 ill s _e -*» .K « *s "S = E S E £ IP
I
g « £ ** *S 13 "I? $ !i if I I " 2» i l l
l i
III! inn i 111- 4
i t
3i § 1 m 7»
124
Table 9 (previous 6 pages). Descriptive characteristics of low-F and high-F type porphyry molybdenum deposits in the North American cordillera, with references for each description in the last column. Abbreviations used are as follows: ccpy -chalcopyrite, po -pyrrhotite, mt -magnetite, ref -references, qtz -quartz, moly or mo -molybdenite, sphal -sphalerite, gal -galena, py -pyrite, fl -fluorite, q-s-p -quartz-sericite-pyrite.
All of the deposits listed are associated with some type of porphyry intrusion,
typically of quartz-monzonitic type for low-F types, but some high-F types are associated
with granites or rhyolites (Adanac, Cave Peak, Hope, Questa, Climax, Mt. Emmons, for
example). All deposits are Mesozoic or younger in age, while those Climax-type or
transitional types, especially in the United States, tend to be Tertiary (Nogal Peak, Pine
Grove, deposits in Colorado, some in Idaho, Cave Peak). Some few deposits in Canada
of stated quartz monzonite-type (or low-F) are probably Tertiary as well, such as Red
Bird and Lucky Ship. This is probably the result of high-F types being more associated
with extensional tectonism rather than subduction (Wallace et al. 1995), because
extensional tectonism is a younger event in North America than is subduction. Deposits
associated with extensional tectonism would be farther inboard from the subduction zone,
would have formed at deeper levels in the crust, and have more time to differentiate (and
become enriched in Mo and F) from parent magmas formed from upper mantle materials
(Westra and Keith, 1981).
Mineralization in Climax-type deposits is commonly molybdenite, rare chalcopyrite
and pyrite, huebnerite or wolframite, fluorite and topaz, galena, magnetite, and sphalerite.
Mineralization in low-F types consists of molybdenite, chalcopyrite, pyrite, rare fluorite,
galena, sphalerite, and scheelite. Most deposit types have stockwork veins, but low-F
types have higher incidence of molybdenite disseminated in breccias bodies, or along
intrusive contacts or faults. This may be the result of a lower silica content in quartz

125
monzonite or quartz diorite magmas, or a higher water content which facilitates
formation of breccia bodies. Climax-type ore bodies also more commonly have inverted
cup shapes, centered on and controlled by the apex of porphyry intrusion.
Porphyry molybdenum deposits of all types typically have propylitic (chlorite) and
phyllic (quartz-sericite-pyrite) zones of alteration. Climax types or high-F types also
more commonly have a high silica, or silicified core, and an increased amount of potassic
alteration compared to low-F types, due to the increased amount of silica and K available
for this type of alteration and an increased temperature due to deeper levels of formation.
An even more uncommon type of alteration associated with Climax-types is greisen
alteration, consisting of muscovite, topaz, quartz, and high-F garnet, which forms at very
high temperatures.
Possible Host Rocks for Porphyry Molybdenum Deposits
The Western North American Volcanic and Intrusive Rock Database (NAVDAT)
was queried for all rock types that have silica contents greater than 70 wt %, and that
have Rb/Sr ratios greater than 1. The states that were included in the query are
Washington, Montana, Wyoming, Idaho, Oregon, California, Nevada, Utah, Colorado,
Texas, New Mexico, and Arizona. British Columbia and Yukon Territory were also
included in the queries but produced few results, probably as a result of the NAVDAT
database being primarily one of the United States. All resulting rock types that met these
criteria are shown in Figure 66, along with porphyry molybdenum deposits of both the
low-F and high-F type. The green diamonds represent plutonic igneous rocks (mostly

126
granites) and the black diamonds represent volcanic igneous rocks (mostly rhyolites).
Areas of obvious interest are numbered and the samples that produced these results are
briefly discussed below. The discussion of prospective samples include any geologic
descriptions available from the NAVDAT database and proper names of plutons from
which the samples came. This information is included here because some descriptive
features, such as alteration, make an area more prospective for a porphyry deposit. Only
samples with intrusive rocks that meet the criteria are numbered as areas of interest
because porphyry molybdenum deposits are associated with some intrusive igneous
component, even though they may have extrusive rocks as well.

127
< * 1
Porphyry Molybdenum Deposits and NAVDAT rocks of Si02 > 70
• and Rb/Sr >1
. < • • • • * 4 » 3 < ^ < * • ; •
# 5 ^ *
• '*4i * 7
1 4 *
- Climax-type porphyry molybdenum deposits
^ Low-F porphyry molybdenum deposits
^ Intrusive NAVDAT rocks (high silica and high Rb/Sr)
^ Extrusive NAVDAT rocks (high silica and high Rb/Sr)
8
• # * 11
• \
4$ 12 * • * ••• < a 5
16© _15 " ^ ($13 V
Figure 67. The western United States and associated high and low F porphyry molybdenum deposits, and NAVDAT samples with Si02 contents >70 wt% and Rb/Sr >l. Prospective areas for other undiscovered molybdenum deposits are numbered and discussed below.
Washington:
1. This sample of rocks is located in the Western Cascades magmatic arc (Dubray et al.
2006). The samples are from a series of small intrusions existing in a northeast trend

128
in between Mt. St. Helens and Mt. Rainier. There are several Miocene intrusions that
range from quartz monzonite and quartz diorite in composition, and also an area of
argillic alteration on the ground about a mile in diameter. This intrusion is called the
Spirit Lake Pluton, and samples actually may be close to the Margaret porphyry
copper prospect.
Idaho:
2. Area 2 is part of the Idaho Batholith, more specifically the Bitterroot Lobe. The
Bitterroot Lobe is mostly 85-65 Ma granodiorite, but is known to contain granitic
pegmatite bodies (Alt and Hyndman, 1989).
3. Area 3 is a suite of Eocene granitic intrusions and subvolcanic rhyolite that cut the
Cretaceous Idaho Batholith. The intrusions include the Casto, Sawtooth, Lolo, and
Bungalow stocks (Alt and Hyndman, 1989).
4. Area 4 appears to be a trend of high silica and Rb plutonic rocks following the Trans-
Challis Fault Zone, and located within the Atlanta Lobe of the Idaho Batholith. The
samples are mostly reflective of Eocene stocks of the Challis magmatic episode
(Lewis and Kiilsgaard, 1991). Two stocks that produced a lot of favourable samples
are the Prairie Creek and Boulder Mountain (Reppe, 1997). This area is host to the
Cumo, Thompson Creek, and White Cloud porphyry molybdenum deposits, but there
are apparently several favourable stocks in this area.
Nevada:

129
5. These samples are from the Ruby Mountains of the Basin and Range area of Nevada,
and are located in Lamoille Canyon. These samples are of a Late Cretaceous two-
mica pegmatitic gneiss (Lee, 1991).
6. Area 6 is near the low-F porphyry molybdenum deposit listed as the Jolly Roger
claims. The samples are from granitic rocks in the northern Pine Nut Mountains
(John, 1992).
Utah:
7. These samples are from 11 Ma granitic rocks of the Mineral Mountains Batholith.
Nothing else is known about the samples (Coleman and Walker, 1992).
Colorado:
8. This area is east of the Climax type porphyry molybdenum deposits in central
Colorado, and samples are taken from Laramide age (or younger) intrusive rocks in
the Thirtynine Mile volcanic field (Cambell, 1994).
California:
9. This area in southeast California is mostly within the Sierra Nevada Batholith. Some
of the more interesting samples lie within the McAfee Creek muscovite granite (100
Ma) that cuts the Barcroft pluton in the central White Mountains, Mount Barcroft
Area (Ernst et al., 2003). These samples lie on the western most edge of the basin
and range province in Nevada. Other samples have little information about them
because they are part of a region-wide study of Sr isotope characteristics of the Sierra
Nevada Batholith (Kistler and Ross, 1990), or are not interesting from a mining stand
point because they are close to Yosemite National Park (Gray, 2003). Some other

130
interesting samples in this area include the Golden Bear and Coso K-feldspar
porphyry intrusions (dikes) that cut the Independence and Sardine plutons in the
Sierra Nevada, and the Coso leucogranite in the Coso Range, respectively. These
intrusions occur on opposite sides of the Owens Valley and are offset dextrally by 65
km. They are presumably the same intrusion, both 83 Ma (Kylander-Clark et al.,
2003). These areas in California are unknown for porphyry molybdenum deposits,
but many of the rocks in these samples are geochemically similar to rocks in Idaho,
Nevada, and Colorado that are known for porphyry molybdenum deposits.
Arizona:
10. These samples of granites are located in northwest Arizona, along a trend of basin
and range extension. The samples are from two studies by Lang (1991), and Faulds
et al., (1995). The samples on the northern part of the trend are 16 Ma while those on
the southern end are 78 Ma.
14. Samples here are from the Schultze Granite (Stavast, 2006) and also part of the Lang
(1991) study of Laramide igneous rocks in Arizona.
15. These samples are from the Stavast (2006) thesis, like in area #14. These particular
rocks are from the Schultze and Belmont granites. The Belmont granite is especially
unusual for Arizona because it is high in F, Rb, K, and lithophile elements. The
Schultze granite is associated with porphyry copper mineralization, but the Belmont
may be more of a candidate for molybdenum mineralization.
16. These samples are from a middle Cenozoic plutonic complex that is also reported to

131
be extensively altered (Cox et al., 2006). The area is in Pima County in the Ajo
mining district.
New Mexico:
13. These rocks are from the Organ Needle pluton, which is 36 Ma (Verplanck, 1996).
New Mexico and Texas:
11 and 12. Both of these areas are from a study of subsurface Precambrian igneous
rocks (Barnes et al., 1999). Samples in area 11 are from the Panhandle volcanic
terrane, in which there are undeformed rhyolites and granites. Area 12 is in the
crystalline terrane, which is mildly to strongly deformed intermediate to felsic
intrusive rocks. The age of these rocks makes it likely that any associated mineral
deposits are eroded.
Discussion
Prospective sample identifications and associated latitude and longitude, in decimal
degrees, are listed in the Appendix of this thesis, grouped based on areas numbered in the
map. The sample ID can be used in NAVDAT to look up the original data source. The
samples in NAVDAT are obviously biased to those areas that have geochemical studies
published on them, such as areas that already have productive mines. However, this is
somewhat useful because it can be seen in the map that areas with both low F and high F
molybdenum deposits have rocks that give a positive (i.e., fit the search requirements)
identification for prospective molybdenum deposits. This should raise curiosity in other

132
areas that fit the search requirements on the map but are not associated with known
deposits. Some areas, such as 2, 3, and 4 in Idaho are known camps for molybdenum
deposits but the rocks that are geochemically prospective are not the same ones that host
such deposits as Thompson Creek. Therefore, there are probably other undiscovered
deposits in these areas, and the samples that are positive would warrant a field check or
further research. Area 15 is highly interesting, because it is not near any known
molybdenum deposits, yet the rock sampled is clearly a candidate for this type of deposit.
It is an unusual granite for southern Arizona with high amounts of F and K, like Adanac.
Other areas, like Lamoille Canyon in Nevada (area 5) may have hosted a molybdenum
deposit in the past but are less prospective now because of the high degree of
metamorphism it has undergone. The case of southern California is interesting, because
it seems that there are a high incidence of prospective rocks, but this area is not remote
and has been mapped and prospected extensively for other types of deposits. Perhaps the
rocks here are geochemically, but not tectonically favorable. Molybdenum deposits
typically form at deeper depths in the crust, and also require the presence of crust in order
to scavenge elements like Mo and F. The Sierra Nevada batholith may have been too
shallow or too close to the active tectonic margin. Southern California igneous rocks
may have been at least far enough inboard of subduction to have elevated Rb, unlike
northern California igneous rocks.
Another interesting result of this map is that, even though specifically Climax-type
high F molybdenum deposits are supposed to have high Rb/Sr ratios, this parameter
seems to pick up low-F types as well. This probably means that all or most host rocks of
porphyry molybdenum deposits have somewhat elevated Rb relative to other rocks. Of

133
course, some deposits are likely to be under-explored, and may have characteristics
similar to Climax-types, as was the case for Adanac which was originally classified as a
low F type molybdenum deposit. This elevated Rb content of most porphyry
molybdenum deposits makes them easier to find, as opposed to only singling out a more
rare type of molybdenum deposit while ignoring others that may still be very economic.

134
Chapter 9
Conclusions
The Adanac molybdenum deposit is hosted in multiple intrusions that are
classified as alkalic, peraluminous granites that have normal differentiation trends
relative to major oxides. These host rocks are high in silica and potassium. Using the
Westra and Keith classification (1981) Adanac host rocks have a K2O value at 57.5 wt%
Si02 of 5, placing them in the "Climax-type" category. .
Mineralization at Adanac consists of molybdenite blankets or cupolas that occur
over the MEG and SGP/CGP intrusions. Tungsten mineralization, manifested as
huebnerite, is coincident with molybdenite, and fluorine mineralization occurs over and
outward of molybdenite and huebnerite. Lead (galena) and zinc (sphalerite) occur almost
exclusively within faults overprinting molybdenite mineralization. There is very little to
no copper, tin, or gold within the area of molybdenite mineralization. The patterns of
trace elements and mineralization that occur at Adanac are consistent with descriptions of
other Climax-type deposits.
Alteration at Adanac consists of high-silica and potassic alteration cores that
occur above the MEG and SGP/CGP intrusions, even though silica and potassic alteration
are not as intense as described at Climax. QSP alteration is somewhat weak compared to
other Climax-type deposits, because it does not occur as near complete replacement of
host rock but occurs as primarily fracture-fill. This zone occurs further outward from
porphyry intrusions, along with a zone of stilbite-calcite fracture fill alteration that cross
cuts all other alteration types. Propylitic alteration occurs as patchy spots within the

135
higher-grade zone but is strongest further out from QSP and stilbite-calcite zones. Clay
alteration consists of illite and kaolinite in higher-grade molybdenite zones and in deeper,
fresher-appearing rocks. Clay alteration is primarily chlorite, kaolinite, and minor illite
in QSP, stilbite-calcite, and propylitic alteration zones. Montmorillonite is present only
in faults. Alteration characteristics are similar to Climax-type molybdenite deposits.
Molybdenite at Adanac is all of the 2H polytype, like other porphyry molybdenite
deposits, and unlike porphyry copper-molybdenite deposits. The Re concentrations in
Adanac molybdenite are some of the lowest values reported, which may be the cause of
the exclusive 2H polytype.
Re-Os analysis of molybdenite confirmed at least two generations of
mineralization at 70.87 ± 0.36 Ma and about 69.66 ± 0.35 Ma, with the youngest
mineralization occurring at the southwest end of the deposit above the MEG intrusion
and disseminated in a feldspar flood. U-Pb ages of zircons from Adanac host rocks place
magmatism at 81.6 ± 1.1 Ma to 69 ± 1.2 Ma, giving the Mount Leonard stock a probable
life span of almost 14 Ma. When using the weighted mean of 30 zircon analyses for each
lithology, no appropriate age match was found for an intrusion and mineralization
episode, and the FGG (pit) age is certainly incorrect. There are too many inherited
zircons for a mean age to be reliable, and statistical methods for determining lead loss
discredit ages that are most likely valid. It is likely true that most, if not all, of the
lithologies that were dated at Adanac were still undergoing some crystallization just
before (1 Ma) or during mineralization.

136
The gold from Ruby Creek analyzed in comparison with magnetite from Adanac
is derived from rocks more like peridotites than porphyry deposit host rocks. The
question of whether some of the gold in the Atlin camp is igneous-derived remains
unanswered. The next step in answering this question would be to try to get multiple
samples of magnetite from the Mount Leonard stock or the Surprise Lake batholith to
compare with multiple gold samples from the Boulder Creek placers or gold from sheeted
quartz veins to the southwest of Adanac.
Using Rb/Sr and silica content of intrusive igneous rocks is probably a productive
way to search for other molybdenum deposits of both the Climax- and low-F types.
Particularly interesting areas in the western Cordillera of the United States include stocks
and batholiths in both Colorado and Idaho that are underexplored but in known camps of
other molybdenite deposits. The Schultze and Belmont granites in southern Arizona are
particularly interesting because they are not near other molybdenite deposits, and are
unusual granites for Arizona. The rocks are high in K, F, and Rb, and reported from the
NAVDAT database to be enriched in lithophile elements and therefore represent one of
the better areas that are prospective for future molybdenite deposits

137
Appendix of Figures and Tables
Whole Rock Geochemistry and Selected Trace Elements
<9
>
m
A t/i
1 -
LOI
203
u
i E
s a
8 p
K20
O
a z
O a u
o CD
S
2 IX.
203
s CM
<
SI0
2 1
Sam
ple
E 0 .
E a, a .
E Q. Q.
E a. a.
E Q .
a£
f S
1 *
*
« 3
l *
-
I
l
^ ^
I
1
r t CO CM
CM t o
CM
o
v
t o
cn o
r o o o o
3 CO
co o o
CO
c i
CO
i r i
co r o
m o ,p~
o
o
*~
CM i n
""
8 CM
3.
o e> o a* CM
3 CO
VO
t o U3
U>
•*»
CO
o
t o
si
°
CM o o o
o o
©
co
tO c? o
m t o i n
cn
CO
t o t o o
o ©
m o
CO CO
G>
CO
CM
CM
_ a.
O
u . t D CO CO t O CM CO
CO
o
CO
©
0 0
CM
CO
o
CO o o © '
CM
o
CM
o o
2 o
CO
m
s CO
en
CM
o
l O
'"-
CO
CO r-CM
CM O
»7 O O O
CM
3
T t
5
I f )
d
CN O
*-. s
•» o
1 o d
3 o
s d
« • »
» r i
a ^
s
s ^
a
3 P
s c
1
St
T_ 2
2
d
^ d
<° S
• p d
1 o
s d
5 o
^ o
£ IX>
ft j - i
2 d
1
s t -
H T -
s 5!
a. s
I
"! S
n
o
I N
d
°° R
<•> • ^
1 d
s d
S d
3 d
„
£ CM
5
d
R. I M
a CO
° 2
a s
1 S
,_ a
v O CM
o
CO
o
CO
a
i n
d
CM
co © '
CO
o °
CO
o o
m
o i
3 t r i
CO t o CO
» co
CM co
CO CO
o
CM
o CO
Q. O O CM
CO CO CO
CM
o>
G>
O
t n
a
r«-o
CO
o
CO
o o
CO
CO
CM
o
CM CO
n
t n t o
CO
t o
o
t o
o
CD
o
a
CO t o CM
t o O )
a o (0 CM
• « *
CO
a
•«• s
.
d
d
"» R
r -o
i d
s o
s d
2 d
a W )
« <->
s d
g d
t
^
s ^
15 s
!S s
1 !
•° 3
•XT
V
CO a
s
r-o
1 d
° d
s °
s d
s • »
s m
s d
2 d
s ^
^ p
s K
I
>--. d
i d
3 °
5 d
5 d
s r r
?! I N
» d
1
s ^
a d
T
ff
1 s
r-o
CM O o o
CM
o
CO
p °
t o
G>
O) t o
•
CM
t o CO
°
o
en t n
*~ CM
CM
cn
l i es o
u t n
Z
>•
M
i / i
z
m
j
e in
§
e
JQ 0 .
3 u
o
u.
3
1 S
ampl
e
E a a.
E
E a.
E a . a .
E a . Q.
E
E Q. a
E a . a .
£ a a
E a .
E a
E a . a .
E a . a .
E a .
E a a
E a a
E a. a
CO
i n CM
CO t n
CM o CM
CO
m
CO
o CM
Oi
CM
O CM
cn CO
CM
^ CO
CO
CM
o CO
en
T t
?
O O O cn
CM
3 CO
CM
CO i n
t n CO
t o
i n CM
t o
cn t n
CM o CM
o
CO
i * -
co CO CO
CO
t o
1 ^
o cn t n
cn CO CO
t o CO
CM
a .
O O U-t o CO CO t o
CM
i n CM
cn CO
cn
CO
m
CM i n
t o o>
m CM
m
R)
CO
m
*
CO
2
^ CO
CO
o o O
r -CM
a
CO
c o CM
-
t o
CO cn
f -
t o
t o
3
t n
CO
t o
CO
s
CM
CO CM
cn CM
CO
CO
a o co
CO
m CM t o CM
a o
2
3
co
s
£
S
SI
t n
1
a
2
si
a
«> a
• O J
s
!
3
• *
*
1 s
»
s
5
°
S
»
1
» iS
z
s
5
<= P
m
*-
2
1
cn
N ;
s
1
CM
CM
i n CO
o
».
i n
t n cn CO
CO
co
CM
1 " -CM
CO
t n
•
-» ^
CO
o o
CM CM
cn t r i
3
a o u CM
*9 CO co CO
-
T
CO CO
CO cn
o
t o
t o CM
_ cri CM
CM
5
t o
CO
co'
cn CO
i —
o CO i n
CO
>n CM
m
m CM
a. (0 CO CM r ^ CO
a
-
T »
CM t n
CO o CM
t o
m
CM o CO
CM
a
CM
s
CM
cn t o
t o
cn
o CO CO
CO
cn
CM
O 111
CO CO CM CO CO CO
CM
s s
1 s »
I
r -
5
a
?
°* r o
5
1
s
R
I 3
CM
S
s
S
«,
i
-,
s
s
CO
a
p ^
m
3
1
3
t o
S
1 I
CO
cn t n CM
CO
ro t o
CM cn
CM
CO
«,
CO
i n
r-
CM t n
t=
CO
i n
"*~
2
o t n
CM cn
t o
CO CM
^5
o CO
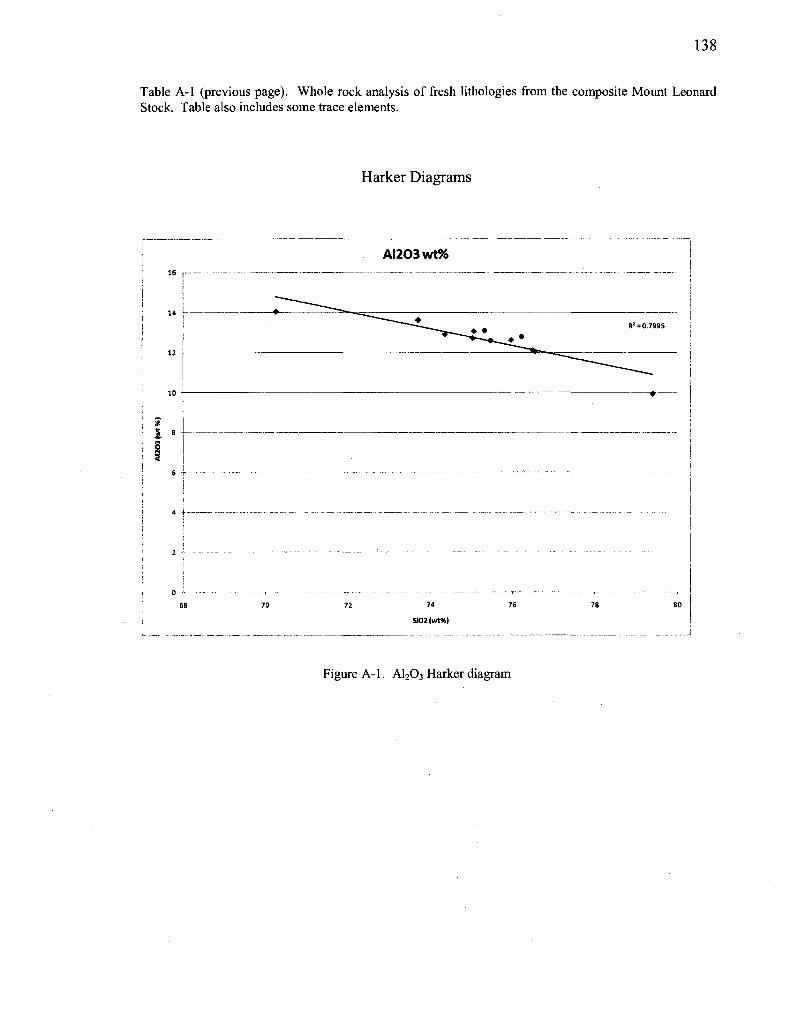
138
Table A-l (previous page). Whole rock analysis of fresh lithologies from the composite Mount Leonard Stock. Table also includes some trace elements.
Harker Diagrams
AI203wt%
0 *
68 74
Si02(vvt%)
Figure A-l. AI2O3 Harker diagram

139
4
3 -
2.5
I ' 1.5 -
Fe203 R! =0 3892
•
^ ^ ^
68 70 72
• " - • ^ ^
•
74
SK>2(urt%)
" • ^ ^ •
•
•
76 78
•
SO
Figure A-2. Fe203 Harker diagram.

140
Figure A-3. CaO Harker diagram.

141
I s -
2 -
1
0 -
73 .5
•
74 74.5
K20
• • » ——-—
•
75 75.5
SX>2(wt%)
•
76
• •
... -...
H'- 0.4284
•
76.5
"
77
Figure A-4. K20 Harker diagram.

142
Uranium R1 = 0.0465
6S 70 72 74 76 78 80
Si02(wt%)
Figure A-5. U Harker diagram.

143
Mo
80
I 1
•
•
R1 = 0.1404
•
Si02 (wtX)
Figure A-6. Mo Harker diagram.

144
3000 T Fluorine
Ft! = 0.1781
0 4—
68 74
Si02(wt%|
Figure A-7. F Harker diagram.
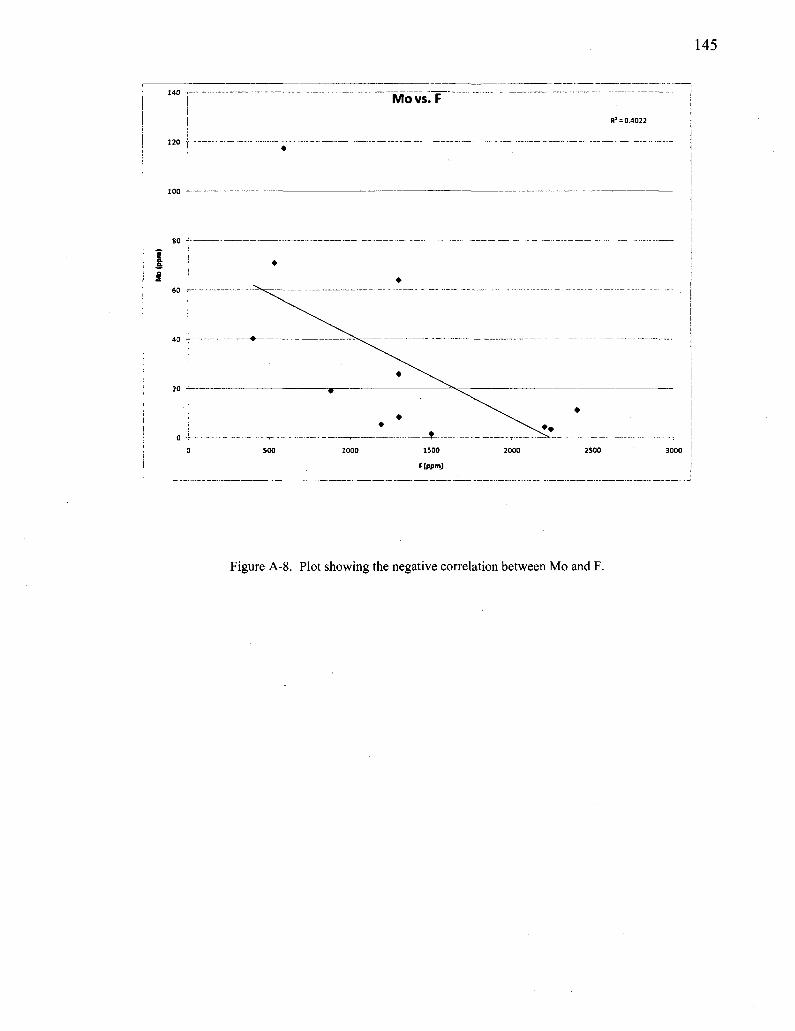
145
Mo vs. F
Figure A-8. Plot showing the negative correlation between Mo and F.
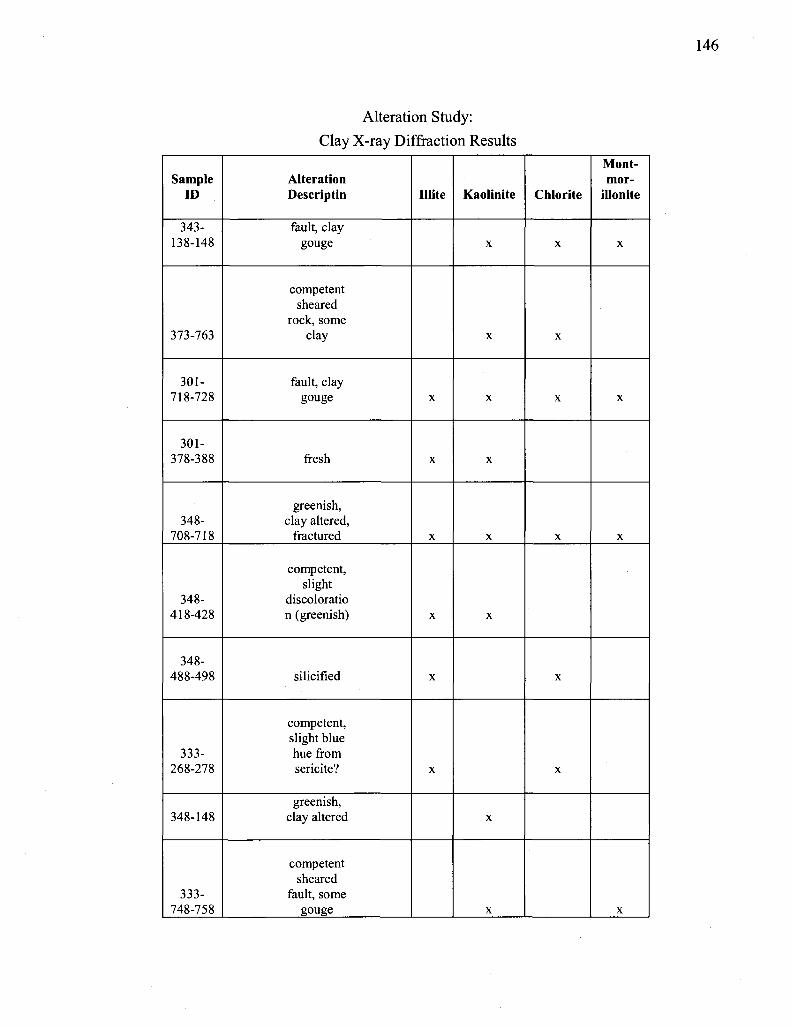
Alteration Study:
Clay X-ray Diffraction Results
Sample ID
343-138-148
373-763
301-718-728
301-378-388
348-708-718
348-418-428
348-488-498
333-268-278
348-148
333-748-758
Alteration Descriptin
fault, clay gouge
competent sheared
rock, some clay
fault, clay gouge
fresh
greenish, clay altered,
fractured
competent, slight
discoloratio n (greenish)
silicified
competent, slight blue hue from sericite?
greenish, clay altered
competent sheared
fault, some gouge
Mite
X
X
X
X
X
X
Kaolinite
X
X
X
X
X
X
X
X
Chlorite
X
X
X
X
X
X
Mont-mor-
illonite
X
X
X
X

147
318-759-769
326-285-298
314-638-648
314-278-288
304-218-228
301-378-388
321-89-99
321-449-459
323-158-168
330-659-669
326-618-628
321-459-469
fresh
silicified, fractured, greenish
fault
silicificified, competent,
bluish
competent but greenish
hue
olive green alteration
dark olive green,
fractured
fresh, but Q-S-P veins
oxidized and faulted, clay
gouge
fault, clay gouge
sheared, competent, no gouge
no apparent clay, but
stilbite veins
X
X
X
X
X
X
X
X
X
X
X
X
X
X
X
X
X
X
X
X
X
X
X
X
X
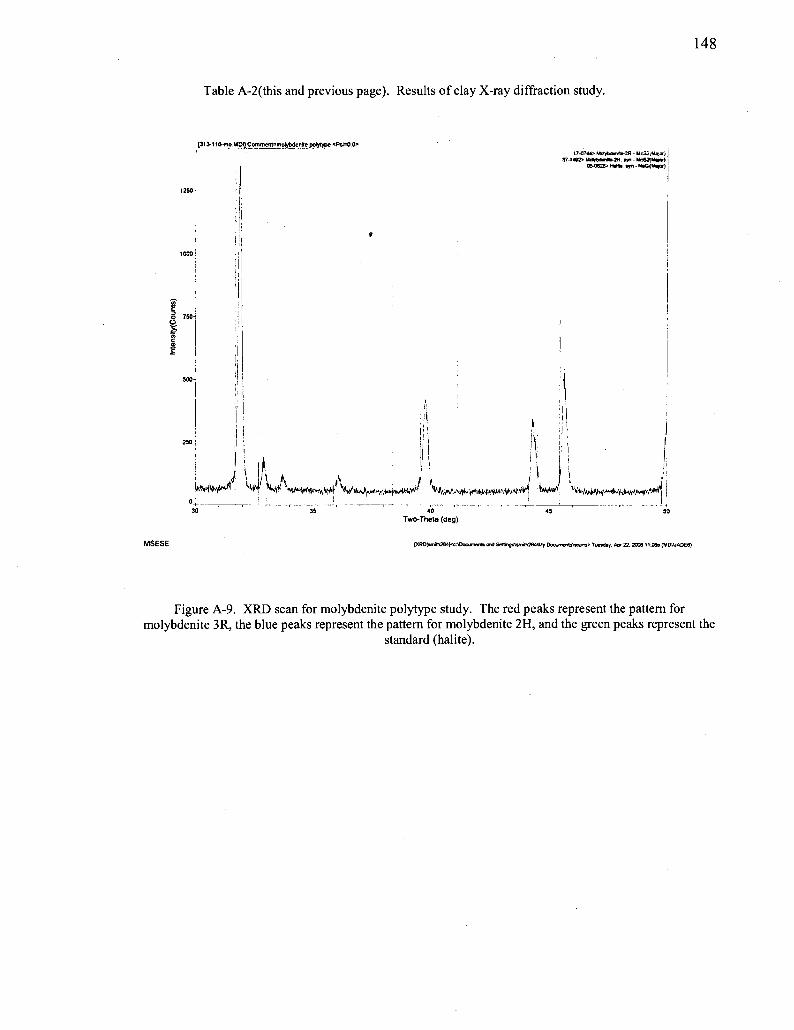
148
Table A-2(this and previous page). Results of clay X-ray diffraction study.
J313-11 (Mno.MDt] Commenfrmotyixlenlte polylype <Psi=0.0>
I,A
17-0740 Mof/bd«nrt«-3R - McS2,M^v) 37-1492* I M y M v M - I H , «yn - Mo62{Matar)
0SO62S> fWto syn - N«a<M^or)
i - i i • • I
Two-Theta (deg)
rXRD|smith264)<cAOocumart» and Settmgslamah264\My Document»tacans> Tuesday. Apr 22. 2006 11:08a (MD1/JADE6)
Figure A-9. XRD scan for molybdenite polytype study. The red peaks represent the pattern for molybdenite 3R, the blue peaks represent the pattern for molybdenite 2H, and the green peaks represent the
standard (halite).
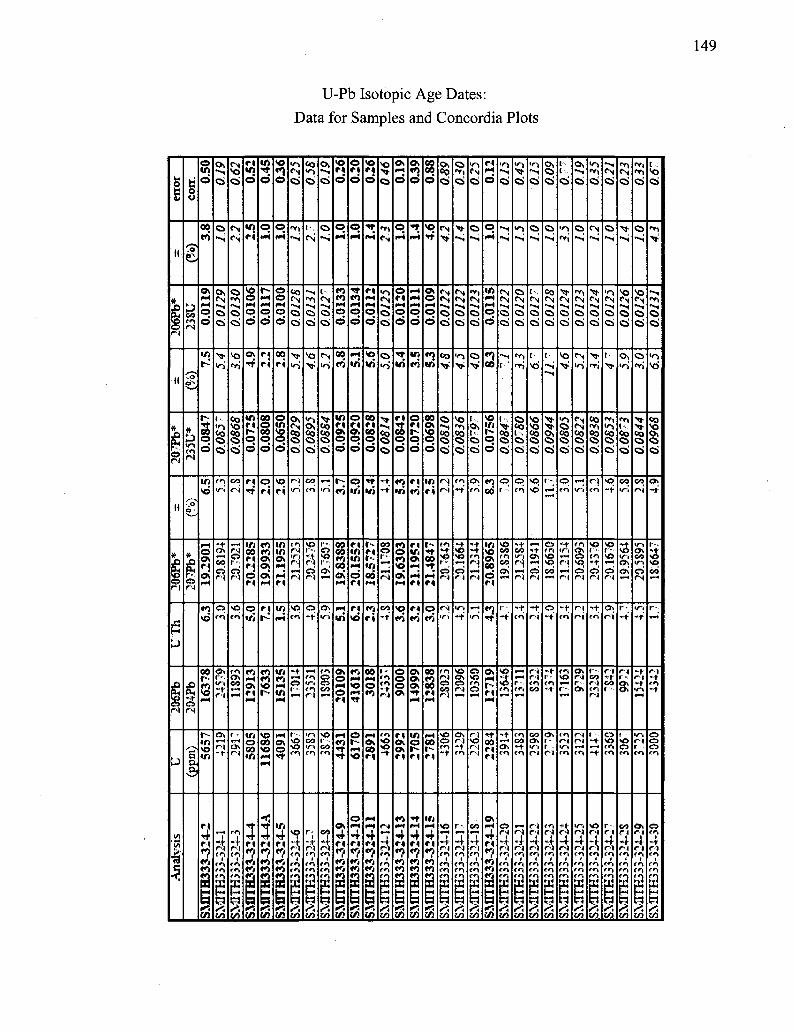
U-Pb Isotopic Age Dates:
Data for Samples and Concordia Plots
erro
r |
• « •
»
f N
II
# r-© r-i
II
*
©
UT
h
£ © C N
li
| A
naly
sis
o
CO f t <N
# D >« <*! rN
Co"
£ © r N
8 © <N
If a
o i n
d
00
<*>
ON
© ©
V)
s o d
w
vo
r H O ON C I O N
CO
VO
60 r--vo
•n NO W
c i
«?
*».
O N
c i
f N "•< C i
Ci
<r>
t--'r>
§ Ci
f t >fi
o* CO
3 © . f t
O N
f N
O N
f N - r
' ? f t
CO
f N
vri
vo r*i
CO r N
8 r -
rr-i
r t O N G O »-* •-•4
f N
" 1 4, f t
t f t f t
C I l f>
d
•n c i
©
d
ON
«n
© ©
c i
4
S3 c i c i © c i
o •ft
0
O N
C I
i n o 00 •n
3 r i
«?
a CO
0.45
|
o • H
O
d
c j c i
00
©
d o c i
ON
°i O N
NO
V© oo vo f H r H
3 CI
«? «*>
r*s e n
NO
2
q f H
© O f H ©
d
00 c i
©
$ d
VO
c i
i n i n ON »-; »H CI
•n I H
•n c» W
O N O re
i n
4 CI
«? «o «
CA
Ci
CO
O
ci
Ci
f t rM
*•* r<l
NO f t
s t -
f t
2 t
e n
t - ,
<S
' -t
Ci
VO
C i
CO f t
NO r-.
"A
©
f t
f f j
'r-t CO
f t
Si f t f t f t
O N
Ci
C» c i
Ci
S r -f *
O N
>fS
f t © © CO
NO
CO f t
OO
f t 1
f t f t
f*. i f )
VO
©
q
ft © d
00.
i n
© d
0 0 0 0
O N
l / i
O N
o © c^
ft
3
O N
4 CI
©
O
© f H
O
d
i n
o &! q ©
© i n
m
© CI
CI v^
v©
O r-f H VO
o r i
4 CI
«0
a 1 en
VO
©
CI f * ( r i ©
d
VO
in"
00 CI 00 © ©
<n
•n od f - t
<o c i
00
o
ON 00 M
4 c <
*? «0 «0
V)
vo
O
O Ci
C i
CO ©
CO
f t f t
f t o NO
f N
•-* f t f t f t
/5 f / )
O N
d
q
© CI f H o d
i t i n
2 ©
d
«o •ri
s ON r H
vq
© o © ON
ON C I
«o
4 CI
«?
1
O N
O
r H r H r H ©
d
m
©
o d
C I m O N f H
IA C |
O N O N O N "* f H
m © CI
i t f H
4 CI
•? CI
©
NO
4
O N © r H ©
d
0 0 O N vo © ©
i n ri
0 0 •«t »H C I
o
00
S3 CI
r H 0 0
C I
i n
4 CI
«?
2» ci
•v»
O Ci
Co
O
C i
f t
© r- l
>fS
f t
CO
f t «t
NO
4 r - i f t * f t f t
o Ci
•vj-
C l
c i
" 1
VO
c i
f t
v3 VO
© f - l
o * ©
O N
• t f t
r -
f t • f t r t f t
in
<-N| Cj
C i
«»l
~« C i Ci
I-
o Ci
O N
f t
3 f t
<ri
© NO f t ©
»o r i
CO
r- l
' ? f t f t
CI
d
©
m r H r H O
d
2
o d
"1 09
i n VO O N 0 0 © C I
"2
O N r H t -C I r H
-«• 00 C I C I
O N
4 CI
«? to «0
<r%
Ci
CS
Ci
t '
1--.
§ Ci
©
NO CO f t CO O N
r -
1 f t
» t
O N f t
©
f t f t f t
C i
O Ci
«»1
O
?? o c i
© f t
r <
f t
f f t
f t CO M-f t
3 r^ ' ? f t f t
$
CO
c i
C i
1--. rN
C i
Ci
t
vg § Ci
NO N©
© r- l
- t f N
r<l f t CO
CO O N
r- l
r>>
a f t r t f t
r*. CO
Ci
C i
~-i
<N C i
Ci
- 1
f ^
o Ci
© f t
CO
©
O N
r--r ' l
f t
3 f N f t
f t f t
CO
t t .
Ci
C i
Ci
VO
" 1 C i
§ Ci
© f t
i n
r - l
f t
f t NO r -***
r t r-» V l f t
*t r>1 f t
i f t f t
So
ON
Ci
C i
"»1
C i
Ci
•ri
P* 0 0 C i
c i
t f i
f t O N © VO ©
r l r N
O N r N r O N
r»l
r t
i r i r-i
i - t r j f t f t f t
r < CO
' r i " f l Ci
~-i
—i C i C i
f't
Ci
f t
NO t -t t
f t
t -co ri f t f N
r -.
NO
r ' | f t
t f t f t
B2
*>. CO
Ci
C i
~>i
<r\
C i
Ci
1-•v*
e o C i Ci
NO
r->©
© r i
O N
r i
r i
CO r-
© NO f t r t
I-r , ' * t ri "f f t f t
Li
«N Ci
VO <N
C i
Ci
ON ' r i
Ci
CO •ri
N3 t f i O N
O N
I--
* t
r-i r -O N O N
t -NO » f t
CO
r-i f t
t f t f t
3
rv, •*> c i
C i
VO <N
C i C i
C i
Co Ci Ci
CO f N
•rN O N CO • r t
©
• r i
rt,
P? f*1
4' r j f t • f t f t
Ps CO
t: VO
Ci
" f i •v>
C i
ci
' r i
VO'
CO VO
Ci
ON
NO CO
r-;
f t t
©
© f t
© f t
4 r?l f t • f t f t
8 r*< CO

150
V)
u 2 u
w
• J - J
•M
age
1 es
t
41
§ «
ii
£ ^ r^
H
1
I
I 3
i 3 <2
it
o * N
' S
<N
O rt
&
*
00 W
^
«»> 06
F *
«•! 0 0
r-
5» m
» ri 0 0
0 0
«•(
S * >ri « -
r l
4 «•<
m «n 3 g ir5
!/>
CO
d
5i 8
f i <-5
^ §
m
4
V l
CO
G O
©
oT «N co
4 r J e n ( i m
E ^ CO
« e S
5 * d M l • A F t O . w
2 g
-H
8 & d •a °°. oo i * ° rt a
3 7 1* | ° U)
•*-. i/S
c- r* c- c-c- e-c- e--
- j _i j 5 5 - J j > J - i -J CO
»-*
* t
S3
^
r7
-
0 >
r i
t n
a
0 0
~*
* t f»-l
e n
4 r- j « n < n m
B A CO
1 * ; PA
MS
F-t
in oo
F H
«*! «
F-( F *
r~ »-i
r7 0 0
•n
4
*•) f i
3 g « V!
» 6
o
K
0 0
i n
R
F F H
3
r~ d
o •ri
• <
-324
-4
« 0
«*) 3 S X ! VI
« o
FH
5
^
< 0 OO V I
R r H
oi
vo d
f-H
-324
-S
• O * 0
E E * 1 W
w
*-*
OO
oo
r-
4
5T •/-»
?s 4
GO"
o oo
~ -"*
oo"
oo
3 * 1 trn f t
O
»-; en
•»! r»
f ^
3
O)
oo
*> S
0\ t-n
^ oo
' n
r i
T ^
f o r i e**
g ^ V )
OO O
^ oo
oo CO
O^
?n 4
o 6
CO
oo"
c>
Z7 oo
CO
4 r n
i r i f*\
E ^ oo
o
»1 0 9
«-H
oo
F'
«») «
0 0
0 0
oo o
rT •n oo
o> 4
«? f )
w s s «*•!
v>
2
f H
s
0 0 in
O
" T f
**i 0 0
» d
r H
0 0
o r H
4
«») •n 3 g «i 01
o **
"i
F H
r i
>» »o
iio • »
0 0
d 0 0
o «
in »-
p-i r H
4
« <n s g <rt («
oo
•
o 3
t *
3
^T S
C O
e n
~ r-
co
—•
c^ GO
r-t
f o r i
H
! 0 0
0 0
d
00
^
?if oo m
ri T t
i-4
So*
0 0
d
oo"
m f-4
4
m en 3 g r<! t /1
O
M
q
in
r--
^ t 0 0 i n
TF
r i
« d •-
q F H
q
< t FH
4 ft
•n f i
3 E <rt !/>
<1
i~
^r d
e\ ui
in m
"f 0 0
FT rn
F oi
V I F t
4
m m
i & »« { / )
n f-n
^ oo
r n
~ r-' O
« f * i
~ CFN
C O
f t
^ OO
»o 4 I N r«-i
"-. r*>
2 E *<, in
—* •-«
n CO
< O
~ V"i
« < 1
'/-; OO
"ZZ
*-*
' n 0 0 r-
r^
4 r N
m tr\ r+\
5 »>< CO
CO
o
^ CO
*t r-i
*
O e n
O0 r-'
oo" O
« oo
oo
4 ' n t*\ r n
§ <1 0 0
l >
d
^ P
0 0
vi F^
F H
»
» t n
o
F d
•F P
0\ f H
4
• «*j
3 E »<J
!/)
CO O
„
CO
r < »-n
oo
« wi
«" OO
oo
o
~ oo r
o 4 r-n
" l e n
g r i
<< oo
r i
* 1"^
en
r
T •/-»
* i r N
m
f N
—
^T
<N
e n
e n <rn
g 5 ^ V )
CO
o
2 oo
n
«-t / N
*T wS
r*t
3
OO
o
m
CO
e n e n m
g g »>•« CO
0 0
o
0 0
oo
r -
3 I N
" 1
'«"> O
W~l
SI
oo o
oo"
CO
<*\ "> § g <-. « 1
oo r^
•F?
2: r-
_ OO o
~
v ^ r n
t-~.
oo
oo|
rJ
• t "
?i
- t
r+\ r o
i -1
CO
OO
o
~ CO
" fr
oi
OO
4 I N
H 4
^ o oo
OO
o
r-
oo
v~t
4 r - i
r o r*\
G ^ CO
°1 o
« f5
" ™ !
^ 2
r*
I N
r -
c o
O^
»
«
• o
4
tn m
s j \ CO
oo
o
^
o ^
O
v n
r-
oo
<*i
~ GO
CO
c>
5T I -
r-
o * n
g g ^ CO
•>-« «-i
O
CO
W-|
4 ' n
O
S 1 4
<* 4
p oo
7-7 * • *
p" GO
OO I N
* N
"> f*\
w ^5 CO
oo
o
oo" g
" s
cj" <N
• oi
**}
GO
CO
C i
oo" O GO
0\ I N
4, tn m
ffi S ^: CO
«o. f n
«i oo
r--
* • * * *
• f t
CO V"S
oo
f t o»
so r n
5C oo
O
3 r i * n
"> f t
E ^ CO

Table A-3 (two previous pages). Sample 333-324 U-Pb isotopic zircon analysis results.
133.0 -
93.0 •
8D 0 -
70.0 •
50.0 -
S 50.0 -40.0 •
30.0 -
20,0 -
10.0 -
0.0 •
. - * J £ 2 ? ^ - * - ^ -• t s r ™ " •**- ^
* N. •*
— r i 1
LL
1 r-
._,
- :—-*.•
1 — 1 ™ ' ' '
0
333-324
2030 4003 6033 8000
U(ppm)
10003 12003 14000
Figure A-10. Lead loss for 333-324. Samples in the box were not included in final age calculation.
data-point error ellipses are 2a
0.0145 4-
0.0135 +
I |0.0125 f
0.0115 +
0.0105
0.06 0.08 0.10 207Pbf235U
0.12
Figure A-l 1. Concordia plot for 333-324.

erro
r |
a
fN
tt
£ r--O fN
a
vo © fN
UT
h
1 VO © fN
U
| A
naly
sis
o
en fN
*
& a^ •v **
*
o n
i fN
5
fN
©
©.
—*
8 o ©
GO
O
fN
CO
CO
r--
oi
en
co CO ov
en fN
<3 fN
*»* i
r--vo en
4
co
r-i—•
©
1—-
—* fN — • *
O ©
r-ov
I ©
vO
r -'
Ov © r-
© fN
fN i
t-vO en
4
w »"< CO
©
4 fN
v© fN
© ©'
CO
© ©
f1
fN •+ Vi
©
rn
vo
Ov CO
o\ Ov
fN
en r-VO en
4
i f*. CO
©'
4
00 rN • o ©
CO
v-i
© ©'
•—< 4
Ov
Ov © rN
r-
v© rN IN CO
vo VO
vo en
4 v>—t
r-.
r--
3 © ©
—* fN
in
© ©
©
rN
Ov
2 CO
©v
rn
4
fN r-en
o> rN
VI
r-vo en
4
1 3
©
©
4 —*
3 © ©
CO
(4
-r »n CO © ©
rN
Ov VO rn ©
3
m
s vo © rN
VO Ov
*9 vo
4
CO
©
© '
•-* © ©'
VO
CO
© ©"
©. r4
© vo CO
»i
CO
to
en
3
o> r .
r-i
r-VO en
4
CO
© -t © '
en
*-< © ©'
© GO
CO VO t-© © '
en r—'
en CO <N
en
© © CO VO
CO 1
r-
4
CO
r-o
•"1
o
•n t
3 o d
GO
oo I-l
l/J
r-••H
VO r» 00
ON
VO
1 if. (A
Ov ©
d
©
©
d
41
oo © oo o d
in
4
00
oo ° 00 i-H
oo 00
0\
S3
o
vO
© CO
©
en"
*-4 *-• © ©
vO
4
oo © ©
CO
en Ov V~i
© eN
en
co
CO OV en ri
r-vo en
4 ft
e CO
0.44
|
••J
O
d
©
d
00
oo'
r; *6
o\ Ml Ov
oo VO m t-
vo
V)
CO © ©
© •-<
r-rN
© ©
en
© i— C O
© ©
en
v^4
-t
©
eN
"1 en
§ d
i
4 <—*
©
vp
•-<
© ©
vO
Ov en OO
© ©
-t vb
Ov
en
*t
CO
1
r». vo en
4
CO
©
•-* rl © © '
en «-4 CO © ©
Ov
4
en ON
Ov
© fN
en
rN CO
t
21 vO
»-< i
r-. VO en
4 v j — «
© en ©
vO fN
© ©
•TV
© ©
fN
r-r-.
©' (N
en
©
CO
© *-* en <N
vo ••-«
i r->o en
4
CO
Ov
©
00 l-t
© d
in
00
15 00 © d
00
© o o O V r l
oo
t-1
VO
X
6
0.131
© d
in
o d
<o
in
•n od I-I
«o 4
1-4
00 1-1
ri VO
I-I
Ov m ©
ten
CO
© ©
CO
en
CO fN OO © ©
en
CO -+ en r-i
fN
©
© CO en © fN
•-t
i r~ vo en
4
CO
0.23
|
00
to *0 o d
GO
rH
©
d
ITJ
5 o Ov
r-*
vO 4
© ri oo
o r» VO
O
r--VO
l-l
f^5
©
co vb
© fN
© ©
en r-'
r-CO r-© ©
VO
vo VO CO
©
fN
VO
4
en 'f-l
©
i
r-VO
4
&1
Ov
©
r--
© ©
OO
© ©
ift
CO
VO Ov ^ oi
4
©
vo Ov CO w>4
fN r -vO en
4
CO
JN ©
©,
3 © ©
VO
4
© OO
© ©
*t 4
©*
o
CO
t/~t
3
en r^ r-VO en
4
5 ^
«-i Ov ©
Ov r-'
3 © ©
fN CO
1—
CO
© ©
fN
CO •** Ov
©
en en
i r =*
CO CO
r-
r-l i
r vo en
4
CO
2
wl
<* «0 i-t ©
d
vq «»5
to
2. © d
m « • «
o <* ©
to VO
to T i-l r-
Ov r-Ov to
m rji I've
I - I
CO
CO en ©
en
—*
© en i — •
© ©
-t rn
fN
CO
© ©
en
CO vO ien
© r)
ri
Ov r-» r--fN
CO CO en
fN 1
vo en
4
B fN CO
VO u-i
d
fN
en fN
© ©
4
rn CO ©
en
vO
CO
*+ ©
CO Ov
vo VO •Mr in
r>) f-VO en
i CO
m d
vo
en fN
©
d
in
S d
Ov
4
»-»i
©
fN
Ov
en
Ov CO
3 © ri
CO
I've en
4
i 3
(-1
2
©
d
od
OV
o d
to od
r-I-H
oo od
00
to
fH f-l
VO
5?
Ov
VO
>-l
i Vi
Ov co ©
w-I
r-—-< © ©
CO
iri
Ov CO
© ©
1 ;
CO
>o o>
VO,
en
Ov CO fN 1/^
© en r-v© rn
4
fN CO

153
JS a *
tt 3 a >H B . k.
1 1
-H
• 3 | 5 £.2 g «
o
** y* • & •
e.. c c-
dd 1 dd 1 I d «
S s
DO
H
# | §
-H
£ --. o r s
H
tt
I .2
1 5
i
i 3 &
# £ o rS
S 6
y V * t c»"t
r s
3 6
si rS
© 0
O
P
^ G O C O
<n
3
i / ° i
*©'
*+ C O
co" O
O r-' r-
— i
t r ,
4 | >*, co
C O
i r i
F* r-'
r s C O
n *•*
'0 C O
N ©
s
co" v~i
~ r-' t r -
f N
NO
4
5 .
»
°i
5> g
f t
4 r s
co" C O
«N
__, 4
V~i
rS C O
<* — 1
oT d C O
f t
r -N O f t
4 | s. £
•" i
**>
5> 3
v - i
G~j>
>© O S
» 4
o r i &o
^ f i
o~" C O
"T r-f i
4 | ^ t o
C O
c i
© C O
GO^
1
r-© rs
C O
NO
~*. rs C O
co" r s
© C O
r-
V~l
r -N O f t
4
1 ^ CO
•-*
i r t
ON
^ f N O
r -
|
rS r S
R f i C O
*" —*
•r-1
oi r-
"9 NO f i
4 | •*, CO
O-J rs
<*1 ON
« O N
rS
^ rS
^Zi ©
~ f t C O
<* rs'
r n Os
!--•
r -r-
4
2 <-. w
>o r-i
i ^
~ g
^ ^ ^
M vS
~ r--
« r-i
w - i
0 \ r-.
C O
4
§ •- ,
«
05 O
F 1
o!
i n
o o5 o
o
«
00
p
00 o
r^ o\ «
Ot
3 <-H
1 o". on
°) o
•1
W)
o 00*
I H
i 4
W 00
c i o
o f -
o f H
3 f ^ <
S
m
0 0
(N
"
^ 3
V i
<> P - .
" f * i
^ ON
oo r-4
o >6 r--=
»-• r-
4
i <*, v>
o «o
a
g
f j
« K M «
r H
r^
^ s •-
o
«
o>
g
« » NO
3 ^ H
1 *rt if)
C O
o
" G O
Z7 C O
C O
p - ' C O
o o
r-
a
C O
O
^7 C O
rr%
r
4
i ^, t o
2
C O
P-5
o^
§
o *N O
^ <i^>
«> C O
r s
^
«T r-' p -
•-t
p -
4
| *.
w
Oj
«-j
f<1 v t
^ T ' . f * ^
^ ^ t
* * t
O N
oT , - i
<n r-' r-
w~j
N O
en
4 § ,
in
"2
*? S
?s r>4
r n
C O
^ t 4
o 3
f *^
«-
N O
o C O
N O
N O
'V
I /*, i n
°° P H
• n I -
#-( ui 09
• o\ o
00
«
i n
s
OS *4
e*K i n e^
i-» I H
<o
3 » H
1 * * 4
M
•flr
M
00
£
«•]
o " od «0
" H -
i n
s
*? ri
00 ^ t r^
00 * - i
3 r^
1 >5 OT
2
r^
C O
vST C O
oT tn *r*
oT f S
oo
C O
*N
—•
r~
C O
O N
r ' N O
4
I z'. OT
n
"•s 1
t
S
-* » 3
•-!
a
i -
£
• r i
» 3
o « • «
s i i .
< «r»
^
oT N O
« o r-.
• ^ T
'/~i
5? N O
r^ uS
T r-' r-
r<i r-. N O
4
| ^ w
2
CO N O
P O N
v ->
O N C O
p r-
co"
C O
r n
—•
C O
N O T--
r\ r j i r -N O
en
4 e jn
oo o
• fc
*f\
O
oT N O C O
^ f n
» C O
C O
o
^ O N
r-.
f * N
r s
N O
3 1 •*« CO
— N O
Z-C O
~ r-' «n
O Q
*<! r s
m N O
r - i
ON r -
^7 N O
Z i" C O
r-
* t r s
N O f t
4 | <>. t £
05 e
i n
•£
r H
O 00
in* 06 ( - 1
O *
«
00
00
5\ 0
i n i n 00
i n n f^.
3 f*
| « i en
^ »-*
^ S3
r s r n
^+ O N
r s
~ r s
O N
C O
"~ —*
r r >
f r j C O
N O
r s
N O
4
I »< w
"s
~ I 3 \ 1-^
0 0
0 0
O N
C O ' O
T («-i
T C O
T —•
* O N
r-
r-rS
N O
4
§ r>< CO
f n
*-•
•o C O r-.
^ N O
O r-.» r -
ON c*S
f * l
C O r—
r^t
w-l
>r\ C O
r -
co n N O
4
| ,
«
r j P H
O
»0
»1 0 9 0 0 1 -1
"« i n m «
•i)
«
r - 4
K r
r j i 4
q o\ «o
o\ f l
3 r^
i **i c«
r i
• ,
Vt
C O
</-! N O
O O
C O
4
N O
s
r s •*+
""! C O
O <-«-i
N O C I
4 I § jo

Table A-4 (two previous pages). Sample 314-367 U-Pb isotopic zircon analysis results.
100.0
95.-0
90.0
£5.0
SO.O
75.0
73.3
« 5.0
63.3
55.0
50.0
INH
314-367
0 1300 2000 3000 4000 5030 6000 7000 8000
U (ppm)
Figure A-12. Inherited zircons (INH) and zircons that showed evidence of lead loss (LL) were excluded from the age calculation.
data-point error ellipses are 2c
0.0145 +
0.0135 +
3 0.0125 +
I 0.0115 +
0.0105 +
0.0095
0.03 0.05 0.07 0.09 207Pbf235U
0.11 0.13
Figure A-13. Concordia plot for 314-367.

8 $ 8 8 ">
«•> «0
©> vo i/> oo
©>
$ s «»)
®i oo
<»} «*)
P
«*> & 3
p
8 S3
(» ?/) V) <W

156
a.
IS
is
J J 5 NJ -J U
•J J •J -J
-1
grapppppppsrarap^
i
t :8
S
1
1
<3
a 3
a
a
s s
a
s
'!

Table A-5(two previous pages). Sample 352-1000 U-Pb isotopic zircon analysis results.
300
S50
80.0
' 75.0
70.0
55.0
50.0
INH
- 3 N *
.r.V '-V. *'• ' . . - \ • ^
Si
*
*
*
LL 352-1000
0 2030 4000 6000 8000 10000 12000 14000
U (ppm)
Figure A-14. Excluded zircons of sample 352-1000 age calculation.
0.0135 4-
,0.0125 +
a.
0.0115 +
0.0105
data-point error ellipses are 2o
Sample 352-1000 Concordia Age =
79.5 ±1.6 Ma MSWD (of concordance) = 5.8, V.
0.03 0.05 0.07 0.09 207Pb/235U
0.11 0.13 0.15
Figure A-15. Concordia plot for 352-1000.

£ s
Ov «0
• • ! *o 00 o
oo Ov 0\ 00 ON
*© v<>
V© r»
n
D r* 3
en CO
4
1 $1

159
1 1
•J • J
-H
1 est
M
H
s r j
H
C N
H
« r « j
i / i
Analv
si
L
>-?
i a &
i
r * }
IS
V >
<1? rt
§
y CO
•<n M
o
©
o
t e
r i
» d i f )
• »
r i
Os to r»
p - t
e i 1© »»l
4 3 E «•*! (/I
" —
~ ©N' r-
37 r N
^ d
o -r
r -
d CO
•7" ~*
r* O N
f " N
A
3 t3 «< CO
5
i* a &2 n I - I Ck k.
1 § PL, C
-H
• 3 1 S
I 5
1 I IS » >* t/>
P
—
« £
^
~ s
""» •/-I
—• S
o
~-
*> O N t—•
m
*"**
C O
O
© O N
NO"
" N
V I
>r\ * 0
r-C O
C O
©
o O N ' V-
T
I £2 g **. t o
"1
—
© ol
V I
vi CO
©
d r—
©
»o"
FT C O
~ • • —
© O N r-
v i
rf>
I s S, CO
r{ i M
*5
in 4 to
C H
0 9
?! o l - l
00 d
^ «-H
I f i
•A f -
*9
3 SO
S E #*; en
2
« S
G O
NO CO
oT NO CO f*1
^ f r-t
^ C O
T *-
*© O G O
r -A NO
i s H
^ t O
oo d
n O N
m CO O N
-*+
O N "
K
NO oC NO
oo o
rr\
O N
C O
r^i NO
i w »-•, V3
M M
O
J
*o
• >
CO I f )
« CO
'T f (
o *o t ~
a.
4 >o
2 g «*, en
°1 o
»
i>
5 p»i
•
_ >rl
*o
CO
oT d
r H
i/i r-
o r H
N O
2 g K l
cn
o
*"
"f rv.
^ o
Os
3
rC r-4
r^ 25
o
—
«7 r-' r -
*^l *©
I E . t o
c» f N
M-T C O
•*t C O
co" CO O N
r i S O
O
C O
e> f N
vT H C O
r^
A NO
I w «< oO
Os
e
r^
g
R NO "N,
^ CO O N
r-r S
^ S
oT d
'*> d C O
r*>
^ <o
i 2 E <>. CO
oo
e>
^
n 3
r*.
d
r -
O N "
O N '
oo d
« r-' r-
* t
r^(
I S *-; V )
I-J « H
r H
P
0 0
« •n
t ^
« • f )
f - 4
*-i
i - ^
i*i P
V )
l-H
4
s E »-, w
oo O
« s
f*l r-'
« H r-
f S - t
-T d CO
C O
d
NO"
d C O
N O
* N NO
I G 5
CO
a d
is
00 4 <o i^
F^ oi
f O
•o d
oT d
•1 *o r
i -i ^
< 8
£ £ i <
cn
o> o
^7
s
^i O N r N
rn O N
**% d
fr\ N O
O N "
d
»Z7 d C O
C O
A
n <5 CO
ai1
n
2
**!
«1 *0 n
"f" oi
00
of
NO r-
o% f - 4
N O #H
4 2 E Kfl
CO
» - l
f H
<« s
i ^
^
p>H
4
oo*
So
P H
^ H
« 1
s
o r« t
4 <o
3 E #< cn
t r ^
*-
f S ON'
Z^
3!
• ^
^4
oo r-'
•r*>
C O
</-[
—
' N O N
r-
f S
r-'l N O
E ^ t/3
C O
d
C O
so r-
(*% g
• 1 V~l
Z-" f * >
?o r-
co"
d
C O
N O r-
<N r- l
^ NO
3 ^ <>. V I
C O
d
F
,r! CO O N
^ 3
- t tn
oo C O
oo" d
*t r^' r-
f,rJ r-i A N O
E *>. CO
09 O
i>
o d
1-4
OO
in
r H
4
oo
fi
0 0
e
x^ N O
r-
• t
r< NO
s a *r, in
C O
o
^
~ r-.
v ~ t
2
O O
C O
"^ CO r -
oo d
« r-' r -
iy-i c-i
si »o
i f »
5 • V )
C O
d
5* VO
^ r--f N
NO"
•5* C O
O ON" r -
oo"
d
O N "
N O
r-
N O
r n
d NO
5 §5 ^ C O
f-d
^ in
o in
oT
•n ri
F i n
r«
00
•> d
~ in i - -
»--e«
4
9 E » i
cn
")
i ^
» r
p CO
r i
r-
3 rsi
~ I--'
* t
oo
'n"
"-
V I
O N r-
C O r^
di NO
i m
E >, CO
«1 « H
2 in 4
7i a. IO
* H
m
o i > 00
r\ F - l
•rj t o i -
o\ r i
y f H
s E i**!
cn
oo d
vF
ZT
B
r -
1
7 *T
VI
•J,
co"
d
r r-' r
O f n
A NO
i € >5 to
oo d
^
oo C O
•
* f
« f
Z " NO CO
oo"
d
*7 r~' r-
O m r s NO
i E s. CO

Table A-6 (two previous pages). U-Pb isotopic zircon analysis for 364-162.
S3 0
81.3 -
79.0 -
ii.a • a> O) 75 0 -(0
73 0 -
71.9-
69 0 -
67.0-
l
| INH .1 *
• • • . . • . *
.** ~ ^ — — LL
•
1 533 1003 1503
U (ppm)
2033 2503
3S4-162
3303
Figure A-16. Zircons excluded from age calculation for sample 364-162.
data-point error ellipses are 2a
0.0116 +
0.0112 0.00 0.04 0.08
207Pb/235U 0.12 0.16
Figure A-17. Concordia plot for sample 364-162.

erro
r |
u
6 1
H
*
H
s
UT
h
r)
U
| A
naly
sis
corr
. |
g
8
g
1 g
*
3
1 !
1990
© e-i
r-eN »-i
© ©
o, en
en
© ©
r-l
so OO e-) CO
© rl
CO
'Q so en en
i O N en ON
1
en en
co
0.43
|
I-i
tO 1-1 1-1 © ©
Tf
«o
in
P o d
1-4
«*5
Tf © ••I i-i
NO
•/•;
Tf
Ox o ©
ISM
TT
H33
3-93
9-2
0.43
|
1—I
en
© O
en
eN OS
© ©'
en
t r-o> <n © ' eN
en
en
en • — i
i
ON en ON
(TO en
£5
0.12
|
©
ON — • 1
— © ©
GO
r3 GO © ©'
lei
co
en en CO
o\
e-l
CO
oej en
3 0\
»1'
1
en
to
0.54
|
en
© ©
CO
en
en en oo © ©'
en
3 en
O
GO
r--=-
CO
v©
»—• Ov en
0.24
1
—*
IN
©
© '
©* oo © ©
«f
¥ n 4
s 'e-l
© ft
NO en
©
*<*
CO <N en
SO
i o> en
en en
co
0.48
|
©
r-i
©
© '
r>i
r--© ©
CO
e->1
©
CO
en
ON
r--« i
CI
•=v ci
«3
0.30
|
*-• © ©'
r--© ©
^ **
CO
a: ©'
•H1
© ©
CO
1
en
en
0.75
|
o
o O ©*
w5
© ©
«5
so VO
t o
© M
a,
t
V)
0.14
|
fA
tf)
i-t O ©"
6
00
©
©
©
O !»' i-l
00
if
o r» <^ «^ OS
»
a u tr, V)
0.19
|
r-i e ©'
v©
oo
P o d
SO
O
o *f
9,
SO
i
ox »
0.07
|
©.
1-4
o ©'
(A 00
ON
d
-«f oo'
oo Oj »-i r-t
oq
so ON
1—1
so
tn Ov
i
<^
0271
©,
© ©
fn
© CO I— © ©
'"J CO ©
CO
3
en
ISM
TTH
333-
939-
23
©
©.
© ©
ON en
CO
© ©
CO
en
en
en
© '
»»'
sg
I -© v-t
t r-1
en
<* en en
10
0J2S
1
OS
O d
*» H
o d
•n oo
09
1-ON
00 SO r« •ft
•«
in
ON
«*) Ov
*
1
0.10
|
—
© ©
GO
en
OS en O
©
CO
en
r-l
SO
CO
en e-«l
© en
S en en en
^ < CO
0.49
|
•*t
© ©
r-1
O N
r-© ©
O N e-t SO CO
© eN
1^-
ri
so
en
SO •N CO eN
Ov
°t en en
to
0.03
|
*•;
en eN
© ©
©
©
O N
-+
CO CO "* •-• r-' r)
en
en
en
oo <N O N
en
°t en en
e^ CO
0.10
|
<N
© ©
d
O N SO
©
-t ©
in
CO
CO
N ©
rl
3
ON
o\
en en i 3
0.10
1
l-H
SO (H (-1
o d
00
d
in
oo o d
oq © 1—1
oo P so in ON e-t
©
00 p-l rH SO
•* «o e-t
O
2 «0 OS «0
«o
s E
0231
ON —4
O N
—«» © ©
© CO
en • — •
oo © ©
CO
r-'
r-
ON
r-oo'
»»'
CO © NO
SO
s en
|SM
ITK
333-
939-
31
0.14
|
SO i-4
•of © IH O d
•«f
•* r-© d
>-i e-l
so e-t
O
d
Tf
•n
so in
r-t
00
«? ON
s;
1 ••A en
022J
©,
—* <N
s ©
NO en CO © ©'
en
CO
©.
se NO •e-i CO
CO
*f
en en OS en
en en
i
0.601
O N
©
©
-*
r% CO
© ©
en en
NO
en
ON'
•y-t
CO
r-. Ov
-r m o\ en °? en en
SI CO
0.16
|
in 1-4
»-t
e-t
© d
© ON
ON SO
O
d
OS
00
Tf m so
d
so SO
o rl
2
«0 •n i-t
m «? OS «0 OS CO «0
e»S (7)
0.07
|
q i-i
in r-l »»1 O d
so
x~l
1 © d
so Tf"
OS O N
so 1-4
i-i 4M
SO
ri
«o
o •n m
so
s «0 «0
1 3
1— NO
©
un — H I
r-
© ©
en
© ©
*™*
o NO rvi
— e-(
O N
© © NO CO
3 r4
ON en
i CO
©
©
—
— rs — © ©
eN
en
© ©
H1
Ov
CO
SO
CO »f i/~»
en
CO en
ON
en en
r". CO
0.36
|
r-4
© fN © ©
OS.
en <»—1
§ ©
i/-i
en
en ©
© •f
•r-i
NO '/"I
OO
O N
en
o\ en ON I
en en
*>. CO
©
in Tf
m i-t
© d
<"1 i-i
o d
" J *-4 1-4
O •2 •n 1-4
d ri
1-Tf
«o <0 fl m SO i-i
•n
5
©
SI 1
to to
3 **.

162
Err
ors
J J
•H
tagc
30
•H
s
^
41
» fi ^ -N
I I
* £ S •N
& $
_
-5*
s
? e
'ea*
2.
*
o r ^
"co1
* r *
<s
f » r^i
3* <s
_
*» ""
"1 CO
co"
c o "
a
f i
r N
^T H CO
NO"
—•
< r t
.—» C O
— O N f t O N
f t f t
1 /•. en
q «H
^ S
0 0 f i
TF t - ' I/)
"i f l
q~ f i 1 -
q F H
*F #-i r~
f j
a O * «*?
«*>
( A
2
i n "
C O
f t
f t r-
o" oi
>--•
H
c o " e > C O
rT —*
»<n C O
r -
f t
O N f t O N
f t ' n
| »-*, co
(9 * N
e "
i * s as « »H O . v« o o £ S
-H
"31 " E5 re u
3 *
IS ** p >. co
dddd 1 d d dd d » o
"! r5
<* S
<* §
*>. «
- i s o o
~ o
"1 *> r-»
2
**! *
oo" CO
N O "
*t" f i
p" f t
f N
f - i C O
«" -*
GO"
C O
r~
•/-t
O N f t O N
r * t rn r n
^ CO
C O
©
c o "
s
~ 3
C O
e n
' /-t f t
~ C O r->
c o " ©
C O
•o r -
- O
O N f l O N
f l " 1
| ^ 5 V I
C O
O
*n
37 f i
7 g
*r *—
«* r--r -
c o O
l O
r '
""
r -
o\
"» ' • n
[2 <-, </>
q • ^
•n S
o" 8!
So" C O
T '*>
oT *b r*.
O
*-•
<r> • O r"
C O
cVt " 1
m *-n
| »<; V I
I - ;
f i
rT
s
0 0 NO
#-4
P" «
00^
o F-
F~" f i
•n 0 0
*o
O t
<*i oi «i « * j
1 * " t
w
P H
f i
^ R
•n r f
0 0
f i U l V )
£ •
oo' r *
i - l
C?
s
^ f i
i? «o i - -
o f c (
«o ON
« 0 f i
l •<! 0 0
n «
<-H
P
V » f )
fT
« •
i - i e l
^ M K
^ r
c i
f )
K
t-*
ox « 0 0 \
* 0
«n
1 -.
oo
^4
P*
fi
^ so V )
r - t
0 \
»-* « 0
«*)
in «*>
; r f
••H
r - t
ri t -
r<
o\ f O o\ *n f i
s </>
o o O
5"
"*T C O
r r -
~ »N
~ « r *
oo" O
^T »b r -
'A d\ O N
m m f O
, CO
O O
o
o" r -
~ o>' CO
r*-i
p" f i
~ C O r -
co"
o
o" r -r -
Ov f i o% ' • n ' o
| »*. i />
"i • H
^ So
P i
e>
oo" o 0 0
«" >d
* f o o,
57 F H
^ f i 0 0
i n
Tf 6\ *o o\ m «*i
| *% V )
p *
o" o o
~ O N
o"
*o
JT f >
-«
-i
o" —•
o" CO r -
5? O N f t O N
f t * n f t
, CO
•-« ~*
"^ r^ r^
o" 8
57 O N
r7 * N
~ r- ' r -
" —*
~ r ^ r*
O N
O N
f t rn
| ^ { / I
—H
—
Z7 O i
f N .
~ O N
~ v-i
n
r". —* NO
~ —'
~ O i t -
c o r-4 O N f t O N r * t ' n f t
**« CO
C O
O
> ^ t
u
~ N O
r -
C O
*T »-« ""
f t
r i ^
C O
O
• o 0 C O
O*
O N
f > rn f t
* , CO
°? O
P H
?
p ^
§ f «
•r f «
• 0 0
*o A 1 -
0 0 0
l - t
•<f r-
0
f )
°f f O
w
1 § ( / ]
• 4 ^
^ rS
O O "
r -
> r n
f t . f t
w - t
«
p" w-i C O
r -*
m NO' r"
f t
ck » f > " 1 f t
^ CO
1 -4
JT T * « f «
^
OO" t ^
F H
O P
^ * H
w7 « *o
f i
«*) s « 1
<*) 1 «» </)
CO 0
c o "
C O
s
0 "
a
V~l
t*\
\5" *-• C O
C O
0
c o " r- ' T-'
f t f t O N
O N
f t f >
1 4
0 0
"! «
? S
e»" r--
T f t
n f >
~ 0 C O
5T ^
0 " N O r -
- t f t
oV f N O N
f t «*1
| ^ 5 CO
q P H
r - 1
P
vo" 0 0 0 f l
0 0
i5 r-4
*o VO
fT vi 1 -
q" F H
f - H
f i r~
w>
ON * 0 O N
*> f i
1 < EO
r-d
r "
s
0 0
0 0
«
fT
• O F H
••r f o t ^
F" d
f " »*) t -
«
f O
s m f j
1 **, ( A
*-< «
<$
?f O
%^-7
S
NO • - -1
oT - t r -
-T »-.
r ^ i/~i r--
0 ^ f-n O N
f t r * i
| SI CO
C O
0
•**f P-*
0 0 "
O N
t+ CO NO
r ^ < n
f n
O 0 0
C O
O
*tf r -r"
CO f t
t O N f t O N
f t f t
| ^ CO
NO 1-t
oT NO
co" C O
p v - i v- t
" • t
- t
Z+" O i r -
N O "
* - i
oT N O r .
O N f t O N f t O N
f t f t
1 r * . 0 0
1 «»)
«7 P
o"
f <
fT r~
o" oi
F " *o r~
*T «o
ST eo r-
0
O N
<*) O N
«r. •*1
| *r4
(/i

Table A-7(two previous pages). U-Pb isotopic zircon analysis results for 333-939.
85 0
80.0 -
75.0 -
70.0 -
„ 65.0 -
«?63.Q -
55.0 -
50.0 -
45.0 -
N
# V f , • * T » ^ ^ .
V*
I •
• I • • • • - • • • " s ^ • *
' -^ T • - » » "^--^ LL
Drscsrded from the age calculation
) 1000 2000 3000 4000 5000
U(ppm)
5000
Figure A-18. Zircons discarded from the age calculation for sample 333-939.
10.0124 f -a a.
§ 0.0120 +
0.0112 +
data-point error ellipses are 2a
0.0108 0.00 0.04 0.08
207Pb/235U 0.12 0.16
Figure A-19. Concordia plot for sample 333-939.

erro
r |
H
»
II
*
o
M
U-T
h
£ 53 o C4
U
| A
naly
sis
1
g 23
SU
g
235U
*
Co1
!
1
o
o CO
o
6.8
QG
60 0
i*~ to
18.7
369
7.0
3784
13
59
|SM
ITH
364-
342-
1 0.
441
O) C\i
CO
ci
6.5
1680 0
5.8
20.0
170
4.3
8126
43
05
JSM
ITH
364-
342-
2 0.
17 \
3.1
0.01
21
18.8
0.
0883
18
.6
18.8
806
2.5
4541
89
7 IS
MIT
H36
4-34
2-3
0.45
1
CM
o o
CM eg
0.08
39
o CM
21.0
772
3.0
1481
4 41
82
[SM
ITH
364-
3424
0.
361
o
CM
o o
2.8
0.08
35
CM
21.3
573
4.0
1170
5 28
92
ISM
ITH
364-
342-
5 0.
33|
1.8
0.01
20
5.6
0.08
46
5.3
19.4
745
4.0
7625
38
08
[ SM
ITH
364-
342-
7
<o o
C\J c\i
0.01
27
3.3
0.08
49
c\i
20 6
106
oo
2186
0 34
13
[SM
ITH
364-
342-
8 0.
36|
1.0
0.01
35
2.8
0.08
88
2.6
20.9
939
4.3
1506
9 31
84
| SM
ITH
364-
342-
9 0.
07]
1.0
0.01
33
14.7
0.
0934
14
.7
19.6
584
4.9
6989
13
35
[ S
MIT
H36
4-34
2-10
0.
45|
1.2
0.01
08
2.7
0.07
28
2.4
20.4
647
6.3
1295
7 58
50
[SM
ITH
364-
342-
11
0.34
2.
4 0.
0119
7.
0 0.
0846
9"9
19.4
444
4.0
6137
46
30
ISM
ITH
364-
342-
12
0.45
| 1.
0 0.
0133
2.
2 0.
0879
2.
0 20
.908
7 4.
3 21
095
4087
[S
MIT
H36
4-34
2-13
0.
371
CO
oo CM
o Ci
3.5
oo o o
3.2
21.0
634
3.2
1225
9 26
68
[SM
ITH
364-
342-
14
liso
1.6
0.01
21
2.8
0.08
07
2.3
20.7
027
4.0
1524
1 33
60
|SM
ITH
364-
342-
15
0.62
1
CM
CM
o
3.5
0.08
41
CM
20.2
710
9.2
1557
4 82
72
[SM
ITH
364-
342-
16
0.21
1 0.
0130
7.
3 0.
0950
7.
2 18
.861
2 5.
6 31
93
2770
[S
MIT
H36
4-34
2-17
0.
16\
0.01
26
10.7
0.
0743
10
.6
23.3
554
3.2
1224
9 67
6 [S
MIT
H36
4-34
2-18
0.
25|
1.1
0.01
42
4.4
0.10
05
4.3
19.4
784
4.6
1794
0 38
51
[ SM
ITH
364-
342-
19
0.08
1 0.
0123
19
.0
0.07
79
19.0
21
.795
7 3.
7 11
528
801
iSM
ITH
364-
342-
20
0.74
1
co CM
CM
CO PP80 0
2.1
19.8
420
6.2
1833
3 50
20
[SM
ITH
364-
342-
21
\190
1.9
0.01
21
3.4
91800
2.8
20.4
798
4.7
1285
9 29
73
[SM
ITH
364-
342-
22
0.40
\ 2.
7
CM
O
Ci
<6
0.08
57
6.3
19.7
608
4.7
5518
0662
[SM
ITH
364-
342-
23
0.39
1
*** CM
CO CM
O O
5.2
9880 0
4.8
19 6
488
4.4
9030
o oo CO m
[SM
ITH
364-
342-
24
0.64
1 0.
0124
2.
5 0.
0862
CT>
19.8
048
7.7
1376
7 44
21
[SM
ITH
364-
342-
25
0.24
| 1.
0 0.
0118
4.
2 0.
0738
4.
1 22
.015
9
3.3
1252
1 14
61
|SM
ITH
364-
342-
26
0.74
| 3.
2 0.
0116
4.
3 0.
0791
2.
9 20
.292
7 10
.0
9092
59
87
[SM
ITH
364-
342-
27
0.53
| 3.
2 0.
0119
5.
9 0.
0834
5.
0 19
.617
5
3.3
1188
1 41
75
| SM
ITH
364-
342-
28
0.44
1
<o
0.01
29
3.5
0.08
75
3.2
20.2
549
12.2
38
796
1001
5 |S
MIT
H36
4-34
2-29
0.
471
0.01
27
3.6
0.08
43
CM CO
20 7
235
o
3069
4 64
80
ISM
ITH
364-
342-
30

Err
ors
LL
S
yste
matic
A
naly
tical
0.9%
1.
0%
LL
INH
??
Age
er
ror
INH
??
81.6
±
1.1
Ma
LL
INH
??
Pro
pagatio
n
LL
1.4%
INH
??
LL
LL
LL
LL
-H
Bes
t age
n
#
II
*
H
*
| A
naly
sis
I
I Id"
c
-3
CO
en
0.8
83.1
15
2.1
344.
6
6.0
92.6
CO
o
83.1
|S
MIT
H36
4-34
2-1
2.4
83.4
13
5.7
193.
0 5.
4
87.2
2.
4
83.4
|S
MIT
H36
4-34
2-2
2.4
77.5
42
5.0
327.
2
15.5
85
.9
2.4
77.5
a to n X h-E
0.8
82.1
46
.6
71.6
1.
7 81
.8
CO
o
82.1
[S
MIT
H36
4-34
24
0.8
82.8
62
.1
40.2
2.
2
81.4
0.
8 82
.8
|SM
ITH
364-
342-
5 1.
4
76.6
12
1.7
256.
5
4.4
82.5
1.
4
76.6
IS
MIT
H36
4-34
27
1.7
81.3
57
.8
124.
6 2.
6
82.7
1.
7 81
.3
|SM
ITH
364-
342-
8 0.
9
86.5
60
.9
81.1
2.
3
86.3
0.
9
86.5
|S
MIT
H36
4-34
2-9
0.8
85.2
33
9.6
234.
9
12.7
90
.6
0.8
85.2
iS
MIT
H36
4-34
2-10
0.
8
69.3
56
.8
141.
3
1.9
71.3
0.
8
69.3
|S
MIT
H36
4-34
2-11
1.
8
76.5
15
0.6
260.
1
5.5
82.5
1.
8
76.5
|S
MIT
H36
4-34
2-12
0.
8
85.3
46
.8
90.7
1.
8
85.5
0.
8
85.3
|S
MIT
H36
4-34
2-13
1.
0
82.3
77
.0
73.2
csi
82.0
O
82.3
|S
MIT
H36
4-34
2-14
1.
2
77.6
54
,9
114.
1
2.1
78.8
OJ
77.6
|S
MIT
H36
4-34
2-15
S ;
ZSl
64.1
16
3.6
2.8
S
'-
79.2
|S
MIT
H36
4-34
2-16
e>
83.2
16
2.8
329.
6 6.
5 92
.1
<Ti
83,2
|S
MIT
H36
4-34
2-17
80
.6
264.
2
-178
.2
7.5
72.8
-*
80.6
|S
MIT
H36
4-34
2-18
1.
0
90.9
98
.3
256.
1
4.1
97
.2
o
90.9
|S
MIT
H36
4-34
2-19
CVJ
78.9
46
1.7
-8.7
14
.0
76.1
rsi
78.9
|S
MIT
H36
4-34
2-20
1.
8
77.9
CO
•<* C\J
2.5
82.3
CO
611
|SM
ITH
364-
342-
21
2
77.5
64
.9
139.
6
2.6
79.5
in
77.5
IS
MIT
H36
4-34
2-22
78
.7
146.
2
222.
9
5.5
83.5
2.
1
78.7
|S
MIT
H36
4-34
2-23
1.
6
80
8
110.
1
236.
0 4.
3
CO
10
80
8
|SM
ITH
364-
342-
24
oo
79.3
44
.9
217.
7 2.
0 84
.0
en
79.3
[S
MIT
H36
4-34
2-25
0.
8
75.6
99
.6
-33.
0
3.0
72.3
0.
8
75.6
[S
MIT
H36
4-34
2-26
2.
3
74.6
67
.1
161.
1
3.2
77.3
M
74.6
|S
MIT
H36
4-34
2-27
2.
4
76.0
11
6.3
239.
7
4.6
81.3
2.
4
76.0
|S
MIT
H36
4-34
2-28
m
82.3
74
.1
165.
4 2.
9 85
.2
n
82.3
|S
MIT
H36
4-34
2-29
1.
4
81.2
74
.9
111.
7
2.8
82.2
<*
81.2
IS
MIT
H36
4-34
2-30

Table A-8(two previous pages). U-Pb isotopic zircon analysis results for sample 364-342.
Figure A-20. Zircons excluded from the age calculation for sample 364-342.
0.014
,0.013 +
a. %
0.012 +
0.011
7 N Sample 364-342 Concordia Age =
81.6±1.1Ma V MSWD (of concordance) = 12
data-point error ellipses are 2c
0.03 0.05 0.07 0.09 207Pbl235U
0.11 0.13
Figure A-21. Concordia plot for sample 364-642.

1
U
*
f N
«
O f N
+1
*
©
f N
UT
h
© r N
D
| A
naly
sis
1
2
1
£
g
1
1 !
©
©
f N
© ©
f N
( N
3 © ©
© rN
1 r<*
en
8)
C O
v - i O
3 en
t • f t
en
t o
s© rs ©
© IN
S O
» t f N
i n GO
S ©
© < N
* t
en I N
CO CO Os rN
c? *+
•1 rN en
t i r s
e n
•r* , t O
»t r ->
©
r - .
— 1
S© I N — i O ©
<N r - i
r -
© '
© I N
«-4
CO ©N r-'
r-1
r-6 0 CO os
r N ©
" 1 1
ft
P ©
C O
f N
co f N
© ©
en
os CO CO © ©
C O
f N
©
1 CO O s
f N
r-co
- t •n
5?
en I / - I
i—
©
m I N
m r N
— 1
© ©
o> en
en co © ©
en
r N e n * t r N © ' f N
O s
e n
s © CO so V I r *
"4 ' r t
en i
1 t o
©
f t ,
m
— I
rN •—• © ©
© en
S ©
so r N
n so r-
f t
© en CO <n
—• r-
*©
M-en
t '.n
E Si CO
1^1
© '
© ,
?5 © © '
CO
CO © © '
r-.
©
" 1
e n
r -
f i »(. en •/
to
© '
©
© ©
co r4
CO © ©
^ H
©'
«o
r-. CO
CO
e n
i l l
< • ; JO
0.08
1
o
00
a ©
00 ©
t»4
ft
00'
w w
^-
P — 1
©
1
> *
3 r-t
00
o
©
o
00
© ©
oo
r--© •ft
00
© i r*
«?
©
©.
© © '
^ m
© ©
©
s e n © '
r - -
<rn
SO
CO
r -
e n i
•o © '
"!
r-r~l
© ©
1 © ©
c 1 e n
CO
© '
O s
2
O N f n r
r - l
i r | * t rn
1 • n
e n
(A
O
o
©
i o
ao
ON
d r»
SO
o>
1
r<
CA
© © '
««4
o.
© ©
r*. r-'
OS
r-© ©
<N
CO
CO
t
« t o
©
© '
"t
© *-* © © '
CO
1 © ©
CO s© r » SO ©'
O s
r-i so
•^-i
»*
en i *n
ft gs
5 ©
s ©
00
OS ©
©
• r i SO so 00 00
oo od
r-«o f t so
so I
r« • *
en
c s r s | © '
©
I N
©
©
» t
<o CO © ©'
m
> *
3 « S
en
en
t e n
r ^ ^+ e n
i i n *•»« e n
B t o
l - t
d
p
oo
©
d
od
©
© d
so od
^t i n S O
l -H
r H
o OS
*o
OS
i - (
00 l«H
CO
0.12
|
SO
©
d
ae*
o oo © ©
OH
OS
SO
So od
f t
O S O S SO S O
Os t - l
i r« f t
00
s
© l-J
p> i ©
d
© d
so
S O
f t
d
f t
Os r--tr,
( - 1
O S
r--00
o *,' f t 1
1 i—c
V)
©
r>i
(N • M M
© ©
CO OO © ©
O s
© © CO CO
r-4
§
s SO
f N
d' e n
»r>
e n
B t o
C O f N
©
•N
©
© ©
© ©
r .
S O
O s
" 1
O s
< N r \
* t " • 1 O s
-v en » « n
e t / 3
S O
©
co <N • - 4
© ©
so r N
© CO © ©
r>4
e n e n r -
sb
O s
r -
en rN
en 1 ' r - l - r e n
t •r» T-4
en
t o
CO r N
©
©
<N
SO
»»i
© ©
•-<
CO © ©
O s
so
© m S O
O s
O s
O s
t i n
en
rn r4 en * • n
en
0.17
|
00, r H
<o |>H m © d
d rH
d
so d r i
Os
•H
so
00 Os M
f t
SO
<7 f t
2 rH
£ V)
en T - l
©
<N ••*
S O r N
©
©
O s
©
O s '
© CO CO
en
r-4
en
f t
r | «t
r • r l r-1. •(• en
i
T*4
ft
IN ©
fNJ
i /%
© ©
O s
i r i
r N
CO © ©
CO i/^t
© f N
1
S O C O <f"s r-)
1 CO
CO r-l rN t en 1 / ^
J2 t o
0.07
|
00 rH
rH
rH
© ©
O
SO
r i
©
d
Os
i/j
r H r i
f t
f t
f t
Os
Os
O S t »
1
r< f t
rH
1
©
en en
O s
r - i
© d
CO r--
en f t r-
©
r '
so
s I N
e n
en sn
© © r *
© en A -+ en i y >
ft r - .
t o

168
« »
n *-t a. »-* 8 M V
-M •3 *9 °>
'p 2 •-•§ g o> «> S tin
3 •"-
1-to
>. V)
d l 1 $ ddS d d
-H
4)
TO
+1
»
r»
i\
*
o f N
-H
# £
w
s * 3
•c?
i " i ?
i f
# O <N
1?
S
f N
1?
S
CO e n
0 0 O
*-g
* N
3
• * *
vb -*
T - ;
""*
f N f N OO
GO~
O
~ © D O
rJt e n
e n
E B •: co
» i I N
" E
e* a-; f N
oo en O N
en
E
• vi O N
" f N
r-. vb r -
r N
- t
e n
B ^ co
"! " • *
oo
s
©T
r N
~ vb e n •**
C O
©
r--e n O N
e n . — •
C O
© ' C O
r n r4
c i
B ,*, GO
f l f S
p 3
^ 3
f l
•~* r ^
n e n
v->
CO
f N r N
© f N C O
f N
e n
£ S •>< CO
C O
—
^ C O
^
CO*
8
» e«-i
I/~I
C O
C O
»-*
v© C O r -
<N
e n
P C3 S, 0 0
NO I N
7^
<* o< r--eN
i n e n
vo
en"
z
oC g
« eN
e n r- ' r -
r n
P fcl ^ CO
CO
o
^F
7^ r-
en C O
-+
f N
w~i
~ o\ r-.
C O
O
Zf
r -
- t e n
e n
E CI /< CO
C O
o
C O
s
•/-» 8
« S O
"*
r N f N
*? e n CO
CO
O
C O
G> C O
C O
rn
en
£ H A </)
00 o
*o
iC
S' o
*F f i
^
?V • / i OS
00 o
» i/i •--
o\
V )
*»* E Q «". if!
o
s
3
» ^ i
««" <d
?7 d 0 0
i n P H
o
s
o f - i
r<
s ^ E 5 *« c/i
C O
o
__
~ r-
O
§
v- i * N
e n
C O
co" O
r--Oi r -
r-!| - f e n (/-I
' 1
^ w s* to
p ' -
• ^ C O
r r--
f S V"i O
co" H
^ t
C O
p •-«
T C O
f N
eN
e n
P w , < / }
°s o
S3
w
0 0
in r f i - t i-H
Ti m
•1 0 0
0 0
d
0 0
*n ( - 1
t
2 ^* E Q f*.
(/)
O
""
« s
p
^ C O C O
r--r i
eN f t "
p •—•
^ f N C O
- t
eN
e n
P W X CO
•""!
—
5?
^ 3 e n
Z7 r^
—
*+ O
* CO r--
«" « - i
ON"
•O r-
•/-» r-!t
r n
2 t i K*. en
*! M
i n
« 0 0
ri TT
«
00 ^H
0 0 t \ 0 0
« ^H
•n r H
E Q •<! C/3
0 0
o
"^ g
C O
8!
^p r-> *o
<r i t n
~ en CO
co" O
" o C O
r-
e^i - > * • •
e n n n
" 1
^ B s. K/i
">, o
i^1
•n
'T
o
F i ^
«
^ «
m •n
0 0
d
r^ •n i > -
0 0
**
2 ^ i
3 6 **. if)
i ^ d
i n
^
« f t
^ H
d
in
»
00
»
F" o
v7 ^t r1-
O t * H
1
2 r«H
E Q
» v i
°> o
oo •• 00
iT m
« r^ i--
• r«
F H
S
« d
0 0
S
e rt
3 r ^
E Q ^ C/3
**t ~*
*n
r ^
en
^o »b e n e n
r -
zn
e n
C O
• O T - t
W- l
r -r -
t
* t e n
f f l ^ ^ • < CO
r-.
""
p
~
M
e n ON e^l
ro vb
~ a
rT ™
p r- ' r -
e^i
e n
e n
E qg «** CO
m.
Ov
oo
^n oi
V O
O
*-*
^T r N
oT eN CO
e n « M
ST C O
e n r N
e n i r>
P ^ <5 CO
><> ""
C O
s
r C O
^ C O r n
5? i r i
r N
*6 CO
^9 — i
DO"
O C O
' /-I
r! .
e n W™1
en
E B ^ to
f -4
»H
•fi
« * H
0 0 CO
S) 0 0
•1 f -4
i n
ri
« rp
•n
^ E Q « i CA
p
""
p 0 0
V I
w-i 8
en •b < n r n
5* r-.
o" §
p" » » i
p C O
r-
rn
P s ^ CO
p
' -
o
s
r--.
vb e n
^ r • CO
f t
**•'
rT o CO
p • «
o <» C O
D O eN
eN * t e n wn
P ^ /*. CO
n ^
o
5G
•n
in e i
pH
e\
O
>/i r-
o\ r i
2 < E Q
•5 ! / }
i r i ( N
^ is
C O
r-
v- i CO en
V I
v >
r -
r-.
" 1 <N
T vO r'
O e n rN - t e n i n
P Cl i^S to

Table A-9(two previous pages). U-Pb isotopic zircon analysis results for sample 315-342.
93.0- I
8 5 . 0 '
8 0 3 '
<U O) ?5 0 • TO
70.0 •
S5.Q-
60.0 •
< *
1 1 INH
• tf -#—
• • • '
• • •
i 1 ~
« LL
1
1
2000 4003 6000
U (ppm)
5000 10003
31S-342
12033
Figure A-22. Zircons excluded from the age calculation for sample 315-342.
135 +
125 +
115 +
data-point error ellipses are 2c
105
Sample 315-342 Concordia Age =
79.9 ±1.5 Ma MSWD (of concordance) =11.6
0.03 0.05 0.07 0.09 207PW235U
0.11 0.13
Figure A-23. Concordia plot for sample 315-342.

NAVDAT Areas of Interest:
Sample IDs and Locations (Decimal Degrees)
Area 1.
SAMPLE ID 9167
9E58B
9174
9I09A
7N98 9R19B 7N135
LATITUDE
46.3903 46.3742
46.315 46.3586
46.4092
46.3219 46.3825
LONGITUDE
-122.078
-122.151
-122.132
-122.185
-122.059 -122.104 -122.111
Area 2.
SAMPLE ID
90TF032
90TF033
90TF046
90TF051A
90TF096
90TF102B
90TF104
90TF105
90TF108
90TF109
91TF070
BCP258
90TF010
981B-26
90TF102A
90RL002
90TF022
90TF032
90TF033
90TF046
90TF064A
90TF066
90TF095
90TF098
90TF099
90TF100
LATITUDE
46.732
46.7643
46.7665
46.8449
46.5504
46.5685
46.5139
46.5124
46.4978
46.4853
46.4762
46.7895
46.6744
46.6358
46.5685
46.7075
46.6294
46.732
46.7643
46.7665
46.7194
46.7133
46.5616
46.5319
46.5548
46.57
LONGITUDE
-115.551
-115.494
-115.382
-115.619
-114.969
-115.07
-115.109
-115.117
-115.155
-115.155
-115.088
-115.598
-115.058
-115.512
-115.07
-115.092
-115.475
-115.551
-115.494
-115.382
-115.123
-115.108
-114.93
-115.057
-115.072
-115.067

Area 3.
SAMPLE ID
78WM010A
78WM021A
78WM081B
78WM097B
78WM184A
78WM194B
79WM021A1
79WM081
787-21B
787-21C
787-21D
787-25A
981B-19
89RL072
92TF139
92TF120
92TF150
92TF151
92TF155B
92TF113
92TF108
92TF114
92TF118
92TF119
92TF120
92TF150
92TF151
92TF152
92TF153A
92TF154
92TF167
92TF172
92TF174
LATITUDE
45.9698
45.9242
46.034
46.093
46.1405
46.034
46.093
45.7725
45.9833
45.9817
45.9733
46.125
45.7067
45.7614
45.4117
45.5305
45.6976
45.7029
45.6308
45.6242
45.5119
45.6463
45.5301
45.5305
45.5305
45.6976
45.7029
45.733
45.6818
45.6659
45.636
45.6533
45.7278
LONGITUDE
-114.841
-114.883
-115.007
-115.117
-114.97
-115.007
-115.117
-114.674
-114.965
-114.965
-115.002
-114.933
-114.6
-114.782
-114.373
-114.439
-114.54
-114.631
-114.834
-114.854
-115.041
-114.6
-114.437
-114.439
-114.439
-114.54
-114.631
-114.744
-114.81
-114.807
-114.92
-114.948
-115.077
Area 4 (next page).

SAMPLE ID
84-5
84-11
85-56
84-32
CBC87-24
DPI
K47
L81-28
MCR 7 82
MCR 7 83
MCR 7 29 1
MCR 7 29 2
MCR 7 30 2
MCR 7 30 3
MCR 7 30 5
MCR 7 3 1 1
MCR 7 312
MCR 8 13 1
MCR 8 13 2
MCR 8 13 3
MCR788
MCR 7 5 7
MCR744
MCR745
MCR 7 4 6
MCR 6 30-1
MCR 6 30-2
MCR 7 5 3
MCR74 2
MCR 7 1-4
THR 62995-1
THR 62995-2
THR 62995-3
THR 62995-4
THR 62995-5
THR 70395-2A
THR 70395-3A
THR 70595-4B
THR 70595-7
THR 70795-1
THR 70895-1
THR 70895-2
LATITUDE
43.7014
43.7411
43.7
43.6856
44.1736
43.4
44.0729
43.55
43.8269
43.8275
43.8244
43.8236
43.8203
43.8242
43.8283
43.8244
43.8264
43.8319
43.8347
43.8375
43.8261
43.8289
43.8297
43.83
43.8303
43.8303
43.8297
43.8311
43.8258
43.8364
43.7419
43.7414
43.7453
43.7461
43.745
43.7539
43.7533
43.7528
43.7519
43.7569
43.75
43.7497
LONGITUDE
-114.72
-114.669
-114.734
-114.646
-114.944
-115.65
-115.265
-114.9
-114.547
-114.548
-114.553
-114.553
-114.557
-114.555
-114.557
-114.575
-114.574
-114.579
-114.579
-114.579
-114.546
-114.544
-114.537
-114.538
-114.538
-114.538
-114.538
-114.547
-114.534
-114.539
-114.632
-114.633
-114.633
-114.634
-114.635
-114.646
-114.645
-114.646
-114.646
-114.651
-114.647
-114.645
SAMPLEJD
TAM18
TAM5
TAM11
86RL-257
86RL-386
CBC87104B
CBC87-19
CBC87-23
CBC87-42
CBC87-82
L86-33
L86-37
L86-38
73-Tg
78-Tga
83-Tr
107-Tr
65-Tr
KR57T
RR135C
8519K
86135K
8725K
RL374
RL73
981B-59
98IB-61
MCR 6 30-3
MCR 6 30-4
MCR 6 30-5
MCR 6 30-6
MCR 6 30-7
MCR 6 29-4
MCR 6 29-5
MCR 6 29-6
MCR 6 29-7
MCR 6-29-8
MCR 6-29-9
MCR 7 29 4
MCR 31 3
MCR 315
MCR 7 8 5
LATITUDE
43.7
43.7047
43.7056
43.4833
43.5439
44.0597
44.2056
44.1736
43.4
44.3
43.8264
44.2875
44.2875
43.9139
43.9083
43.9175
43.9006
43.9178
44.0098
43.8458
43.6383
43.69
43.7814
43.5533
43.5533
43.655
43.7128
43.8297
43.83
43.8286
43.8286
43.8283
43.8264
43.8269
43.8264
43.8269
43.8258
43.8256
43.8228
43.8264
43.8356
43.8267
LONGITUDE
-114.721
-114.695
-114.692
-114.967
-114.878
-115.731
-115.098
-115.018
-115.857
-115.631
-114.578
-115.158
-115.158
-114.505
-114.512
-114.518
-114.453
-114.498
-115.372
-114.591
-115.828
-115.668
-115.32
-115.83
-115.83
-115.738
-115.628
-114.537
-114.536
-114.538
-114.538
-114.539
-114.537
-114.538
-114.539
-114.539
-114.539
-114.539
-114.553
-114.574
-114.566
-114.547

173
Area 5.
SAMPLE ID
SPI-A
64W66
RM-47-66
RM-11-66
J l
RM-17-66
RM-19-66
RM-1-67
B110
B120
B130
B170
B90
H80RUBY2*
H83RUBY106* H83RUBY108*
IL180
IL20 IL40
IL50
IL70 IL80
ILI-26 LEE-11
LEE-4BB
LEE-4BM
LEE-5
LEE-7
LEE-8
RD-IOC
RD-lOE
RD-13av
RD-19C-analysisl
RD-19C-analysis2
RD-20
RD-21
LATITUDE
40.851
40.5159
40.4125
40.3874
40.3874
40.3942
40.4267
40.3089
40.6048
40.6064
40.605
40.6082
40.6067
40.6175
40.6175 40.6175
40.6199
40.6159
40.622
40.6174
40.6157
40.6224
40.6083 40.6022
40.6481
40.6481
40.6438
40.6481
40.6438
40.585
40.585
40.6146
40.6012
40.6012
40.6012
40.6011
LONGITUDE
-115.237
-115.555
-115.545
-115.499
-115.499
-115.435
-115.432
-115.501
-115.39
-115.389
-115.379
-115.378 -115.39
-115.392
-115.392
-115.392
-115.387
-115.378
-115.375
-115.388
-115.389
-115.375
-115.387
-115.381
-115.407
-115.407
-115.411
-115.407
-115.411
-115.393
-115.393
-115.375
-115.379
-115.379
-115.379
-115.38
SAMPLE ID
RD-23
RD-28
RD-29
RD-32
RD-4
RD-5
RD-57
RD-59
RD-70
RD-73
RD-74
RD-79
RD-7B
RD-81
RD-82
RD-83
RD-84
RD-85
RD-88
RD-89
RL-16A
RL-16B
RM-20
BB-103-94
CB-295
HP-39-95
BB-17-93
BB-102-94
HP-8-95
HP-11-95
BB-99-94
HP-17-95
HP-21-95
HP-28-95 RD-22
LATITUDE
40.6021
40.5942
40.601
40.6008
40.6009 40.5997
40.6065
40.6029
40.606
40.6099
40.6099
40.5959
40.5935
40.6148
40.6147
40.6147
40.6022
40.6022
40.5945
40.5925
40.6672
40.6672
40.778
40.3057
40.3393
40.3681 40.3687
40.3033
40.3405
40.3421
40.3396
40.3018
40.2988
40.3897
40.6011
LONGITUDE
-115.377
-115.387
-115.381
-115.382
-115.38
-115.381
-115.384
-115.381
-115.385
-115.385
-115.385
-115.392
-115.383
-115.377
-115.376
-115.376
-115.387
-115.387
-115.386
-115.385
-115.446
-115.446
-115.311
-115.504
-115.473 -115.557
-115.555
-115.504
-115.563
-115.559
-115.534 -115.521
-115.539
-115.526
-115.38
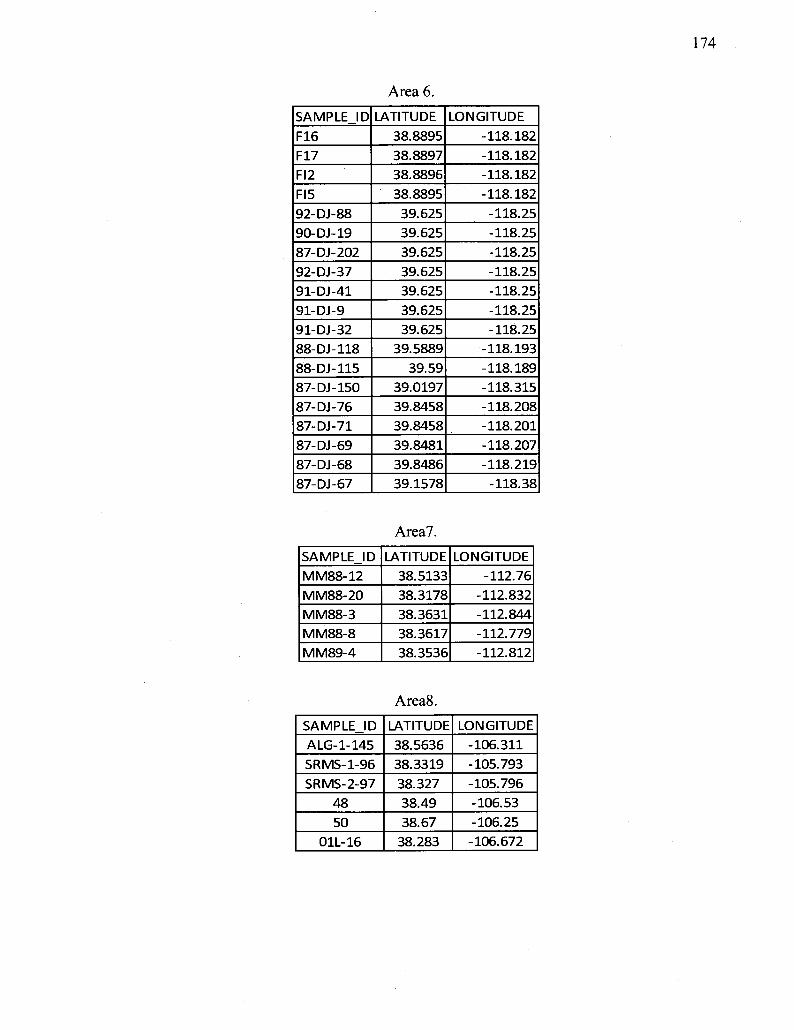
Area 6.
SAMPLE ID
F16
F17
FI2
FI5
92-DJ-88
90-DJ-19
87-DJ-202
92-DJ-37
91-DJ-41
91-DJ-9
91-DJ-32
88-DJ-118
88-DJ-115
87-DJ-150
87-DJ-76
87-DJ-71
87-DJ-69
87-DJ-68
87-DJ-67
LATITUDE
38.8895
38.8897
38.8896
38.8895
39.625
39.625
39.625
39.625
39.625
39.625
39.625
39.5889
39.59
39.0197
39.8458
39.8458
39.8481
39.8486
39.1578
LONGITUDE
-118.182
-118.182
-118.182
-118.182
-118.25
-118.25
-118.25
-118.25
-118.25
-118.25
-118.25
-118.193
-118.189
-118.315
-118.208
-118.201
-118.207
-118.219
-118.38
Area7.
SAMPLE ID MM88-12
MM88-20
MM88-3 MM88-8 MM89-4
LATITUDE
38.5133
38.3178 38.3631 38.3617
38.3536
LONGITUDE
-112.76 -112.832 -112.844
-112.779 -112.812
Area8.
SAMPLE ID
A LG-1-145 SRMS-1-96
SRMS-2-97
48
50 OIL-16
LATITUDE
38.5636 38.3319
38.327
38.49 38.67
38.283
LONGITUDE
-106.311
-105.793
-105.796 -106.53
-106.25 -106.672

Area 9. SAMPLE ID
MP-192
MP-845
MP-117
MP-156A
HD01-83
MG-2
HL-29
DVB-110
DVB-117
DVB-131
21C
29-0
49C
97A
7A
46B
104A
AB-1011-10
AB-1011-17
AB-1011-31
AB-1011-8
LGC-11
LGC-25
LI-35
M742
1S82
1S128
LATITUDE
37.6333
37.65
37.5667
37.55
37.8449
37.2283
37.1083
35.3153
35.6361
35.1939
37.0567
37.0439
37.1878
37.2117
37.0994
37.1494
37.1972
36.8167
36.7833
36.1667
36.7583
35.7425
35.6874
35.7128
36.9842
37.0883
37.1346
LONGITUDE
-119.317
-119.417
-119.383
-119.367
-119.373
-118.595
-119.145
-115.582
-116.275
-116.143
-118.558
-118.57
-118.614
-118.548
-118.644
-118.617
-118.551
-118.9
-118.625
-118.7
-118.95
-118.411
-118.416
-118.392
-118.744
-119.133
-118.455
SAMPLEJD
68M40
67M46
67M93
68M2
68M1
M794
FC01-03
IP0203
85S74
HD01-78
HD02-96
IP0203
1S23
1S24
1S27
1S28
1S29
1S51
1S52
1S53
1S54
1S58
1S77
1S79
1S80
1S81
LATITUDE
36.8974
36.9081
36.7755
36.7759
36.7795
36.7817
35.6957
36.7602
36.5617
37.8391
37.8311
36.7603
36.7189
36.7191
36.714
36.7147
36.7153
37.104
37.1011
37.0999
37.0986
37.082
37.0993
37.0963
37.0942
37.0901
LONGITUDE
-118.656
-118.679
-118.63
-118.616
-118.615
-118.64
-118.239
-118.262
-118.554
-119.486
-119.349
-118.262
-118.961
-118.962
-118.975
-118.976
-118.977
-119.09
-119.09
-119.094
-119.101
-119.136
-119.109
-119.11
-119.118
-119.126
Area 10.
SAMPLE ID 93-80
93-77
93-91
B21 D42
D51
LATITUDE 35.5428
35.5336
35.5844 34.5944
34.8436 34.8392
LONGITUDE
-114.558 -114.512
-114.482
-113.233
-113.773 -113.76

Area 11.
SAMPLEJD
509
513
620
LATITUDE
36.3996
35.6133 36.7213
LONGITUDE
-102.245
-101.999 -103.333
Area 12.
SAMPLE ID
502
519
520
LATITUDE
33.5356
33.5529
33.4491
LONGITUDE
-100.85
-100.275
-100.133
Area 13.
SAMPLE ID
TmoeDl
SUM
RE1
3591
3491
3691
3791
292
192
1691
3891
LATITUDE
32.3027
32.3454
32.3676
32.4153
32.4153
32.4153
32.2611
32.2611
32.3411
32.3417
32.4153
LONGITUDE
-106.535
-106.564
-106.588
-106.592
-106.592
-106.592
-106.533
-106.54
-106.492
-106.486
-106.592
Area 14.
SAMPLEJD
R34 DM04-564
DM04-633B
DM04-589 BS04-329
BS04-246D
BS03-51 BS05-845
DM04-600
DM04-665 BS04-264
LATITUDE
33.155 33.3417
33.3492 33.3594
33.3436
33.3596
33.3578 33.3693 33.3527
33.3618
33.3531
LONGITUDE
-111.051 -110.892
-110.847
-110.852
-110.898
-110.879 -110.957 -110.983
-110.85
-110.878 -110.85
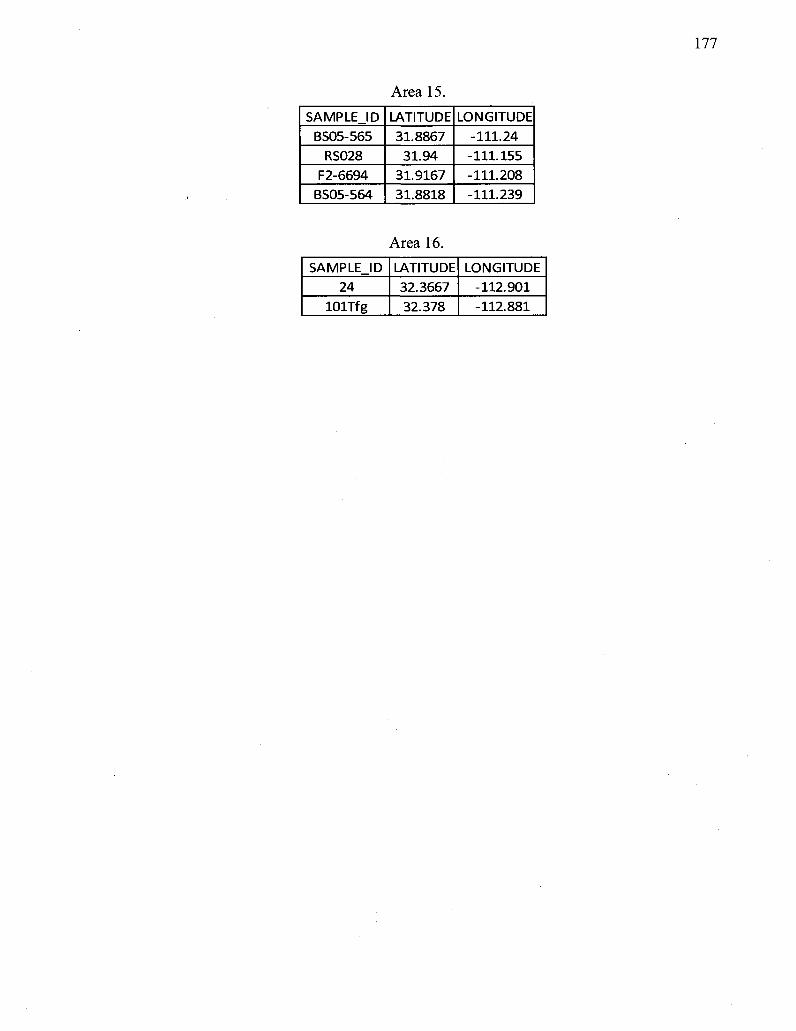
Area 15.
177
SAMPLE ID
BS05-565
RS028 F2-6694
BS05-564
LATITUDE
31.8867
31.94
31.9167
31.8818
LONGITUDE
-111.24
-111.155
-111.208 -111.239
Area 16.
SAMPLE ID
24
lOlTfg
LATITUDE
32.3667
32.378
LONGITUDE
-112.901
-112.881

178
References
Aitken, J.D., (1959). Atlin map area, British Columbia; Geological Survey of Canada Memoir 307, 89 p.
Alaska Resource Data File (ARDF), 1988-Present. U.S. Geological Survey, http://ardf.wr.usgs.gov.
Alt, D.D., and Hyndman, D.W., (1989). Roadside Geology of Idaho: Mountain Press Publishing Company, Missoula, 393 p.
Ayres, D., (1974). Distribution and occurrence of some naturally-occurring polytypes of molybdenite in Australian and Papua New Guinea. Geological Society of Australia Journal, v. 21, p. 273-278.
Ballantyne, S.B., and Littlejohn, A.L., (1982). Uranium mineralization and lithogeochemistry of the Surprise Lake Batholith, British Columbia. In: Uranium in Granites, Y.T. Maurice, ed. Geological Survey of Canada Paper 81-23. p. 145-155.
Barnes, M.A., Rohs, C.R., Anthony, E.Y., Van Schmus, W.R., and Denison, R., (1999). Isotopic and elementary chemistry of subsurface Precambrian igneous rocks, west Texas and eastern New Mexico. Rocky Mountain Geology, v. 34, p. 245-262.
Bernard, A., Symonds, R.B., and Rose, W.I., (1990). Volatile transport and deposition of Mo, W, and Re in high temperature magmatic fluids. Applied Geochemistry, v. 5, p. 317-326.
Birck, J.L., RoyBarman, M., and Capmas, F., (1997). Re-Os measurements at the femtomole level in natural samples. Geostand Newsletter, v. 20, p. 19-27.
Bloodgood, M.A., Rees, C.J., and Lefebure, D.V. (1988). Geology and mineralization of the Atlin area, Northwestern British Columbia (104N/11W and 12 E). Energy, Mines and Petroleum Resources, Geological Fieldwork 1988, Paper 1989-1.
Campbell, S.K., (1994). A geochemical and strontium isotopic investigation of Laramide and younger igneous rocks in central Colorado, with emphasis on the petrogenesis of the Thirtynine Mile volcanic field. Florida State University, Tallahasseee, FL, United States, Doctoral Thesis, 648 pgs.
Chen, J.H., Papanastassiou, D.A., and Wasserburg, G.J. (1998). Re-Os systematics in chondrites and the fractionation of the platinum group elements in the early solar system. Geochimica et Cosmochimica Acta, v.62, p. 3379-3392.

179
Christopher, P.A. and Pinsent, R.H., (1982). Geology of the Ruby Creek-Boulder Creek area (Adanac Molybdenum Deposit); British Columbia Ministry of Energy, Mines and Petroleum Resources, Preliminary Map No. 52.
Clark, A.H. (1970). Compositional differences between hexagonal and rhombohedral molybdenite. Neues Jahrb. Mineral. Monatsh., p. 33-38.
Coleman, D.S. and Walker, J.D., (1992). Evidence for the generation of juvenile granitic crust during continental extension, Mineral Mountains Batholith, Utah. Journal of Geophysical Research, v.97 (B7), no. 11, 011-11, 024.
Cox, D.P., Force, E.R., Wilkinson, W.H., More, S.W., Rivera, J.S., and Wooden, J.L., (2006). The Ajo mining district, Pima County, Arizona; evidence for middle Cenozoic detachment faulting, plutonism, volcanism, and hydrothermal alteration. U.S. Geological Survey Professional Paper P1733, 46 pgs.
Creaser, R.A., Papanastassiou, D.A., and Wasserburg, G.J. (1991). Negative thermal ion mass spectrometer of Os, Re and Ir. Geochimica et Cosmochimica Acta, v. 55, p. 397-401.
Cross, W., Iddings, J.P., Pirsson, L.V., and Washington H.S. (1903). Quantitative Classification of Igneous Rocks Based on Chemical and Mineral Characters, with a Systematic Nomenclature. University of Chicago Press, Chicago, IL.
DuBray, E.A., John, D.A., Sherrod, D.R., Evarts, R.C., Conrey, R.M., and Lexa, Jaroslav. (2006). Geochemical database for volcanic rocks of the western Cascades, Washington, Oregon, and California. U.S. Geological Survey Data Series 2006. DS-0155, 49 pgs. Fleischer, M., (1959). The geochemistry of rhenium, with special reference to its occurrence in molybdenite. Economic Geology, v. 54, p. 1406-1413.
Ernst, W.G., Coleman, D.S., and Van de Ven, CM., (2003). Petrochemistry of granitic rocks in the Mount Barcroft area- Implications for arc evolution, central White Mountains, easternmost California. Geological Society of America Bulletin 115, p. 499-512.
Faulds, J.E., Feuerbach, D.L., Reagan, M.K., Metcalf, R.V., Gans, P., and Walker, J.D. (1995). The Mount Perkins Block, northwestern Arizona; an exposed cross section of an evolving, preextensional to synextensional magmatic system. Journal of Geophysical Research, 100 (B8), n. 15., 249-15, p. 266.
Frimmel, H.E., and Minter, V.E.L, (2002). Recent developments concerning the geological history and genesis of the Witwatersrand gold deposits, South Africa. Society of Economic Geologists Special Publication 9, p. 17-45.

180
Gray, W., (2003). Chemical and thermal evolution of the Late Cretaceous Tuolumne intrusive suite, Yosemite National Park, California. University of North Carolina at Chapel Hill, Chapel Hill, NC, United States, Doctoral Thesis, 202 pgs.
Hall, W.E., Friedman, I.E., and Nash, J.T. (1974). Fluid inclusion and light stable isotope study of the Climax molybdenum deposits, Colorado; Economic Geology, v. 69, p. 884-901.
Heaman, L. and Parrish, R. (1991). U-Pb geochronology of accessory minerals. Applications of Radiogenic Isotope Systems to Problems in Geology. Heaman, L. and Ludden, J.N., eds., Mineralogical Society of Canada, Short Course Handbook, v. 19, p. 59-102.
Ishihara, S., (1988). Rhenium contents of molybdenites in granitoid series rocks in Japan, Economic Geology, v. 83, p. 1047-1051.
John, D.A. (1992). Chemical analysis of granitic rocks in the Reno 1 degrees by 2 degrees quadrangle and in the northern Pine Nut Mountains, west-central Nevada. Open File Report - U.S. Geological Survey, OF 92-0246, 35 pgs.
Kikauka, A. (2002). Geological, geophysical, and geochemical report on the Adanac claim group, Surprise Lake, Boulder Creek, Atlin, B.C. Report to Stirrup Creek Gold, Ltd, 58 p.
Kirk, J., Ruiz, J., Chesley, J., Walshe, J., and England, G. (2002). A major Archean, gold and crust forming event in the Kaapvaal Craton, South Africa. Science, v. 297, n. 5588, p. 1856-1858.
Kistler, R.W., and Ross, D.C., (1990). A strontium isotopic study of plutons and associated rocks of the southern Sierra Nevada and vicinity, California. U.S. Geological Survey Bulletin, B 1920, 20 pgs.
Kylander-Clark, A.R.C., Coleman, D.S., Glazner, A.F., and Bartley, J.M., (2003). Post-Cretaceous dextral offset of 65 km across Owens Valley, California, implied by correlation of the Golden Bear and Coso dike sets. Geological Society of America, Cordilleran Section, 99th annual meeting, Abstracts with Programs, 35(4), p.80.
Lang, J.R., (1991). Isotopic and geochemical characteristics of Laramide igneous rocks in Arizona, University of Arizona, Tucson, AZ, United States, Doctoral Thesis, 201 pgs.
Lee, S., (1991). Geology and petrology of Cretaceous and Tertiary granitic rocks, Lamoille Canyon, Ruby Mountains, Nevada. Texas Tech University, Lubbock, TX, United States, Doctoral Thesis, 272 pgs.

181
Lewis, R.S., and Kiilsgaard, T.H., (1991). Eocene plutonic rocks in south central Idaho, Journal of Geophysical Research, v. 96, Issue B8, p. 13295-13311.
Lowe, C , Anderson, R.G. (2002). Preliminary interpretation of new aeromagnetic data for the Atlin map area, British Columbia. Geological Survey of Canada, Current Research 2002-A17.
Ludwig, K.R. (2001). Isoplot/Excel version 2.49. A geochronological toolkit for Microsoft Excel. Berkeley Geochronological Center Special Publication la.
Mihalynuk, M.G., Smith, M.T., Gabites, J.E. and Runkle, D., (1992). Age of emplacement and basement character of the Cache Creek terrane as constrained by new isotopic and geochemical data; Canadian Journal of Earth Sciences, v. 29, p. 2463-2477.
Mineral Resource Data System (MRDS), 2005. U.S. Geological Survey, Reston, Va., http://tin.er.usgs.gov/mrds/.
Minfile Mineral Inventory, unknown publication date, British Columbia Ministry of Energy, Mines, and Petroleum Resources, http://minfile.gov.bc.ca.
Minfile Mineral Inventory, unknown publication date, Yukon Department of Energy,Mines, and Resources, http://www.geology.gov.yk.ca/databases_gis.html.
Monger, J.W.H., (1975). Upper Paleozoic rocks of the Atlin terrane; Geological Survey of Canada Paper 74-47, 63 p.
Mutschler, F.E., Ludington, S., and Bookstrom, A., (1999). Giant porphyry-related metal camps of the world- a database. U.S. Geological Survey, Reston, Va., Open File Report 99-xxxx.
Nagler T.F., and Frei, R., (1997). Plug in plug osmium distillation. Schwei Mineral Petrogr Mitt, v. 77, p. 123-127.
Newberry, Rainer J.J. (1979). Polytypism in molybdenite (I): a non-equilibrium impurity-induced phenomenon. American Mineralogist, v. 64, p. 758-767.
Peacock, M.A. (1931). Classification of Igneous Rock Series; Journal of Geology, Volume 39, p. 54-67.
Peterman, Z.E. (1963). Generalized distribution of uranium in various broad groups of igneous rocks. Handbook of Geochemistry, Wedepohl, ed., 11-5, p. 92-E-4.
Pinsent, R.H. and Christopher, P.A., (1995). Adanac (Ruby Creek) molybdenum deposit,

182
northwestern British Columbia; Canadian Institute of Mining and Metallurgy Special Volume 46, p. 712-717.
Pinsent, R.H., (1980). The uranium content and distribution in the Adanac molybdenum deposit. Report for Placer Development Limited, 18 p.
Reppe, T.H., (1997) Geology, geochemistry, and petrogenesis of the Eocene Prairie Creek Stock, Smoky Mountains, Blaine and Camas Counties, Idaho. Wahington State University, Pullman, WA, United States, Master's Thesis, 221 pgs.
Riley, G.H., (1967). Rhenium concentration in Australian molybdenites by stable isotope dilution. Geochimica et Cosmochimica Acta, v. 31, p. 1489-1497.
Sack, P.J., and Mihalynuk, M.G., (2004). Proximal gold-cassiterite nuggets and composition of the Feather Creek placer gravels: clues to a lode source near Atlin, B.C. Geological Fieldwork 2003: A Summary of Field Activities and Current Research, Paper 2004-1, British Columbia Ministry of Energy and Mines, Mining and Minerals Division.
Schindler, J.N., (1976). Rhenium and osmium in some Canadian ores by neutron activation analysis (abs.). Dissertation Abstracts International B, Science and Engineering, v. 37, no.l, p.l30-B.
Selby, D., and Creaser, R.A., (2001). Re-Os geochronology and systematics in molybdenite from the Endako porphyry molybdenum deposit, British Columbia, Canada. Scientific Communications; Economic Geology, v. 96, p. 197-204.
Shand, S.J., (1949). Eruptive Rocks. New York, Wiley Press, 488 pgs.
Smoliar, M.I., Walker, R.J., and Morgan, J.W. (1996). Re-Os ages of group IIA, IIIA, IVA and IVB iron meteorites. Science v. 271, p. 1099-1102.
Stacey, J., and J. Kramers (1975). Approximation of terrestrial lead isotope evolution by a two-stage model, Earth Planetary Science Letters, 26, p. 207-221.
Stavast, W.J.A., (2006). Three-dimensional evolution of magmatic hydrothermal systems, Schultze Granite and Ruby Star Granodiorite, Arizona. University of Arizona, Tucson, AZ, United States, Doctoral Thesis, 414 pgs.
Stein, H.J., Markey, R.J., Morgan, J.W., Du, A., and Sun, Y. (1997). Highly precise and accurate Re-Os ages for molybdenite from the East Quinling molybdenum belt, Shaanxi Province, China. Economic Geology, v. 92, p. 827-835.

183
Stephens, J.R., Mair, J.L., Oliver, N.H.S., Hart, C.J.R., and Baker, T. (2004). Structural and mechanical controls on intrusion-related deposits of the Tombstone Gold Belt, Yukon, Canada, with comparisons to other vein-hosted ore-deposit types. Journal of Structural Geology, v.26, p. 1025-1041.
Streckeisen, A.L. (1973). Plutonic rocks, classification and nomenclature recommended by the IUGS subcommission on the systematics of igneous rocks; Geotimes, volume 18, p. 26-30.
Sutherland Brown, A., (1970). Adera, In: Geology, Exploration and Mining in British Columbia in 1969; British Columbia Department of Mines and Petroleum Resources, p. 29-35.
Sutherland Brown, A. (1969). Mineralization in British Columbia and the copper and molybdenum deposits; Canadian Mining and Metallurgy Bulletin, volume 62, p. 26-40.
Thompson, J.F.H., Sillitoe, R.H., Baker, T., Lang, J.R. and Mortensen, J.K., (1999). Intrusion related gold deposits associated with tungsten-tin provinces; Mineralium Deposita, v. 34, p. 323-334.
Turekian, K.K, and Wedepohl, K.H. (1961). Distribution of the elements in some major units of the earth's crust. Geological Society of America Bulletin, v. 72, p. 175-192.
Verplanck, P.L., (1996). Origin of a compositionally-zoned, epizonal magma body; a detailed geochemical study of the Organ Needle Pluton, south-central New Mexico. University of Colorado at Boulder, Boulder, CO, United States, Doctoral Thesis, 148 pgs.
Wallace, S.R. (1995). The Climax-type molybdenite deposits: What they are, where they are, and why they are; Economic Geology, volume 90, p. 1359-1380.
Wallace, S.R., MacKenzie, W.B., Blair, R.G., and Muncaster, N.K. (1978). Geology of the Urad and Henderson molybdenite deposits, Clear Creek County, Colorado, with a section on a comparison of these deposits with those at Climax, Colorado. Economic Geology, v. 73. p. 325-368.
The Western North America Volcanic and Intrusive Rock Database (NAVDAT) (2008). University of Kansas, http://matisse.kgs.ku.edu/navdat/index.cfm.
Westra, G. and Keith, S.B. (1981). Classification and genesis of stockwork molybdenum deposits; Economic Geology, v. 76, p. 844-873.

184
White, W.H., Bookstrom, R.J., Kamilli, M.W., Ganster, R.P., Smith, D.E., and Steininger, R.C. (1981). Character and origin of climax-type molybdenum deposits; Economic Geology, 75th Anniversary Volume, p. 270-316.
White, W.H., Stewart, D.R. and Ganster, M.W., (1976). Adanac (Ruby Creek), porphyry molybdenum deposits of the calc-alkalic suite; Canadian Institute of Mining and Metallurgy Special Volume 15, p. 476-483.
Numbered References for Molybdenum Deposit Table (Descriptive Characteristics)
1. Alaska Resource Data File (ARDF), (1988-Present). U.S. Geological Survey, http://ardf.wr.usgs.gov
2. Boyle, H.C., and Leitch, C.H.B., (1983). Geology of the Trout Lake molybdenum deposit, British Columbia: Canadian Institute of Mining and Metallurgy Bulletin, v. 76, no. 849, p. 115-124.
3. Brown, P., and Kahlert, B, (1986). Geology and mineralization of the Red Mountain porphyry molybdenum deposit, south-central Yukon. In: Mineral Deposits of Northern Cordillera, J.A. Morin (ed.), Canadian Institute of Mining and Metallurgy Special Volume 37, p. 288-297.
4. Carter, G.S., (2008). Technical Report on the Molybdenum resources on the Bald Butte Project, Montana, U.S.A., on behalf of Bolero Resources Corporation, Report for NI-43-101. Published by Broad Oak Associates, Toronto, Ontario, Canada.
5. Carter, G.S., (2008). Technical Report on the Molybdenum resources on the Cannivan Gulch Project, Montana, U.S.A., on behalf of Bolero Resources Corporation, Report for NI-43-101. Published by Broad Oak Associates, Toronto, Ontario, Canada.
6. Christopher, P.A., and Pinsent, R.H., (1979). Geology of the Ruby Creek and Boulder Creek area near Atlin (104N/11W) (Adanac molybdenum deposit), B.C.: British Columbia Ministry of Energy, Mines, and Petroleum Resources Preliminary Map 52.

185
7. Christopher, P.A., and Carter, N.C. (1976). Metallogeny and metallogenic epochs for porphyry mineral deposits in the Cordillera, In: Sutherland-Brown, A. ed., Porphyry Deposits of the Canadian Cordillera: v. 15, p.64-68.
8. Clark, K.F., (1972). Stockwork molybdenum deposits in the Western Cordillera of North America, Economic Geology, v. 67, pp. 731-758.
9. Fleischer, M., (1959). The geochemistry of rhenium, with special reference to its occurrence in molybdenite, Economic Geology, v. 54, p. 1406-1413.
10. Hall, W.E., Friedman, I., and Nash, J.T., (1974). Fluid inclusion and light stable isotope study of the Climax molybdenum deposits, Colorado. Economic Geology, v. 69, p. 884-901.
11. Hunting, M. T., (1956). Inventory of Washington Minerals- Part 2, Metallic Minerals. Wahsington Division of Mines and Geology Bulletin 37, v. 1, 428 P., v.2, 67 pgs.
12. Keith, J.D., Shanks III, W.C, Archibald, D.A., and Farrar, E., (1986). Volcanic and intrusive history of the Pine Grove porphyry molybdenum system, Southwestern Utah: Economic Geology, v.81, p. 553-577.
13. Maas, K.M., Bittenbender, P E., and Still, J.C., (1995). Mineral investigations in the Ketchikan mining district, southeastern Alaska: U.S. Bureau of Mines Open-File Report 11-95, 606 pgs.
14. Mineral Resource Data System (MRDS), (2005). U.S. Geological Survey, Reston, Va., http://tin.er.usgs.gov/mrds/.
15. Minfile Mineral Inventory, (unknown publication date). British Columbia Ministry of Energy, Mines, and Petroleum Resources, http://minfile.gov.bc.ca.
16. Schafer, P., (1935). Geology and Ore Deposits of the Neihart Mining District, Montana. Montana Bureau of Mining and Geology, Memo 13.
17. Schmidt, E.A., Worthington, J.E. and Thomssen, R.W., (1979). K-Ar dates for mineralization in the White-Cloud-Cannivan Gulch molybdenum porphyry belt of Idaho and Montana- A discussion: Economic Geology, v. 74, p. 698-699.
18. Seedorf, E. and Einaudi, M.T., (2004). Henderson porphyry molybdenum system, Colorado: sequence and abundance of hydrothermal mineral assemblages, flow paths of evolving fluids, and evolutionary style. Economic Geology, v. 99, p.3-37.

186
19. Selby, D., and Creaser, R.A. (2001). Re-Os geochronology and systematics in molybdenite from the Endako porphyry molybdenum deposit, British Columbia, Canada. Economic Geology, v. 96 , pp. 197-204.
20. Sharp, J.E., (1979). Cave Peak, a molybdenum mineralized breccia pipe complex in Culberson County, Texas. Economic Geology, v. 74, p. 517-534.
21. Shaver, S.A., (1988). Petrology, petrography, and crystallization history of intrusive phases related to the Hall (Nevada Moly) molybdenum deposit, Nye County, Nevada. Canadian Journal of Earth Sciences, v. 25, p. 1000-1019.
22. Sherlock, M.G., Cox, D.P., and Huber, D.F., (1996). Known mineral deposits and occurrences in Nevada: An Analysis of Nevada's Metal-Bearing Mineral Resources, Singer, D.A., ed., Nevada Bureau of Mines and Geology OFR 96-2, Reno, Nevada.
23. Steininger, R.C., (1985). Geology of the Kitsault Molybdenum Deposit, British Columbia. Economic Geology, v. 80, pp. 57-71.
24. Thompson, T.B., (1968). Hydrothermal alteration and mineralization of the Rialto Stock, Lincoln County, New Mexico. Economic Geology, v. 63, p. 943-949.
25. Villeneuve, M , Whalen, J.B., Anderson, R.G., and Struik, L.C. (2001). The Endako batholith: episodic plutonism culminating in formation of the Endako porphyry molybdenite deposit, north-central British Columbia. Economic Geology, v. 96, pp. 171-196.
26. Wallace, S.R., MacKenzie, W.B., Blair, R. G., and Muncaster, N.K., (1978). Geology of the Urad and Henderson molybdenite deposits, Clear Creek County, Colorado, with a section on a comparison of these deposits with those at Climax, Colorado. Economic Geology, v. 73, p.325-368.
27. Westra, G. and Riedell, K.B., (1996). Geology of the Mount Hope Stockwork molybdenum deposit, Eureka County, Nevada, in Coyner, A.R., and Fahey, P.L., eds., Geology and Ore Deposits of the American Cordillera: Geological Society of Nevada Symposium Proceedings, Reno/Sparks, Nevada, April 1995, p. 1639-1666.
28. Westra, G., and Keith, S.B., (1981). Classification and genesis of stockwork molybdenum deposits. Economic Geology, v. 76, p. 844-873.