Embed Size (px)
Citation preview

Jessica Schmidt

Presentation OutlinePresentation Outline
SnapshotSnapshot Past PositionsPast Positions ProfileProfile HistoryHistory Current NewsCurrent News Financial Statements Financial Statements Industry ComparisonIndustry Comparison Stock ComparisonStock Comparison Trend AnalysisTrend Analysis Common Size AnalysisCommon Size Analysis Stock Valuation ModelStock Valuation Model
EVA & MVA ModelEVA & MVA Model Free Cash FlowFree Cash Flow Summary of Summary of
ValuationsValuations Analyst Analyst
RecommendationsRecommendations RiskRisk Effect on SMIP Effect on SMIP
PortfolioPortfolio RecommendationRecommendation
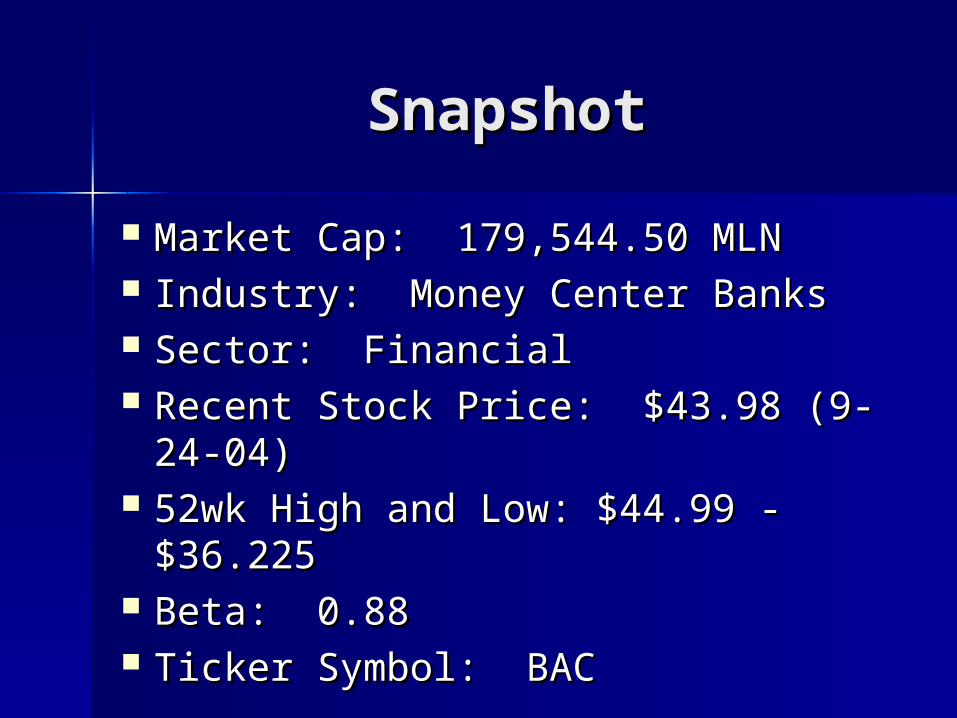
SnapshotSnapshot
Market Cap: 179,544.50 MLNMarket Cap: 179,544.50 MLN Industry: Money Center BanksIndustry: Money Center Banks Sector: FinancialSector: Financial Recent Stock Price: $43.98 (9-24-Recent Stock Price: $43.98 (9-24-
04)04) 52wk High and Low: $44.99 - 52wk High and Low: $44.99 -
$36.225 $36.225 Beta: 0.88Beta: 0.88 Ticker Symbol: BACTicker Symbol: BAC

Past Positions in the Past Positions in the Financial IndustryFinancial Industry
Chase ManhattanChase Manhattan– Purchased 57 shares @ $86.01 = $4,902.81 Apr-99 Purchased 57 shares @ $86.01 = $4,902.81 Apr-99 – Sold 57 shares @ $82.54 = $4,705.09 Nov-99Sold 57 shares @ $82.54 = $4,705.09 Nov-99– Loss Incurred = $197.72Loss Incurred = $197.72– Current Worth = 85.5 shares JPM = $3,398.63Current Worth = 85.5 shares JPM = $3,398.63
Fleet BostonFleet Boston– Purchased 100 shares @ $41.30 = $4,129.50 Nov-99Purchased 100 shares @ $41.30 = $4,129.50 Nov-99– Sold 100 shares @ $37.39 = $3,739.12 Apr-00 Sold 100 shares @ $37.39 = $3,739.12 Apr-00 – Loss Incurred = $390.38 Loss Incurred = $390.38 – Current Worth = 111.06 shares of BAC = $4,884.42Current Worth = 111.06 shares of BAC = $4,884.42
Commerce BankCommerce Bank– Purchased 130 shares @ $48.67 = $4,866.90 Apr-03Purchased 130 shares @ $48.67 = $4,866.90 Apr-03– Sold 130 shares @ $50.34 = $6,544.20Sold 130 shares @ $50.34 = $6,544.20– Gain = $1,677.30Gain = $1,677.30– Current Worth = 130 @ $55.73 = $7,244.90Current Worth = 130 @ $55.73 = $7,244.90

ProfileProfile Nation’s First coast-to-coast bankNation’s First coast-to-coast bank #1 in U.S. large corporate banking relationships#1 in U.S. large corporate banking relationships #4 in lead investment banking relationships#4 in lead investment banking relationships #1 in loan syndication#1 in loan syndication One of the largest banks for assets in the US. behind C, One of the largest banks for assets in the US. behind C,
JPM, and WB.JPM, and WB. 5,700+ locations in 24+ states, reaching internationally 5,700+ locations in 24+ states, reaching internationally
most notably Latin Americamost notably Latin America Largest segment is the Consumer and Commercial Largest segment is the Consumer and Commercial
Banking, offering deposit products, credit cards, Banking, offering deposit products, credit cards, insurance, loans, treasury services, and financing for cars, insurance, loans, treasury services, and financing for cars, boats, and RV dealerships.boats, and RV dealerships.
Global Corporate and Investment Banking, including Banc Global Corporate and Investment Banking, including Banc of America Securities. This segment offers services of America Securities. This segment offers services (brokerage advisory, and capital markets services) to (brokerage advisory, and capital markets services) to corporate and institutional clients. corporate and institutional clients.
CA, FL, MD, & Washington State CA, FL, MD, & Washington State Market share Market share leadershipleadership
Domestically targeting Hispanic customersDomestically targeting Hispanic customers Domestically targeting Chinese, Korean, & Vietnamese in Domestically targeting Chinese, Korean, & Vietnamese in
CACA

HistoryHistory
1957 - Commercial National Bank of Charlotte, N.C. merged with 1957 - Commercial National Bank of Charlotte, N.C. merged with American Trust Co., forming American National BankAmerican Trust Co., forming American National Bank
1960 - merged with Security National, forming North Carolina National 1960 - merged with Security National, forming North Carolina National BankBank
1968 - formed NCNB (holding company)1968 - formed NCNB (holding company) 1988 - profited from S&L crisis → doubling its assets1988 - profited from S&L crisis → doubling its assets 1993 - Bought Chicago Research & Trading1993 - Bought Chicago Research & Trading 1997 - Purchased Boatman’s Bancshares & Montgomery Securities, 1997 - Purchased Boatman’s Bancshares & Montgomery Securities,
creating Banc of America Securitiescreating Banc of America Securities 1998 - bought Barnett Banks & merged with NationsBank1998 - bought Barnett Banks & merged with NationsBank 1999 - sold its European and Asian private banking operations to UBS. It 1999 - sold its European and Asian private banking operations to UBS. It
also bought Associates First Capital, 50% of Marsico Capital also bought Associates First Capital, 50% of Marsico Capital Management.Management.
2001 - Acquired BA Merchant Services & became Bank of America2001 - Acquired BA Merchant Services & became Bank of America 2004 - merged with Fleet Boston 2004 - merged with Fleet Boston August 30August 30thth 2004 → stock split 2:1 2004 → stock split 2:1

Current NewsCurrent News
9-22-04 9-22-04 Fed Moves Rekindle Interest in Fed Moves Rekindle Interest in SavingSaving
9-23-04 9-23-04 Bank of America to Move Bank of America to Move Wealth/Invest Mgmt Ops to BostonWealth/Invest Mgmt Ops to Boston
9-28-04 9-28-04 Cisco Gets Internet-Phone Pact Cisco Gets Internet-Phone Pact from Bank of America for U.S.from Bank of America for U.S.
9-28-04 9-28-04 Banks Come Under Scrutiny Banks Come Under Scrutiny for Role in Parmalat Scandalfor Role in Parmalat Scandal
9-29-04 9-29-04 Banc of America Securities Banc of America Securities Hires Liu, Month, Schloendorff and Hires Liu, Month, Schloendorff and Rogers in the Technology Investment Rogers in the Technology Investment Banking GroupBanking Group

Financial StatementsFinancial Statements
Refer to handoutRefer to handout

Industry ComparisonIndustry Comparison
BAC Industry Sector S&P500ValuationP/E Ratio 11.56 14.78 15.18 22.52Beta 0.88 1.06 0.81 1Price to Sales (TTM) 2.57 4.47 3.61 3.2Price to Book (MRQ) 1.88 2.28 2.45 4.11Growth RatesSales-5Yr. Growth Rate 10.00 12.13 7.21 10.78EPS v. Qtr. Yr. Ago 3.67 -20.07 8.92 28.21EPS-5Yr. Growth Rate 19.74 15.98 15.13 12.47EfficiencyReceivable Turnover (TTM) 9.84Inventory Turnover (TTM) N.A. N.A. N.A. 12.02Asset Turnover (TTM) 0.07 - - 0.92Management EffectivenessROA (TTM) 1.49 1.31 2.51 7.12ROI (TTM) 8.91 6.77 9.04 10.93ROE (TTM) 20.73 16.88 18.09 19.68ProfitabilityGross Margin (TTM) 32.37 - - 47.9EBITD Margin (TTM) 59.98 - - 21.6

BAC and Competitors BAC and Competitors
Company Mkt Cap WACC Beta ROA Cash & Equiv. P/EBank of America 178,893.70 4.13% 0.88 1.55% 111,627.00 11.57Citigroup Inc. 228,708.40 4.27% 1.22 1.27% 21,149.00 11.59JP Morgan Chase & Co. 141,590.30 3.93% 1.47 0.61% 107,311.00 11.56Wells Fargo & Co 99,022.84 4.69% 0.82 1.70% 18,292.00 14.95Wachovia Corp 60,624.76 5.26% 0.93 1.18% 38,512.00 12.45US Bancorp 53,728.70 5.45% 1.22 2.07% 8,630.00 13.88Total 46171873636 5.31% 0.96 1.40% 18,656,140,909.09 -

Stock Comparison: 1 Stock Comparison: 1 yearyear
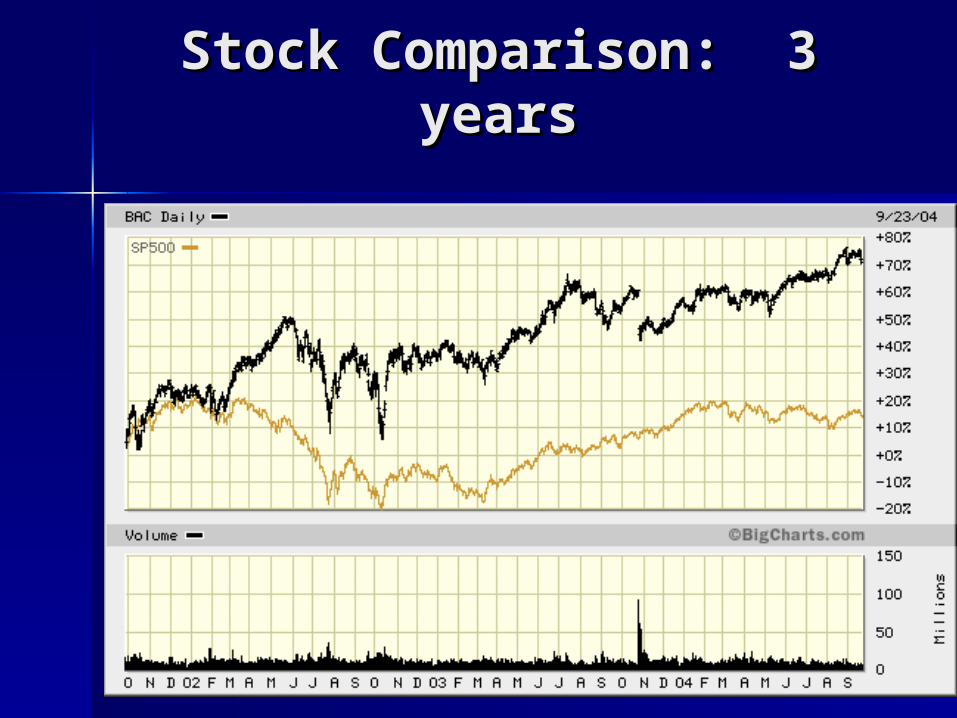
Stock Comparison: 3 Stock Comparison: 3 yearsyears

Trend AnalysisTrend Analysis

Trend AnalysisTrend Analysis

Product SegmentationProduct Segmentation

Geographical Geographical SegmentationSegmentation

Common Size AnalysisCommon Size AnalysisDecember, 2003 December, 2002 December, 2001
% of Total IncomeInterest Income 65.83% 70.32% 72.74%Service Charges 11.69% 11.54% 9.39%Investment and Brokerage Services 4.89% 4.89% 4.01%Other Noninterest Income 17.59% 13.25% 13.85%Income Items 100.00% 100.00% 100.00%Interest Expense 21.18% 24.57% 38.54%Noninterest Expense 41.87% 40.31% 39.34%EBIT 58.13% 59.69% 60.66%Net Income 22.49% 20.22% 12.90%
% of Total Liabilities & EquityTotal Liabilities & Equity 100.00% 100.00% 100.00%ST Deposit Borrowing 56.23% 58.47% 65.15%Other ST Borrowing 27.02% 23.75% 21.19%LT Borrowings 10.23% 10.16% 10.94%Total Liabilities 93.48% 92.39% 92.20%Total Common Equity 7.13% 7.60% 7.79%Shareholder Equity 6.52% 7.61% 7.80%
% of Total AssetsTotal Asset 100.00% 100.00% 100.00%Cash & Cash Equivalent 3.68% 3.78% 4.32%Other ST Investments 25.74% 22.69% 16.65% Debt Securities (Current) 9.27% 10.46% 13.75%Loans and Leases (Current) 49.60% 50.90% 51.83%Net Fixed Assets 11.71% 12.17% 13.45%

Stock ValuationStock Valuation
STOCK VALUATION MODELS
NAME OF COMPANY Bank of America
LAST YEAR 2003 YearNUMBER OF SHARES OUTSTANDING (Mil.) 2,882.29 Millions of SharesMARKET PRICE OF STOCK / SHARE $43.98 Dollars Per Share $50.00 Price of StockNET INCOME AFTER TAXES $10,810.00 Millions of Dollars Expected inTOTAL SALES OR REVENUES $37,886.00 Millions of Dollars 5 yearsBOOK VALUE OF EQUITY (FROM BALANCE SHEET) $47,980.00 Millions of DollarsRISK FREE RATE (L/T T-Bond) 4.50% Annual Percentage Rate
DIVIDENDS PAID (TOTAL AMOUNT PAID) $128,261.46 Millions of Dollars
STOCK REPURCHASES (TOTAL AMOUNT PAID) $9,766.00 Millions of DollarsREQUIRED INFORMATION FOR CALCULATION OF REQUIRED RATE OF RETURNBETA OF STOCK 0.88MARKET RISK PREMIUM (5%-6% Historically) 6.00% Expected Market Risk Premium %REQUIRED INFORMATION FOR VARIABLE GROWTH RATE VALUATIONSEXPECTED GROWTH RATE (EARNINGS OR DIVIDENDS & STOCK REPURCHASES) 10.0000% 10.0000% 10.0000% 8.0000% 8.0000%
COMPUTER-GENERATED CALCULATIONSSTOCK VALUE - ZERO GROWTH MODEL $69.52STOCK VALUE - CONSTANT GROWTH MODEL $87.49STOCK VALUE - VARIABLE GROWTH MODEL $88.21STOCK VALUE - DIVIDEND & EARNINGS MODEL $81.27STOCK VALUE - PRICE / EARNINGS MODEL $124.17
Must be positive
values in each cell
All Data Required
Required Data

EVA & MVA ModelEVA & MVA Model
Name of Company Bank of America Year 2003
Short-Term Debt $1,602.00
Long-Term Debt $75,343.00
Preferred Dividend $
Preferred Stock Price
Preferred Stock $54.00 $4.00 $53.21
Common Stock $14.00
Paid-In Capital $115,882.47
Retained Earnings $6,659.50
Total Invested Capital $199,554.97
Price of Stock $43.98
Number of Shares Outstanding 2,882.29
EBIT $27,938.00
Tax Rate 31.85%
Less: Taxes $8,898.25Equals NOPAT $19,039.75
Rate on Short-Term Debt 2.45%
Rate on Long-Term Debt 4.57%
Market Risk Premium 6.00%
Risk-Free Rate 4.91%
Debt to Equity Ratio 62.78%
Beta of Stock 0.88
Cost of Preferred Stock 7.52%Cost of Equity Capital 10.190% % S-T Debt % L-T Debt % Equity % Preferred StockWACC 8.01% 0.80% 37.76% 61.41% 0.03%
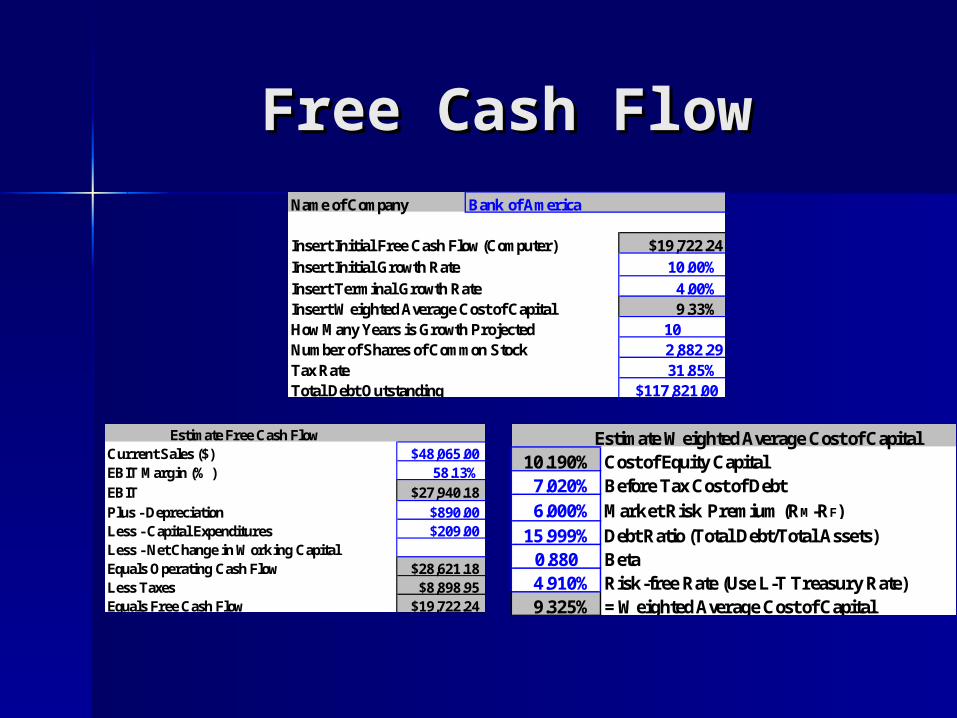
Free Cash FlowFree Cash FlowName of Company Bank of America
Insert Initial Free Cash Flow (Computer) $19,722.24
Insert Initial Growth Rate 10.00%
Insert Terminal Growth Rate 4.00%Insert Weighted Average Cost of Capital 9.33%How Many Years is Growth Projected 10Number of Shares of Common Stock 2,882.29Tax Rate 31.85%Total Debt Outstanding $117,821.00
Estimate Free Cash FlowCurrent Sales ($) $48,065.00EBIT Margin (% ) 58.13%EBIT $27,940.18Plus - Depreciation $890.00Less - Capital Expenditures $209.00Less - Net Change in Working CapitalEquals Operating Cash Flow $28,621.18Less Taxes $8,898.95Equals Free Cash Flow $19,722.24
Estimate Weighted Average Cost of Capital10.190% Cost of Equity Capital
7.020% Before Tax Cost of Debt
6.000% Market Risk Premium (RM-RF)
15.999% Debt Ratio (Total Debt/Total Assets)0.880 Beta4.910% Risk-free Rate (Use L-T Treasury Rate)9.325% = Weighted Average Cost of Capital

Intrinsic ValueIntrinsic Value
Excess Return Period yrs 10.00 Revenue ($mil) 49,006.00 Growth Rate (%) 9.00 Net Oper. Profit Margin (%) 32.37 Tax Rate (%) 31.85 Stock Price ($) 44.51 Shares Outstanding (mil) 4,062.70 10-yr Treasury Yield (%) 5.00 Bond Spread Treasury (%) 1.50 Preferred Stock Yield (%) 7.50 Depreciation Rate (% of Rev) - Investment Rate (% of Rev) - Working Capital (% of Rev) - Short-Term Assets ($mil) - Short-Term Liab. ($mil) (263.00) Equity Risk Premium (%) 3.00 Company Beta 1.26 Value Debt Out. ($mil) 98,319.00 Value Pref. Stock Out. ($mil) 322.00 Company WACC 7.25
Intrinsic Value of Stock $48.06
ValuePro.net Intrinsic Value of Stock

Summary of ValuationsSummary of Valuations
Stock Evaluation Model:Stock Evaluation Model: Zero Growth Model = $69.52Zero Growth Model = $69.52 Price/Earnings Model = $124.17Price/Earnings Model = $124.17
EVA & MVA Model:EVA & MVA Model: EVA – Creating Shareholder WealthEVA – Creating Shareholder Wealth MVA – Creating Shareholder WealthMVA – Creating Shareholder Wealth
Free Cash Flow Model:Free Cash Flow Model: NPV of FCF = $613,671NPV of FCF = $613,671 Per Share Value = $172.03Per Share Value = $172.03
Intrinsic Value Model:Intrinsic Value Model: Intrinsic Value = $48.06/shareIntrinsic Value = $48.06/share
Analyst Analyst RecommendationsRecommendations
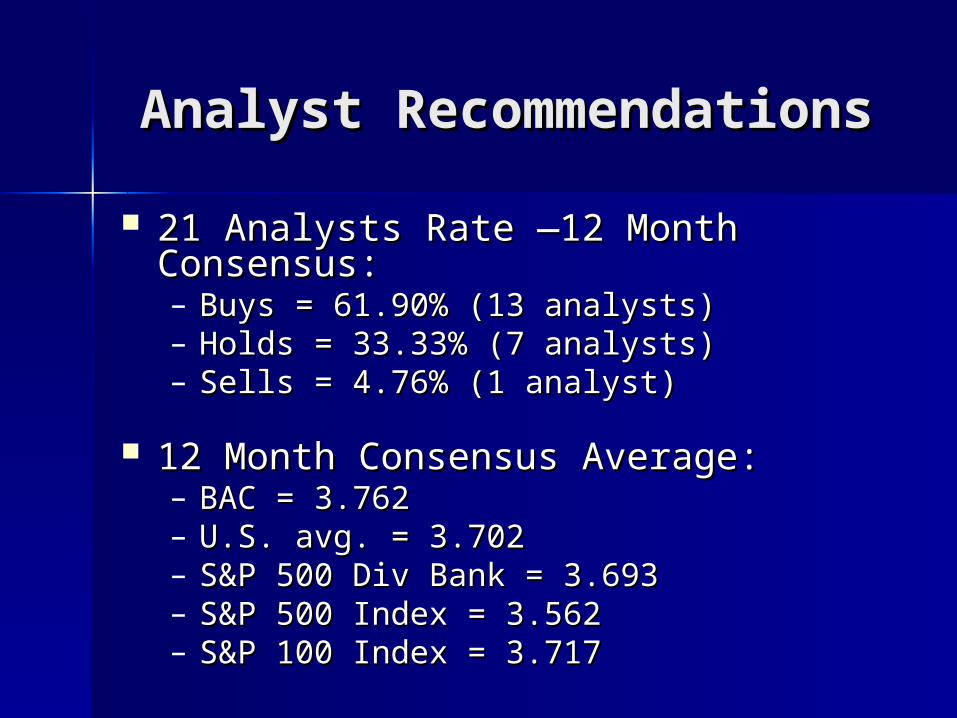
21 Analysts Rate —12 Month 21 Analysts Rate —12 Month Consensus: Consensus: – Buys = 61.90% (13 analysts)Buys = 61.90% (13 analysts)– Holds = 33.33% (7 analysts)Holds = 33.33% (7 analysts)– Sells = 4.76% (1 analyst)Sells = 4.76% (1 analyst)
12 Month Consensus Average:12 Month Consensus Average:– BAC = 3.762BAC = 3.762– U.S. avg. = 3.702U.S. avg. = 3.702– S&P 500 Div Bank = 3.693S&P 500 Div Bank = 3.693– S&P 500 Index = 3.562S&P 500 Index = 3.562– S&P 100 Index = 3.717 S&P 100 Index = 3.717

RiskRisk
Risk Grade = 68Risk Grade = 68 6 Month Minimum = 606 Month Minimum = 60 6 Month Maximum = 796 Month Maximum = 79 6 Month Average = 686 Month Average = 68

RiskRisk

Why SMIP will Benefit Why SMIP will Benefit from BACfrom BAC
Assist in the diversificationAssist in the diversification High DividendsHigh Dividends Settle Investigation of Mutual Fund Settle Investigation of Mutual Fund
Scandal with SECScandal with SEC $7 billion of Share Buyback$7 billion of Share Buyback Parmalat Headline risk built into Parmalat Headline risk built into
stockstock Low P/ELow P/E Benefit from Rate HikeBenefit from Rate Hike High growth potentialHigh growth potential

RecommendationRecommendation
Buy 130 shares of BAC @ Buy 130 shares of BAC @ current market pricecurrent market price
6.50% of portfolio in Financial 6.50% of portfolio in Financial SectorSector
Money Center Banks Industry Money Center Banks Industry weight in S&P 500 = 3.861%weight in S&P 500 = 3.861%