Embed Size (px)
Citation preview

Journal of Engineering Science and Technology Review 6 (5) (2013) 95-100
Research Article
Influence of strength grade and surface finish on threaded fastener for reliability application
Ting-zhi CHEN 1,2,* and Yi-min MO 1
1Dept. of Mechanic & Electronic Eng., Wuhan University of Technology, Wuhan, 430070-China 2Dept. of Mechanic & Electronic Eng., Wuhan Polytechnic,Wuhan,430074-China
Received 1 June 2013; Accepted 20 December 2013
___________________________________________________________________________________________ Abstract
The aim of this study is to provide a reliability design methodology based on experience data and theory analyses to choose bolts in terms of strength grade and surface process, therefore, to ensure safe car operation。The components under investigation are some clamped joints made of aluminum alloy and used in micro car chassis to connect the lower arm to the body. The aluminum alloy is realized by three kinds of surface process: dacro, Ep.FeZn8.C2C, Ep.FeZn8.C2D and three kinds of strength grade: 8.8, 10.9, and 12.9. Some experiences have been appropriately designed with the same process of the actual components on the advanced tightening device. The mean values and standard deviations of bolt yield stress can be obtained via tightening experience whereas the mean values and standard deviations of total tensile stress can be calculated according to bolt load evaluated by means of FEM. Based on stress-strength interference theory the reliability of bolt with different strength grades and surface processes can be calculated, which is useful to choose bolts. Compared the traditional safety factor method, the reliability design method takes into account random factors influence to the preload such as the bolt manufacturing error and the dispersion of the torque coefficient, so it is a more rational approach to select fasteners and has important engineering significance to the threaded connection safe operation for the automotive industry.
Keywords: reliability; surface finish; friction coefficient; tightening test; process design __________________________________________________________________________________________ 1. Introduction Threaded fasteners are widely used in mechanical and structural applications because of their easiness to assembly and disassembly for maintenance and repair purposes. Both the level and the stability of the clamp loads, which are created by the tightening process, will govern the safety and reliability of bolted joints. In most of production applications, the fastener tension (preloading force) is achieved by using a torque wrench applied to the head or to the nut. The tribological aspects of the tightening phase are critical to define the actual torque-tension relationship [1], [2]. The tightening torque is mostly consumed in overcoming two friction components: the underhead (or bearing) friction due to the sliding of the fastener head on the flanges and the thread friction between the male and female thread. The residual torque component produces the fastener tension by generating the joint clamping force. Inaccuracies in determining the friction components may lead to an overestimation or underestimation of the actual joint clamp force created by a specific value of the tightening torque. The former has the potential to cause failure due to the eventual fastener loosening, joint separation, leakage, and rattle, while the latter may lead to material failure due to overstressing, excessive distortion, stress corrosion cracking, or fatigue.
Traditional mechanical design method is known as a safety factor, which generally considered the strength and stress are single-valued in the design of mechanical parts, as long as the computed safety factor is greater than the set one, neglected the design parameters randomness during the design process. Reliability design method considers the stress and strength as random variables and have a certain distribution, the former influenced by various environmental factors (temperature, surface condition, etc) and the latter influenced by material properties, process fluctuations and machining accuracy. Mechanical reliability design takes full advantage of randomness based on the strength and stress distributions and establishes the limit State function to design products meet reliability requirements [3]. Probability distributions commonly used in mechanical reliability design is the normal distribution ,which is a symmetrical curve shown in Fig1. S is stress, σ is strength, f (s),f (σ) is the probability density function of stress and strength respectively. For µ is mean mainly used to reflect the centralized value of the random variable; σ is standard deviation represented random variable values on the degree of deviation of mean value. The shortcomings of the safety factor can be further confirmed from the stress and strength probability distribution. Both stress and strength probability density curves cross means the probability of "stress is greater than the strength” [4]. The shaded area in Figure 1 reflects the probability of the event structure is destroyed qualitatively. When the same standard deviation, changing mean µ will
______________ * E-mail address: [email protected] ISSN: 1791-2377 © 2013 Kavala Institute of Technology. All rights reserved.
Jestr JOURNAL OF Engineering Science and Technology Review
www.jestr.org

Ting-zhi CHEN and Yi-min MO/Journal of Engineering Science and Technology Review 6 (5) (2013) 95-100
96
change the shaded area shown in Figure 2. When the same mean, that the safety factor constant, changing the standard deviation σ will change the shaded area shown in Figure 3.
f(σ)S σ
f(S) f(σ)
f(S)
Sµ σµ Fig.1 Normal distribution
f(σ)S σ
f(S) f(σ)
f(S)
Sµ σµ Fig. 2. Normal distribution changed mean value
f(σ)S σ
f(S) f(σ)
f(S)
Sµ σµ Fig. 3. Normal distribution changed standard deviation Because of the strength S and stress σ are normally distributed, the probability density function of the strength and stress distribution is expressed as follows:
2
2
( )1( ) exp ( )22
S Sg s S
SSµ
σσπ
⎧ ⎫−⎪ ⎪= − −∞ < < +∞⎨ ⎬
⎪ ⎪⎩ ⎭
2
2
( )1( ) exp ( )22
f µ
σσ
σ σσ σ
σπσ
⎧ ⎫−⎪ ⎪= − −∞ < < +∞⎨ ⎬
⎪ ⎪⎩ ⎭
σσµµ σσ ,,, ss is the mean and standard deviation of
the strength S and stress σ.
Strength and stress of a group of fasteners are not a constant but meet certain probability distribution. Experimental summary shows that they are normally distributed. Two normal distributed functions addition and subtraction is same normal distributed function. So strength minus stress is the normal distributed function expressed as followed:
σ−= sz Z is a interference random variable, normal distributed function of Z can be expressed:
2
2
( )1( ) exp ( )22
Z Zh Z Z
ZZµ
σσπ
⎧ ⎫−⎪ ⎪= − −∞ < < +∞⎨ ⎬
⎪ ⎪⎩ ⎭
where, 1
2 2 2( ) ,Z S Z Sσ σ σ µ µ µσ σ= + = − When Z>0 means products are reliable. Therefore, the reliability R can be expressed as:
2
20 0
( )1( 0) ( ) exp22
Z ZR P Z h Z dz dz
ZZµ
σσπ
+∞ +∞ ⎧ ⎫−⎪ ⎪= > = = −⎨ ⎬
⎪ ⎪⎩ ⎭∫ ∫
Assumedz z
Yz
µ
σ
−= ,so dYZdZ σ= ,when z=0,The
lower limit of Y is:
12 2 2( )
SZYZ
S
µ µ
σ σ
σµσ
σ
−= − = −
+
The above equation becomes the standard normal distribution, as followed:
2
212
Y
ZZ
R e dYµ
σπ
−+∞
−= ∫
Obviously random variable Y is the standard normal variable, so R can be determined by looking up the standard normal distribution function )(Yφ in standard normal table.
1 12 2 2 22 2
1 ( ) 1 ( )( ) ( )
R
S SR Y Y
S S
µ µ µ µ
σ σ σ σ
σ σφ φ φ φ
σ σ
⎡ ⎤ ⎡ ⎤− −⎢ ⎥ ⎢ ⎥= − = − − = =⎢ ⎥ ⎢ ⎥+ +⎢ ⎥ ⎢ ⎥⎣ ⎦ ⎣ ⎦
12 2 2( )
R
SY Y
S
µ µ
σ σ
σ
σ
−= − =
+
RY reflects the relationship between parameters distribution of stress σ and strength S and reliability. If you know the reliability and strength of the distribution mean and standard deviation, we can determine the stress distribution. Conversely, if you know the mean and standard deviation of stress and strength, we can calculate the reliability.
Ting-zhi CHEN and Yi-min MO/Journal of Engineering Science and Technology Review 6 (5) (2013) 95-100
97
2.Methodology and results
2.1 The reliability design process of thread connection The torque-preload relationship is often simplified by using a constant K (Eq.1), known as torque coefficient (or nut factor).Some Authors and Standards [5, 6] provide an approximate value of 0.20 for the nut factor, however, the scatter in the torque coefficient is too great to provide a unique and reliable value, particularly in critical joints. Therefore it should consider the mean and standard deviation of K when using reliability method to design torque. T == KFd T [Nmm] is the input tightening torque applied to the fastener head or nut, F [N] is the preloading force and d [mm] is the nominal thread diameter. Data on the reliability design of mechanical parts is rather scarce. We can use laboratory equipment to get statistics of mean and standard deviation of yield tension and torque coefficient of a group difference parts. On the other wise, the preload of bolt is evaluated by three-dimensional FEM. Depending on mean and standard deviation of torque coefficient and bolt preload, mean and standard deviation of total bolt tension can be obtained, then reliability can be calculated. Fig.4 shows threaded connection reliability calculation process.
Fig. 4. Threaded connection reliability calculation process 2.2 Experimental Setup and Procedure
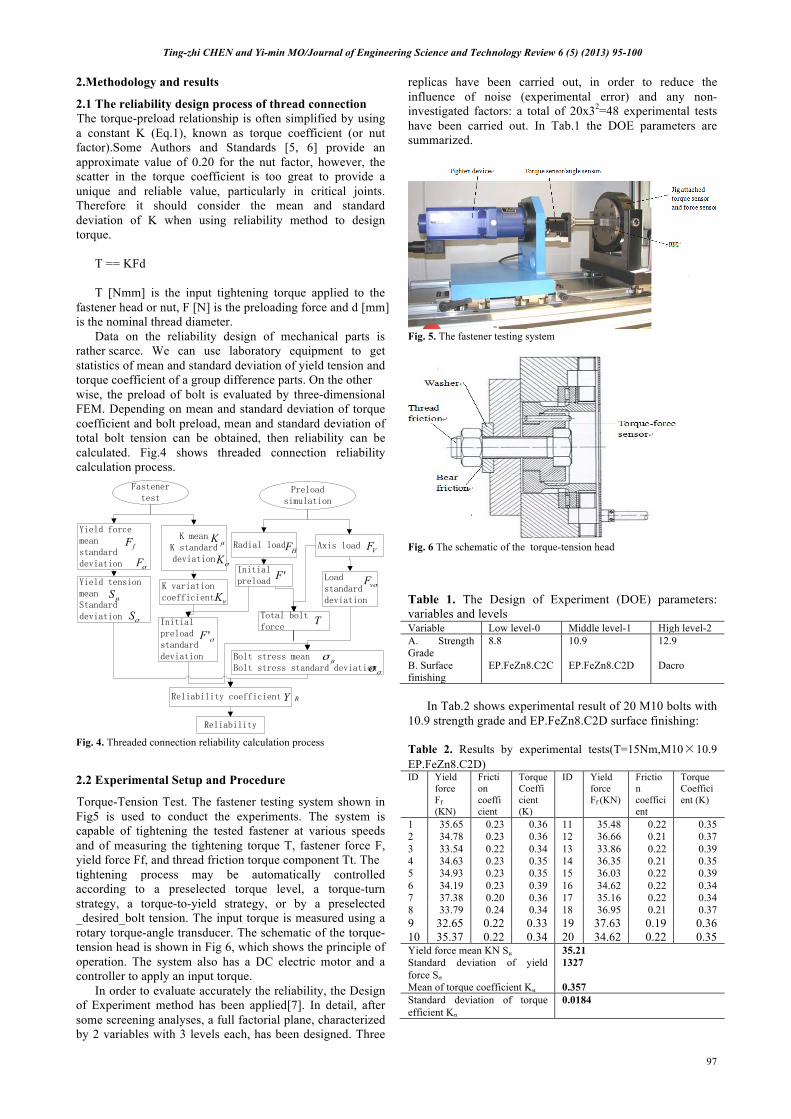
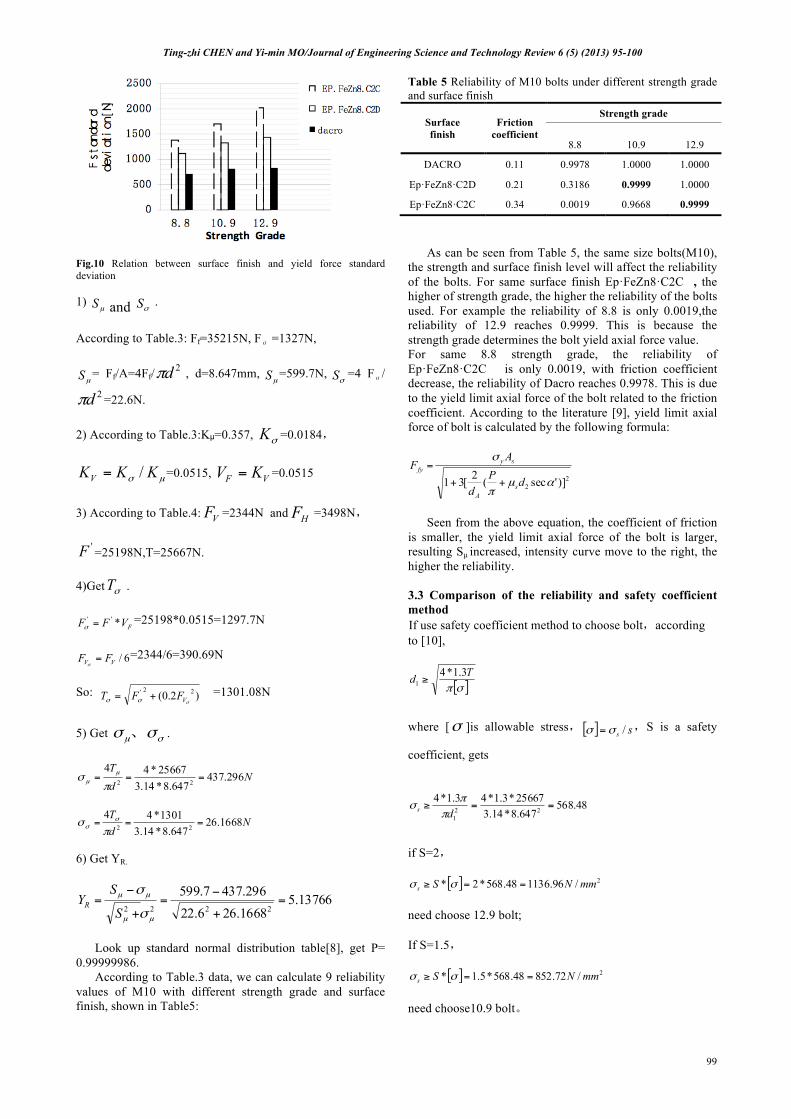
Torque-Tension Test. The fastener testing system shown in Fig5 is used to conduct the experiments. The system is capable of tightening the tested fastener at various speeds and of measuring the tightening torque T, fastener force F, yield force Ff, and thread friction torque component Tt. The tightening process may be automatically controlled according to a preselected torque level, a torque-turn strategy, a torque-to-yield strategy, or by a preselected _desired_bolt tension. The input torque is measured using a rotary torque-angle transducer. The schematic of the torque-tension head is shown in Fig 6, which shows the principle of operation. The system also has a DC electric motor and a controller to apply an input torque. In order to evaluate accurately the reliability, the Design of Experiment method has been applied[7]. In detail, after some screening analyses, a full factorial plane, characterized by 2 variables with 3 levels each, has been designed. Three
replicas have been carried out, in order to reduce the influence of noise (experimental error) and any non-investigated factors: a total of 20x32=48 experimental tests have been carried out. In Tab.1 the DOE parameters are summarized.
Fig. 5. The fastener testing system
Fig. 6 The schematic of the torque-tension head Table 1. The Design of Experiment (DOE) parameters: variables and levels Variable Low level-0 Middle level-1 High level-2 A. Strength Grade
8.8 10.9 12.9
B. Surface finishing
EP.FeZn8.C2C EP.FeZn8.C2D Dacro
In Tab.2 shows experimental result of 20 M10 bolts with 10.9 strength grade and EP.FeZn8.C2D surface finishing: Table 2. Results by experimental tests(T=15Nm,M10×10.9 EP.FeZn8.C2D) ID Yield
force Ff (KN)
Friction coefficient
Torque Coefficient (K)
ID Yield force Ff (KN)
Friction coefficient
Torque Coefficient (K)
1 35.65 0.23 0.36 11 35.48 0.22 0.35 2 34.78 0.23 0.36 12 36.66 0.21 0.37 3 33.54 0.22 0.34 13 33.86 0.22 0.39 4 34.63 0.23 0.35 14 36.35 0.21 0.35 5 34.93 0.23 0.35 15 36.03 0.22 0.39 6 34.19 0.23 0.39 16 34.62 0.22 0.34 7 37.38 0.20 0.36 17 35.16 0.22 0.34 8 33.79 0.24 0.34 18 36.95 0.21 0.37 9 32.65 0.22 0.33 19 37.63 0.19 0.36 10 35.37 0.22 0.34 20 34.62 0.22 0.35 Yield force mean KN Sµ 35.21 Standard deviation of yield force Sσ
1327
Mean of torque coefficient Kµ 0.357 Standard deviation of torque efficient Kσ
0.0184
Fastener test
Preload simulation
Yield force mean standard deviation
K meanK standard deviation
Radial load Axis load
K variation coefficient
Yield tension meanStandard deviation
Initial preload Load
standard deviation
Total bolt forceInitial
preload standard deviation Bolt stress mean
Bolt stress standard deviation
Reliability coefficient
Reliability
fF
σF
µS
σS
µK
σK
νK
'F
µσ σσ
RY
T
HF VF
σ'F
σvF

Ting-zhi CHEN and Yi-min MO/Journal of Engineering Science and Technology Review 6 (5) (2013) 95-100
98
0
10000
20000
30000
40000
50000
60000
8.8 10.9 12.9Strength Grade
F mean[N]
EP.FeZn8.C2C
EP.FeZn8.C2D
dacro
In Tab.3 shows experimental results of M10 bolts with different strength grade and different surface finishing. Table 3. DOE plan and results by experimental tests(T=15Nm,M10) A-Strength grade
B- Surface finishing
Mean of yield force Ff
Standard deviation of yield force Fσ
Mean of torque Coefficient Kµ
Standard deviation torque efficient Kσ
Friction coefficient
0 0 20376 1382 0.472 0.0226 0.11 0 1 24880 1117 0.354 0.0174 0.21 0 2 31050 714 0.1645 0.0114 0.35 1 0 29531 1702 0.482 0.0236 0.11 1 1 35215 1327 0.357 0.0184 0.21 1 2 45178 814 0.1745 0.0124 0.35 2 0 35182 2023 0.475 0.0227 0.11 2 1 47563 1437 0.355 0.0176 0.21 2 2 51579 835 0.165 0.0124 0.35
2.3 Preload FEM
The components under investigation are some clamped joints made of aluminum alloy and used in micro car front suspension. The preload of screw connecting various parts are evaluated by three-dimensional FEM. We used ADMAS 2012, which is general purpose finite element method software. As a standard model, we employed McPherson front suspension model, the function of which is to absorb the impact and shock from the wheels generating due to the uneven road surface, plays an important role in maintaining the ride smoothness and safety.Fig.7 shows Three-dimensional model of the front suspension and Fig.8 shows the bolt position connecting lower arm and front axle.
Fig.7 Three-dimensional model of the front suspension
Fig.8 The bolt connecting lower arm and front axle In Fig.7,1 is spring shock absorber,2 is left cross stabilizer bar ball rod,3 is cross stabilizer bar,4 is left arm,5
is knuckle assembly. Table4 shows pre-tighten force simulation result of bolts connecting various parts. Table 4. pre-tighten force simulation result of bolts connecting various parts ID Front
suspension Bolt position
Radial load FH
Axis load FV
Initial preload
F’
total bolt
tension T
1 Connecting lower arm
to front axle 6397 4355 46132 47003
2 Connecting lower arm to car body
3498 2344 25198 25667
3 Connecting shock
absorber to car body
1271 576 8588 9047
4 Connecting cross stabilizer
bar to car body
1033 478.56 6984 7367
3.Discussion and results
3.1 Relation between surface finish and yield force According Table.3,we can get the relation between surface finish and mean and standard deviation of yield force, which is shown in Fig9 and Fig10,respectively.As indicated in the diagram of Fig9, the mean of yield force increases with strength grade increasing or from friction coefficient decrease. The same strength grade, the mean of yield force of dacro is the highest; the mean of yield force of EP.FeZn8.C2C is the lowest. As indicated in the diagram of Fig.9, with strength grade increase, the standard deviation of yield force also increases. But with friction coefficient decrease, that decrease too. On the whole Dacro shows the best consistency, no matter different strength grade, the standard deviation of yield force is about 800.
Fig.9 Relation between surface finish and yield force mean 3.2 Reliability calculation
From Table.3, we can get mean and standard deviation of yield force of different strength grade and surface finish. From Table.4, we can get radial load and axis load of No.1-4 bolt. According to reliability calculation process (in Fig4),when No.2 bolt using M10×10.9 with EP.FeZn8.C2D surface finish, the reliability calculation is shown as follows:
the bolt connecting lower arm and front axle
Ting-zhi CHEN and Yi-min MO/Journal of Engineering Science and Technology Review 6 (5) (2013) 95-100
99
Fig.10 Relation between surface finish and yield force standard deviation 1)
µS and σS .
According to Table.3: Ff=35215N, Fσ =1327N,
µS = Ff/A=4Ff/2dπ , d=8.647mm,
µS =599.7N, σS =4 Fσ/
2dπ =22.6N. 2) According to Table.3:Kµ=0.357, σK =0.0184,
µσ KKKV /= =0.0515, VF KV = =0.0515
3) According to Table.4: VF =2344N and HF =3498N,
'F =25198N,T=25667N. 4)Get σT .
FVFF *'' =σ=25198*0.0515=1297.7N
6/VV FF =
σ
=2344/6=390.69N
So: )2.0( 22'
σσσ VFFT += =1301.08N
5) Get σµ σσ 、 .
NdT
296.437647.8*14.3
25667*4422 ===
πσ µ
µ
NdT
1668.26647.8*14.3
1301*4422 ===
πσ σ
σ
6) Get YR.
13766.51668.266.22296.4377.599
2222=
+
−=
+
−=
µµ
µµ
σ
σ
S
SYR
Look up standard normal distribution table[8], get P= 0.99999986. According to Table.3 data, we can calculate 9 reliability values of M10 with different strength grade and surface finish, shown in Table5:
Table 5 Reliability of M10 bolts under different strength grade and surface finish
Surface finish
Friction coefficient
Strength grade
8.8 10.9 12.9
DACRO 0.11 0.9978 1.0000 1.0000
Ep·FeZn8·C2D 0.21 0.3186 0.9999 1.0000
Ep·FeZn8·C2C 0.34 0.0019 0.9668 0.9999
As can be seen from Table 5, the same size bolts(M10), the strength and surface finish level will affect the reliability of the bolts. For same surface finish Ep·FeZn8·C2C , the higher of strength grade, the higher the reliability of the bolts used. For example the reliability of 8.8 is only 0.0019,the reliability of 12.9 reaches 0.9999. This is because the strength grade determines the bolt yield axial force value. For same 8.8 strength grade, the reliability of Ep·FeZn8·C2C is only 0.0019, with friction coefficient decrease, the reliability of Dacro reaches 0.9978. This is due to the yield limit axial force of the bolt related to the friction coefficient. According to the literature [9], yield limit axial force of bolt is calculated by the following formula:
22 )]'sec(2[31 αµ
π
σ
dPd
AF
sA
syfy
++
=
Seen from the above equation, the coefficient of friction is smaller, the yield limit axial force of the bolt is larger, resulting Sµ increased, intensity curve move to the right, the higher the reliability. 3.3 Comparison of the reliability and safety coefficient method If use safety coefficient method to choose bolt,according to [10],
[ ]σπTd 3.1*4
1 ≥
where [σ ]is allowable stress, [ ] ss /σσ = ,S is a safety
coefficient, gets
48.568647.8*14.325667*3.1*43.1*4
221
==≥ds ππ
σ
if S=2,
[ ] 2/96.113648.568*2* mmNSs ==≥ σσ need choose 12.9 bolt; If S=1.5,
[ ] 2/72.85248.568*5.1* mmNSs ==≥ σσ need choose10.9 bolt。

Ting-zhi CHEN and Yi-min MO/Journal of Engineering Science and Technology Review 6 (5) (2013) 95-100
100
As can be seen from the above calculation, the selected bolt using safety coefficient method has a larger of random, different factors will affect the selected bolt strength grade. Pursuing safety factor will cause the selected bolt size too large or strength classes too high. Further safety coefficient method to choose bolt does not consider friction coefficient influence to the selected bolt, as shown in Table 5, the selection of screws 10.9, if the friction coefficient is controlled in the vicinity of 0.3, the reliability of the bolt can only reach 96.68%[11]. 4. Conclusions The reliability calculation process has been proposed and reliability has been accurately calculated for bolted joint of component used in micro car chassis to connect the lower arm to the body . For this purpose the authors have done experiments in order to evaluate K and yield tension differences between three kinds of surface process:
dacro,Ep.FeZn8.C2C, Ep.FeZn8.C2D and three kinds of strength grade: 8.8,10.9,12.9. On the other wise, the preload of bolt is evaluated by three-dimensional FEM. According the calculation results, some conclusions have been get:1)Friction and torque coefficients are significantly affected by the surface finishing . The mean and standard deviation of K and friction coefficient by dacro surface are lowest, which shows best consistency and reliability. So at the design beginning the engineers should specify friction coefficient value. The smaller friction coefficient, the higher will be the reliability of the bolt connection. 2) Reliability design method considers yield tension and bolt total tension as random variables, taking into account K scatter to variables influence, which is more suitable to practical engineering than safety factor method. 3) Strength grade and surface finishing combine to influent the reliability of bolt connection (see Table 4),so using reliability design method can predict reliability of different combination and provide the basis for bolt selection.
______________________________
References 1. S.A. Nassar, H. El-Khiami, G.C. Barber, Q. Zou, T.S. Sun,“ An
experimental study of bearing and thread friction in fasteners”, Journal of Tribology, 2005, pp.263-272
2. S.A. Nassar, S. Ganeshmurthy, R.M. Ranganathan, G.C.Barber, “Effect of tightening speed on the torque-tension and wear pattern in bolted connections”, ASME Journal of Pressure Vessel Technology , 2007, pp.426-440
3. CHEN Jing, HAO Shao-xiang, Shao Feng-xiang. “ Optimal design of mechanical reliability and software application ”.Coal Science& Technology 2010(10),pp.76-81.
4. ZHOU Jie. Safety Factor and Reliability . Mechanical Design and Manufacturing, 1999(10),pp.3-5.
5. R.C. Juvinall, K.M. Marshek, Fundamental of Machine Component Design, 3rd ed., Wiley, New York (2000).
6. S.A. Nassar, P.H. Matin, G.C. Barber, “ Thread Friction Torque in Bolted Joints ”, ASME Journal of Pressure Vessel Technology, 2004(127), pp.387–393
7. D. Croccolo M D A. “Experimental analysis on the tightening torque force relationship in threaded fasteners”. Proceedings of the ASME 2010 International Mechanical Engineering Congress & Exposition, 2010.
8. JIN Wei-ya, ZHANG Kang-da. Reliability Engineering[M]. Beijing: Chemical Industry Press, 2005, 3.
9. GB/T16823.2-1997, General rules of tightening for threaded fasteners[S].
10. B. S. Reddy, N. J. Krishna, J.S. Kumar and K.V.K. Reddy,“Prediction of Surgace Roughness in End Milling of P20 MouldSteel Using Artificial Neural Networks”, Journal of Engineering Science And Technology Review. 2012, 5(1),pp.7-13.
11. Sh. Mirseidova, A. Inoue, L. Atymtayeva,“Evaluaton of Fair Market Price of Resources In Oil And Gas Industry Using Fuzzy Sets And Logics”, Computer Modelling and New Technologies.2012, 16(1), pp.30-34.


![Jestrjestr.org/downloads/Volume6Issue5/fulltext14652013.pdf · can realize the even frequency division easily [2-5], but it is difficult to realize odd frequency divider and fractional](https://img.pdfslide.net/doc/110x75/5ea1dc9af38ba7320c7fd2ad/can-realize-the-even-frequency-division-easily-2-5-but-it-is-difficult-to-realize.jpg)