Embed Size (px)
Citation preview

1
June 2005
Jet Airways (India) Limited

2
Disclaimer
Certain statements in this release concerning Jet Airways’ future growth prospects are forward-looking statements,
which involve a number of risks, and uncertainties that could cause actual results to differ materially from those in
such forward-looking statements. The risks and uncertainties relating to these statements include, but are not limited
to, risks and uncertainties regarding fluctuations in earnings, our ability to manage growth, intense competition in the
aviation business including those factors which may affect our cost advantage, wage increases, our ability to attract
and retain professionals, time and cost overruns on various parameters, our ability to manage our international
operations, liability for damages, withdrawal of governmental fiscal incentives, political instability, legal restrictions on
raising capital, and general economic conditions affecting our industry. Jet Airways may, from time to time, make
additional written and oral forward-looking statements, including our reports to shareholders. Jet Airways does not
undertake to update any forward-looking statement that may be made from time to time by or on behalf of the
company.

3
Agenda
1. Aviation growth in India
2. The Jet Airways story
3. Performance Highlights 2004 – 2005
4. Update on International Operations
5. Key Strategies for FY 2006

4
Aviation Sector has shown Strong Growth
Domestic Passengers Growth International Passengers Growth
12.914.0
15.3
18.6
12.713.7
10.0
12.0
14.0
16.0
18.0
20.0
FY00 FY01 FY02 FY03 FY04 FY05
Pass
enge
rs (m
illion
)
Indian aviation sector growth has accelerated in recent years
11.913.2
15.0
18.0
11.5 12.3
10.0
12.0
14.0
16.0
18.0
20.0
FY00 FY01 FY02 FY03 FY04 FY05
Pass
enge
rs (m
illion
)FY00-05 CAGR 7.9%
FY02-05 CAGR 13.0%FY00-05 CAGR 9.4%
FY02-05 CAGR 14.8%

5
Jet Airways - Past decade
1,010774436Revenue (US$mn)
322237114EBITDAR (US$mn)
8.14
42
FY2005
6.91
41
FY2004FY2000
29Period End Fleet
4.87Pax carried (mn)
Growth profile
1992 1993 1995 2003
Company Incorporated
Commenced air taxi operations
Granted “scheduled
airline” status
Commenced flights to Colombo
and Kathmandu
1994 1996
First to introduce modern generation B737 300s / 400s /
500s in India
20001997 1998 1999 2001 2002 2004
First to introduce new
generation B737 700s & 800s in India
First purchased aircraft
delivered
Crossed US$500mn revenues
More than 30mn pax
carried from
inception
First to introduce new
generation B737 900s in India
Jet Airways has had an Unmatched Success Story

6
Rapidly Growing PAX & Cargo Traffic
6.41 6.918.14
5.93 5.82
0.0
2.0
4.0
6.0
8.0
FY01 FY02 FY03 FY04 FY05
Pass
enge
rs (m
illion
)
As of February 2005, Jet had carried over 50 million passengers since inception
FY’05 : 8.14 mill (Growth of 18% over FY04) FY’05 : 98,838 Tons (Growth 14% over FY04)
98,83786,749
74,65765,385
55,914
0
20,000
40,000
60,000
80,000
100,000
FY01 FY02 FY03 FY04 FY05
(Ton
nes)
Passengers Carried Cargo Carried
FY02-05 CAGR 11.8%
FY01-05 CAGR 15.3%

7
Flexible and Efficient Fleet Strategy
Aircraft Type
4 5 8 8 8 8
109 8 6 6
34 8
11 1212 12
89
10 1313 14
2 2
10
0
10
20
30
40
50
'Mar-00 Mar-01 Mar-02 Mar-03 Mar-04 Mar-05
Num
ber o
f airc
rafts
ATR B737-400 B737-500B737-700 B737-800 B737-900
2932
38
41 41 42
Aircraft Utilisation
9.79.4 9.5
10.2
8.0
8.4
8.8
9.2
9.6
10.0
10.4
FY02 FY03 FY04 FY05
Hou
rs /
Day
per
airc
raft
Quick and efficient turnarounds; young age (4.5 years) &common fleet structure enables higher aircraft utilization

8
• Highest standards of services through regular
monitoring of Customer Feedback and Operational
Reports.
• Feedback are regularly monitored, analysed and
necessary corrective action taken.
• Standards on operational process flows which are
time measurable like Baggage analysis are also set.
• Baggage arrival standards
High Service Standards
15 mins10 mins7 mins4 mins
Target -Last Bag
Last Bag
Target -First Bag
First Bag
Baggage arrival (after checks-on) -Domestic

9
• On-board Service Trackers feedback FY05
• Comments from passengers are also monitored. FY05 feedback is as under
High Service Standards
-95%-97%Total Experience with Jet Airways
90%96%95%97%Overall rating for Cabin crew
88%
91%
Ratings-CP
84%
93%
Target-CP
79%
91%
Ratings-EY
76%Overall rating for food
93%Overall Rating for Airport Services
Target-EY
Service Tracker ratings (Domestic)
9.9
Complaints per 10,000 pax
5.4
Appreciations per 10,000 paxPax Complaints /
Appreciations

10
Key Management Team
The Management team is same with the exception of
Capt. Gustav Baldauf, who has joined us as Vice President Flight Operations. He is ex-Austrian Airways and comes with over 25 years experience.
Capt. K. Mohan is now Vice President Flight Operations (Special Projects).

11
Unmatched Operational Reliability
Notes : 15 min. tolerance, expressed in percentage is the number of flights cleared for take off by the engineering department within 15 minutes of the scheduled time of departure
Notes: 15 min. tolerance, expressed in percentage is the total number of flights that take off within 15 minutes of the scheduled time of departure
““Pride in ExcellencePride in Excellence”” Award from Boeing Award from Boeing for last 2 consecutive years for 00 min.for last 2 consecutive years for 00 min.
Technical Dispatch Reliability Average on Time Performance
99.3%
99.6% 99.6%
98.9%
99.4% 99.4%99.0%
99.5%99.6%
99.2%
99.4%99.3%
98.0
98.5
99.0
99.5
100.0%
FY00 FY01 FY02 FY03 FY04 FY05
Tech
nica
l dis
patc
h re
liabi
lity
Boeing ATR
84.8%
78.1%76.6%
88.4%90.3%
85.8%
86.3%
93.7%93.9%
90.3%
60.0
70.0
80.0
90.0
100.0%
FY00 FY01 FY02 FY03 FY04
Ave
rage
on
time
perf
orm
ance
Boeing ATR
FY05
90.4%
83.5%

12
Jet’s Dominant Positioning
Current Status:
38,0006,20012,00033,800# of seats per day
288110110275# flights per day
58+202322+342+5# of destinations served (+international)
62172145Fleet size
37%5%14%43%FY 2005 Market Share
Indian Airlines(1)
Jet is the leading domestic airline in India, positioned to reap the benefits of the expanding Indian economy
New Entrants :
Kingfisher – commenced ops on 9th May ’05; SpiceJet – commenced ops on 23rd May,
Go Airways, Indus Airways other among possible entrants

13
Major Highlights (2004 – 2005)
• Total Revenues of INR 44,201 Million (USD 1.01 Billion); up 24%
over FY 2004.
• Profit Before Tax of INR 5,821 Million (USD 133 Million); up 227%
over FY 2004.
•Profit After Tax of INR 3,920 Million (USD 89.6 Million); up 140%
over FY 2004.
• Revenue Passengers increased to 8.14 Million from 6.91 Million in
FY 2004; up by 17.8%.
• Achieved Seat factor of 71.3 %, up from 63.9 % in FY 2004.
• Break Even Seat Factor at 61.6%, down from 62.6% in FY 2004.
* ROE used for conversion: 1 USD = INR 43.75

14
Major Highlights (2004 – 2005)
• Average Market share for the year at 42.9%. (44.2% for
March 2005).
• Earnings per share (Face Value of INR 10) at INR 52.29 from
INR 21.37 in FY 2004
• Current Ratio at 3.4 :1; up from 1.7:1 in FY 2004
• Debt to Equity (Leverage) Ratio at 1.45 times from 6.0 times
as at March 2004.

15
Key Parameters
Performance Highlights FY 2005
Traffic Parameters Apr'04-Mar'05 Apr'03-Mar'04 Variance Variance
(%)
Number of Departures 96,417 90,667 5,750 6.3%ASKMs Mio 9,808 9,164 645 7.0%RPKMs Mio 6,992 5,852 1,140 19.5%Passenger Load Factor % 71.3% 63.9% 7.4 pointsBlock Hours 153,857 140,908 12,949 9.2%Revenue Passengers (Million) 8.14 6.91 1.24 17.9%Average Net revenue per passenger (INR) 4,429 4,032 397 9.8%Average fleet size during period 41.3 40.4 0.9 2.2%Aircraft Utilisation (hrs per day) 10.2 9.5 0.7 7.8%Average Head Count
Gross 7,082 6,608 474 7.2%Net 5,652 5,310 342 6.4%

16
Summarised Statement of Profit & Loss
Apr'04-Mar'05 Apr'03-Mar'04 Variance %
Audited Audited over P/Y
INCOMEOperating Revenues 43,380 34,474 25.8%Non Operating Revenues 822 1,183 -30.5%Total Revenues 44,202 35,657 24.0%
EXPENDITUREEmployees Remuneration & Benefits 3,747 2,822 32.8%Aircraft Fuel Expenses 10,517 7,418 41.8%Selling & Distribution Expenses 5,591 4,264 31.1%Other Operating Expenses 9,433 9,062 4.1%Aircraft Lease Rentals 1,986 2,266 -12.4%Depreciation 4,570 5,152 -11.3%Interest 2,537 2,891 -12.3%Total Expenditure 38,381 33,876 13.3%
PROFIT BEFORE TAXATION 5,821 1,781 226.8%Provision for taxation Current Tax 460 150 206.3% Deferred Tax 1,441 - 0.0%PROFIT AFTER TAXATION 3,920 1,631 140.4%
EBITDAR 14,092 10,908 29.2%EBITDAR Margin 32.5 31.6 2.8%
in INR Million

17
Summarised Balance Sheet
As on As on31-Mar-05 31-Mar-04
I. SOURCES OF FUNDS
Shareholders' Funds 20,397 5,354
Subordinated Debt 3,341 3,081
Loan Funds 26,307 29,019
Deferred Tax Liability 1,949 507
TOTAL SOURCES OF FUNDS 51,994 37,961
II. APPLICATION OF FUNDS
Net Fixed Assets: 26,406 31,268
Investments 15,957 2,334
Current Assets, Loans & Advances 20,444 11,322
Less: Current Liabilities & Provisions 10,814 8,142
Net Current Assets 9,630 3,179
Profit & Loss Account - 1,180
TOTAL APPLICATION OF FUNDS 51,994 37,961
in INR Million

18
Unit Costs/ RevenuesRev/RPK vs Cost/ASK
5.01
5.28
3.13
3.25
2.00
2.75
3.50
4.25
5.00
5.75
Rev / RPK 5.28 5.01
Cost / ASK 3.25 3.13
2004-05 2003-04
In IN
R
USc12.1
USc7.4 USc7.2
USc11.5
* ROE used for conversion: 1 USD = INR 43.75

19
Break even v/s achieved Seat Factor
71.3%
63.9%
61.6%62.6%
56.0%
58.0%
60.0%
62.0%
64.0%
66.0%
68.0%
70.0%
72.0%
74.0%
Period
Perc
enta
ges
Seat Factor % 71.3% 63.9%Break Even % 61.6% 62.6%
2004-05 2003-04

20
Post IPO – Financial Structure
• Initial Public Offer (IPO) in February 2005.
• Current Market capitalization over INR 110,000 million (USD 2.5
billion).
• Post IPO, repaid Preference Shares to IFC in March 2005.
• Prepaid Subordinated Debt by 31 May 2005.
21
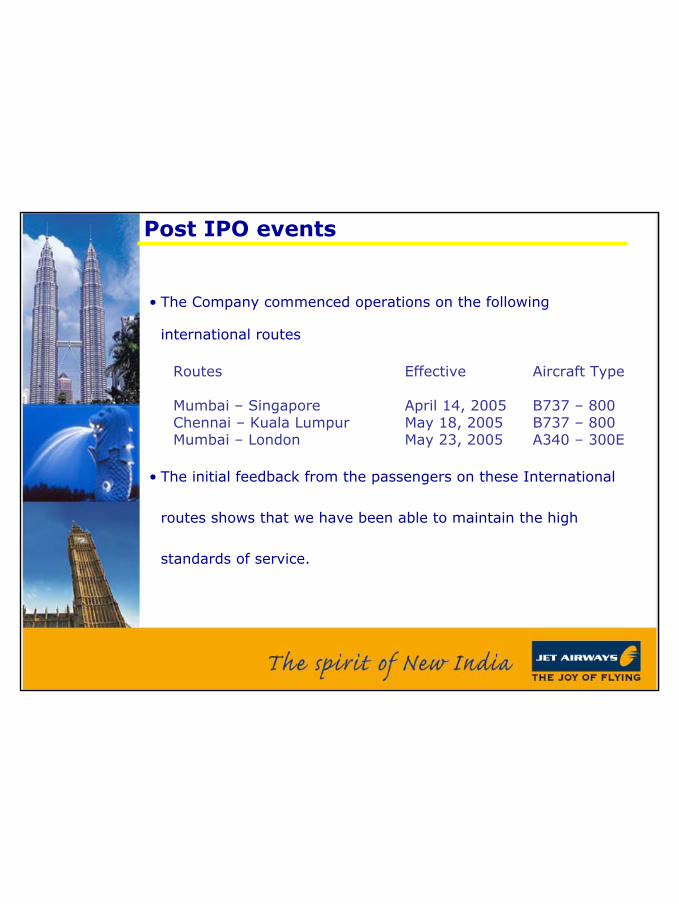
Post IPO events
• The Company commenced operations on the following
international routes
Routes Effective Aircraft Type
Mumbai – Singapore April 14, 2005 B737 – 800Chennai – Kuala Lumpur May 18, 2005 B737 – 800Mumbai – London May 23, 2005 A340 – 300E
• The initial feedback from the passengers on these International
routes shows that we have been able to maintain the high
standards of service.

22
Fleet Commitments
• ATR72-500s
•Current Fleet of 8 ATR72-500s
•Extended 5 ATR72-500 expiring FY06 by additional 2 years
• Narrow Body
•Current Fleet of 36 B737s
•FY06 – Q1 – 3 additional B737-800s leased
•FY06 – Q2 – 1 additional B737-700 leased
•FY06 – Q3 – 2 additional B737-800s leased
•FY06 – Q4 – 1 additional B737-800 purchased
•Between July 2006 and October 2007 – 10 B737s (9 purchased and one
leased)
• Wide Body
•Current – 3 A340-300E
•LOI – 4 A330-200 aircraft

23
Key Strategies for FY 2006
• Sustain Market Leadership in Domestic Operations
• Maintain High Product & Service Quality on both Domestic and International routes
• Achieve profitable growth in International Operations
• Operate a young and modern fleet
• Prime Focus on controlling/ reducing costs
• Preserve and maintain strong, team-oriented and customer focused culture

24
Thank You