Embed Size (px)
Citation preview
Jet Propulsion Laboratory
Jairus HihnScott Morgan
Jet Propulsion Laboratory, California Institute of Technology
Bootstrapping Process Improvement Metrics:
CMMI Level 4 Process Improvement Metrics in a Level 3 World
October 22-24, 201328th International Forum on Systems, Software, and COCOMO Cost Modeling
J e t P r o p u l s i o n L a b o r a t o r y
Background
The Jet Propulsion Laboratory (JPL) is a Federally Funded Research & Development Center (FFRDC) operated by the California Institute of Technology for the National Aeronautics and Space Administration (NASA).
JPL has around 5000 employees
As part of the NASA team, JPL enables the nation to explore space for the benefit of humankind by developing robotic space missions to:
Explore our own and neighboring planetary systems.Search for life beyond the Earth's confines.Further our understanding of the origins and evolution of the
universe and the laws that govern it.Enable a virtual presence throughout the solar system using the
Deep Space Network and evolving it to the Interplanetary Network of the future.
2
J e t P r o p u l s i o n L a b o r a t o r y
3
Background (cont.)
The Software Quality Improvement (SQI) Project at JPL has been in existence for about 11+ years and with the increasingly tight budgets more and more managers wanted to know• Aren’t you done yet• What are we getting for all of this money
Textbooks and the Carnegie Mellon Software Engineering Institute (SEI) often promote the measurement of changes to well defined baseline indicators, pre and post the process change• For example, use of process control charts and
measuring changes in the control limits.• This type of approach works well for CMMI Maturity
Level 4 & 5 organizations.
J e t P r o p u l s i o n L a b o r a t o r y
4
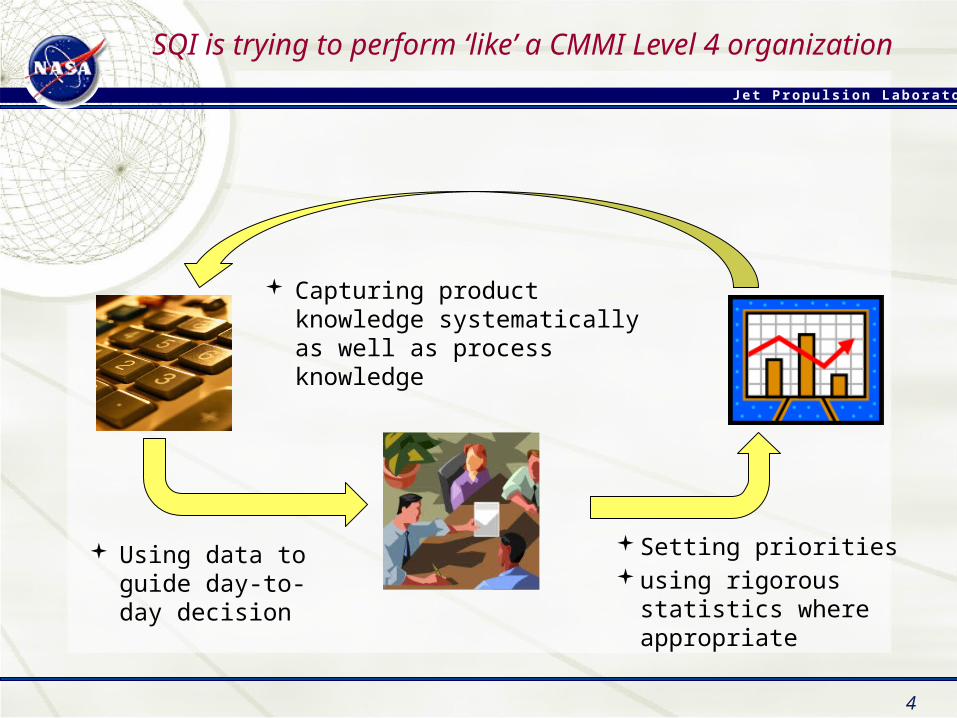
SQI is trying to perform ‘like’ a CMMI Level 4 organization
Setting priorities using rigorous statistics
where appropriate
Capturing product knowledge systematically as well as process knowledge
Using data to guide day-to-day decision
J e t P r o p u l s i o n L a b o r a t o r y
5
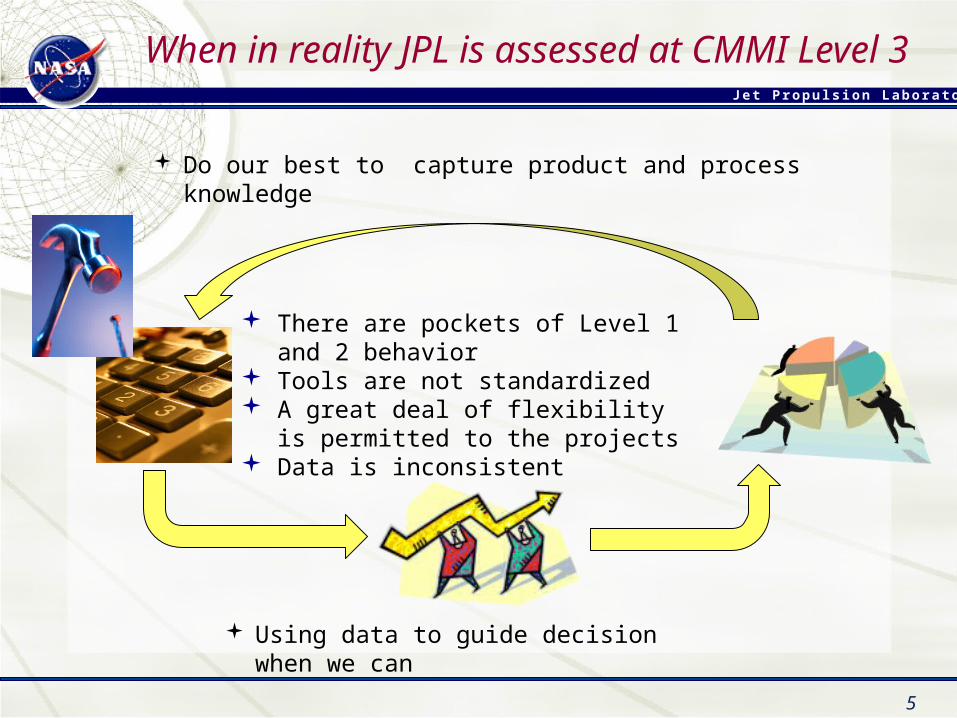
When in reality JPL is assessed at CMMI Level 3
Do our best to capture product and process knowledge
Using data to guide decision when we can
There are pockets of Level 1 and 2 behavior
Tools are not standardized A great deal of flexibility
is permitted to the projects Data is inconsistent
J e t P r o p u l s i o n L a b o r a t o r y
6
So What Can We Do?
Put infrastructure in place Drive decisions with objective information and
data when available Must use a multi-pronged approach
• We do rely heavily on self reports Communicate results as widely as possible
• State of Software Report• Noontime seminars• Management reviews• Section manager quarterly meetings
J e t P r o p u l s i o n L a b o r a t o r y
7
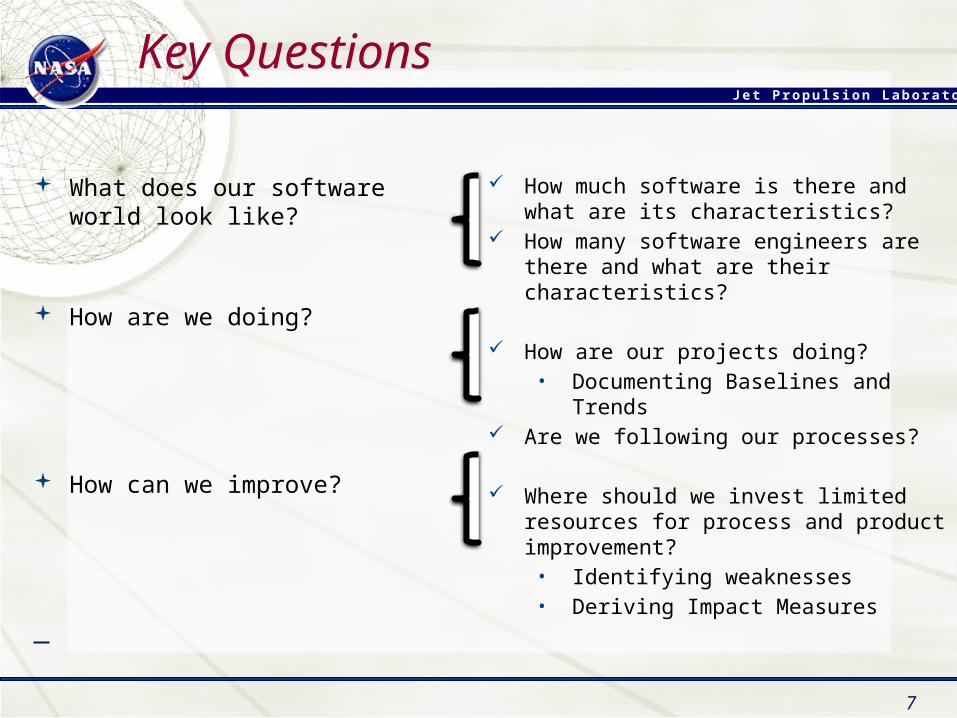
Key Questions
What does our software world look like?
How are we doing?
How can we improve?
How much software is there and what are its characteristics?
How many software engineers are there and what are their characteristics?
How are our projects doing?• Documenting Baselines and
Trends Are we following our processes?
Where should we invest limited resources for process and product improvement?
• Identifying weaknesses• Deriving Impact Measures
J e t P r o p u l s i o n L a b o r a t o r y
Data Sources
Data Sources• Metrics Collection at Key Milestones• Software Inventory (2006, 2007 and 2009)• Process performance measures (Tailoring Record, Work Product
Checklist)• Defect tracking systems (PRS, ISA, AAMS, local databases)• JPL Human Resources Information System• SQI Surveys and Contact Log• Product and Process Quality Assurance Activities• Customer Feedback
8
Data is gathered from virtually all mission software teams
• We would like to thank the several hundred people who gave their valuable time to make this data available
J e t P r o p u l s i o n L a b o r a t o r y
9
What does our software world look like?
J e t P r o p u l s i o n L a b o r a t o r y
Did you know?
The JPL Engineering and Science Directorate is one of the 500th largest software organizations in the United States Based on comparing JPL labor costs to company revenues
for software products and services then according to the 2007 US economic census we may even be in the top 250
We compare to Disney and Lucas Arts and are smaller then Rockwell Automation
We are cognizant over 53 million lines of code representing an investment in the neighborhood of $2.7 billion
There are currently 36 million lines of code in development or maintenance directly supporting our projects which is supported by 464 work years per year or approximately
$136 million annually Mission Critical and Mission Support Software only
10
J e t P r o p u l s i o n L a b o r a t o r y
Software Characteristics
J e t P r o p u l s i o n L a b o r a t o r y
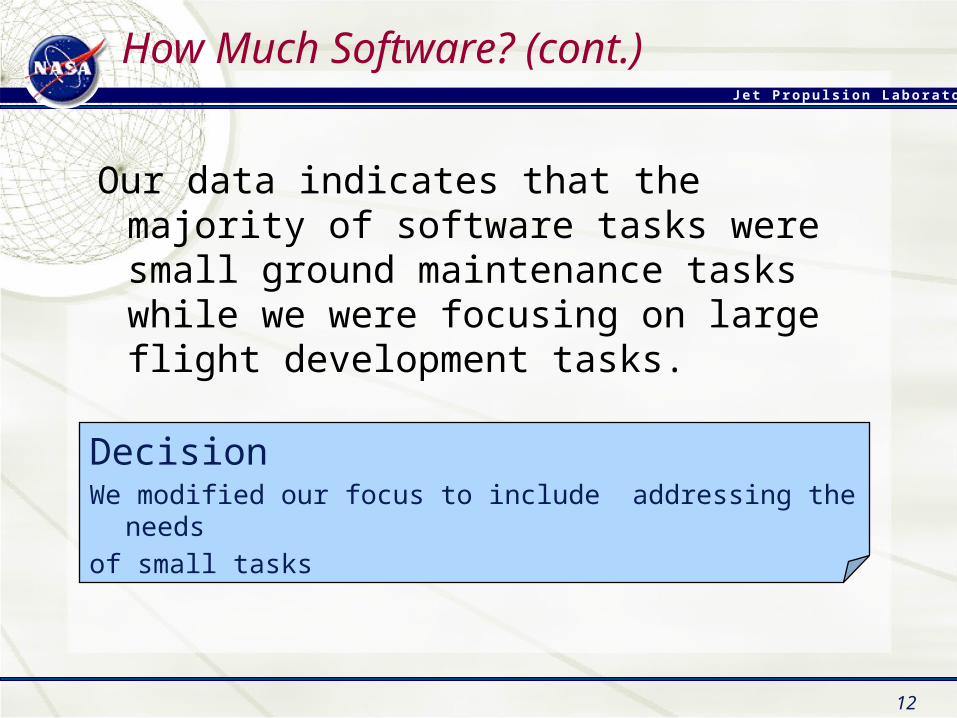
How Much Software? (cont.)
12
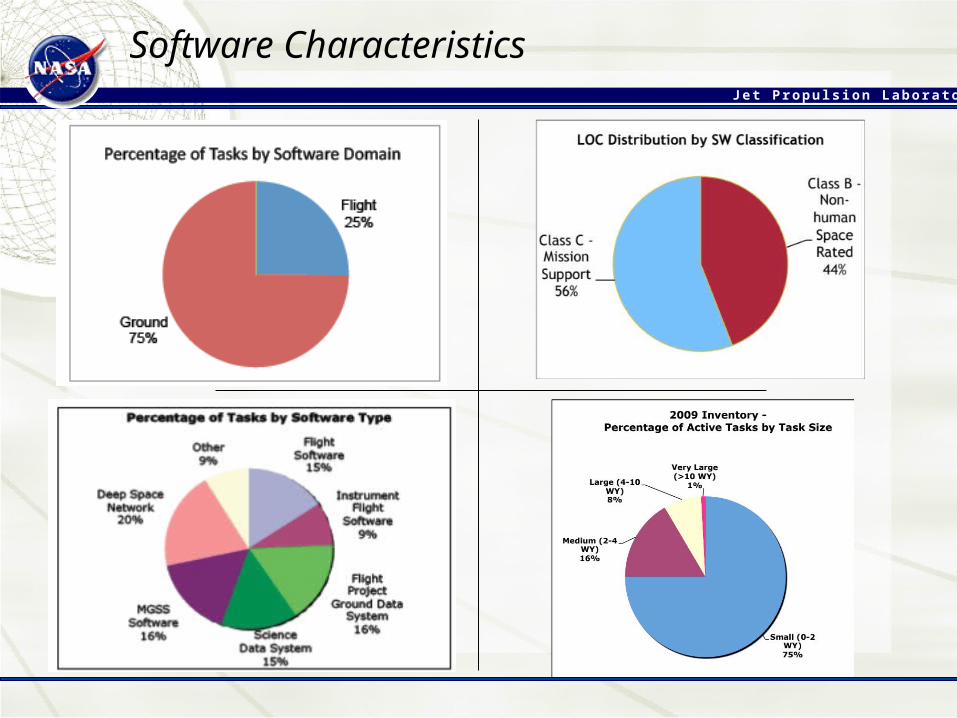
Our data indicates that the majority of software tasks were small ground maintenance tasks while we were focusing on large flight development tasks.
DecisionWe modified our focus to include addressing the needs of small tasks
J e t P r o p u l s i o n L a b o r a t o r y
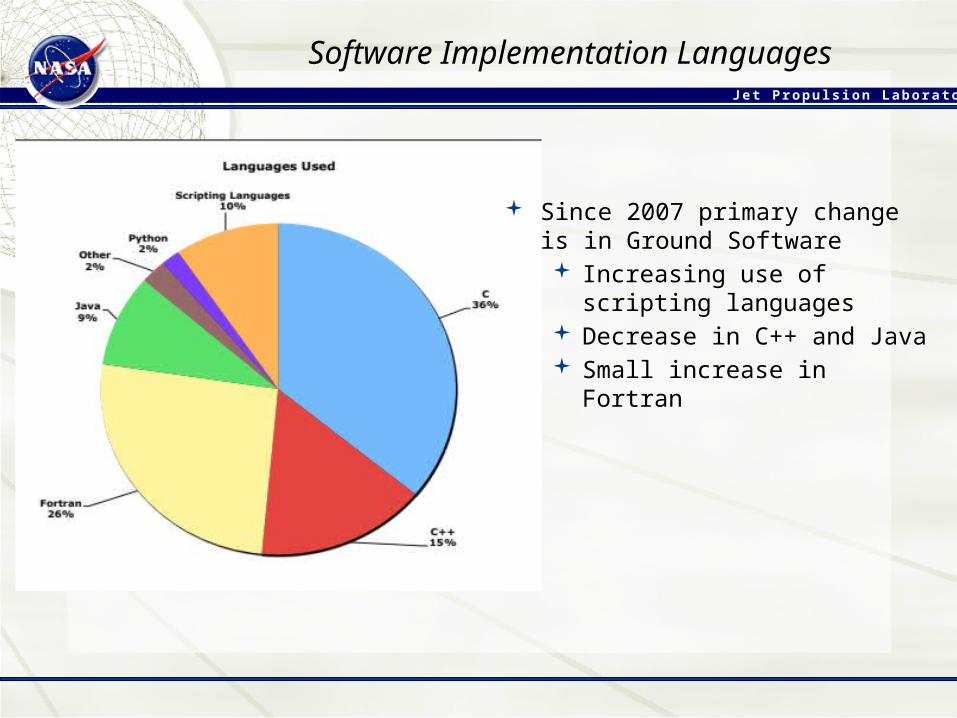
Software Implementation Languages
Since 2007 primary change is in Ground Software Increasing use of scripting
languages Decrease in C++ and Java Small increase in Fortran
J e t P r o p u l s i o n L a b o r a t o r y
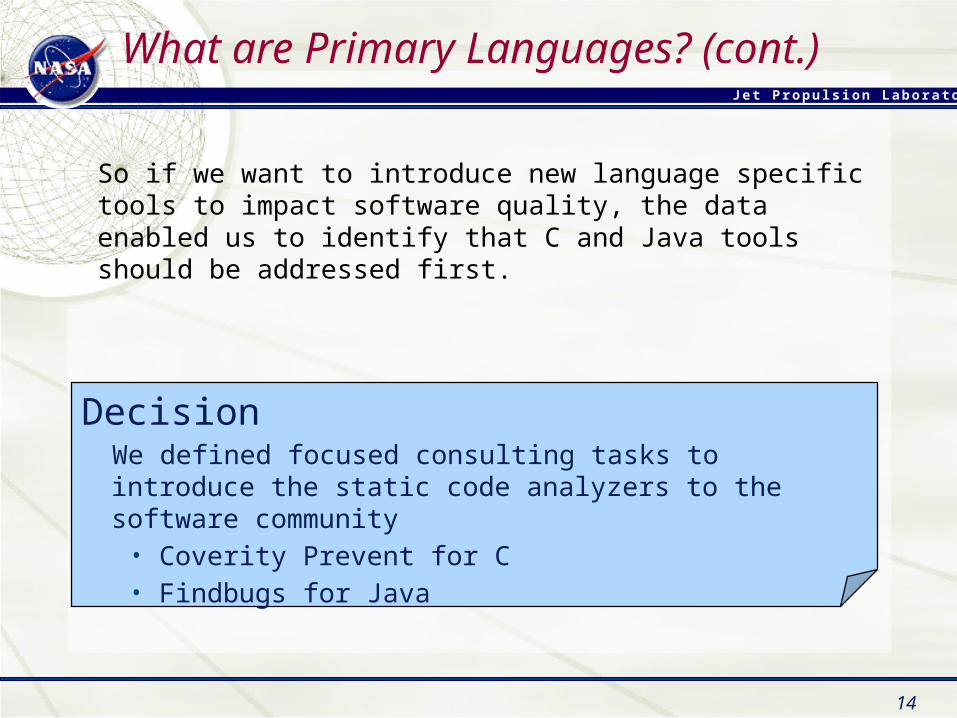
What are Primary Languages? (cont.)
14
So if we want to introduce new language specific tools to impact software quality, the data enabled us to identify that C and Java tools should be addressed first.
DecisionWe defined focused consulting tasks to introduce the static code analyzers to the software community
• Coverity Prevent for C• Findbugs for Java
J e t P r o p u l s i o n L a b o r a t o r y
15
How are we doing?Are we following our
processes?
J e t P r o p u l s i o n L a b o r a t o r y
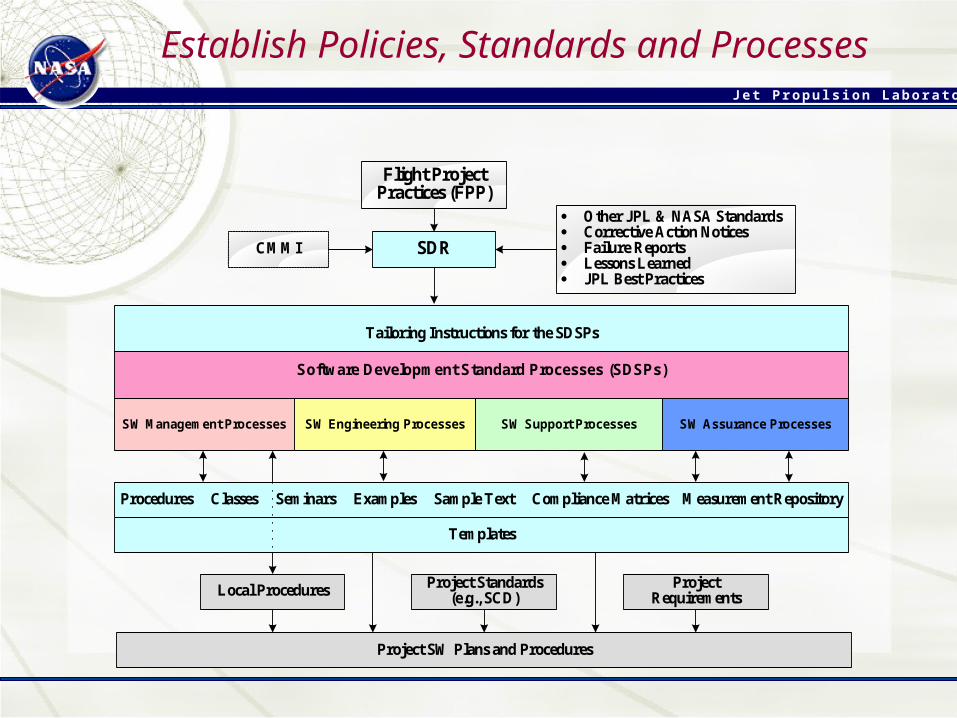
Establish Policies, Standards and Processes
SDR
· Other JPL & NASA Standards· Corrective Action Notices· Failure Reports· Lessons Learned· JPL Best Practices
CMMI
Tailoring Instructions for the SDSPs
Software Development Standard Processes (SDSPs)
Flight Project Practices (FPP)
SW Management Processes SW Engineering Processes SW Support Processes SW Assurance Processes
Procedures Classes Seminars Examples Sample Text Compliance Matrices Measurement Repository
Local Procedures Project Requirements
Project Standards (e.g., SCD)
Templates
Project SW Plans and Procedures
J e t P r o p u l s i o n L a b o r a t o r y
17
Software Development Standard Processes (SDSP) Applicability
The SDSPs describe how mission software tasks are expected to perform their software development activities• All mission software tasks must start with the SDSPs
as a basis for the activities they will perform • Software tasks then modify the SDSPs to fit their
particular task, based on task characteristics such as size, risk, domain, etc.
• Task-specific modifications of the SDSPs must follow published procedures. The modifications are reviewed by task management, line management, Software Quality Assurance (SQA), and SQI. They are then approved by the Process Owner.
J e t P r o p u l s i o n L a b o r a t o r y
18
Process Performance
Process Performance questions• Are we following our processes?• How does process performance vary by
software characteristics?• What are the least performed processes ?• What process areas should be targeted for
improvement? Process Performance is measured by responses
to the • Tailoring Record (TR), • Work Product Checklist (WPC), • Tailoring Record Review (TRR), • Software Process Review (SPR)• Product and Process Quality Audits (PPQA)
J e t P r o p u l s i o n L a b o r a t o r y
19
Measuring Process Performance
The WPC provides a quick look as to whether 60 key products identified in the SDSPs are being developed
TR and TRR provide risks, strengths, recommendations at planning stage
SPR asks the question: based on the processes you planned to use “How are things working for you?” Specifically:• Are your processes effective? (That is, did you
accomplish the process objectives?)• Have any processes been descoped?• Are your resources adequate? (That is, were
resources adjusted significantly different from plans?)
J e t P r o p u l s i o n L a b o r a t o r y
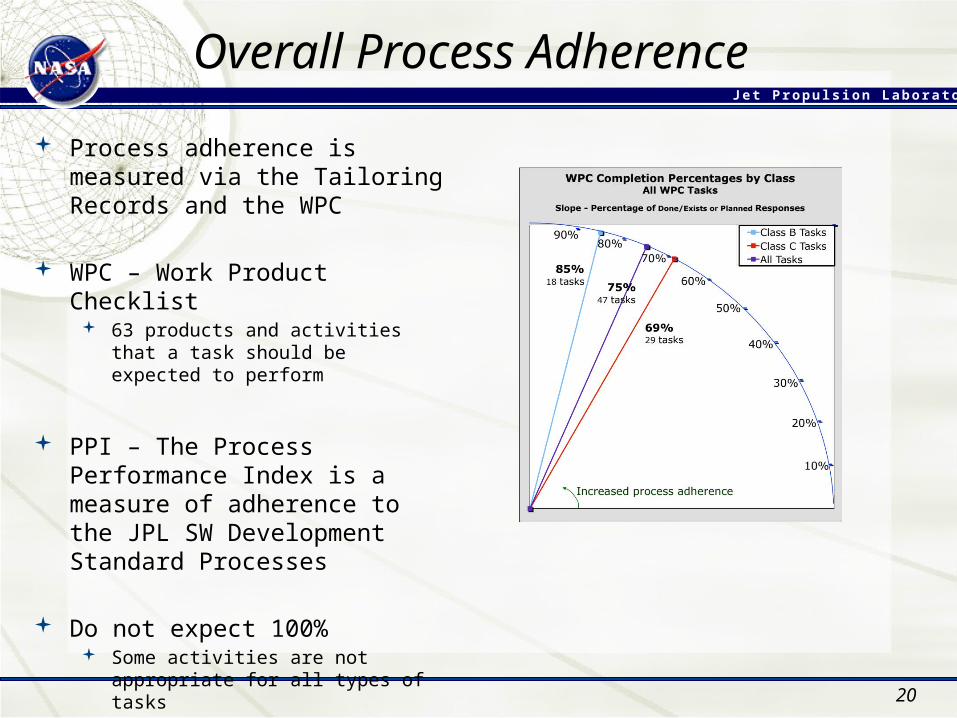
Overall Process Adherence
Process adherence is measured via the Tailoring Records and the WPC
WPC – Work Product Checklist
63 products and activities that a task should be expected to perform
PPI – The Process Performance Index is a measure of adherence to the JPL SW Development Standard Processes
Do not expect 100% Some activities are not appropriate
for all types of tasks
PPI has slightly increased since 2007 20
J e t P r o p u l s i o n L a b o r a t o r y
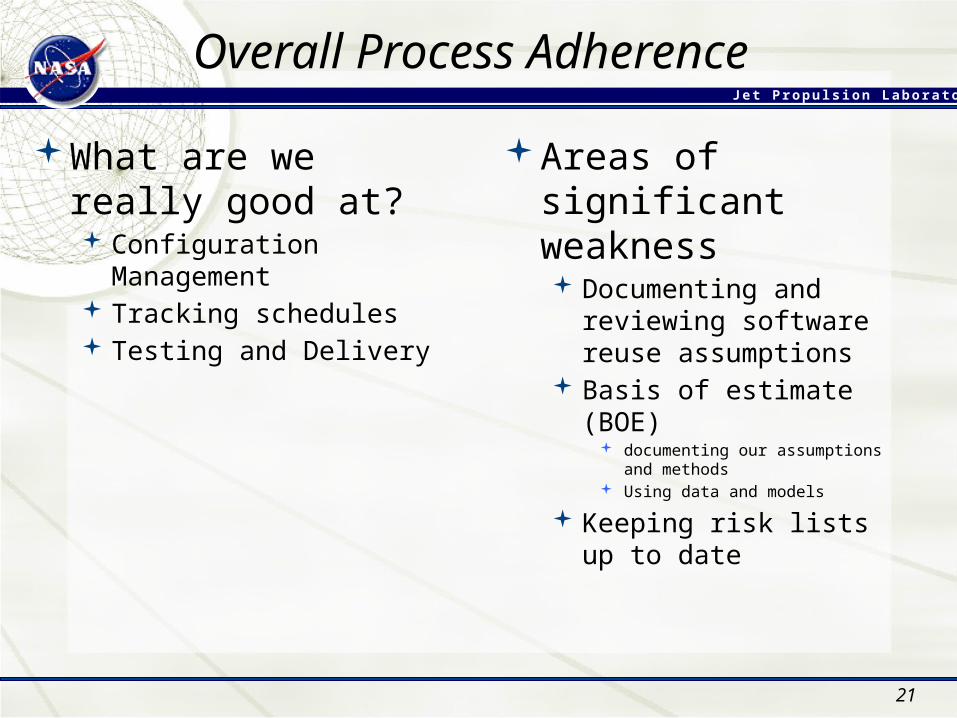
Overall Process Adherence
What are we really good at? Configuration
Management Tracking schedules Testing and Delivery
21
Areas of significant weakness Documenting and
reviewing software reuse assumptions
Basis of estimate (BOE) documenting our assumptions and
methods Using data and models
Keeping risk lists up to date
J e t P r o p u l s i o n L a b o r a t o r y
22
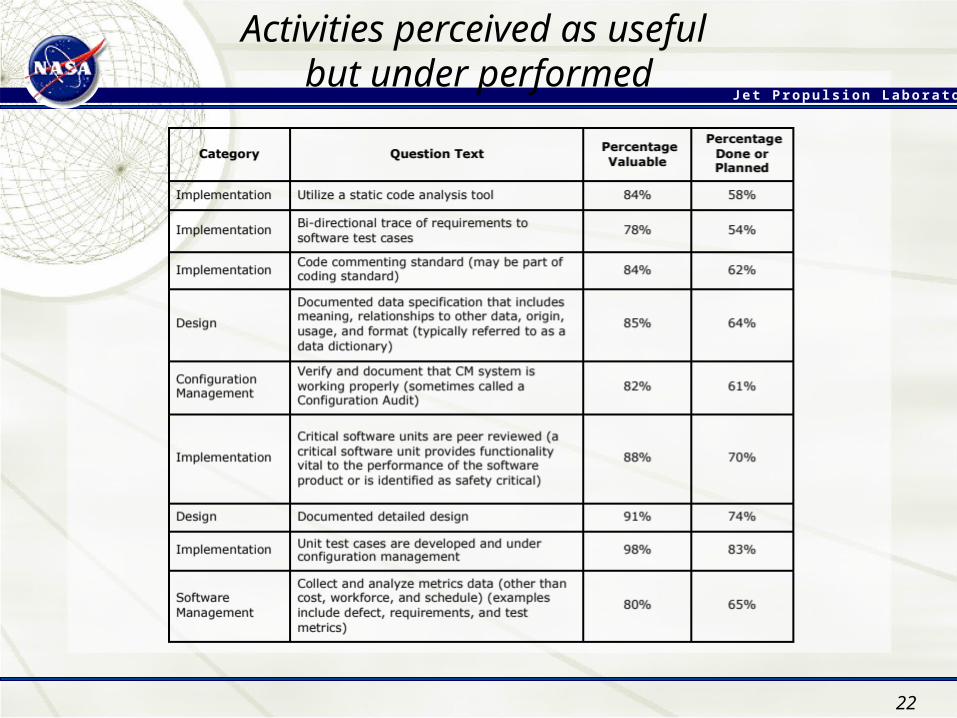
Activities perceived as useful but under performed
J e t P r o p u l s i o n L a b o r a t o r y
23
Indicators of the Impact of Process
Improvement
J e t P r o p u l s i o n L a b o r a t o r y
Metrics as Evidence
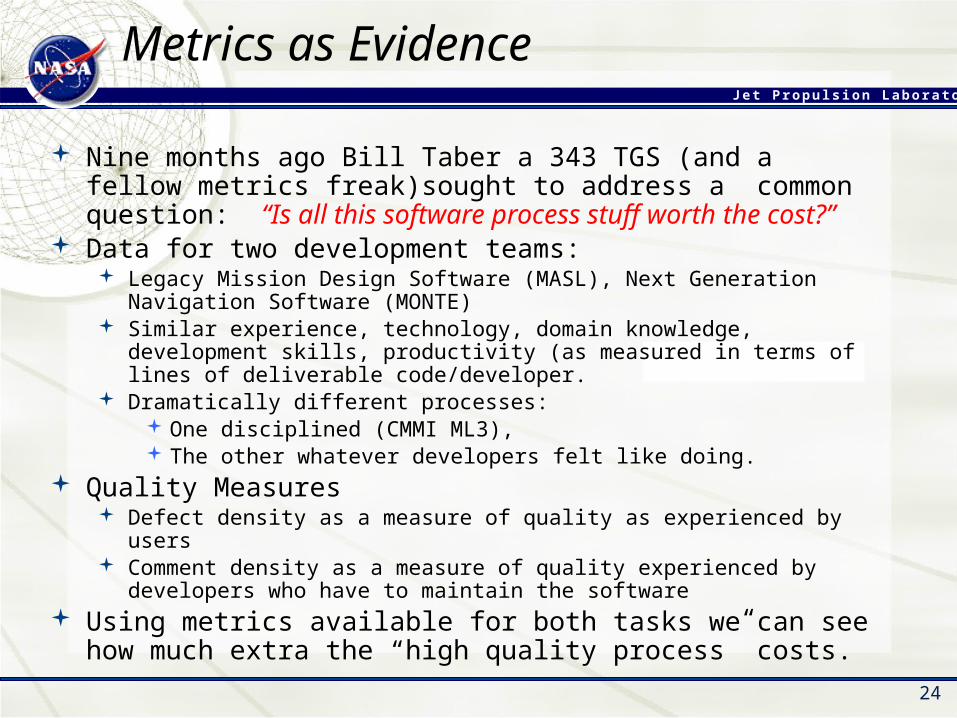
Nine months ago Bill Taber a 343 TGS (and a fellow metrics freak)sought to address a common question: “Is all this software process stuff worth the cost?”
Data for two development teams: Legacy Mission Design Software (MASL), Next Generation Navigation Software
(MONTE) Similar experience, technology, domain knowledge, development skills,
productivity (as measured in terms of lines of deliverable code/developer. Dramatically different processes:
One disciplined (CMMI ML3), The other whatever developers felt like doing.
Quality Measures Defect density as a measure of quality as experienced by users Comment density as a measure of quality experienced by developers who have
to maintain the software Using metrics available for both tasks we can see how much extra
the “high quality process” costs.
24
J e t P r o p u l s i o n L a b o r a t o r y
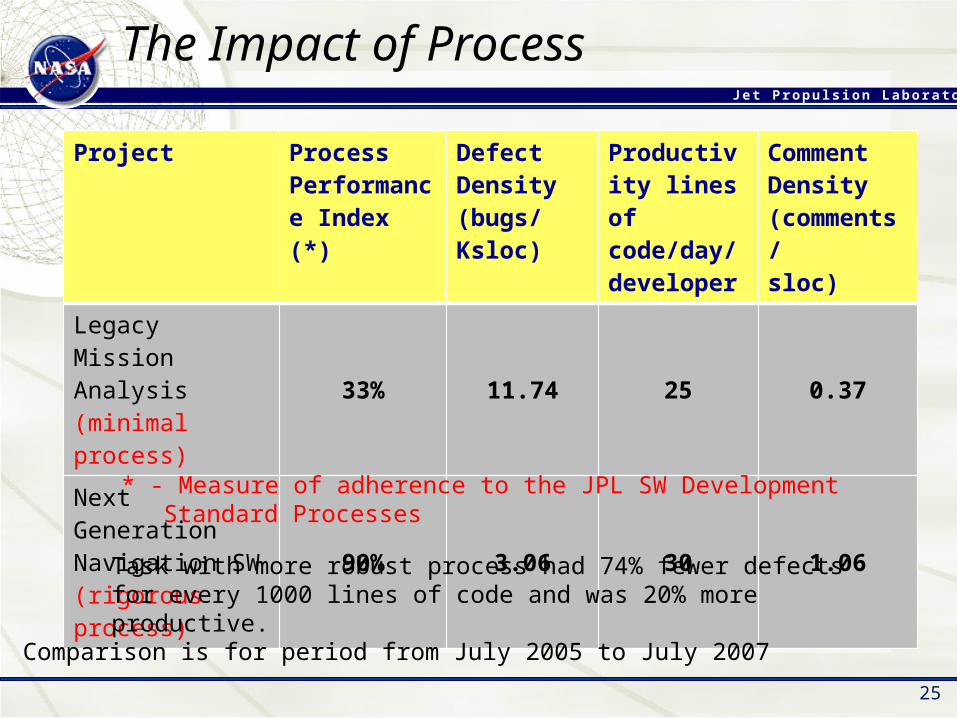
The Impact of Process
Project Process Performance Index (*)
Defect Density (bugs/Ksloc)
Productivity lines of code/day/developer
Comment Density (comments/sloc)
Legacy Mission Analysis(minimal process)
33% 11.74 25 0.37
Next Generation Navigation SW(rigorous process)
90% 3.06 30 1.06
Comparison is for period from July 2005 to July 2007
* - Measure of adherence to the JPL SW Development Standard Processes
Task with more robust process had 74% fewer defects for every 1000 lines of code and was 20% more productive.
25
J e t P r o p u l s i o n L a b o r a t o r y
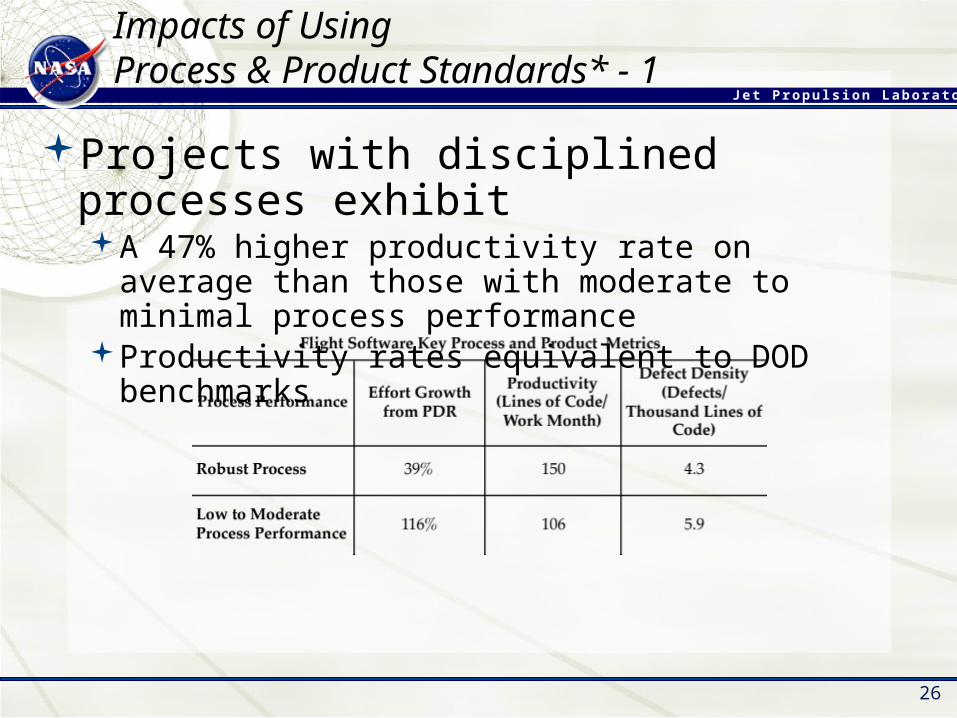
Impacts of Using Process & Product Standards* - 1
Projects with disciplined processes exhibit A 47% higher productivity rate on average than those
with moderate to minimal process performance Productivity rates equivalent to DOD benchmarks
26
J e t P r o p u l s i o n L a b o r a t o r y
27
Baselines and Trends (cont.)
Doing our best to track these for last 6-7 years Primarily documented in the State of Software Report “Effort Growth from PDR” chart has had significant impact
on managers perceptions We continue to seek more and better quantitative
indicators However, these types of metrics change slowly and are
impacted by many factors
DecisionWe introduced an approach to quick short
term impact indicators based on Customer Contact and Recommendations Tracking
J e t P r o p u l s i o n L a b o r a t o r y
28
How many software engineers are there and what are their
characteristics?
J e t P r o p u l s i o n L a b o r a t o r y
29
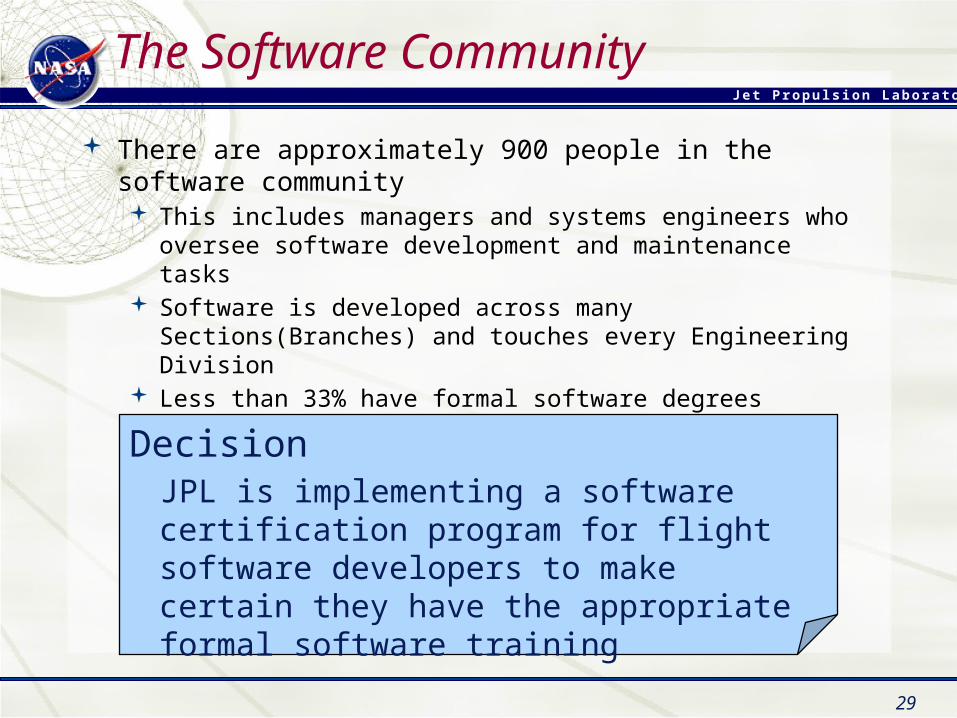
The Software Community
There are approximately 900 people in the software community This includes managers and systems engineers who
oversee software development and maintenance tasks Software is developed across many Sections(Branches)
and touches every Engineering Division Less than 33% have formal software degrees
DecisionJPL is implementing a software certification program for flight software developers to make certain they have the appropriate formal software training
J e t P r o p u l s i o n L a b o r a t o r y
30
Wrap Up
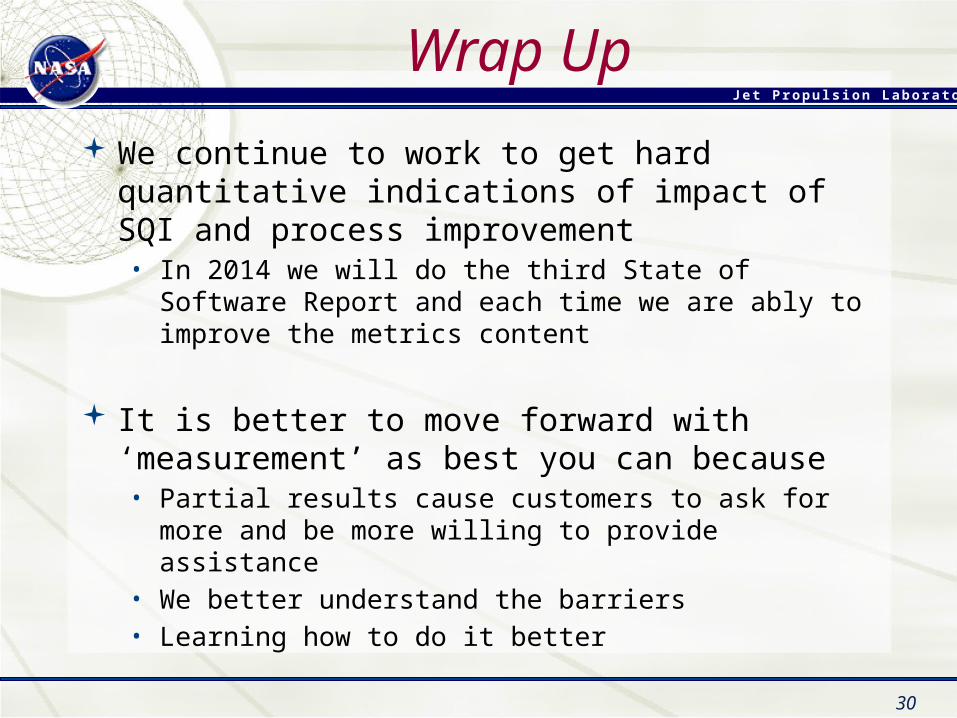
We continue to work to get hard quantitative indications of impact of SQI and process improvement• In 2014 we will do the third State of Software Report
and each time we are ably to improve the metrics content
It is better to move forward with ‘measurement’ as best you can because • Partial results cause customers to ask for more and
be more willing to provide assistance• We better understand the barriers • Learning how to do it better
J e t P r o p u l s i o n L a b o r a t o r y
31
Acknowledgements and Reports Available
Detailed report is availableJ. Hihn, S. Morgan et. al., ESD Mission Software: State of Software Report 2011 External Release, JPL D-29115, June, 2012.
This work was carried out at the Jet Propulsion Laboratory, California Institute of Technology, under a contract with the National Aeronautics and Space Administration. © 2013 California Institute of Technology. Government sponsorship acknowledged.
This work would not have been possible without the support of John Kelly in the NASA Office of the Chief Engineer and the JPL Engineering and Science Directorate


![Gas Dynamics and Jet Propulsion[May2006]](https://img.pdfslide.net/doc/110x75/55cf9202550346f57b92add3/gas-dynamics-and-jet-propulsionmay2006.jpg)