Embed Size (px)
Citation preview
Inside this edition
SkyWarn Spotter 2
Winter Recap 3
Hydrological Outlook 4
Summer Outlook 7
SpringSummer Tables 8
Fire Weather 10
State of the Science 11
COOP Corner 14
CoCoRaHS 15
Are you Weather-Ready 16
Information Stop 17
Jet Stream Jargon National Weather Service Billings MT
2018 Spring Issue
facebookcomNWSBillings TwittercomNWSBillings
From the Desk of the Meteorologist in ChargeFrom the Desk of the Meteorologist in Charge
Now that winter is finally over our attention turns to the mountain
snowpack and the annual spring snowmelt runoff The spring run-
off can evolve in many different ways High levels of mountain
snowpack does NOT necessarily equate to flooding A number of
other factors dictate the timing magnitude and impact of the annu-
al spring runoff The primary factors are 1) extraordinarily slow
moving multi-day rainfall events in MayJune (recall May 2011) 2)
well-above normal temperatures (a string of daytime high tempera-
tures near or above 80 degrees over the plains which equates to
strong melting in the higher elevations) for a number of consecutive
days and 3) daynight temperature trends (ie do mountain areas
stay above freezing at night)
We will continue to monitor snowpack trends through May while
watching spring weather systems to determine if any of them will
be significant contributors to the spring runoff
As we move towards the end of May our attention will turn to our
severe weather season which typically gets active at the end of May
and continues at least through mid-July By mid-July we typically
begin supporting wildfire suppression efforts with forecasts as our
strong winterspring moisture typically leads to plenty of fine fuels
which begin to cure in mid to late summer
Entering the summer we will have a couple of vacant positions
within the office Our Administrative Support Assistant position re-
mains vacant (since August 2016) Additionally Marc Singer our
former Science and Operations Officer moved to Tucson in Febru-
ary as that officersquos new Meteorologist in Charge Finally Wright
Dobbs one of our younger Meteorologists will be heading home to
Tallahassee FL to help restore staffing levels in that office prior to
hurricane season As always we appreciate all the reports you pro-
vide as weather spotters and Coop Observers
Keith W Meier
2
From the Warning Coordination Desk
Submitted by WCM Tom Frieders
Skywarn Spotter Training ndash Itrsquos Fun amp Free
Become a volunteer severe thunderstorm spotter and learn how to identify and re-
port severe weather to your local National Weather Service Office keeping your local
community informed of potentially hazardous weather
Meteorologists rely on trained volunteers to supplement Doppler Radar and Satellite
data Storm spotter reports are an important step in the warning decision process for
our Meteorologists regarding severe thunderstorms
Training will be conducted through May with the full schedule at
httpswwwweathergovbyzspotter_training
How Do You Stay Informed
Here are some options to stay informed on incoming hazardous weather
NOAA Weather Radio This is your direct link to NWS warnings
Specially built receivers will alert you when watches and warnings
are issued for your area and also keep you informed on the latest
forecast 247 Weather Radio receivers can be purchased in most
electronic and many department stores for $30 dollars or less
More information at httpwwwwrhnoaagovbyznwrhomephp
FEMA App Receive National Weather Service Alerts for up to 5 lo-
cations along with safety reminders and tips
More information httpswwwfemagovmobile-app
Red Cross Apps Apps available for all types of emergencies Spe-
cifically for severe weather a Tornado App is available This app
will alert you for both Tornado and Severe Thunderstorm watches
and warnings Check out the wide variety of apps available
More information httpwwwredcrossorgget-helpprepare-for-
emergenciesmobile-apps
Wireless Emergency Alerts If you have a newer smartphone that
is Wireless Emergency Alert Capable you are already signed up
Your phone will alert you for Tornado Warnings Flash Flood
Warnings Amber Alerts or critical Presidential alerts during na-
tional emergencies More information
httpswwwfemagovfrequently-asked-questions-wireless-emergency-alerts
3
2017-2018 Winter Recap
Submitted by Lead ForecasterClimate Program Manager Joe Lester
The 2017-18 winter will be remembered for its abundant snowfall and lack of significant
warm spells both of which resulted in an extended period of snow cover in our region After
a very warm late November (remember the 70s on Thanksgiving) the first half of December
was actually quite mild but the weather pattern turned much colder and snowier before
Christmas By the end of the year we had experienced a significant winter storm and cold
spell Mizpah reached -41 degrees on New Yearrsquos Day
The weather pattern remained favorable for periods of snow and cold throughout January and
February Miles City had its coldest February since records began in 1937 and Sheridan was
coldest since 1936 Billingsrsquo three-month snowfall total was over three feet above normal The
cold and snowy winter can be at least partially attributed to the weak La Nina in the tropical
Pacific Ocean a condition that favors increased storminess across the northern Rockies Also
warmer conditions and less sea ice in the Arctic likely contributed to greater atmospheric
moisture through the winter season
Through April 6th Billingsrsquo total snowfall of 1024 inches ranked 2nd most all-time for an en-
tire season With almost two months yet to go there is potential to approach the record of
1035 inches set in 2013-14
Here are some meteorological winter (Dec-Feb) statistics at our four
main climate stations
4
A Hydrological Outlook
Submitted by Lead ForecasterHydrology Program Manager Todd Chambers
We have a heavy snowpack in the western mountains and near normal in the Bighorns
Does this mean we will have river flooding during this summerrsquos run-off season Rivers and
streams across our area have been carved out over time by heavy run-off seasons and they
have a large capacity to hold run-off from even record snow pack as long as it melts at a
normal pace and the spring precipitation is around normal The key to flooding of our riv-
ers and streams is prolonged heat-waves and extended periods of heavy rainfall Thus we
will have to wait and see how wet and warm our late spring early summer is
Nearly half of our regionrsquos annual precipitation occurs during the spring months and cur-
rent indications are a bit uncertain with generally equal chances of above or below normal
conditions Temperatures are expected to trend toward cooler than normal conditions
Will this lead to a gradual snow melt and limited flooding Stay tuned to our forecasts
Here are the temperature and precipitation outlooks for the months of April May and June
Now is the time to be preparing for flooding if you live or have interests along a waterway
Have a plan to move equipment and livestock to higher ground and safeguard your property
In recent years bank erosion has claimed several structures across our area With an expected
heavy and prolonged run-off we can expect to have more erosion issues this year as well
Look into flood insurance and remember there is a waiting period before it takes effect so
donrsquot wait too long
Monitor observed and forecast river conditions
via the Advanced Hydrologic Prediction Service
httpswaterweathergovahps2indexphp
wfo=byz
5
A Hydrological Outlook contrsquod
Submitted by Lead ForecasterHydrology Program Manager Todd Chambers
There will be plenty of water in rivers and streams for all uses this year La-Nina winters in
the Northern Rockies usually bring heavy snow to the western mountains and this year was
no exception The BeartoothAbsaroka mountains are well above average for snow In fact
the upper Yellowstone river basin exceeded its normal snow water for the season way back
on the 1st
of February which usually occurs in late April
Here is a graph of the accumulated water equivalent of the mountain snowpack in the Upper
Yellowstone Basin courtesy of the Natural Resources and Conservation Service Note this sea-
sons trends (red line) have remained above the median (black line) throughout the season
Below is the percentage of normal Snow Water Equivalent (SWE) mapped out for all basins of
Montana and Wyoming noting the above normal conditions for most of the region
6
Much of this precipitation fell as snow over the winter though a few rainfreezing rain events
did make an appearance Cold temperatures to go along with the precipitation have kept the
snow around over areas east of Billings through late March which is unusual This late snow-
pack lead to concerns about snow melt flooding and ice jams But temperatures have cooper-
ated so far resulting in a moderate melt rate helping to ease those concerns Some areas have
seen standing water in low lying areas and clogged culverts have pushed water over some
roads but overall impacts have been minor thus far Ice Jams could have been a significant
problem but ice jam flooding was minor as the rivers opened up
Yellowtail Dam has seen record releases into the Bighorn River so
far this winter as residual water from last yearrsquos heavy precipita-
tion in Wyoming continues to work through the Bighorn River sys-
tem Early April releases are at 6500 cubic feet per second (cfs)
compared to a normal release of 2900 cfs Officials expect addi-
tional release increases this spring to make room for this seasons
run-off so another high flow year can be expected Whether it
reaches anywhere near last yearrsquos prolonged record releases will
depend on spring precipitation over central Wyoming
A Hydrological Outlookcontrsquod
Submitted by Lead ForecasterHydrology Program Manager Todd Chambers
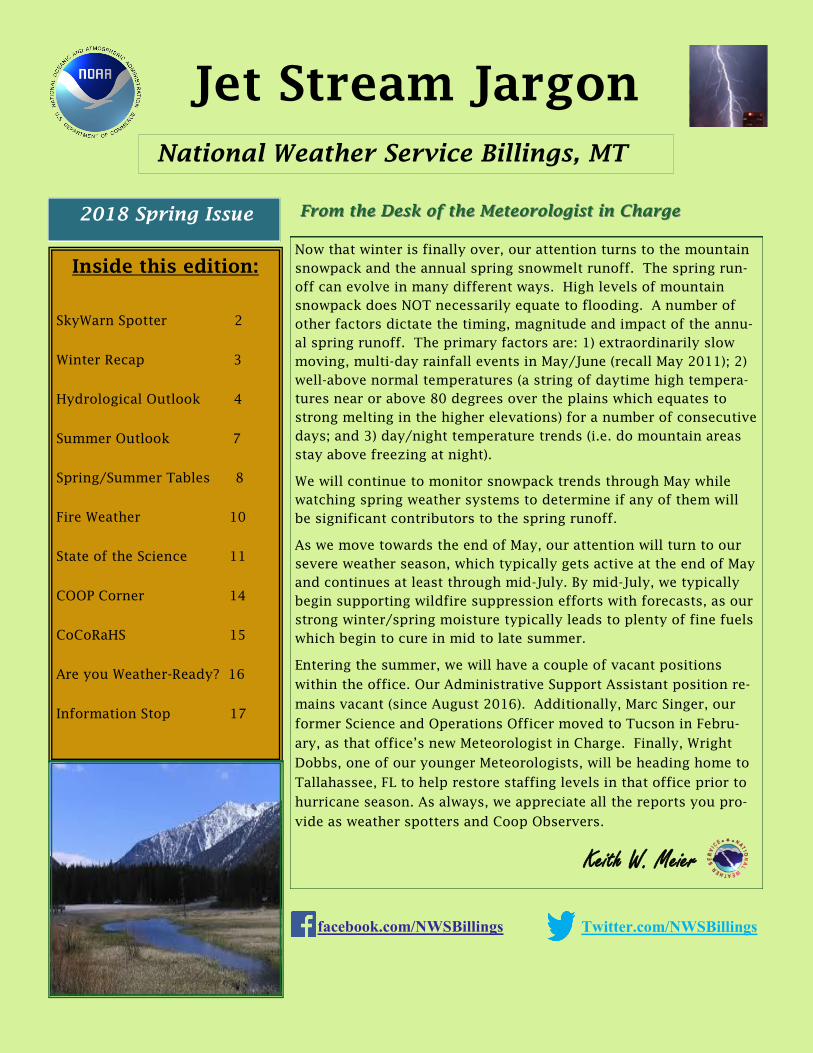
For the lower elevations east of the Divide it has been a wet winter as well with most loca-
tions seeing more than 130 percent of normal precipitation and some areas over 200 per-
cent of normal Only areas around the Bighorn and Pryor mountains and from Miles City to
Baker saw near to below average precipitation
7
2018 Summer Outlook
Submitted by Lead Forecaster amp Climate Program Manager Joe Lester
How did the 2017-18 Winter Outlook verify
The 2017-18 winter has come to an end but do you remember what the winter outlook
showed last fall The Climate Prediction Center examines its accuracy after each season Be-
low is how the temperature outlook verified with forecast temps on the left and observed on
the right Not too bad for the northern Rockies and high plains Please see this article for
more information httpswwwclimategovnews-featuresblogsensometeorological-winter-over-
howrsquod-we-do
With the passage of the spring equinox we are rapidly shifting gears toward the warm sea-
son Climate signals are not real clear for the summer months (JuneJulyAugust) when pre-
cipitation is driven by thunderstorm activity rather than dynamic weather systems Though
recent summers have trended warmer in general The latest June-August outlook from the
Climate Prediction Center shows a slight hedging toward warmer and drier than normal in
our region
8
Spring Data Tables
Spring Averages
Meteorological spring is classified as the months of March April and May Here are the aver-
age temperatures and precipitation for the Billings Airport the Miles City Airport and the
Sheridan Airport for the spring season Averages are calculated using a 30-year period of rec-
ord 1981 to 2010 All temperatures are in degrees Fahrenheit and all precipitation amounts
are in inches
ldquoIn the Spring I have counted 136 different kinds of weather inside of 24 hoursrdquo
Mark Twain
Sheridan
Date High Low Average Precipitation
31 ndash 331 484 220 352 098
41 ndash 430 574 298 436 160
51 ndash 531 667 382 525 235
31 ndash 531 578 314 441 493
Billings
Date High Low Average Precipitation Snowfall
31 ndash 331 486 269 377 106 102
41 ndash 430 576 347 462 166 83
51 ndash 531 675 436 556 218 20
31 ndash 531 574 351 463 490 205
Miles City
Date High Low Average Precipitation
31 ndash 331 465 228 347 060
41 ndash 430 588 332 460 137
51 ndash 531 686 431 559 218
31 ndash 531 584 342 463 415
9
Summer Data Tables
Summer Averages
Meteorological summer is classified as the months of June July and August Here are the av-
erage temperatures and precipitation for the Billings Airport the Miles City Airport and the
Sheridan Airport for the summer season Averages are calculated using a 30-year period of
record 1981 to 2010 All temperatures are in degrees Fahrenheit and all precipitation
amounts are in inches
Last Hard Freeze Freeze and Frost Dates in the SpringSummer
Many people will start planting their crops and gardens over the next few months To keep
crops and plants protected from the cold it is important to know when the average last hard
freeze freeze and frost typically occur in the springsummer It is also important to know the
dates of the latest hard freeze freeze and frost The following are the average last hard
freeze freeze and frost dates and the latest hard freeze freeze and frost dates for Billings
Miles City and Sheridan The hard freeze temperature is based on 28 degrees Fahrenheit the
freezing temperature is based on 32 degrees Fahrenheit and the frost temperature is based on
36 degrees Fahrenheit Averages are based on a 30 year period of record 1981 to 2010
Recordkeeping began at the Billings Airport in 1934 at the Miles City Airport in 1937 and at
the Sheridan Airport in 1907
Billings
Date High Low Average Precip
61 ndash 630 772 521 647 212
71 ndash 731 868 588 728 132
81 ndash 831 857 573 715 075
61 ndash 831 833 561 697 419
Miles City
Date High Low Average Precip
61 ndash 630 786 526 656 251
71 ndash 731 883 595 739 164
81 ndash 831 872 580 726 091
61 ndash 831 852 578 715 506
Sheridan
Date High Low Average Precip
61 ndash 630 767 464 616 212
71 ndash 731 871 530 700 118
81 ndash 831 863 516 690 072
61 ndash 831 833 514 674 402
City
Average
Last Hard
Freeze
Latest Hard
Freeze on
Record
Average
Last
Freeze
Latest
Freeze on
Record
Average
Last
Frost
Latest
Frost on
Record
Billings Apr 23 May 28 May 7 Jun 13 May 18 Jun 13
Miles City Apr 27 May 28 May 9 Jun 8 May 18 Jun 18
Sheridan May 8 Jun 3 May 19 Jun 24 Jun 5 Jun 30
10
From the Fire Weather Desk
by Lead Forecaster Incident Meteorologist Dan Borsum
Where is the smoke coming from
Have you ever wondered about where the smoke that you are breathing is coming from Or
maybe what is going on with a fire in our area or somewhere else in the country There is a
convenient location on the internet to go to for information The media and other local agen-
cies may provide coverage and some infor-
mation but InciWeb (httpsinciwebnwcggov)
has all the official information that land manage-
ment agencies have shared about fires under
their jurisdiction You can find fire containment
current evacuation information the latest maps
pictures and more Some smaller fires like those
handled by a town or county fire department
may not be available If a fire is recently started
it may take some time to show up on InciWeb
This site has undergone a recent change that is
more user-friendly With a new map interface it
is much easier to find fires around area and
across the country Here is a sample image of the
interface
So the next time there is smoke in the air and you are curious where it is coming from you
will know where to find out Have a safe summer
11
State of the Science The New Satellite Era
by General ForecasterActing Science amp Operations Officer Ryan Walsh
Our Billings forecast area encompasses portions of southeastern Montana and northeastern
Wyoming This vast landscape has significantly varying terrain and climate which can make
forecasting extremely challenging The primary tools we use to determine current conditions
across our forecast area are radar satellite and surface observations from automated weather
stations
Radar is primarily used to detect precipitation such as in a thunderstorm but is limited in
range and canrsquot adequately cover our entire forecast area Weather observations can give us a
sense of the temperature humidity and wind speed but are limited to only a handful of loca-
tions around the area and only provide surface conditions Satellite imagery is the observa-
tional piece that can give us the most information about the state of our atmosphere across
our entire area
Our legacy satellites provided new information every 15 to 30 minutes and were fairly coarse
in resolution Low resolution and long delays between images made it difficult to use satellite
for timely detections of weather phenomenon such as wildfires or intensifying thunder-
storms In this part of the country where weather can change rapidly and vary significantly
from one location to another we needed some better tools to help us observe the atmosphere
to improve our forecast and warning decisions
To achieve that goal NOAA
launched a new generation of sat-
ellites called GOES-16 and GOES-
17 GOES-16 was launched last
year and is primarily responsible
for monitoring the eastern half of
the country GOES-17 was
launched this March and is cur-
rently undergoing testing and cali-
bration but will become opera-
tional over the western US later
this year
What does this mean for us How
will this improve forecast and
warning decisions
The technological improvement of this new generation of satellites is quite astounding the
equivalent of upgrading a first generation camera phone for this yearrsquos latest Apple or Sam-
sung product These satellites take visible and infrared images detect atmospheric moisture
lightning and much more all with significantly improved resolution compared to their prede-
cessors
12
State of the Science The New Satellite Era
by General Forecaster Ryan Walsh
The new GOES series is able to provide unprecedented detail (as seen below) which will al-
low forecasters to determine differences between cloud types composition assess small
scale features which will improve forecasts across the board
Our new satellite images will actually update quicker than our radar in many cases While
satellite cannot tell us the same type of information our radar tells us about thunderstorms
it will provide us basic information about structure and storm height that can help us better
predict severe thunderstorms especially in areas of poor radar coverage such as eastern
Montana and Wyoming
The newest GOES imagery resolution is so improved that we can now make out extremely
small scale details in both the clouds and land surface New images are sent every 5 minutes
and we have the capability to increase that to every 30 seconds during times of extreme
weather The image below is an example of how the new GOES satellites can detect detailed
hot-spots from wildfires allowing us to provide critical weather updates to resources fighting
those fires Note the wildfires show up as a bright pink on the satellite
13
State of the Science The New Satellite Era
by General Forecaster Ryan Walsh
Pictured below is an example of how our new satellites can detect the features of a
severe thunderstorm Looking down from above the thunderstorm the satellite is
detecting a bubbling crunchy looking dome This is called an overshooting top and
it indicates the storm has a significant column of rising air known as an updraft
The shape and notch appearance indicates a very organized thunderstorm with a
rotating updraft which could support hail or possibly tornadoes A forecaster could
make a warning decision earlier in many cases with the addition of this timely and
extremely detailed satellite information
These were just a few examples of the many ways in which the new GOES satellites
will improve our forecasts in the future The launch of these satellites has ushered
in a New Satellite Era which will change the way we observe the atmosphere across
all meteorological disciplines for years to come
14
COOP Corner
(Cooperative Observer Program)
by Observing Program Leader Larry Dooley
2018 Cooperative Observer Length of Service Awards
Recognition for many years of service and for special or sustained achievements is part of
the culture in a successful organization Awards are a time honored tangible method of
showing appreciation for many years of dedication The awards may be given to individual
observers families and institutions for length of service or in recognition of one or several
significant achievements The awards recognition program is the most visible way to honor
sustained volunteer service and when combined with constructive feedback is essential for
the retention of observers
This year at the National Weather Service forecast office here in Billings we have several
dedicated Cooperative Observers being recognized and will receive awards
John Jonutis of Mizpah will receive a 60 Year Award
Willis and Nadine Busenitz of Busby will receive 45 Year Awards
Dan Becker of Colstrip will receive 40 Year Award
Jacquelyn Hudecek from Springdale will receive 30 Year Award
Jim Goodwin from Ashland will receive 25 Year Award
Joann Ferguson from Livingston will receive 25 Year Award
Bill and Donna Linger from Molt will receive 25 Year Awards
Mary Ann Johnson from Vananda will receive Year Award
Elsie Shellenberger from Reedpoint will receive 20 Year Award
Vicky Schwartz from Big Timber will receive 20 Year Award
Judy A Rue from McLeod will receive 20 Year Award
Susan E Wood from Lavina will receive 15 Year Award
Marvin Crusch at Mystic Lake will receive 10 Year Award
We will also be recognizing two of our Cooperative Observers with the prestigious John
Companius Holm Award this spring This award was named in honor of John Companius
Holm a Lutheran minister who was the first person known to have taken systematic weath-
er observations in the American Colonies (1644-1645) Each year up to 25 Cooperative Ob-
servers are honored with the prestigious Holm award for outstanding public service in the
provision of daily observations in support of the climate and weather programs of the Na-
tional Weather Service The awards will be presented to Dick Brewer of Brandenberg and
Clint Dietz of Plevna in separate ceremonies in May
For more information about the NWS Cooperative Observer Program visit
httpwwwweathergovcoop
15
Community Collaborative Rain Hail and Snow
Network (CoCoRaHS)
by CoCoRaHS Coordinator Vickie Stephenson
What a busy winter we had in south central and southeast Montana with record cold and
snowfall across the area Yes many records were broken this season between cold tempera-
tures and snowfall If you would like to become a part of our Precipitation Reporting Net-
work check out this web site httpwwwcocorahsorg and feel free to contact me
vickiestephensonnoaagov
I wish to thank you all very much for your tireless efforts in measuring our record snow-
fall Billingsrsquo snowfall as of April 6th has measured 1024 inches this season and we are
slowly closing in on our record season of 1035 inches
YES IT REALLY IS TRUE Your data are used every day
No matter how many times we repeat this the question just keeps coming up who cares
about and who uses the observations from CoCoRaHS volunteers It must be hard to fathom
that precipitation data is so useful and that backyard rain gauges have a place of importance
in national and global climate monitoring in the 21st Century But the fact is itrsquos true Your
rainfall reports -- including your reports of ZERO precipitation ndash are very valuable and are
being used EVERY DAY Every morning many organizations pull data from the CoCoRaHS
database at least every hour to get all the latest reports as they come in hoping all CoCoRaHS
reports are submitted right away
Your reports of hail or heavy rain may trigger the National Weather Service (NWS) to issue
severe thunderstorm or flash flood warnings In cases of extreme localized storms your local
report could help save lives
Donrsquot let all this ldquoimportancerdquo frighten you The weight is not all on observers shoulders The
real value comes from having thousands of volunteers reporting from all over the country So
keep up the good work and go out and find more weather enthusiasts to help measure map
and track the amazingly variable patterns of precipitation
A key reason that CoCoRaHS data are so useful is because the rain gauge used by CoCoRaHS
volunteers ndash the 4-inch diameter 1130rdquo capacity clear plastic rain gauge is very good Under
most circumstances this type of gauge performs as well as the official National Weather Ser-
vice Standard Rain Gauge that has been used for over 120 years documenting our nationrsquos cli-
mate Most CoCoRaHS volunteers have found representative locations to mount their gauge to
get very high quality readings The CoCoRaHS gauge if installed and used properly provides
very accurate readings CoCoRaHS volunteers tend to be very interested and very committed
to careful and high-quality observations As a result the data are usually excellent for a wide
range of uses Below are just a few of our many users there are probably many others The
most obvious ones that come to mind are
Weather Forecasters Hydrologists Water management
Researchers Agriculture Climatologists
Insurance Industry Engineering Recreation
16
Are You ldquoWeather-Readyrdquo
by Warning Coordination Meteorologist Tom Frieders amp Forecaster Kurt Hooley
Know the difference
Watch The potential exists for severe weather to occur within the next hours but the exact
location and timing is not known Action can be taken to protect property such as putting
your vehicle in the garage putting away patio furniture etc
Warning Severe weather either is occurring or will be shortly Immediate action should be
taken to protect yourself by going to the lowest portion of a sturdy building or into a clos-
et hallway or room without windows
Know the difference
Funnel Cloud A funnel-shaped cloud extended outward or downward from a thunder-
storm that corresponds to a rotating column of air If the rotation is violent and reaches the
ground the funnel cloud is associated with a tornado
Tornado A violently rotating column of air in contact with the ground that extends from
the base of a thunderstorm to the ground This is often visible as a funnel cloud with swirl-
ing dust or debris near the surface
Severe Thunderstorms produce
Tornadoes
Hail one inch in diameter or larger
Damaging winds in excess of 60 mph
Here are some things you can do to ensure you are Weather-Ready
Know Your Risk Donrsquot leave home without knowing the forecast Check our website each
and every morning
Take Action Have an emergency supply kit This includes a 72 hour supply of food and
water Also develop a plan to ensure family and friends know how they can reach you in
an emergency This plan would include meeting places and alternate ways to communi-
cate in case of an emergency
Be A Force of Nature Inspire others by sharing your preparedness activities with family
and friends
For more information visit our severe weather preparedness website at httpgooglxbljh
17
Information Stop
by Warning Coordination Meteorologist Tom Frieders
Severe Weather Preparedness
httpwwwnwsnoaagovomthunderstorm
Lighting Safety
httpwwwlightningsafetynoaagov
Flood Safety
httpwwwnwsnoaagovfloodsafety
Advanced Hydrologic Prediction Services (Rivers and Lakes)
httpwaterweathergov
Owlie ndash NWS Education
httpswwwweathergovowlie
PLEASE CONTINUE TO FOLLOW US
Stay Informed during Hazardous or
Severe Weather
facebookcomNWSBillings TwittercomNWSBillings
Enjoy your Summer and thanks again for all you do

2
From the Warning Coordination Desk
Submitted by WCM Tom Frieders
Skywarn Spotter Training ndash Itrsquos Fun amp Free
Become a volunteer severe thunderstorm spotter and learn how to identify and re-
port severe weather to your local National Weather Service Office keeping your local
community informed of potentially hazardous weather
Meteorologists rely on trained volunteers to supplement Doppler Radar and Satellite
data Storm spotter reports are an important step in the warning decision process for
our Meteorologists regarding severe thunderstorms
Training will be conducted through May with the full schedule at
httpswwwweathergovbyzspotter_training
How Do You Stay Informed
Here are some options to stay informed on incoming hazardous weather
NOAA Weather Radio This is your direct link to NWS warnings
Specially built receivers will alert you when watches and warnings
are issued for your area and also keep you informed on the latest
forecast 247 Weather Radio receivers can be purchased in most
electronic and many department stores for $30 dollars or less
More information at httpwwwwrhnoaagovbyznwrhomephp
FEMA App Receive National Weather Service Alerts for up to 5 lo-
cations along with safety reminders and tips
More information httpswwwfemagovmobile-app
Red Cross Apps Apps available for all types of emergencies Spe-
cifically for severe weather a Tornado App is available This app
will alert you for both Tornado and Severe Thunderstorm watches
and warnings Check out the wide variety of apps available
More information httpwwwredcrossorgget-helpprepare-for-
emergenciesmobile-apps
Wireless Emergency Alerts If you have a newer smartphone that
is Wireless Emergency Alert Capable you are already signed up
Your phone will alert you for Tornado Warnings Flash Flood
Warnings Amber Alerts or critical Presidential alerts during na-
tional emergencies More information
httpswwwfemagovfrequently-asked-questions-wireless-emergency-alerts
3
2017-2018 Winter Recap
Submitted by Lead ForecasterClimate Program Manager Joe Lester
The 2017-18 winter will be remembered for its abundant snowfall and lack of significant
warm spells both of which resulted in an extended period of snow cover in our region After
a very warm late November (remember the 70s on Thanksgiving) the first half of December
was actually quite mild but the weather pattern turned much colder and snowier before
Christmas By the end of the year we had experienced a significant winter storm and cold
spell Mizpah reached -41 degrees on New Yearrsquos Day
The weather pattern remained favorable for periods of snow and cold throughout January and
February Miles City had its coldest February since records began in 1937 and Sheridan was
coldest since 1936 Billingsrsquo three-month snowfall total was over three feet above normal The
cold and snowy winter can be at least partially attributed to the weak La Nina in the tropical
Pacific Ocean a condition that favors increased storminess across the northern Rockies Also
warmer conditions and less sea ice in the Arctic likely contributed to greater atmospheric
moisture through the winter season
Through April 6th Billingsrsquo total snowfall of 1024 inches ranked 2nd most all-time for an en-
tire season With almost two months yet to go there is potential to approach the record of
1035 inches set in 2013-14
Here are some meteorological winter (Dec-Feb) statistics at our four
main climate stations
4
A Hydrological Outlook
Submitted by Lead ForecasterHydrology Program Manager Todd Chambers
We have a heavy snowpack in the western mountains and near normal in the Bighorns
Does this mean we will have river flooding during this summerrsquos run-off season Rivers and
streams across our area have been carved out over time by heavy run-off seasons and they
have a large capacity to hold run-off from even record snow pack as long as it melts at a
normal pace and the spring precipitation is around normal The key to flooding of our riv-
ers and streams is prolonged heat-waves and extended periods of heavy rainfall Thus we
will have to wait and see how wet and warm our late spring early summer is
Nearly half of our regionrsquos annual precipitation occurs during the spring months and cur-
rent indications are a bit uncertain with generally equal chances of above or below normal
conditions Temperatures are expected to trend toward cooler than normal conditions
Will this lead to a gradual snow melt and limited flooding Stay tuned to our forecasts
Here are the temperature and precipitation outlooks for the months of April May and June
Now is the time to be preparing for flooding if you live or have interests along a waterway
Have a plan to move equipment and livestock to higher ground and safeguard your property
In recent years bank erosion has claimed several structures across our area With an expected
heavy and prolonged run-off we can expect to have more erosion issues this year as well
Look into flood insurance and remember there is a waiting period before it takes effect so
donrsquot wait too long
Monitor observed and forecast river conditions
via the Advanced Hydrologic Prediction Service
httpswaterweathergovahps2indexphp
wfo=byz
5
A Hydrological Outlook contrsquod
Submitted by Lead ForecasterHydrology Program Manager Todd Chambers
There will be plenty of water in rivers and streams for all uses this year La-Nina winters in
the Northern Rockies usually bring heavy snow to the western mountains and this year was
no exception The BeartoothAbsaroka mountains are well above average for snow In fact
the upper Yellowstone river basin exceeded its normal snow water for the season way back
on the 1st
of February which usually occurs in late April
Here is a graph of the accumulated water equivalent of the mountain snowpack in the Upper
Yellowstone Basin courtesy of the Natural Resources and Conservation Service Note this sea-
sons trends (red line) have remained above the median (black line) throughout the season
Below is the percentage of normal Snow Water Equivalent (SWE) mapped out for all basins of
Montana and Wyoming noting the above normal conditions for most of the region
6
Much of this precipitation fell as snow over the winter though a few rainfreezing rain events
did make an appearance Cold temperatures to go along with the precipitation have kept the
snow around over areas east of Billings through late March which is unusual This late snow-
pack lead to concerns about snow melt flooding and ice jams But temperatures have cooper-
ated so far resulting in a moderate melt rate helping to ease those concerns Some areas have
seen standing water in low lying areas and clogged culverts have pushed water over some
roads but overall impacts have been minor thus far Ice Jams could have been a significant
problem but ice jam flooding was minor as the rivers opened up
Yellowtail Dam has seen record releases into the Bighorn River so
far this winter as residual water from last yearrsquos heavy precipita-
tion in Wyoming continues to work through the Bighorn River sys-
tem Early April releases are at 6500 cubic feet per second (cfs)
compared to a normal release of 2900 cfs Officials expect addi-
tional release increases this spring to make room for this seasons
run-off so another high flow year can be expected Whether it
reaches anywhere near last yearrsquos prolonged record releases will
depend on spring precipitation over central Wyoming
A Hydrological Outlookcontrsquod
Submitted by Lead ForecasterHydrology Program Manager Todd Chambers
For the lower elevations east of the Divide it has been a wet winter as well with most loca-
tions seeing more than 130 percent of normal precipitation and some areas over 200 per-
cent of normal Only areas around the Bighorn and Pryor mountains and from Miles City to
Baker saw near to below average precipitation
7
2018 Summer Outlook
Submitted by Lead Forecaster amp Climate Program Manager Joe Lester
How did the 2017-18 Winter Outlook verify
The 2017-18 winter has come to an end but do you remember what the winter outlook
showed last fall The Climate Prediction Center examines its accuracy after each season Be-
low is how the temperature outlook verified with forecast temps on the left and observed on
the right Not too bad for the northern Rockies and high plains Please see this article for
more information httpswwwclimategovnews-featuresblogsensometeorological-winter-over-
howrsquod-we-do
With the passage of the spring equinox we are rapidly shifting gears toward the warm sea-
son Climate signals are not real clear for the summer months (JuneJulyAugust) when pre-
cipitation is driven by thunderstorm activity rather than dynamic weather systems Though
recent summers have trended warmer in general The latest June-August outlook from the
Climate Prediction Center shows a slight hedging toward warmer and drier than normal in
our region
8
Spring Data Tables
Spring Averages
Meteorological spring is classified as the months of March April and May Here are the aver-
age temperatures and precipitation for the Billings Airport the Miles City Airport and the
Sheridan Airport for the spring season Averages are calculated using a 30-year period of rec-
ord 1981 to 2010 All temperatures are in degrees Fahrenheit and all precipitation amounts
are in inches
ldquoIn the Spring I have counted 136 different kinds of weather inside of 24 hoursrdquo
Mark Twain
Sheridan
Date High Low Average Precipitation
31 ndash 331 484 220 352 098
41 ndash 430 574 298 436 160
51 ndash 531 667 382 525 235
31 ndash 531 578 314 441 493
Billings
Date High Low Average Precipitation Snowfall
31 ndash 331 486 269 377 106 102
41 ndash 430 576 347 462 166 83
51 ndash 531 675 436 556 218 20
31 ndash 531 574 351 463 490 205
Miles City
Date High Low Average Precipitation
31 ndash 331 465 228 347 060
41 ndash 430 588 332 460 137
51 ndash 531 686 431 559 218
31 ndash 531 584 342 463 415
9
Summer Data Tables
Summer Averages
Meteorological summer is classified as the months of June July and August Here are the av-
erage temperatures and precipitation for the Billings Airport the Miles City Airport and the
Sheridan Airport for the summer season Averages are calculated using a 30-year period of
record 1981 to 2010 All temperatures are in degrees Fahrenheit and all precipitation
amounts are in inches
Last Hard Freeze Freeze and Frost Dates in the SpringSummer
Many people will start planting their crops and gardens over the next few months To keep
crops and plants protected from the cold it is important to know when the average last hard
freeze freeze and frost typically occur in the springsummer It is also important to know the
dates of the latest hard freeze freeze and frost The following are the average last hard
freeze freeze and frost dates and the latest hard freeze freeze and frost dates for Billings
Miles City and Sheridan The hard freeze temperature is based on 28 degrees Fahrenheit the
freezing temperature is based on 32 degrees Fahrenheit and the frost temperature is based on
36 degrees Fahrenheit Averages are based on a 30 year period of record 1981 to 2010
Recordkeeping began at the Billings Airport in 1934 at the Miles City Airport in 1937 and at
the Sheridan Airport in 1907
Billings
Date High Low Average Precip
61 ndash 630 772 521 647 212
71 ndash 731 868 588 728 132
81 ndash 831 857 573 715 075
61 ndash 831 833 561 697 419
Miles City
Date High Low Average Precip
61 ndash 630 786 526 656 251
71 ndash 731 883 595 739 164
81 ndash 831 872 580 726 091
61 ndash 831 852 578 715 506
Sheridan
Date High Low Average Precip
61 ndash 630 767 464 616 212
71 ndash 731 871 530 700 118
81 ndash 831 863 516 690 072
61 ndash 831 833 514 674 402
City
Average
Last Hard
Freeze
Latest Hard
Freeze on
Record
Average
Last
Freeze
Latest
Freeze on
Record
Average
Last
Frost
Latest
Frost on
Record
Billings Apr 23 May 28 May 7 Jun 13 May 18 Jun 13
Miles City Apr 27 May 28 May 9 Jun 8 May 18 Jun 18
Sheridan May 8 Jun 3 May 19 Jun 24 Jun 5 Jun 30
10
From the Fire Weather Desk
by Lead Forecaster Incident Meteorologist Dan Borsum
Where is the smoke coming from
Have you ever wondered about where the smoke that you are breathing is coming from Or
maybe what is going on with a fire in our area or somewhere else in the country There is a
convenient location on the internet to go to for information The media and other local agen-
cies may provide coverage and some infor-
mation but InciWeb (httpsinciwebnwcggov)
has all the official information that land manage-
ment agencies have shared about fires under
their jurisdiction You can find fire containment
current evacuation information the latest maps
pictures and more Some smaller fires like those
handled by a town or county fire department
may not be available If a fire is recently started
it may take some time to show up on InciWeb
This site has undergone a recent change that is
more user-friendly With a new map interface it
is much easier to find fires around area and
across the country Here is a sample image of the
interface
So the next time there is smoke in the air and you are curious where it is coming from you
will know where to find out Have a safe summer
11
State of the Science The New Satellite Era
by General ForecasterActing Science amp Operations Officer Ryan Walsh
Our Billings forecast area encompasses portions of southeastern Montana and northeastern
Wyoming This vast landscape has significantly varying terrain and climate which can make
forecasting extremely challenging The primary tools we use to determine current conditions
across our forecast area are radar satellite and surface observations from automated weather
stations
Radar is primarily used to detect precipitation such as in a thunderstorm but is limited in
range and canrsquot adequately cover our entire forecast area Weather observations can give us a
sense of the temperature humidity and wind speed but are limited to only a handful of loca-
tions around the area and only provide surface conditions Satellite imagery is the observa-
tional piece that can give us the most information about the state of our atmosphere across
our entire area
Our legacy satellites provided new information every 15 to 30 minutes and were fairly coarse
in resolution Low resolution and long delays between images made it difficult to use satellite
for timely detections of weather phenomenon such as wildfires or intensifying thunder-
storms In this part of the country where weather can change rapidly and vary significantly
from one location to another we needed some better tools to help us observe the atmosphere
to improve our forecast and warning decisions
To achieve that goal NOAA
launched a new generation of sat-
ellites called GOES-16 and GOES-
17 GOES-16 was launched last
year and is primarily responsible
for monitoring the eastern half of
the country GOES-17 was
launched this March and is cur-
rently undergoing testing and cali-
bration but will become opera-
tional over the western US later
this year
What does this mean for us How
will this improve forecast and
warning decisions
The technological improvement of this new generation of satellites is quite astounding the
equivalent of upgrading a first generation camera phone for this yearrsquos latest Apple or Sam-
sung product These satellites take visible and infrared images detect atmospheric moisture
lightning and much more all with significantly improved resolution compared to their prede-
cessors
12
State of the Science The New Satellite Era
by General Forecaster Ryan Walsh
The new GOES series is able to provide unprecedented detail (as seen below) which will al-
low forecasters to determine differences between cloud types composition assess small
scale features which will improve forecasts across the board
Our new satellite images will actually update quicker than our radar in many cases While
satellite cannot tell us the same type of information our radar tells us about thunderstorms
it will provide us basic information about structure and storm height that can help us better
predict severe thunderstorms especially in areas of poor radar coverage such as eastern
Montana and Wyoming
The newest GOES imagery resolution is so improved that we can now make out extremely
small scale details in both the clouds and land surface New images are sent every 5 minutes
and we have the capability to increase that to every 30 seconds during times of extreme
weather The image below is an example of how the new GOES satellites can detect detailed
hot-spots from wildfires allowing us to provide critical weather updates to resources fighting
those fires Note the wildfires show up as a bright pink on the satellite
13
State of the Science The New Satellite Era
by General Forecaster Ryan Walsh
Pictured below is an example of how our new satellites can detect the features of a
severe thunderstorm Looking down from above the thunderstorm the satellite is
detecting a bubbling crunchy looking dome This is called an overshooting top and
it indicates the storm has a significant column of rising air known as an updraft
The shape and notch appearance indicates a very organized thunderstorm with a
rotating updraft which could support hail or possibly tornadoes A forecaster could
make a warning decision earlier in many cases with the addition of this timely and
extremely detailed satellite information
These were just a few examples of the many ways in which the new GOES satellites
will improve our forecasts in the future The launch of these satellites has ushered
in a New Satellite Era which will change the way we observe the atmosphere across
all meteorological disciplines for years to come
14
COOP Corner
(Cooperative Observer Program)
by Observing Program Leader Larry Dooley
2018 Cooperative Observer Length of Service Awards
Recognition for many years of service and for special or sustained achievements is part of
the culture in a successful organization Awards are a time honored tangible method of
showing appreciation for many years of dedication The awards may be given to individual
observers families and institutions for length of service or in recognition of one or several
significant achievements The awards recognition program is the most visible way to honor
sustained volunteer service and when combined with constructive feedback is essential for
the retention of observers
This year at the National Weather Service forecast office here in Billings we have several
dedicated Cooperative Observers being recognized and will receive awards
John Jonutis of Mizpah will receive a 60 Year Award
Willis and Nadine Busenitz of Busby will receive 45 Year Awards
Dan Becker of Colstrip will receive 40 Year Award
Jacquelyn Hudecek from Springdale will receive 30 Year Award
Jim Goodwin from Ashland will receive 25 Year Award
Joann Ferguson from Livingston will receive 25 Year Award
Bill and Donna Linger from Molt will receive 25 Year Awards
Mary Ann Johnson from Vananda will receive Year Award
Elsie Shellenberger from Reedpoint will receive 20 Year Award
Vicky Schwartz from Big Timber will receive 20 Year Award
Judy A Rue from McLeod will receive 20 Year Award
Susan E Wood from Lavina will receive 15 Year Award
Marvin Crusch at Mystic Lake will receive 10 Year Award
We will also be recognizing two of our Cooperative Observers with the prestigious John
Companius Holm Award this spring This award was named in honor of John Companius
Holm a Lutheran minister who was the first person known to have taken systematic weath-
er observations in the American Colonies (1644-1645) Each year up to 25 Cooperative Ob-
servers are honored with the prestigious Holm award for outstanding public service in the
provision of daily observations in support of the climate and weather programs of the Na-
tional Weather Service The awards will be presented to Dick Brewer of Brandenberg and
Clint Dietz of Plevna in separate ceremonies in May
For more information about the NWS Cooperative Observer Program visit
httpwwwweathergovcoop
15
Community Collaborative Rain Hail and Snow
Network (CoCoRaHS)
by CoCoRaHS Coordinator Vickie Stephenson
What a busy winter we had in south central and southeast Montana with record cold and
snowfall across the area Yes many records were broken this season between cold tempera-
tures and snowfall If you would like to become a part of our Precipitation Reporting Net-
work check out this web site httpwwwcocorahsorg and feel free to contact me
vickiestephensonnoaagov
I wish to thank you all very much for your tireless efforts in measuring our record snow-
fall Billingsrsquo snowfall as of April 6th has measured 1024 inches this season and we are
slowly closing in on our record season of 1035 inches
YES IT REALLY IS TRUE Your data are used every day
No matter how many times we repeat this the question just keeps coming up who cares
about and who uses the observations from CoCoRaHS volunteers It must be hard to fathom
that precipitation data is so useful and that backyard rain gauges have a place of importance
in national and global climate monitoring in the 21st Century But the fact is itrsquos true Your
rainfall reports -- including your reports of ZERO precipitation ndash are very valuable and are
being used EVERY DAY Every morning many organizations pull data from the CoCoRaHS
database at least every hour to get all the latest reports as they come in hoping all CoCoRaHS
reports are submitted right away
Your reports of hail or heavy rain may trigger the National Weather Service (NWS) to issue
severe thunderstorm or flash flood warnings In cases of extreme localized storms your local
report could help save lives
Donrsquot let all this ldquoimportancerdquo frighten you The weight is not all on observers shoulders The
real value comes from having thousands of volunteers reporting from all over the country So
keep up the good work and go out and find more weather enthusiasts to help measure map
and track the amazingly variable patterns of precipitation
A key reason that CoCoRaHS data are so useful is because the rain gauge used by CoCoRaHS
volunteers ndash the 4-inch diameter 1130rdquo capacity clear plastic rain gauge is very good Under
most circumstances this type of gauge performs as well as the official National Weather Ser-
vice Standard Rain Gauge that has been used for over 120 years documenting our nationrsquos cli-
mate Most CoCoRaHS volunteers have found representative locations to mount their gauge to
get very high quality readings The CoCoRaHS gauge if installed and used properly provides
very accurate readings CoCoRaHS volunteers tend to be very interested and very committed
to careful and high-quality observations As a result the data are usually excellent for a wide
range of uses Below are just a few of our many users there are probably many others The
most obvious ones that come to mind are
Weather Forecasters Hydrologists Water management
Researchers Agriculture Climatologists
Insurance Industry Engineering Recreation
16
Are You ldquoWeather-Readyrdquo
by Warning Coordination Meteorologist Tom Frieders amp Forecaster Kurt Hooley
Know the difference
Watch The potential exists for severe weather to occur within the next hours but the exact
location and timing is not known Action can be taken to protect property such as putting
your vehicle in the garage putting away patio furniture etc
Warning Severe weather either is occurring or will be shortly Immediate action should be
taken to protect yourself by going to the lowest portion of a sturdy building or into a clos-
et hallway or room without windows
Know the difference
Funnel Cloud A funnel-shaped cloud extended outward or downward from a thunder-
storm that corresponds to a rotating column of air If the rotation is violent and reaches the
ground the funnel cloud is associated with a tornado
Tornado A violently rotating column of air in contact with the ground that extends from
the base of a thunderstorm to the ground This is often visible as a funnel cloud with swirl-
ing dust or debris near the surface
Severe Thunderstorms produce
Tornadoes
Hail one inch in diameter or larger
Damaging winds in excess of 60 mph
Here are some things you can do to ensure you are Weather-Ready
Know Your Risk Donrsquot leave home without knowing the forecast Check our website each
and every morning
Take Action Have an emergency supply kit This includes a 72 hour supply of food and
water Also develop a plan to ensure family and friends know how they can reach you in
an emergency This plan would include meeting places and alternate ways to communi-
cate in case of an emergency
Be A Force of Nature Inspire others by sharing your preparedness activities with family
and friends
For more information visit our severe weather preparedness website at httpgooglxbljh
17
Information Stop
by Warning Coordination Meteorologist Tom Frieders
Severe Weather Preparedness
httpwwwnwsnoaagovomthunderstorm
Lighting Safety
httpwwwlightningsafetynoaagov
Flood Safety
httpwwwnwsnoaagovfloodsafety
Advanced Hydrologic Prediction Services (Rivers and Lakes)
httpwaterweathergov
Owlie ndash NWS Education
httpswwwweathergovowlie
PLEASE CONTINUE TO FOLLOW US
Stay Informed during Hazardous or
Severe Weather
facebookcomNWSBillings TwittercomNWSBillings
Enjoy your Summer and thanks again for all you do
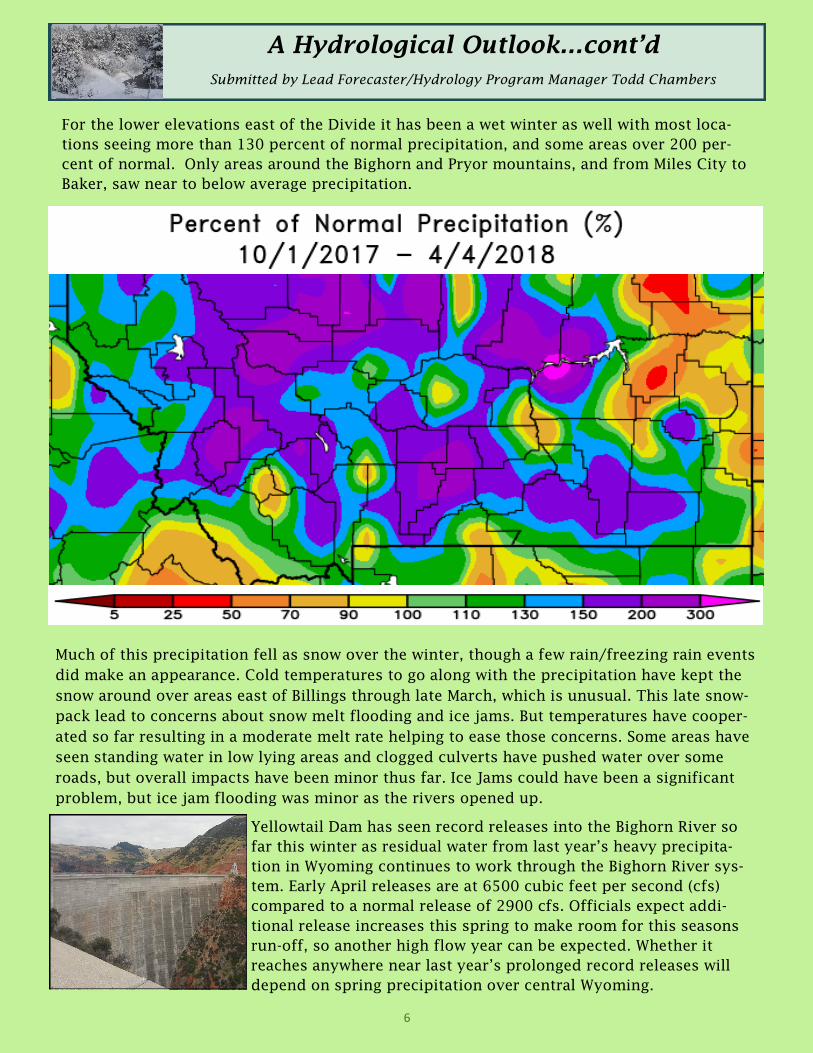
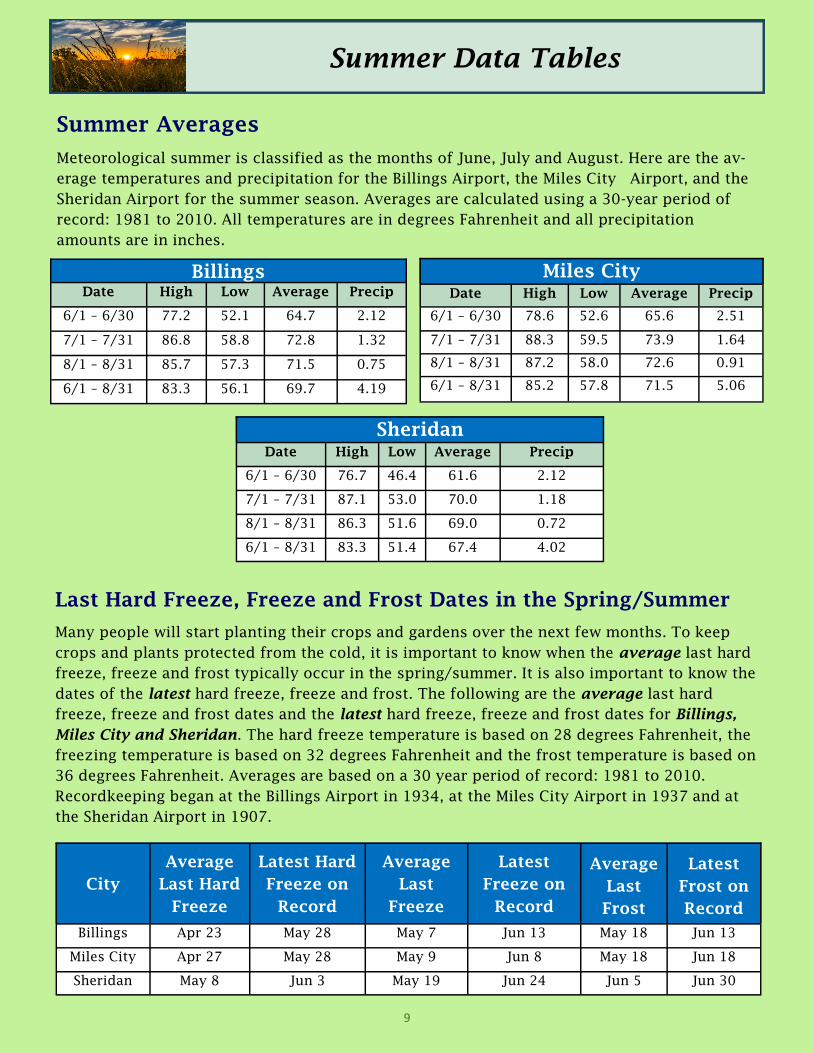
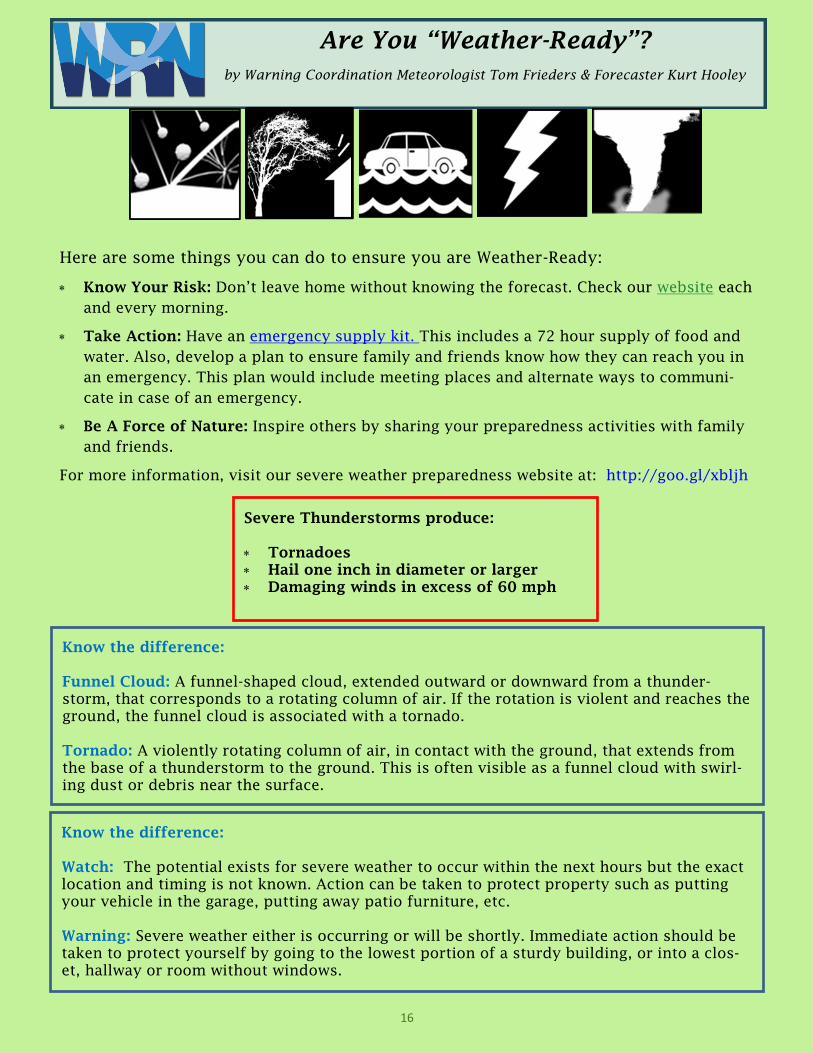