Embed Size (px)
Citation preview
Slide 1
Jetix Europe N.V.Financial Results
For the six months ended March 31, 2008
May 15, 2008

Slide 2
Paul TaylorChief Executive Officer
Operating Review
Slide 3
Jetix Europe
Channels broadcasting via 15 feeds to 58 countries in 19 languages
Reach over 52 million households across Europe and the Middle East
Three operating divisions :
Ð Channels and Online
Ð Programme Distribution
Ð Consumer Products
Slide 4
Strategic Developments
New programming team commissions first shows
Extending programming relationship with Disney into live-action
Investment in digital leading to summer re-launch of Jetix websites
Close to finalising major new sales initiative with Disney
Advertising growth maintained despite difficult economic environment
Building on our position as one of Europe’s leading kids entertainment companies
Slide 5
Channels and Online
Subscribers grew by 4% to 52.3 million households
Bulgarian language channel launched
New long-term distribution agreement with Canalsat in France
Advertising revenue increased in most markets
Investing in a major re-launch of Jetix branded websites
New deals with online and mobile partners
Broadcasting in 58 countries via 15 channel feeds in 19 languages
Slide 6
Programme Distribution
Power Rangers continues to sell well
Second series of Pucca supplied to US
Two new series commissioned
56 new episodes delivered
Programme pipeline of 120 episodes
Library of approx. 6,000 episodes

Slide 7
Consumer Products
Power Rangers biggest selling property
New magazine launched in Turkey
Pucca success continues, notably in France
Major home entertainment deal for library product
Consumer products rights secured on two new series

Slide 8
Dene StrattonChief Financial Officer
Financial Review
Slide 9
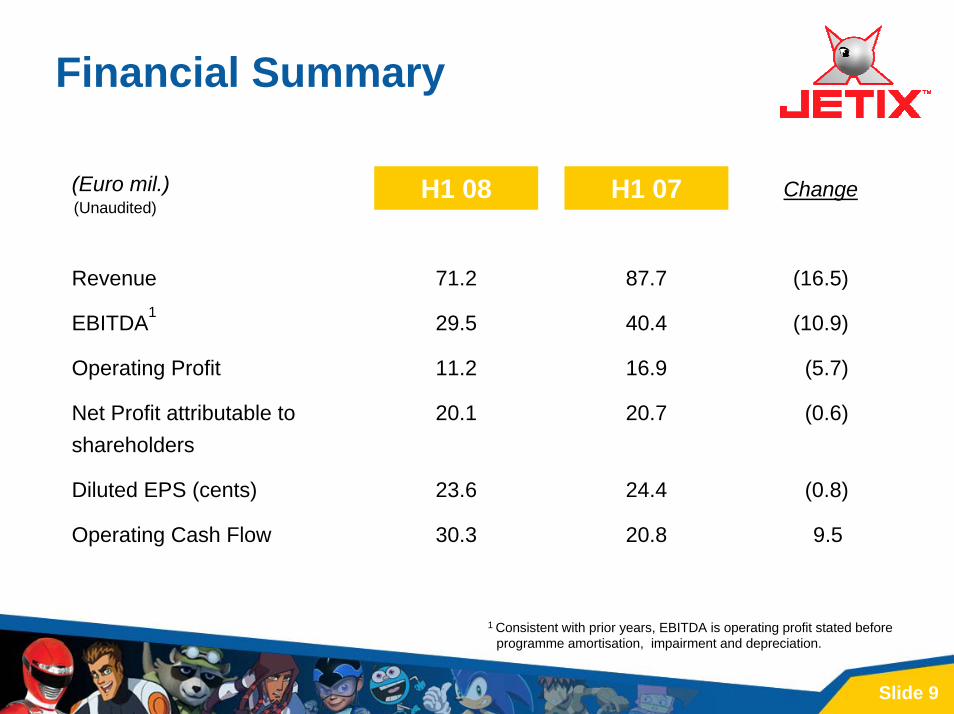
Revenue
EBITDA1
Operating Profit
Net Profit attributable to shareholders
Diluted EPS (cents)
Operating Cash Flow
H1 08 H1 07
71.2
29.5
11.2
20.1
23.6
30.3
87.7
40.4
16.9
20.7
24.4
20.8
Change
(16.5)
(10.9)
(5.7)
(0.6)
(0.8)
9.5
(Euro mil.)(Unaudited)
1 Consistent with prior years, EBITDA is operating profit stated before programme amortisation, impairment and depreciation.
Financial Summary
Slide 10
Channels and Online1
Financial Performance Overview
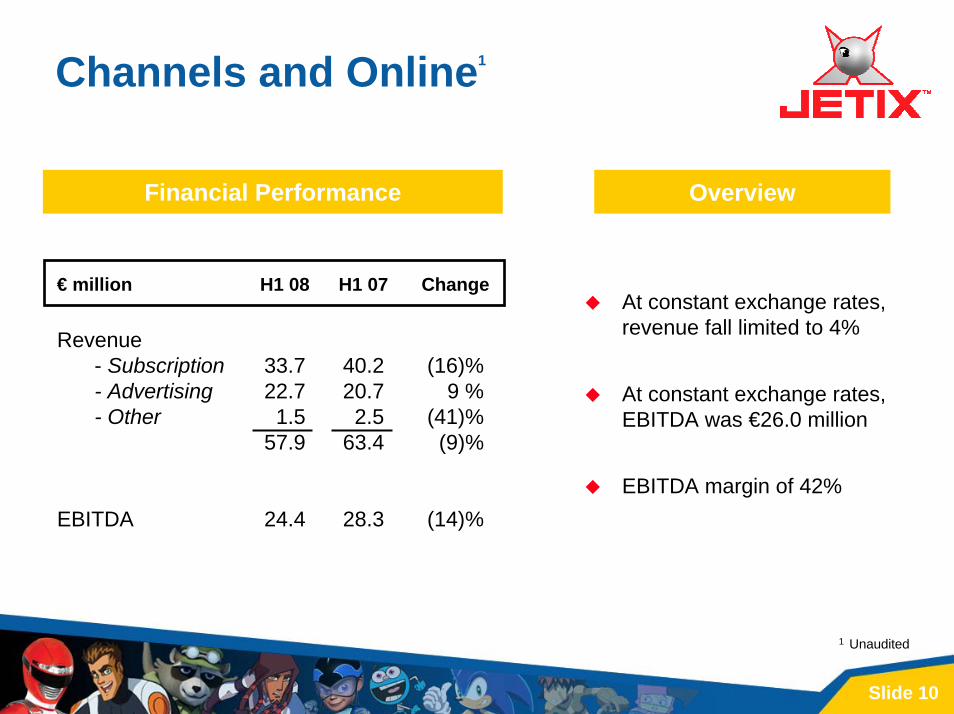
H1 07H1 08At constant exchange rates, revenue fall limited to 4%
At constant exchange rates, EBITDA was €26.0 million
EBITDA margin of 42%
1 Unaudited
Change€ million
Revenue- Subscription- Advertising- Other
EBITDA
33.722.71.5
57.9
24.4
40.220.72.5
63.4
28.3
(16)%9 %
(41)%(9)%
(14)%
Slide 11
Financial Performance Overview
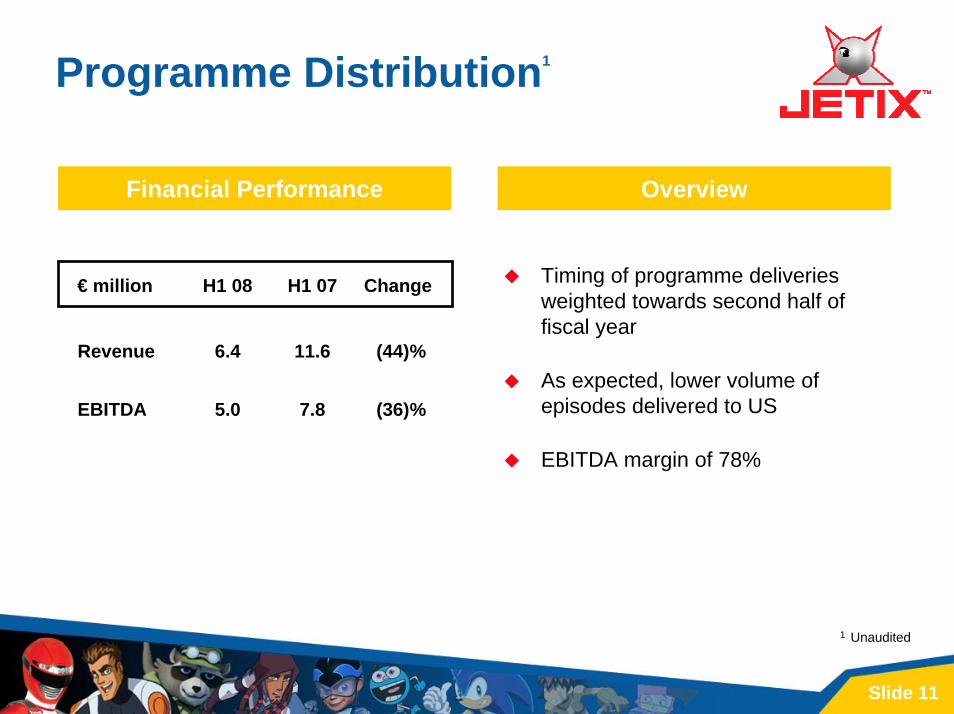
Timing of programme deliveries weighted towards second half of fiscal year
As expected, lower volume of episodes delivered to US
EBITDA margin of 78%
Programme Distribution1
1 Unaudited
Revenue
EBITDA
H1 07H1 08
6.4 11.6 (44)%
7.85.0 (36)%
Change€ million
Slide 12
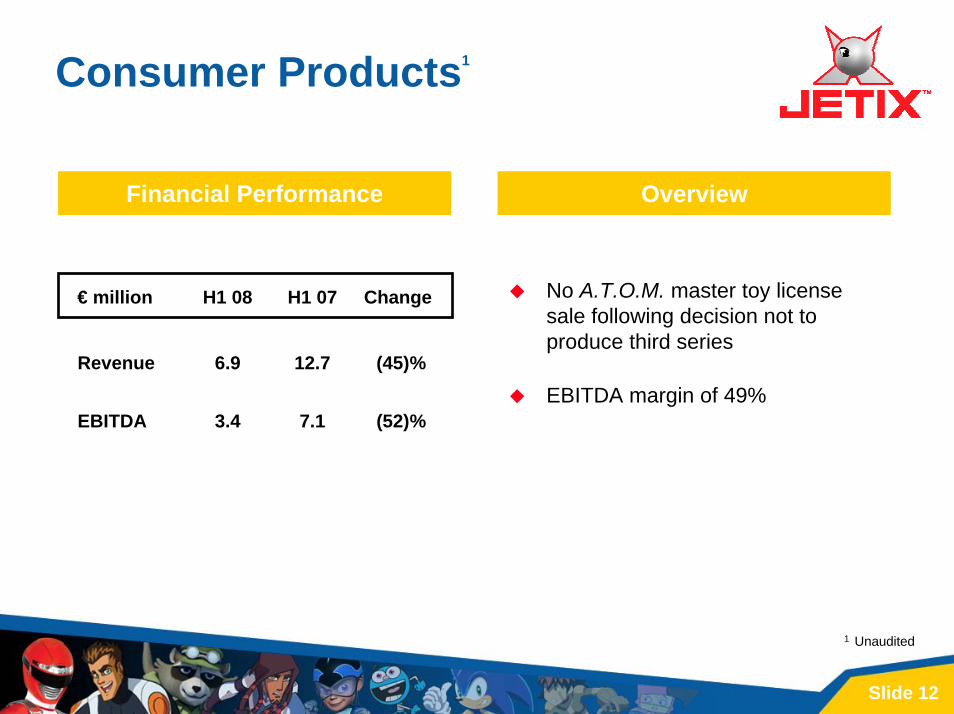
Consumer Products1
Financial Performance Overview
No A.T.O.M. master toy license sale following decision not to produce third series
EBITDA margin of 49%
1 Unaudited
Revenue
EBITDA
H1 07H1 08
6.9 12.7 (45)%
7.13.4 (52)%
Change€ million
Slide 13
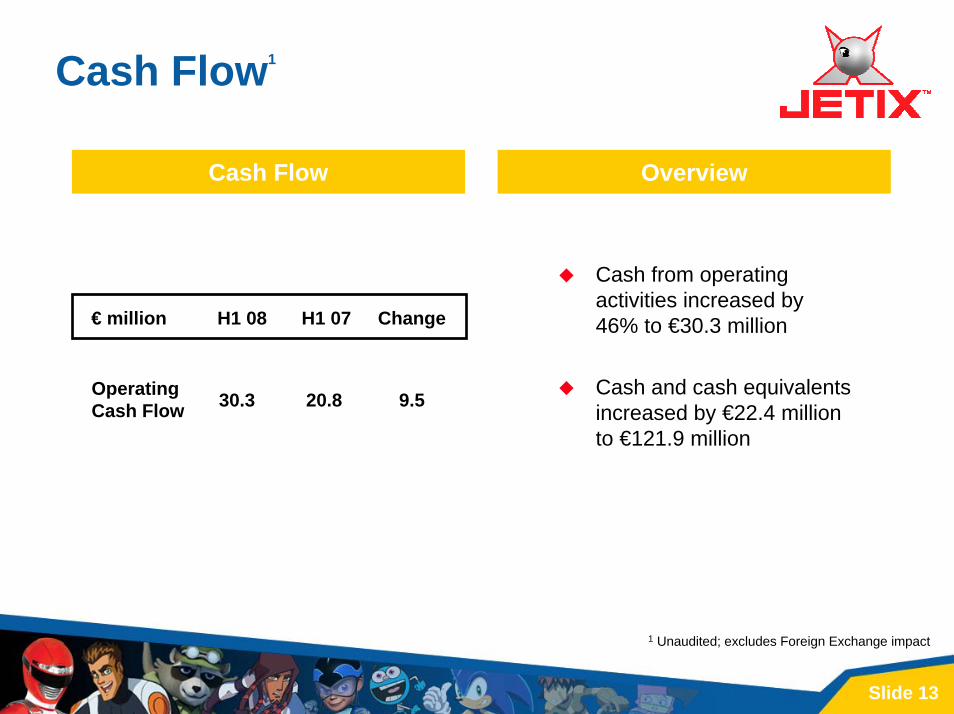
Cash Flow1
1 Unaudited; excludes Foreign Exchange impact
Cash from operating activities increased by 46% to €30.3 million
Cash and cash equivalents increased by €22.4 million to €121.9 million
Cash Flow Overview
Operating Cash Flow
H1 07H1 08
30.3 20.8 9.5
Change€ million
Slide 14
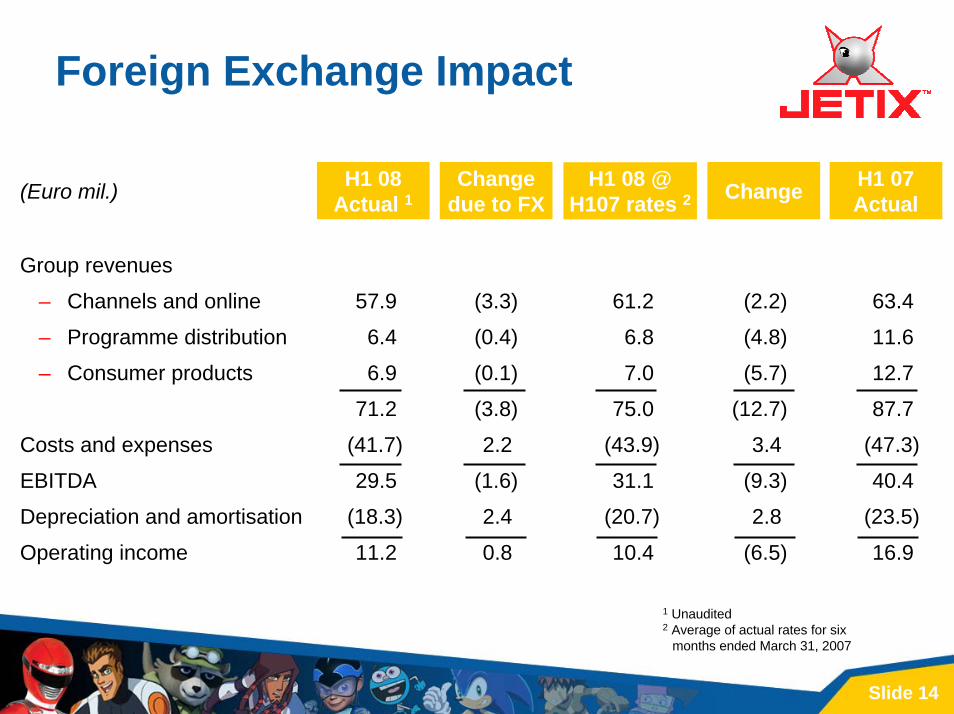
Foreign Exchange Impact
H1 08 Actual 1
Group revenues
– Channels and online
– Programme distribution
– Consumer products
Costs and expenses
EBITDA
Depreciation and amortisation
Operating income
(Euro mil.) Change due to FX
H1 08 @ H107 rates 2 Change H1 07
Actual
57.9
6.4
6.9
71.2
(41.7)
29.5
(18.3)
11.2
(3.3)
(0.4)
(0.1)
(3.8)
2.2
(1.6)
2.4
0.8
61.2
6.8
7.0
75.0
(43.9)
31.1
(20.7)
10.4
(2.2)
(4.8)
(5.7)
(12.7)
3.4
(9.3)
2.8
(6.5)
63.4
11.6
12.7
87.7
(47.3)
40.4
(23.5)
16.9
1 Unaudited2 Average of actual rates for six
months ended March 31, 2007
Slide 15
Summary
Financial performance affected by changes in a limited number of specific deals
At constant exchange rates, maintaining fiscal 2008 guidance
Close to extending distribution deal with Disney to include channels and new media
Developing live-action programming with Disney
New Jetix programming commissions
Investing in digital division

Slide 16
Q and A
Slide 17
Appendix
Slide 18
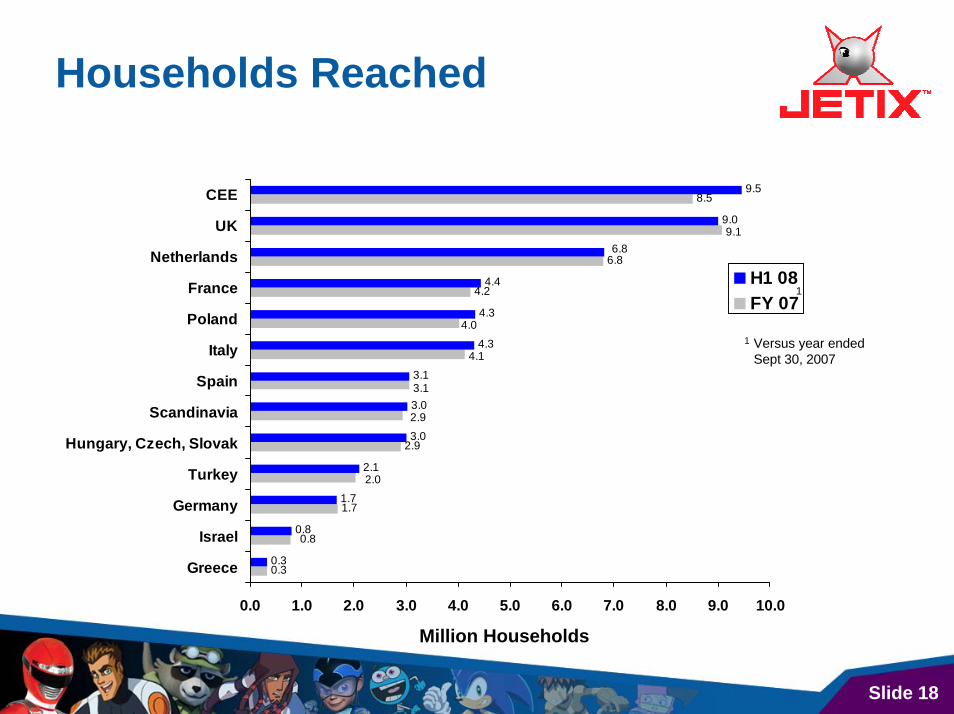
Households Reached
Million Households
1 Versus year ended Sept 30, 2007
1
0.3
1.7
2.9
4.2
6.8
8.5
0.3
0.8
2.1
3.0
3.0
4.3
4.3
4.4
9.5
0.8
2.0
3.1
4.1
4.0
9.1
2.9
1.7
9.0
3.1
6.8
0.0 1.0 2.0 3.0 4.0 5.0 6.0 7.0 8.0 9.0 10.0
Greece
Israel
Germany
Turkey
Hungary, Czech, Slovak
Scandinavia
Spain
Italy
Poland
France
Netherlands
UK
CEE
H1 08FY 07